Distinct ipRGC subpopulations mediate light’s acute and circadian effects on body temperature and sleep
- Johns Hopkins University, United States
- Northwestern University, United States
Figures
Figure 1 with 2 supplements
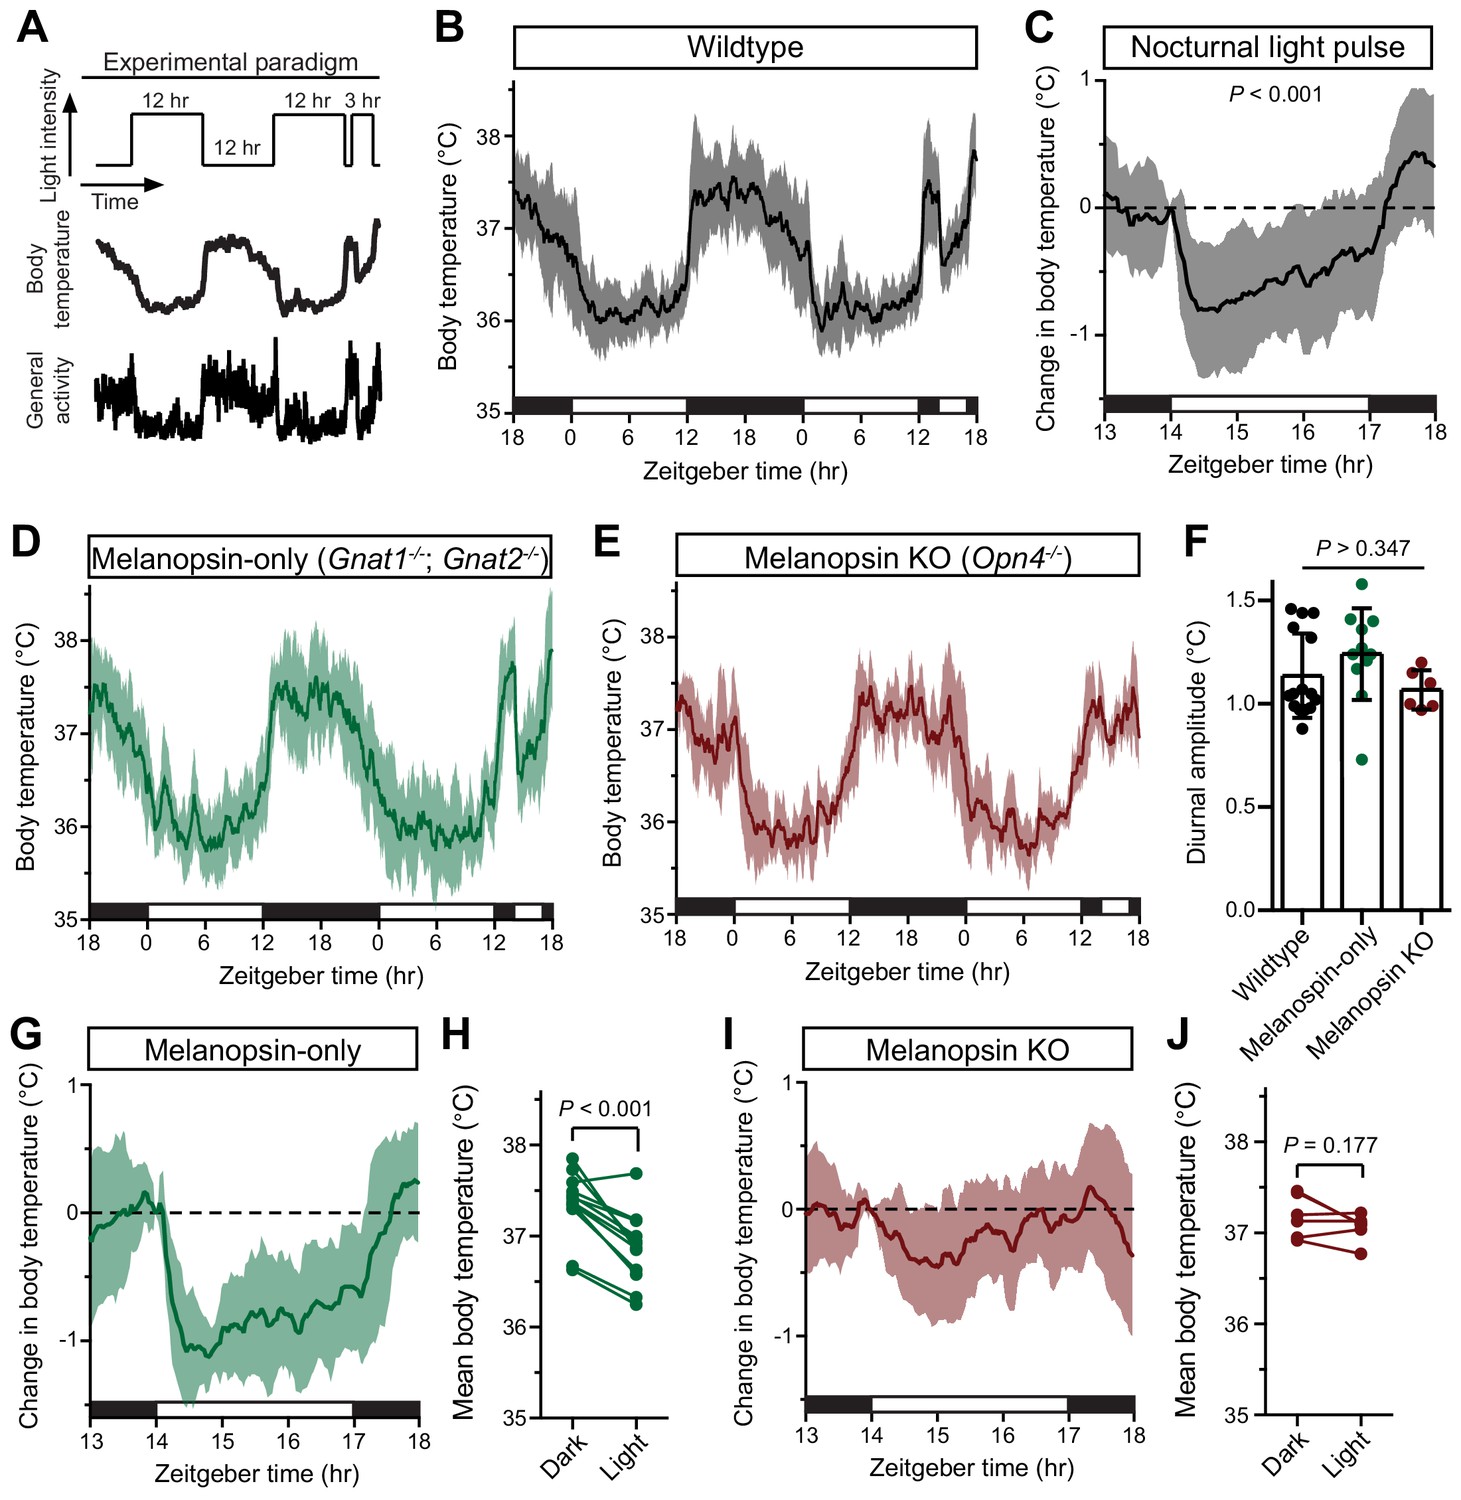
Melanopsin mediates the acute effects of light on body temperature.
(A) Paradigm to measure body temperature continuously in a 12:12 light dark cycle with a 3 hr light pulse at ZT14. (B) 48 hr of continuous body temperature monitoring in wildtype male mice (n = 13) (C) Relative body temperature in WT during light pulse, compared to baseline (ZT14). p<0.001, paired t-test of mean temperature compared to previous night. (D) Melanopsin-only mice (Gnat1-/-; Gnat2-/-, n = 11) and (E) melanopsin knockout (Opn4-/-, n = 6) 48 hr diurnal body temperature. (F) Diurnal body temperature amplitude in the three groups. p>0.347 for effect of group by one-way ANOVA. (G) Body temperature in melanopsin-only during light pulse, relative to baseline (ZT14). (H) Paired comparison of mean body temperature during light pulse compared to previous night. p<0.001 by paired t-test. (I) Body temperature in melanopsin knockout during light pulse, relative to baseline (ZT14). (J) Paired comparison of mean body temperature during light pulse compared to previous night. All summarized data are mean ± standard deviation.
-
Figure 1—source data 1
Temperature data for Figure 1.
- https://doi.org/10.7554/eLife.44358.006
Figure 1—figure supplement 1
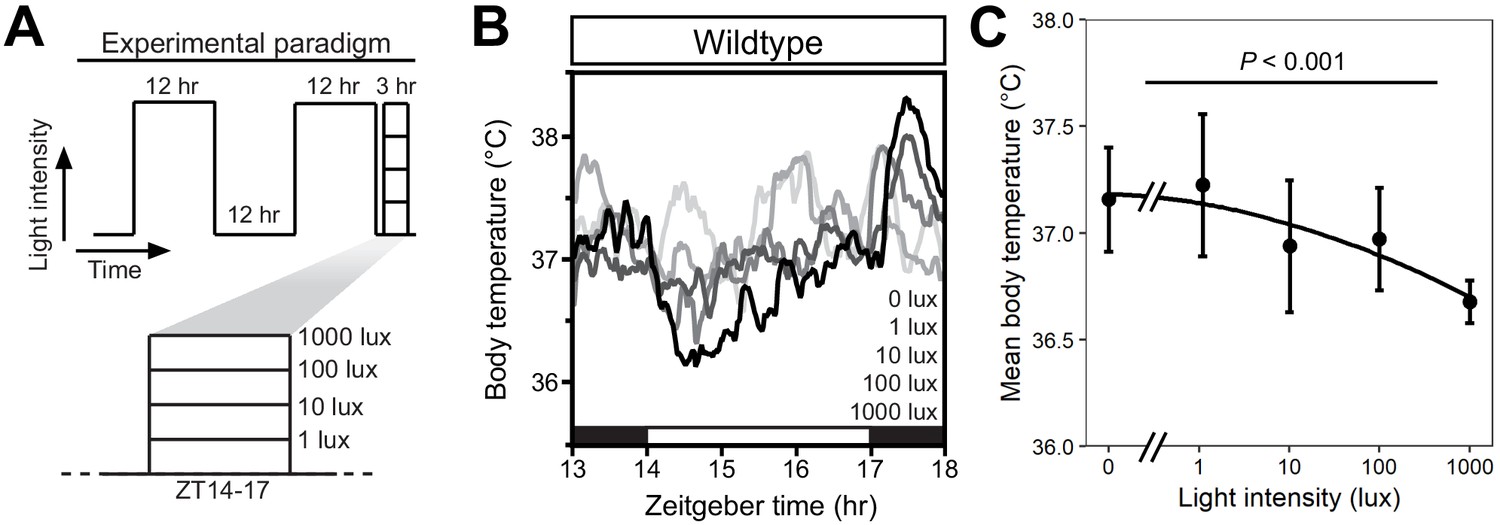
Intensity-dependent decrease in core body temperature during a nocturnal light pulse.
(A) Experimental paradigm consisting of a 12 hr/12 hr light/dark cycle with a single 3 hr light pulse starting at Zeitgeber time (ZT) 14 (i.e. 2 hr after lights-off). Each experimental night, a light pulse was given at a specific environmental light intensity ranging from 1 to 1000 lux in log10 increments. (B) Mean body temperature for wildtype mice (n = 4) that were administered a light pulse at ZT14 of varying intensity (shown as shades of gray). Robust thermoregulation by light only occurs at bright intensities. Black and white bars on the x axis refer to time of lights-off and lights-on. (C) Quantification of the mean body temperature during the 3 hr light pulse for the wildtype mice in B) (n = 4, mean ± SD) fit with a smooth regression curve (LOESS). There is a statistically significant effect of light intensity on body temperature (p<0.001), as determined by a linear mixed model with fixed effect of light intensity and random effect of mouse.
-
Figure 1—figure supplement 1—source data 1
Temperature data for Figure 1—figure supplement 1.
- https://doi.org/10.7554/eLife.44358.007
Figure 1—figure supplement 2

Melanopsin-dependence of light-induced body temperature changes.
Relative change from ZT14 in mean body temperature in Wildtype (n = 15), Melanopsin-only (Gnat1-/-;Gnat2-/-, n = 11) or Melanopsin KO (Opn4-/-, n = 6) for the 3 hr during the light pulse (Light) or during the previous control night (Ctrl; ZT14–17). Columns and error bars represent mean ± standard deviation and dots represent individual animals. P values from linear mixed model with fixed effects of genotype and light exposure and a random effect of mouse.
Figure 2 with 1 supplement
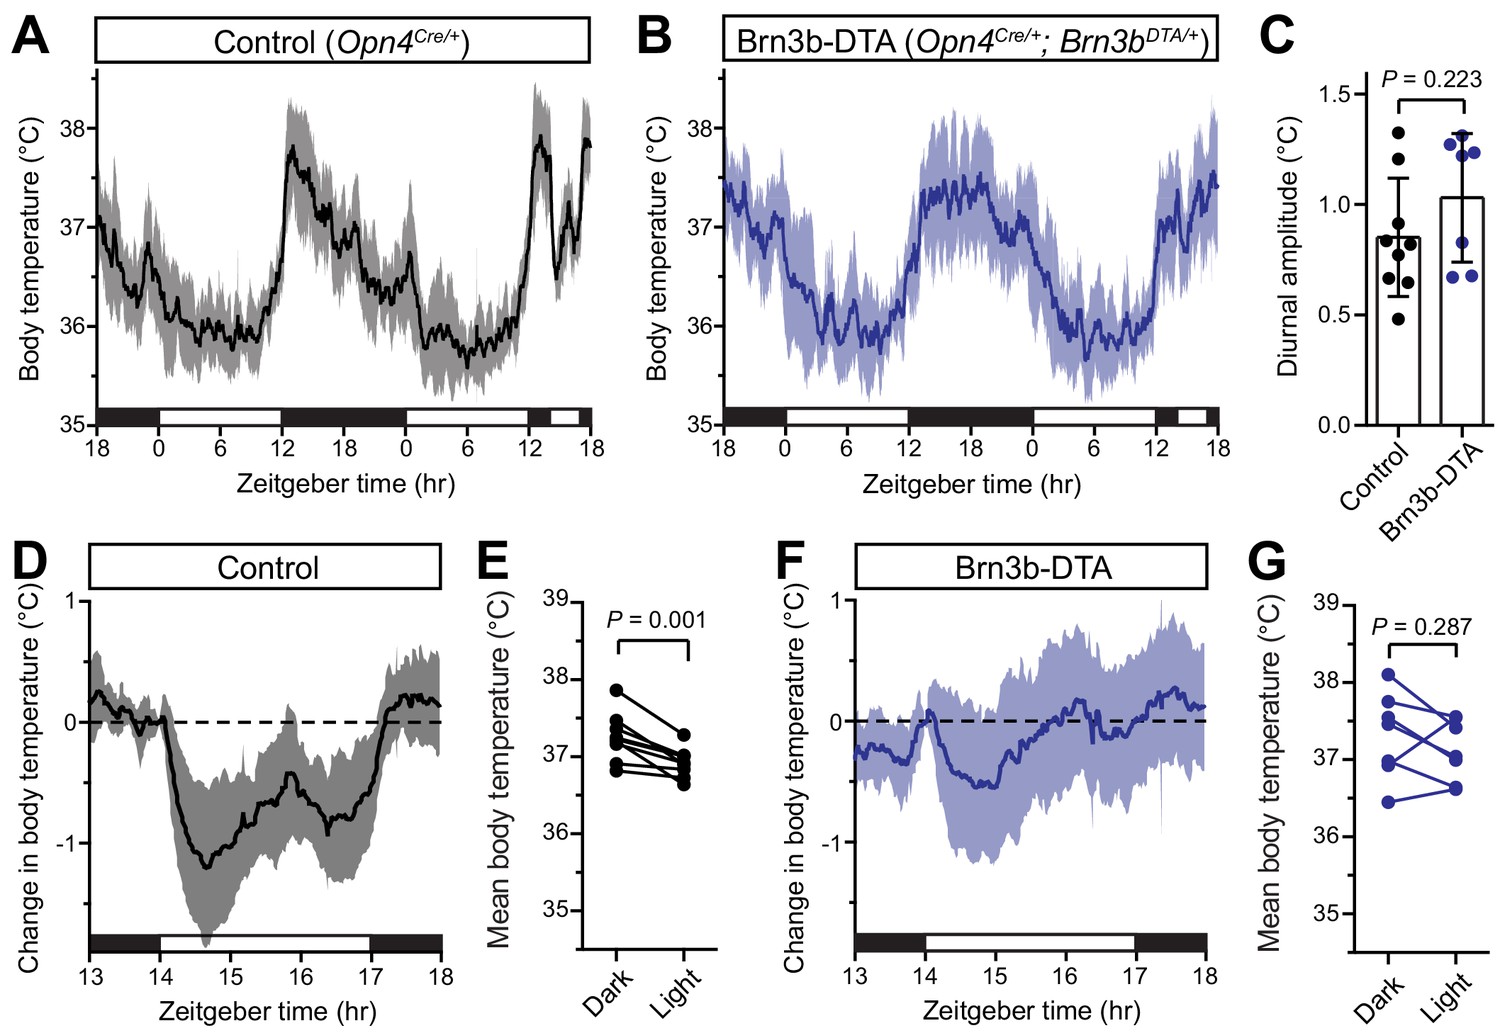
Brn3b-negative ipRGCs are insufficient for acute body temperature regulation via the SCN.
(A) Diurnal body temperature in control (Opn4Cre/+, n = 9) and (B) Brn3b-DTA (Opn4Cre/+;Brn3bDTA/+, n = 7). (C) Diurnal body temperature amplitude in the two groups. p=0.223 by t-test. (D) Body temperature in control during light pulse, relative to baseline (ZT14). (E) Paired comparison of mean body temperature during light pulse compared to previous night. p=0.001 by paired t-test. (F) Body temperature in Brn3b-DTA during light pulse, relative to baseline (ZT14). (G) Paired comparison of mean body temperature during light pulse compared to previous night. p=0.287 by paired t-test. All summarized data are mean ± standard deviation.
-
Figure 2—source data 1
Temperature data for Figure 2.
- https://doi.org/10.7554/eLife.44358.010
Figure 2—figure supplement 1
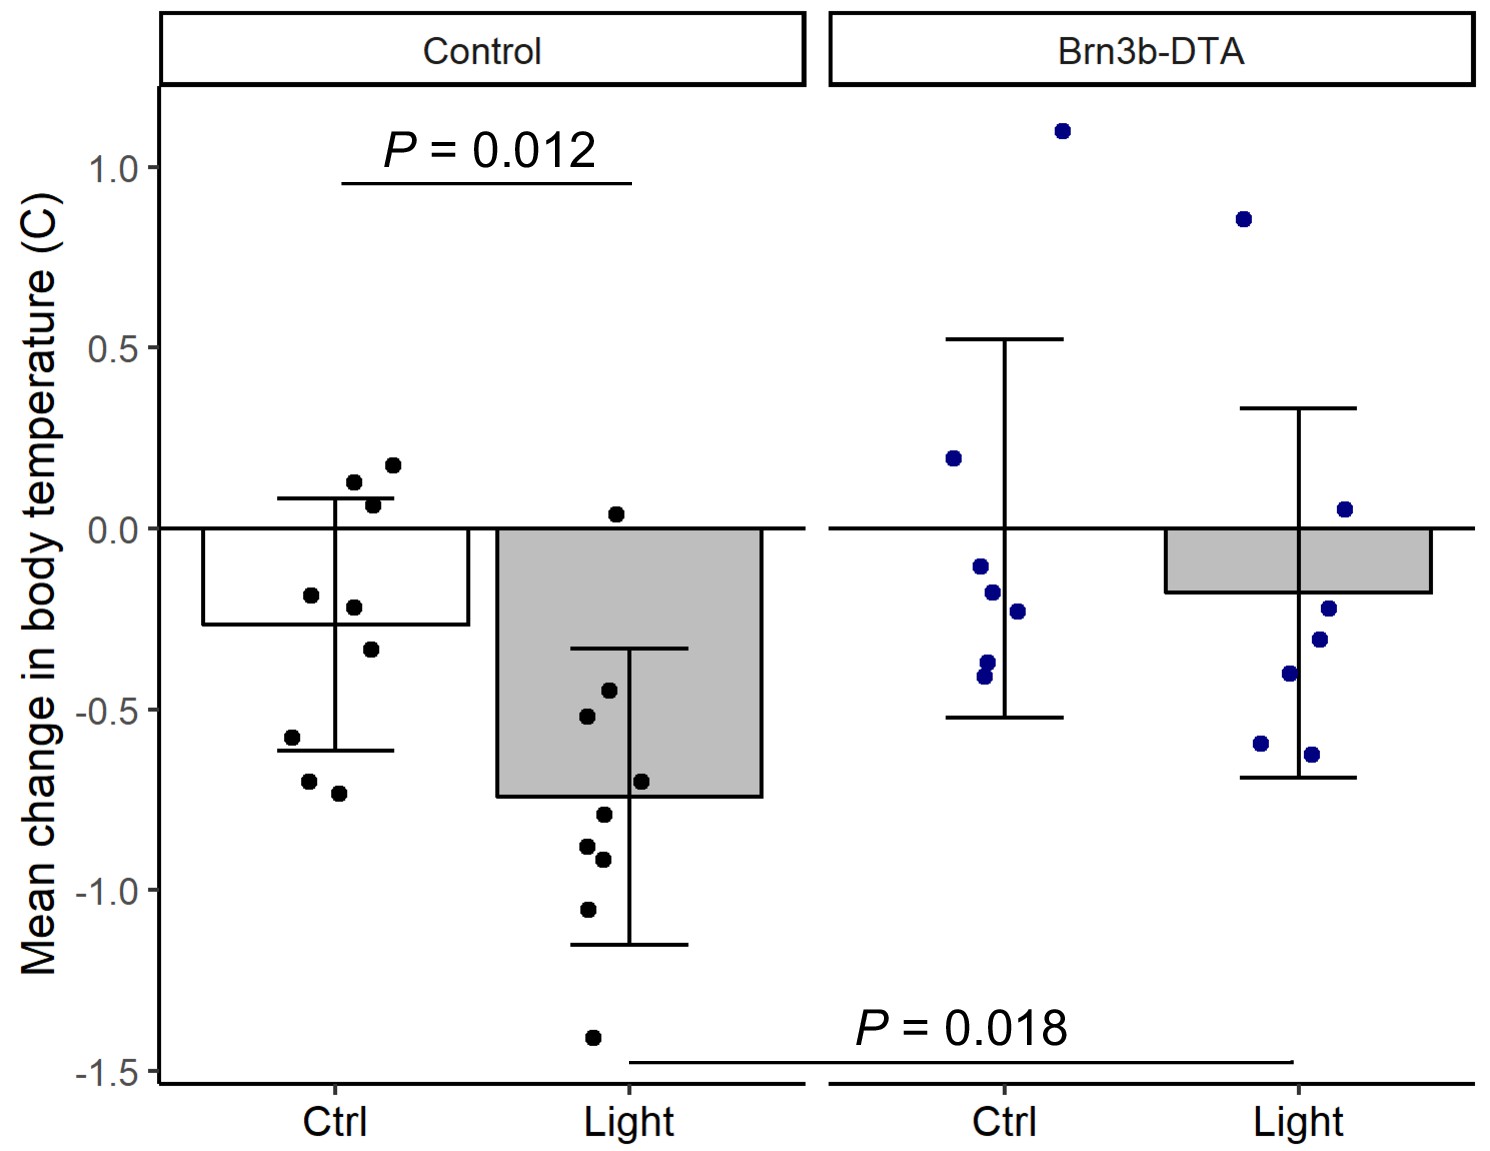
Brn3b-DTA body temperature regulation with light.
Relative change from ZT14 in mean body temperature in Control (Opn4Cre/+, n = 9) or Brn3b-DTA mice (Opn4Cre/+;Brn3bzDTA/+, n = 7) for the 3 hr during the light pulse (Light) or during the previous control night (Ctrl; ZT14-17). Columns and error bars represent mean ± standard deviation and dots represent individual animals. P values from linear mixed model with fixed effects of genotype and light exposure and a random effect of mouse.
Figure 3 with 2 supplements
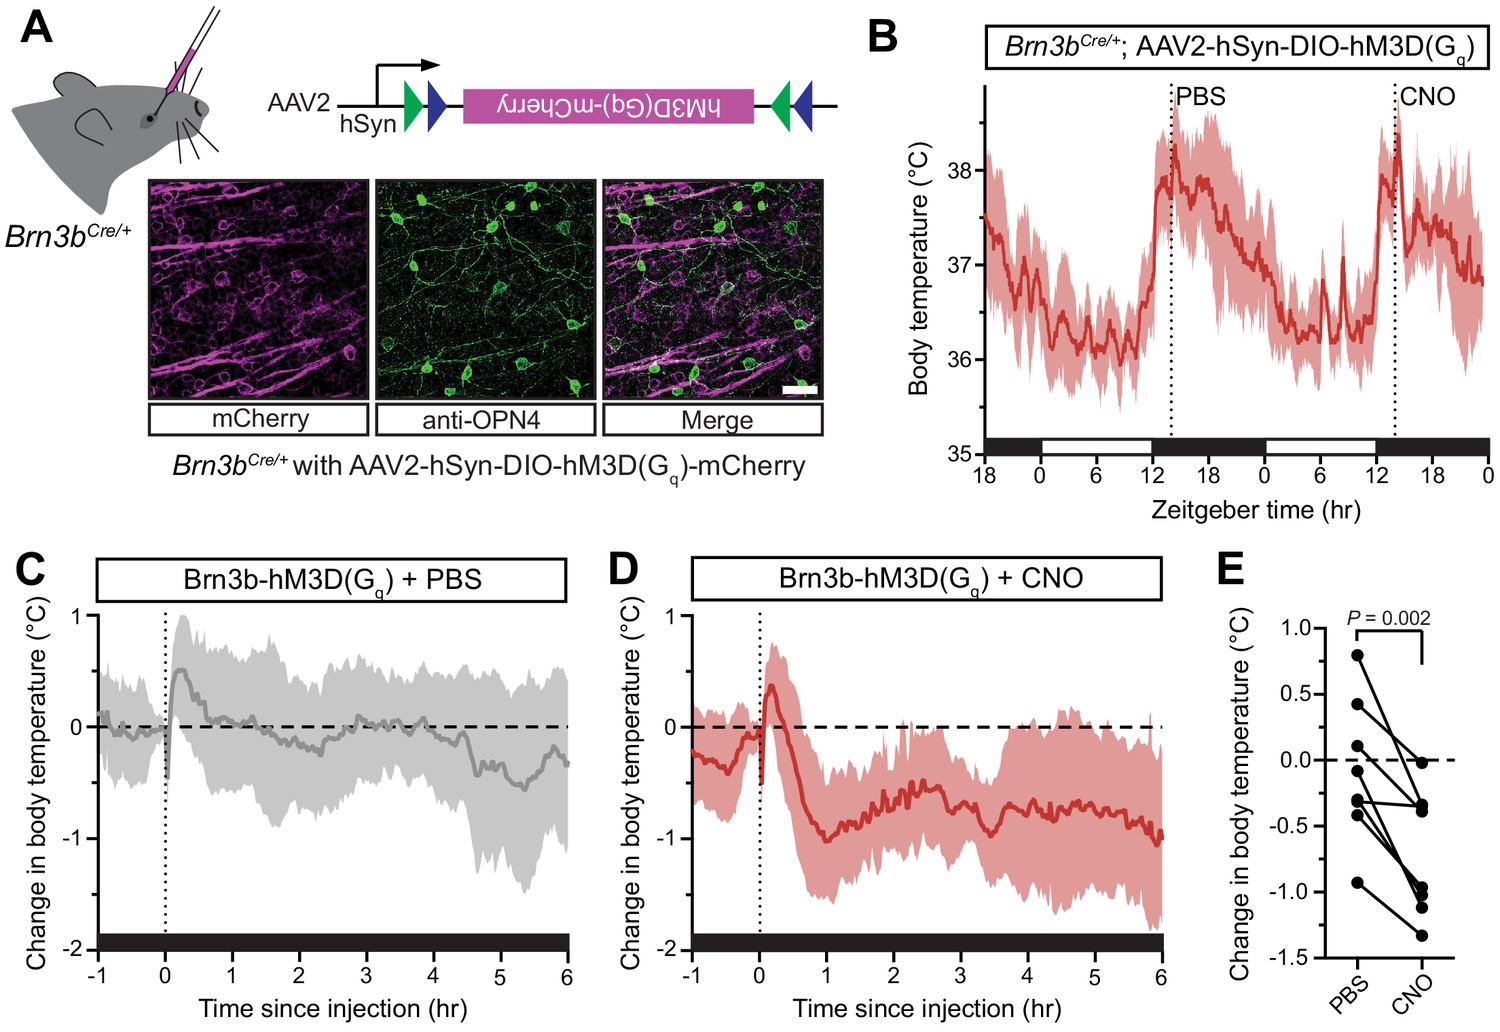
Activation of Brn3b-positive RGCs is sufficient to drive sustained body temperature decreases.
(A) Diagram of intravitreal delivery of AAV2-hSyn-DIO-hM3Dq-mCherry to Brn3bCre/+ mice, and confirmation of infection of ipRGCs. (B) 54 hr continuous diurnal body temperature recordings in Brn3b-hM3Dq mice, with injections of PBS then CNO on consecutive nights at ZT14. (C) Change in body temperature after PBS injection, relative to baseline (time of injection). (D) Change in body temperature after CNO injection, relative to baseline (time of injection). (E) Paired comparison of the change in body temperature with either PBS or CNO injection, compared to temperature at injection time. p=0.002 by paired t-test. All summarized data are mean ± standard deviation.
-
Figure 3—source data 1
Temperature data for Figure 3.
- https://doi.org/10.7554/eLife.44358.014
Figure 3—figure supplement 1
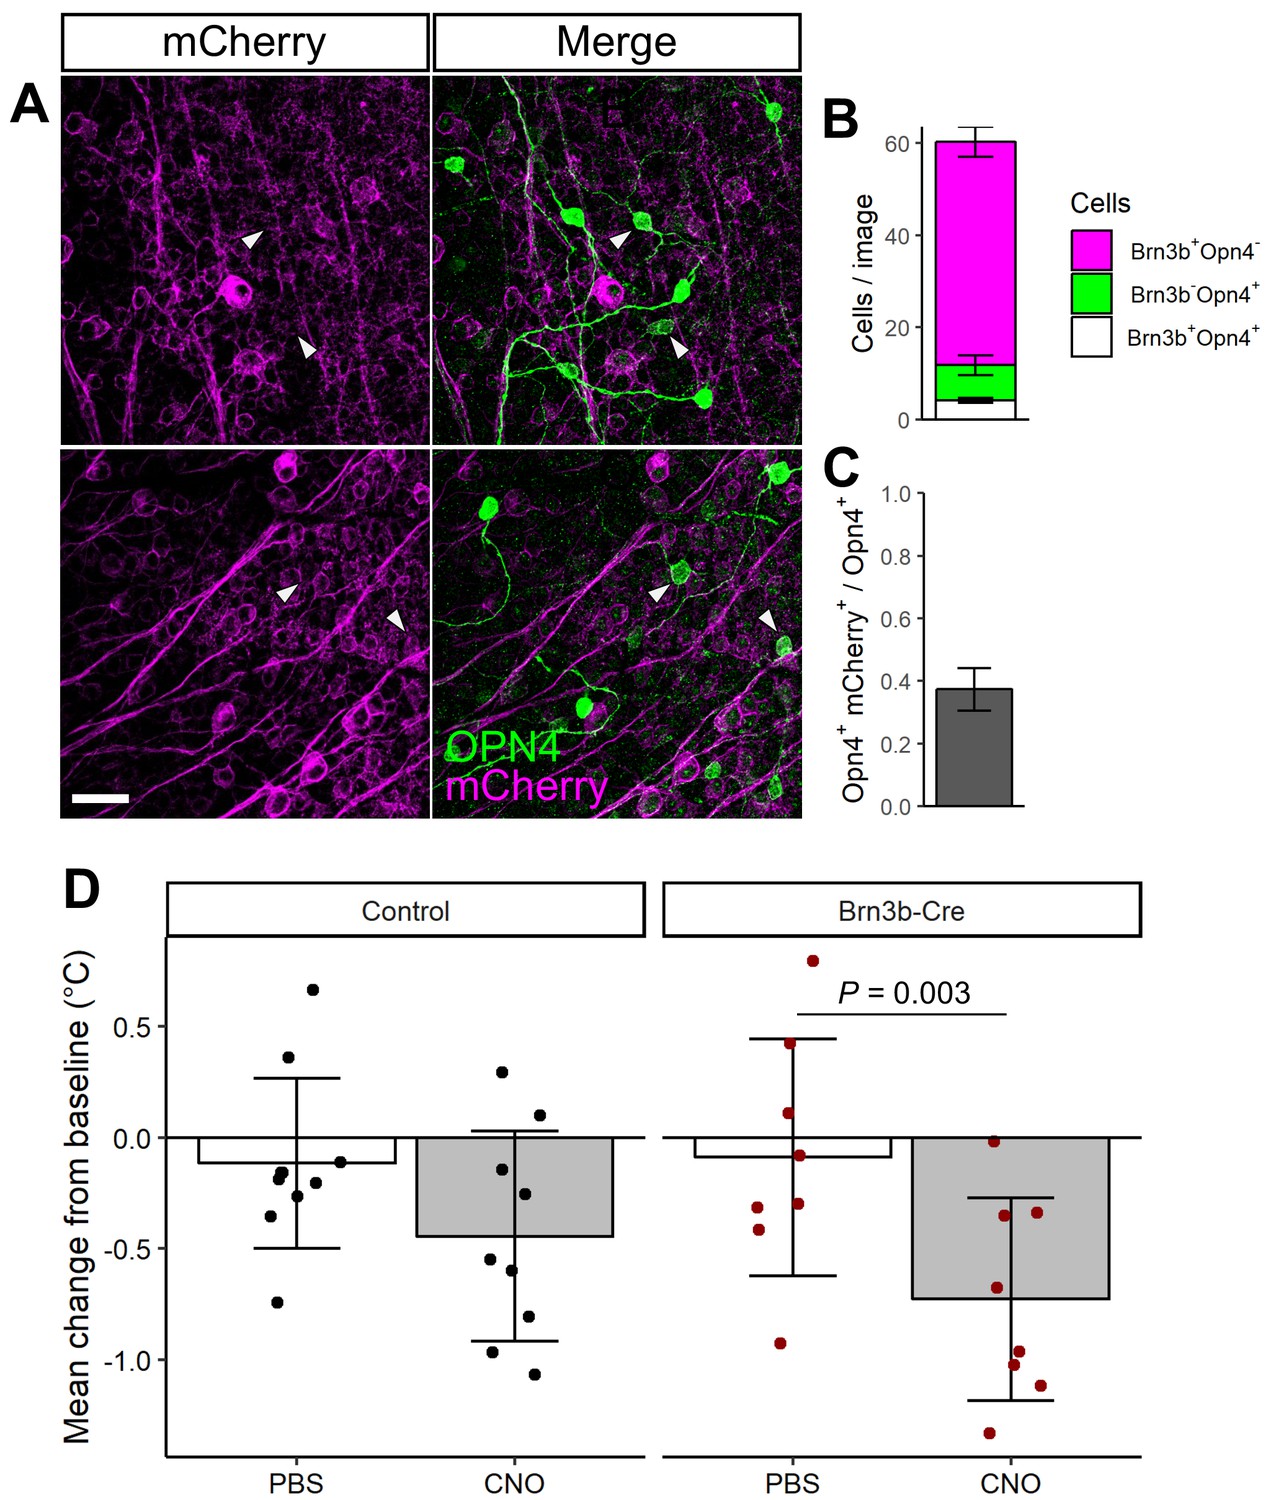
Brn3b-Cre::hM3D(Gq) expression and control experiments.
(A) mCherry expression (magenta) from Brn3b-Cre with AAV-DIO-hM3D(Gq)-mCherry injected in to the retina and colocalized with melanopsin (OPN4, green). Scale bar = 50 µm. (B) Quantification of mCherry/OPN4 colocalization (n = 3) mice. (C) The same data as in B, expressed as the fraction of OPN4 +cells that colocalize with mCherry expression (n = 3 mice). (D) Relative change in mean body temperature in Control (n = 9) or Brn3b-Cre mice (n = 8) injected with AAV-DIO-hM3D(Gq)-mCherry for the 6 hr following PBS or CNO injection, compared to temperature at injection time. Columns and error bars represent mean ± standard deviation and dots represent individual animals. P values from linear mixed model with fixed effects of genotype and light exposure and a random effect of mouse.
-
Figure 3—figure supplement 1—source data 1
Temperature data for Figure 3—figure supplement 1.
- https://doi.org/10.7554/eLife.44358.015
Figure 3—figure supplement 2
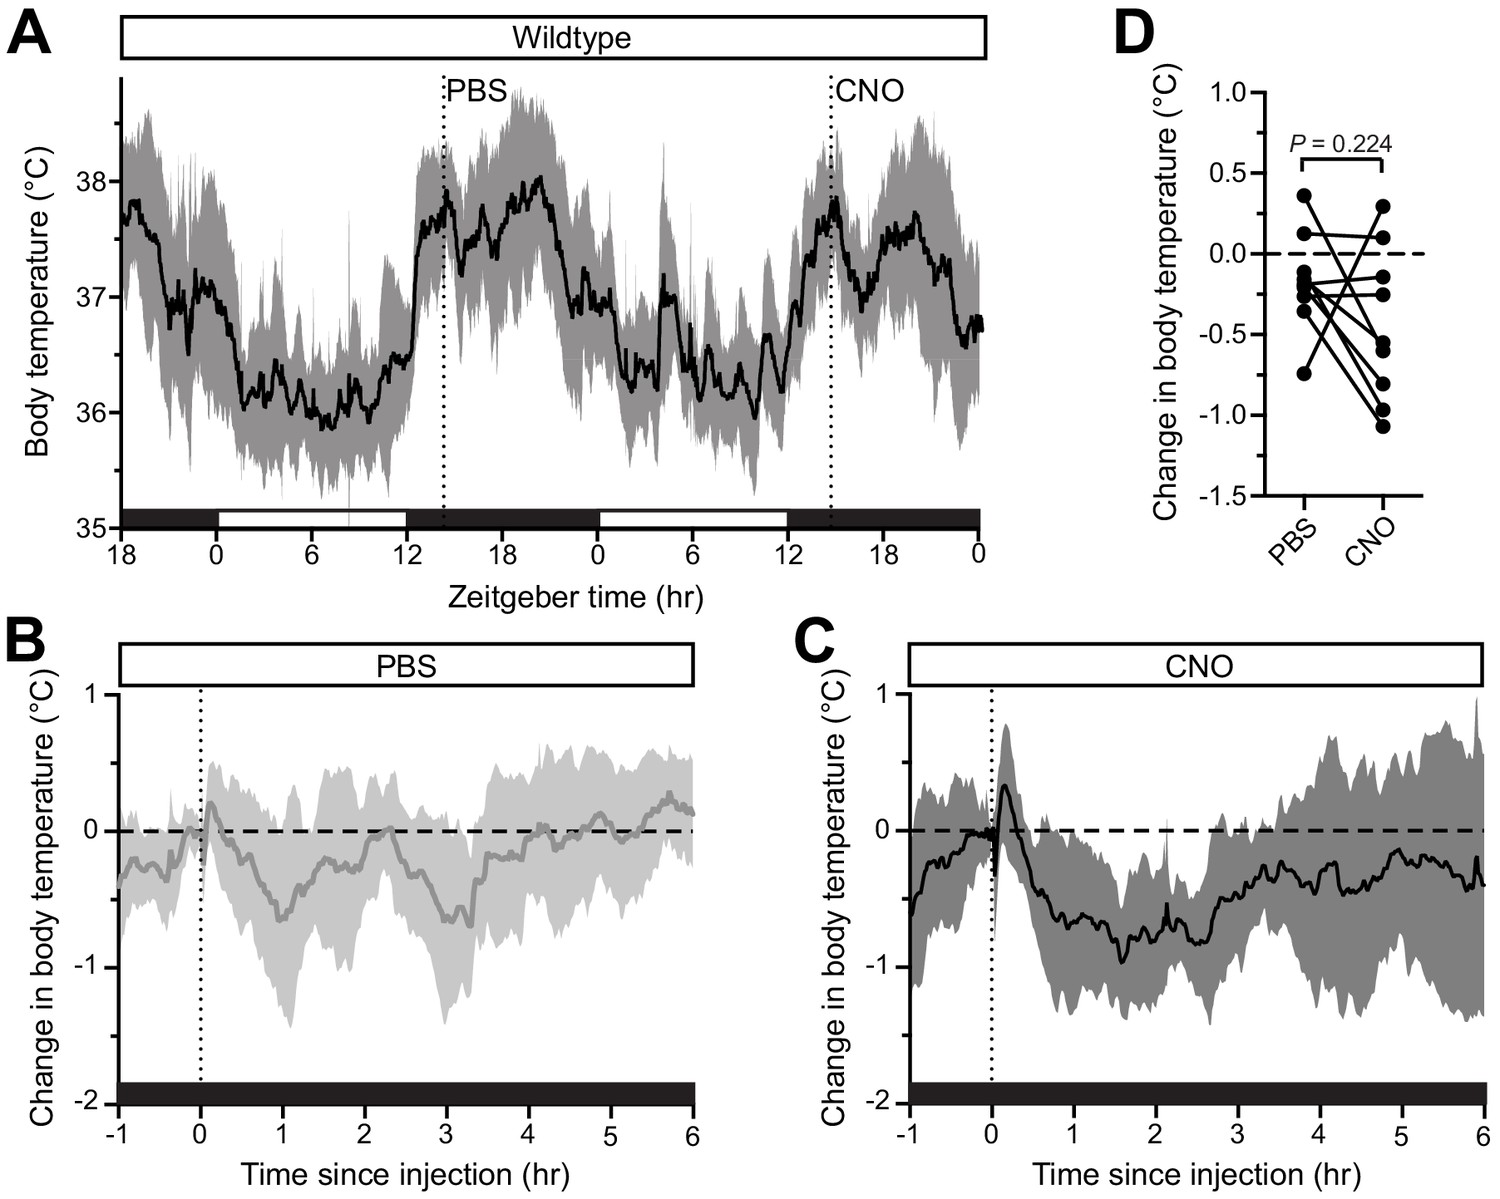
No effect of CNO on body temperature in wildtype mice.
(A) Body temperature of wildtype mice (n = 9) was monitored continuously and PBS was injected on night one at ZT14, followed by CNO injection (1 mg/kg) on night two at ZT14. (B,C) Normalized body temperature of either (B) PBS or (C) CNO injection, relative to baseline temperature prior to injection. Both injections generate a rapid body temperature increase, followed by a dip below the reference value, before returning to normal. (D) Paired comparisons of body temperature changes in response to either PBS or CNO administration, relative to temperature at baseline. All summarized data are mean ± standard deviation.
Figure 4 with 3 supplements
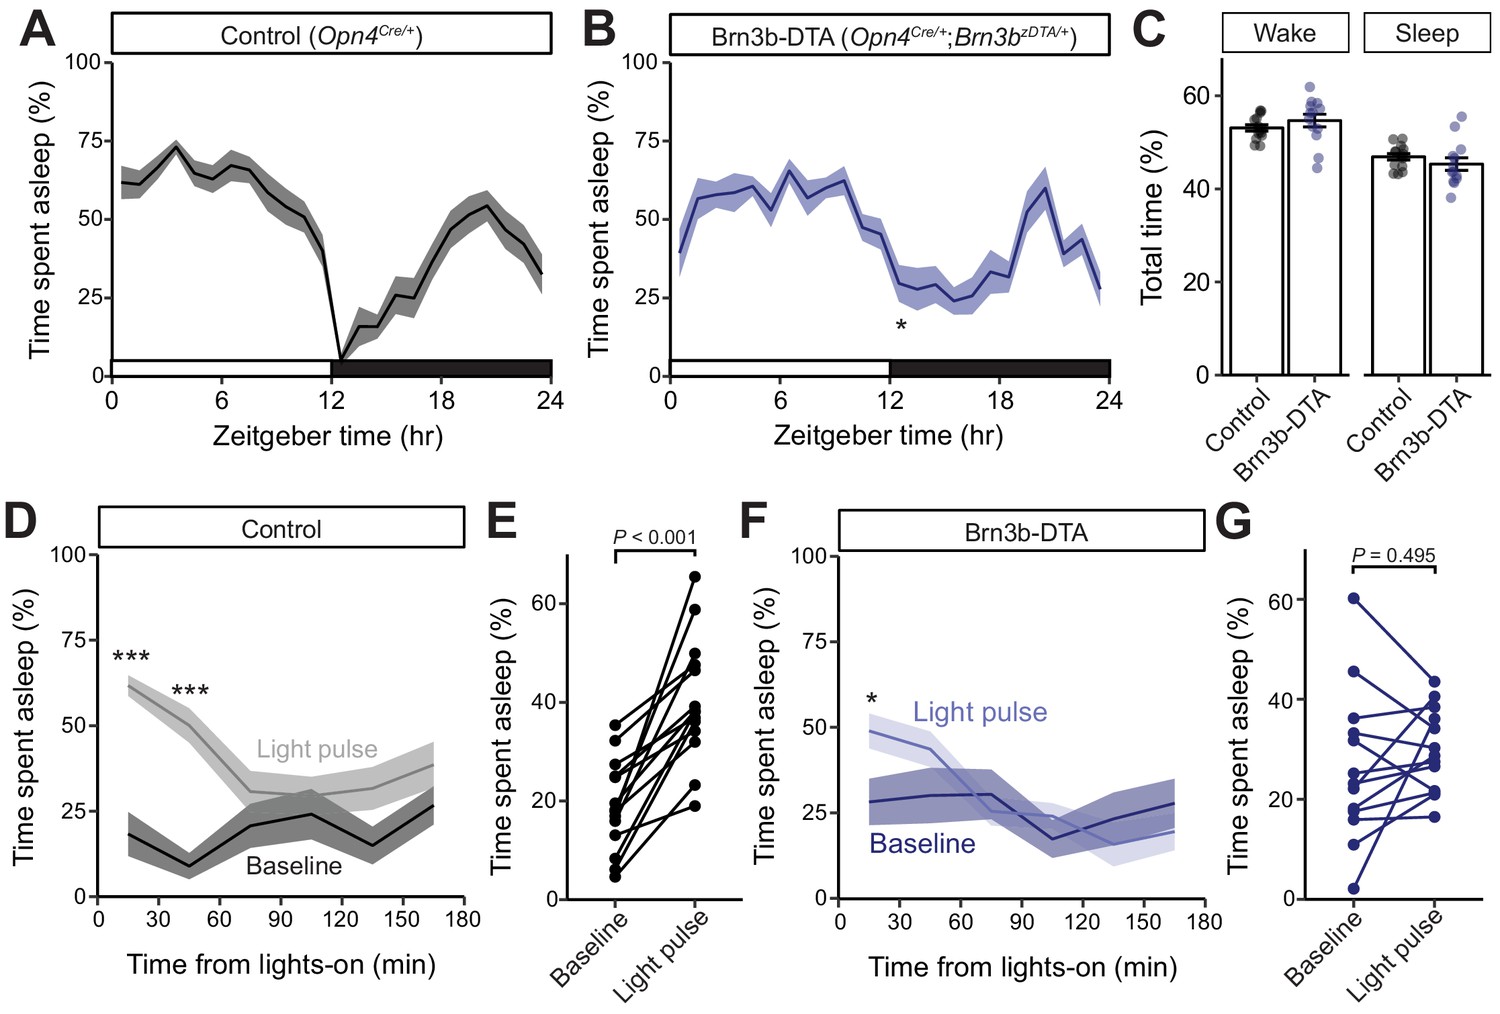
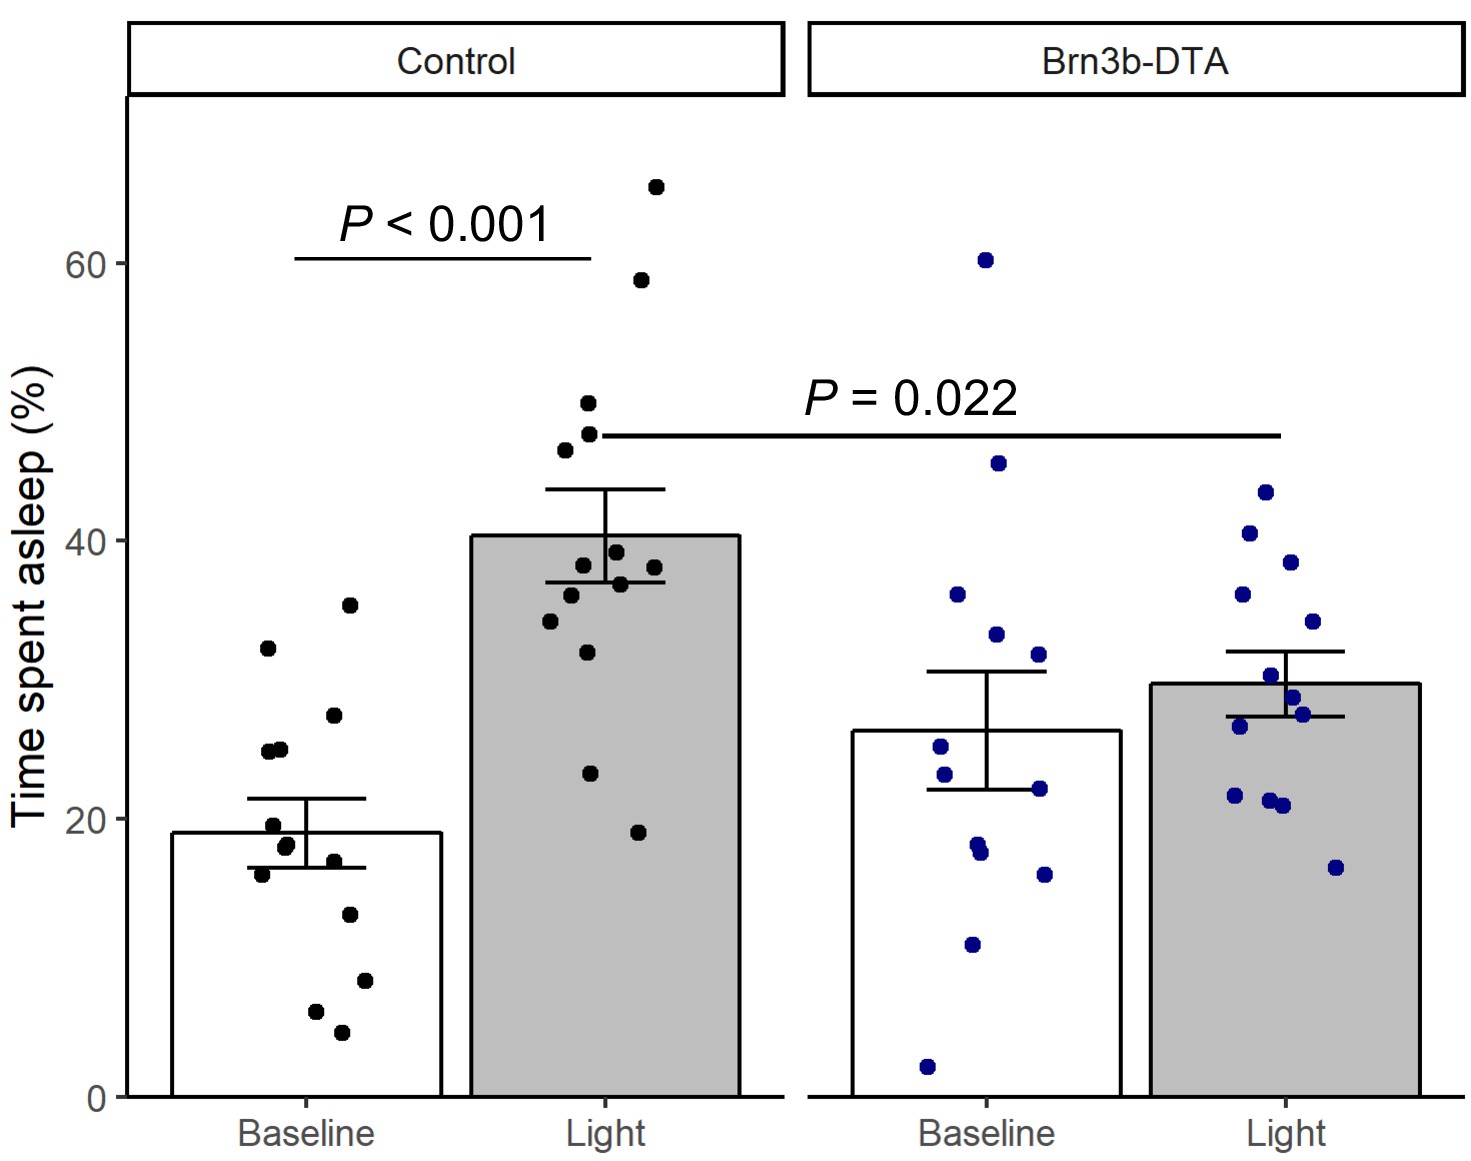
Brn3b-positive ipRGCs are not required for circadian photoentrainment of sleep, but are required for its acute induction by light.
(A–C) Percent time spent asleep in 1 hr bins across the 24 hr day for (A) Control (black) mice (n = 14) and (B) Brn3b-DTA (blue) mice (n = 13) lacking Brn3b-positive ipRGCs. Both lines showed normal photoentrainment of sleep, with no main effect of genotype compared to Control by repeated-measures two-way ANOVA (F (1, 25)=1.108, p=0.303). Brn3b-DTA mice showed a significant reduction in sleep only at lights off (ZT 12) by Sidak’s multiple comparisons test (p=0.029). (C) Percent time spent awake and asleep in Control (black) and Brn3b-DTA mice (blue). No differences were observed between genotypes by t-test (p=0.316). (D–G) Percent time spent asleep for (D) Control mice (black) and (F) Brn3b-DTA mice (blue) at baseline (dark line) and during the three hour light pulse (light line). Significant difference from baseline determined by repeated measures two-way ANOVA. Significant effect of treatment for Controls (F (1, 13)=38.09, p<0.001), but not for Brn3b-DTA (F (1, 12)=0.8496, p=0.375). (E) Control mice show significantly more sleep and less wake during a light pulse (paired t-test) while (G) Brn3b-DTA mice showed no change in percent sleep or wake during the same period. Data are mean for ZT14–17. All summarized data are mean ± SEM.
-
Figure 4—source data 1
Sleep data for Figure 4.
- https://doi.org/10.7554/eLife.44358.020
Figure 4—figure supplement 1
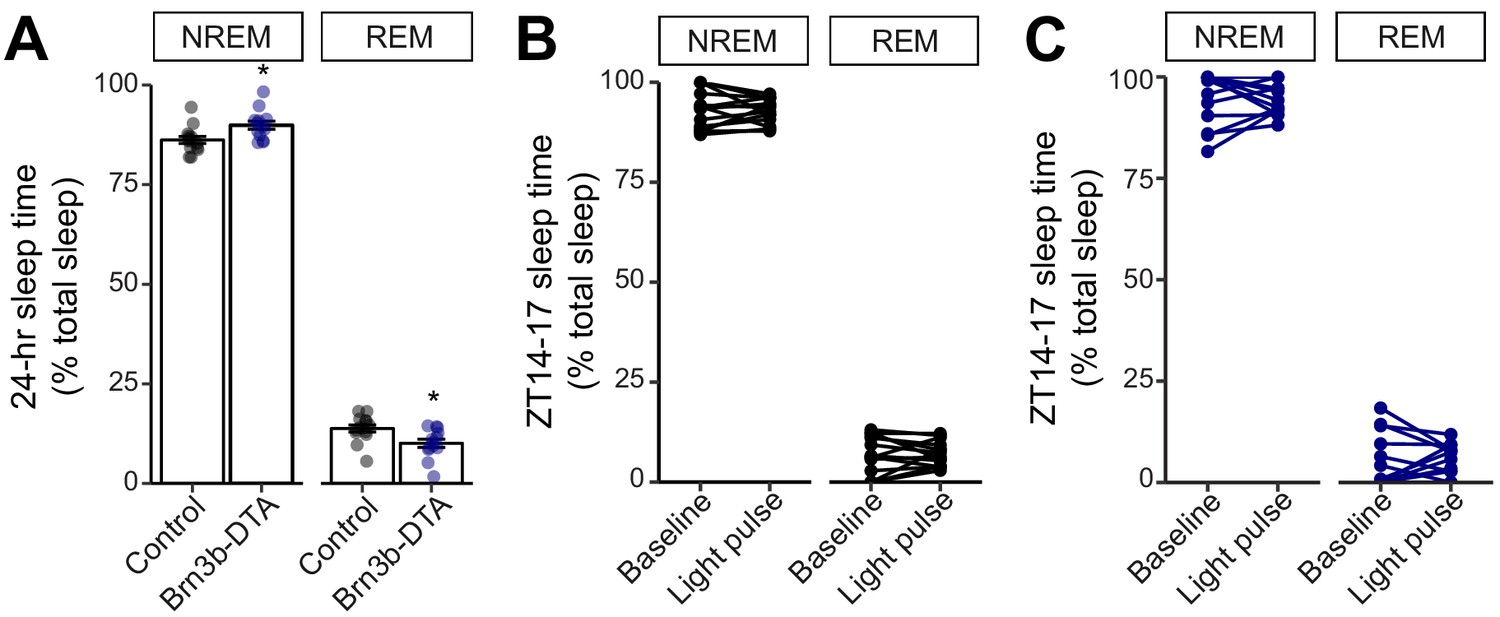
NREM and REM measurements in Control and Brn3b-DTA mice.
(A) Percent sleep recorded across the 24 hour day as NREM vs. REM in Control (black) and Brn3b-DTA mice (blue). Brn3b-DTA mice showed a small but significant increase in NREM and decrease in REM sleep compared to Control mice. REM: rapid eye movement, NREM: non-REM. Control: n = 14. Brn3b-DTA: n = 13. *p=0.011 by t-test. (B, C) Sleep stage quantification during ZT14-17, either baseline night or light pulse. No significant differences were seen in either (B) Control or (C) Brn3b-DTA mice by paired t-test. All summarized data are mean ± SEM.
Figure 4—figure supplement 2
Brn3b-DTA body temperature regulation with light.
Relative change in sleep time in Control (Opn4Cre/+, n = 14) or Brn3b-DTA mice (Opn4Cre/+;Brn3bzDTA/+, n = 13) for the 3 hr during the light pulse or during the previous control night (ZT14-17). Columns and errorbars represent mean ± SEM and dots represent individual animals. P values from linear mixed model with fixed effects of genotype and light exposure and a random effect of mouse.
Figure 4—figure supplement 3
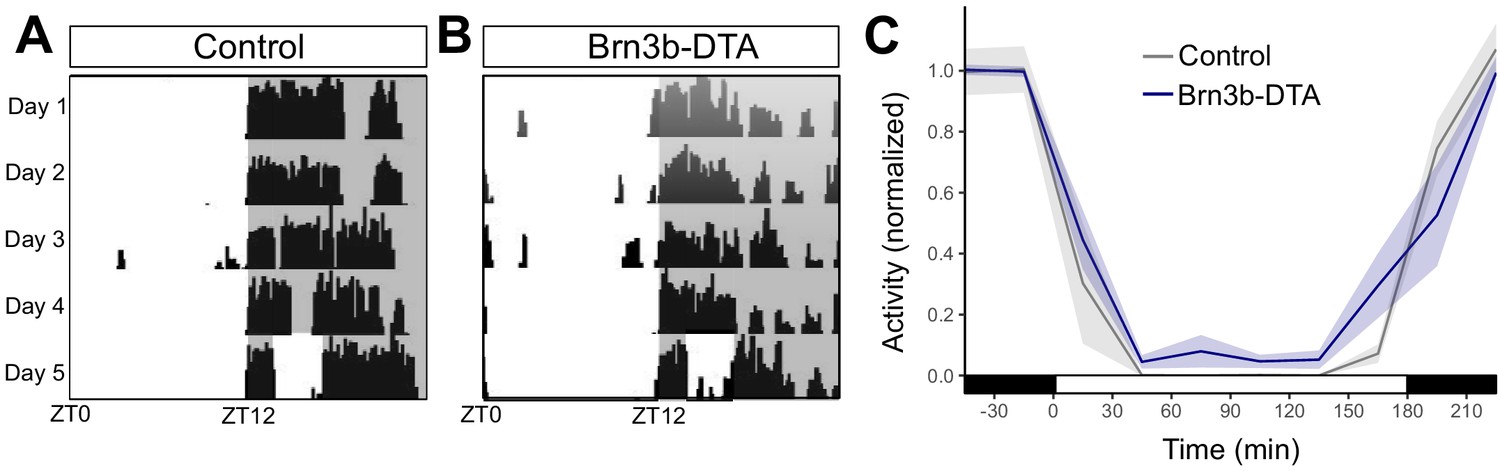
Wheel-running activity in Brn3b-DTA mice.
(A) Control (Opn4Cre/+, n = 5) and (B) Brn3b-DTA (Opn4Cre/+;Brn3bDTA/+, n = 6) were housed in a 12:12 LD cycle and subjected to a 3 hr light pulse starting at ZT14. (C) Activity counts in 30 min bins for both groups. Wheel revolutions were normalized to the average activity for the 1 hr preceding the light pulse. Shading represents SEM. While both groups display robust wheel-running inhibition in response to the light pulse, Brn3b-DTA mice had a mild deficit compared to Controls (p=0.039 by linear mixed model).
Author response image 1
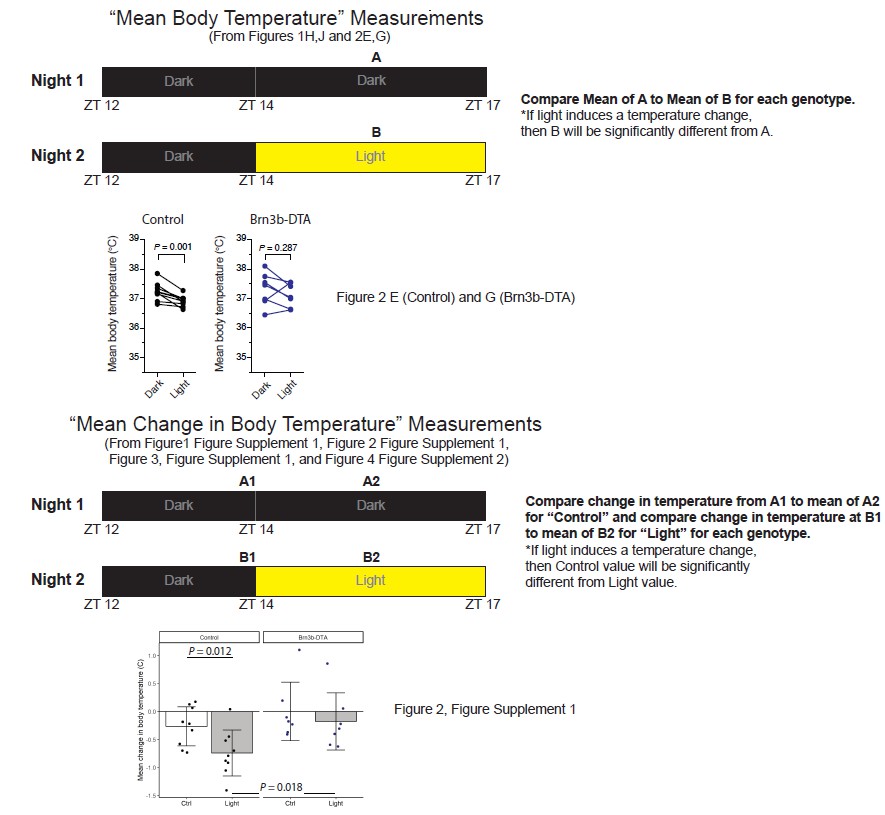
Schematic of analyses throughout the manuscript with example graphs from Brn3bDTA analyses.
Tables
Key resources table
| Reagent type (species) or resource | Designation | Source or reference | Identifiers |
|---|---|---|---|
| Genetic reagent (Mus musculus) | Opn4tauLacZ | Hattar et al., 2002 | Jax: 021153 RRID:MGI:5520170 |
| Genetic reagent (Mus musculus) | Gnat1-/- | PMID: 11095744 | |
| Genetic reagent (Mus musculus) | Gnat2Cpfl3 | PMID: 17065522 | Jax: 006795 |
| Genetic reagent (Mus musculus) | Opn4Cre | Ecker et al., 2010 | RRID:MGI:5285910 |
| Genetic reagent (Mus musculus) | Brn3bzDTA | Chen et al., 2011 | RRID:MGI:5285910 |
| Genetic reagent (Mus musculus) | Brn3bCre | PMID: 24608965 | RRID:IMSR_JAX:030357 |
| Antibody | anti-OPN4 (rabbit polyclonal) | Advanced Targeting Systems | AB-N38 (1:1000) RRID:AB_1608077 |
| Antibody | AlexaFluor 488, anti-rabbit (goat polyclonal) | Life Technologies | A-11008 (1:1000) RRID:AB_143165 |
| Viral reagent | AAV2-hSyn-DIO-hM3Dq-mCherry | UNC Vector Core | |
| Chemical compound, drug | Clozpine-N-oxide | Sigma | |
| Software | R 3.5.2 | https://cran.r-project.org/ | |
| Software | Graphpad Prism 7.0 | https://www.graphpad.com/scientific-software/prism/ |
Additional files
-
Transparent reporting form
- https://doi.org/10.7554/eLife.44358.021
Download links
A two-part list of links to download the article, or parts of the article, in various formats.
Downloads (link to download the article as PDF)
Open citations (links to open the citations from this article in various online reference manager services)
Cite this article (links to download the citations from this article in formats compatible with various reference manager tools)
Distinct ipRGC subpopulations mediate light’s acute and circadian effects on body temperature and sleep
eLife 8:e44358.
https://doi.org/10.7554/eLife.44358


