PDIA1/P4HB is required for efficient proinsulin maturation and ß cell health in response to diet induced obesity
- SBP Medical Discovery Institute, United States
- DLS Consulting, United States
- University of Michigan Medical School, United States
- University of California, San Diego, United States
Figures
Figure 1 with 1 supplement
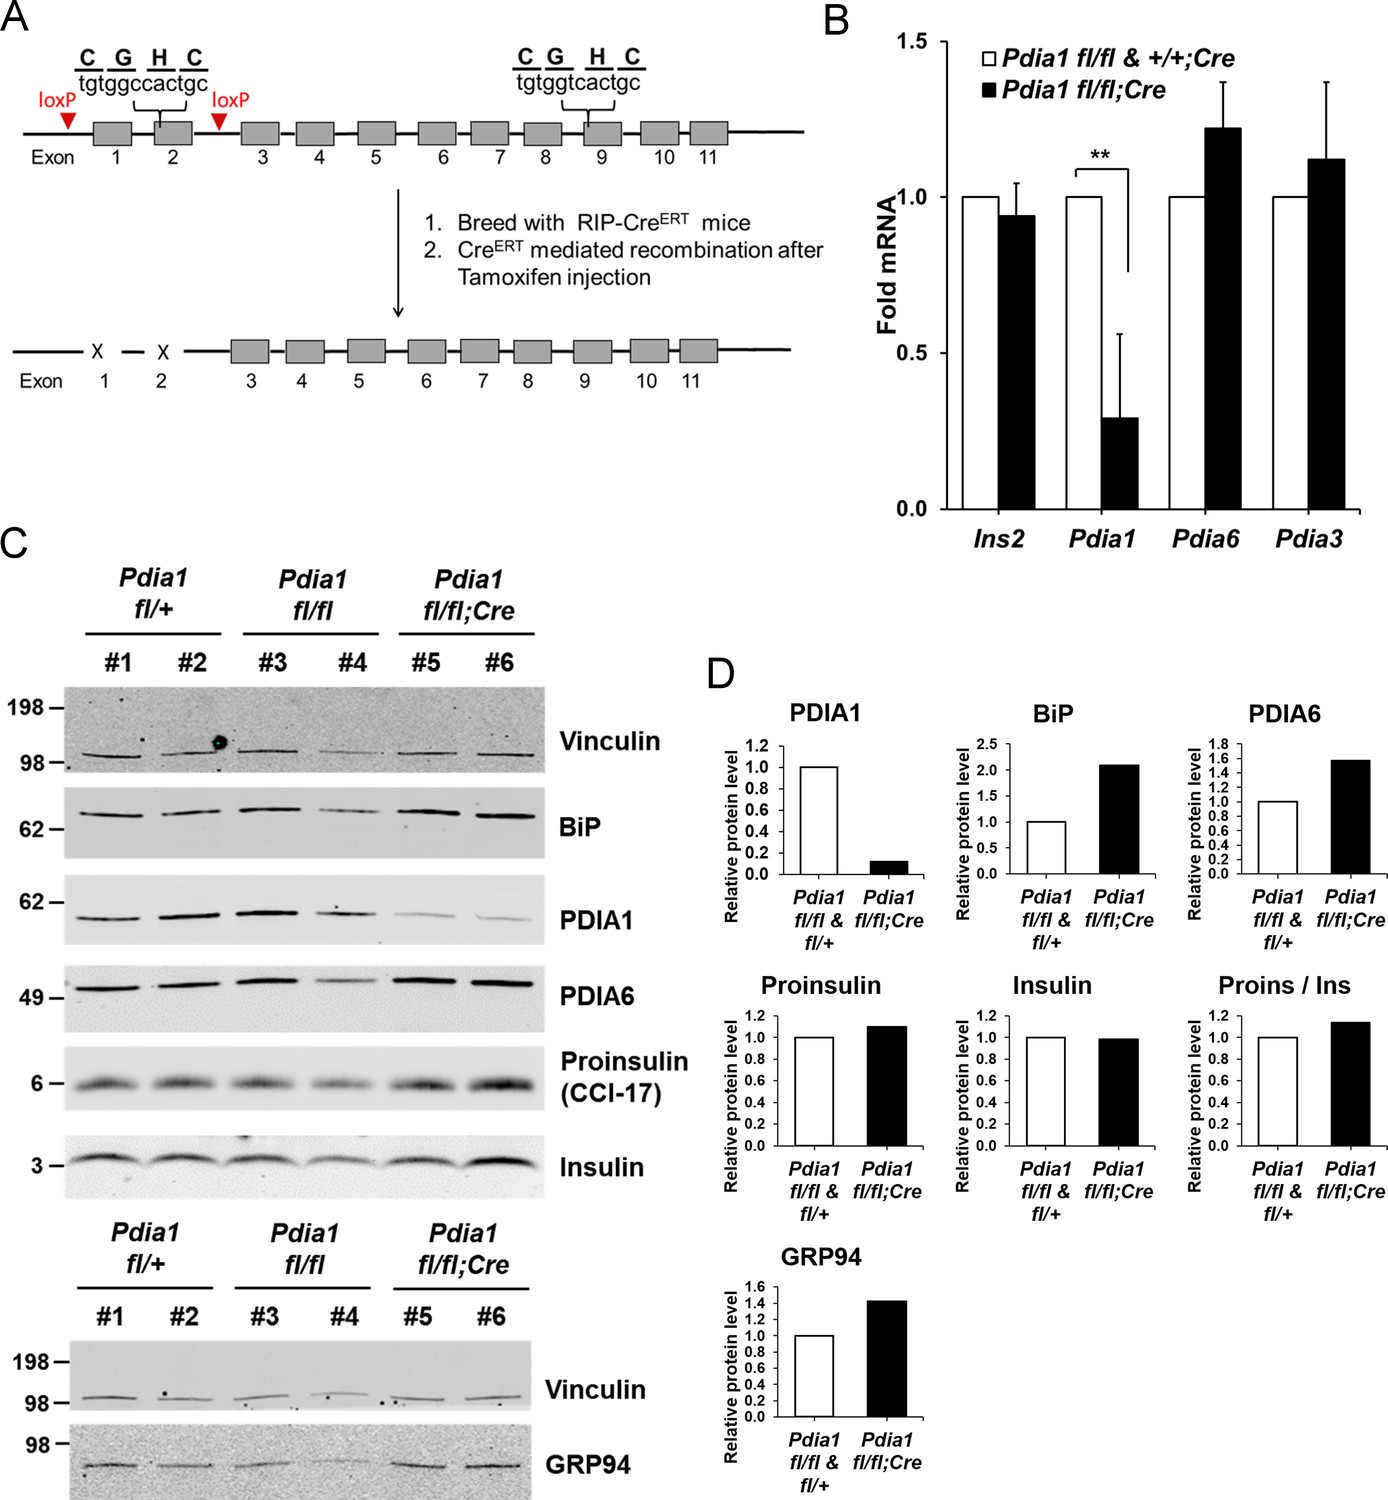
Conditional ß cell-specific Pdia1 deleted mice were generated with Tamoxifen (Tam) induction.
(A) Diagram depicts the generation of Pdia1:RIP-CreERT mice. Mice with floxed Pdia1 alleles (Hahm et al., 2013) were crossed with RIP-CreERT transgenic mice (Dor et al., 2004) and progeny were injected IP with Tam to induce CreERT function and Pdia1 deletion. Control littermate mice with one or two floxed Pdia1 alleles, but not harboring the RIP-CreERT transgene, were injected in parallel with Tam. (B–D) Pdia1 deletion is specific. (B) Total RNA was extracted from islets isolated from female mice at eight wks after Tam injection. mRNA levels were measured by qRT-PCR. Mean ± SEM, n = 3 for each group (p<0.01**). (C) Western blot illustrates expression of Vinculin, PDIA1, BiP, PDIA6, GRP94, Proinsulin, and Insulin in islets isolated from female mice at 14 wks after Tam injection. (D) Quantification of indicated proteins by Western blotting (from C) is shown. Each value was normalized to vinculin except for the proinsulin to insulin ratio. Pdia1 fl/fl (n = 2), Pdia1 fl/+ (n = 2), Pdia1 fl/fl;Cre (n = 2).
Figure 1—figure supplement 1
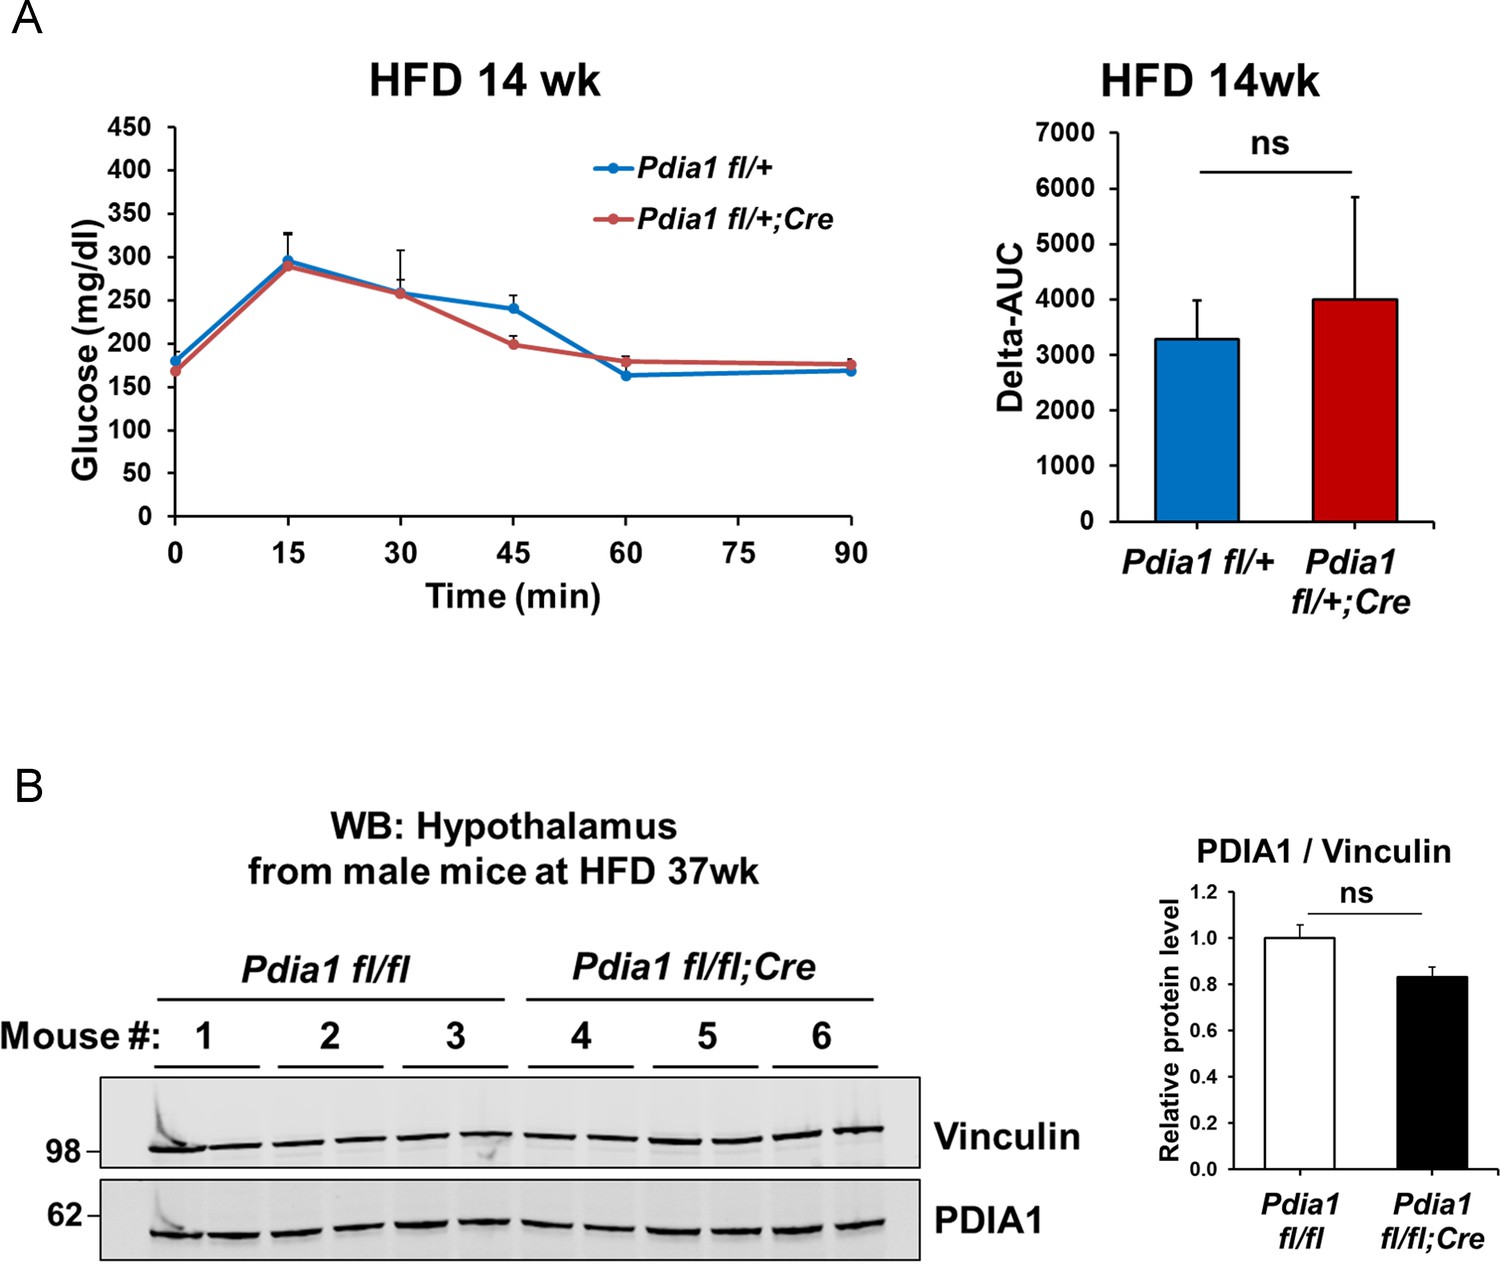
The RIP-CreERT allele does not impact the ß cell-specific Pdia1 deletion phenotype.
(A) Pdia1 fl/+ mice harboring the RIP-CreERT allele (n = 3) exhibit similar glucose tolerance tests as Pdia1 fl/+ mice without the RIP-CreERT allele (n = 4) at 14 wks after HFD. All mice were injected with Tam after 3 wks of HFD. (B) Δ-AUC of glucose tolerance test in (A). (C) PDIA1 protein levels did not change in hypothalamic brain tissue after 37 wks of HFD. Pdia1 fl/fl (n = 3), Pdia1 fl/fl;RIP-CreERT (n = 3). All data are shown as Mean ± SEM.
Figure 2
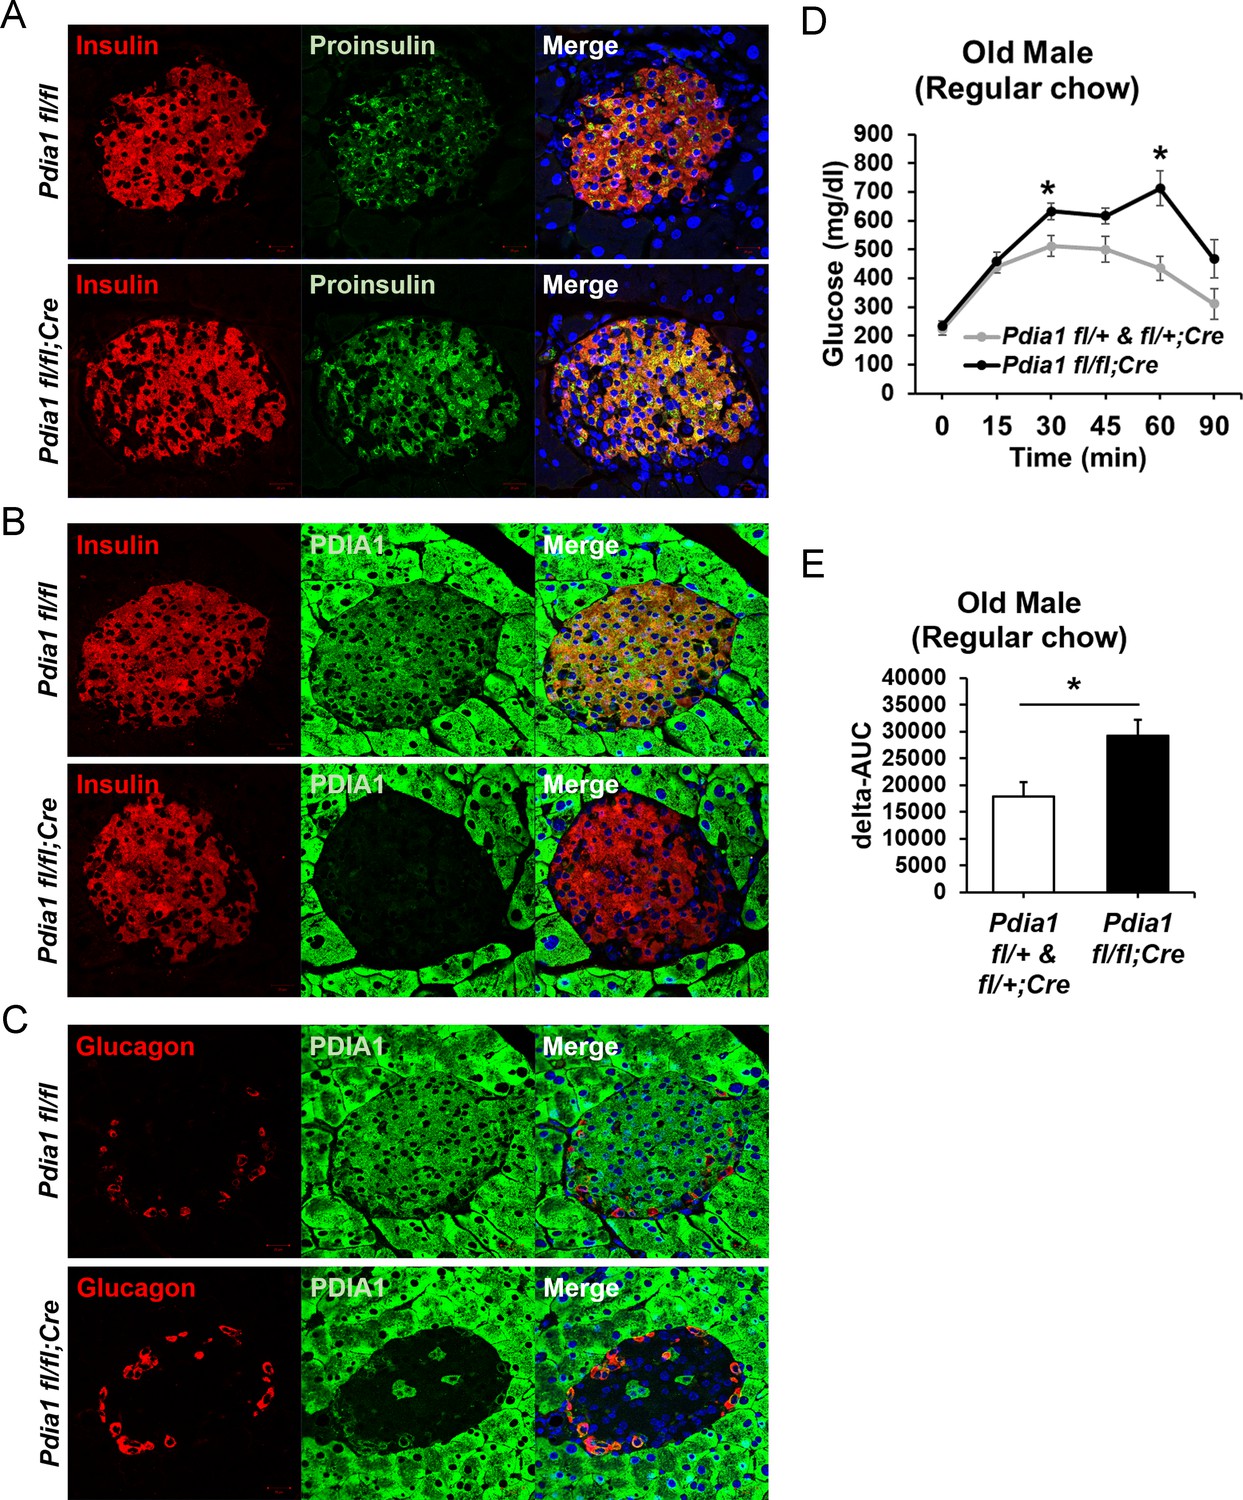
Pdia1 is specifically and persistently deleted in murine ß cells.
(A–C) Pancreas tissue sections were prepared from female mice at 49 wks after Tam injection and immuno-stained with anti- proinsulin, insulin, PDIA1, and glucagon antibodies. Images were merged with DAPI stain. Scale bar, 20 µm. (D) Old KO mice developed glucose intolerance compared to control genotypes measured by glucose tolerance testing (GTT) at nine wks after Tam injection. Male mice at 9 mon of age were injected with Tam and fed a regular chow. Mice were fasted (4 hr) prior to IP glucose injection (2 g/Kg body weight) and glucose levels were measured by tail bleeding at each time point (0; non-injected, 15, 30, 60, 90 min). control genotypes: Pdia1 fl/+ (n = 2), Pdia1 fl/+;Cre (n = 5), KO; n = 5. (E) Area under the GTT curve (Δ-AUC) of (D) is indicated in graph.
Figure 3 with 1 supplement
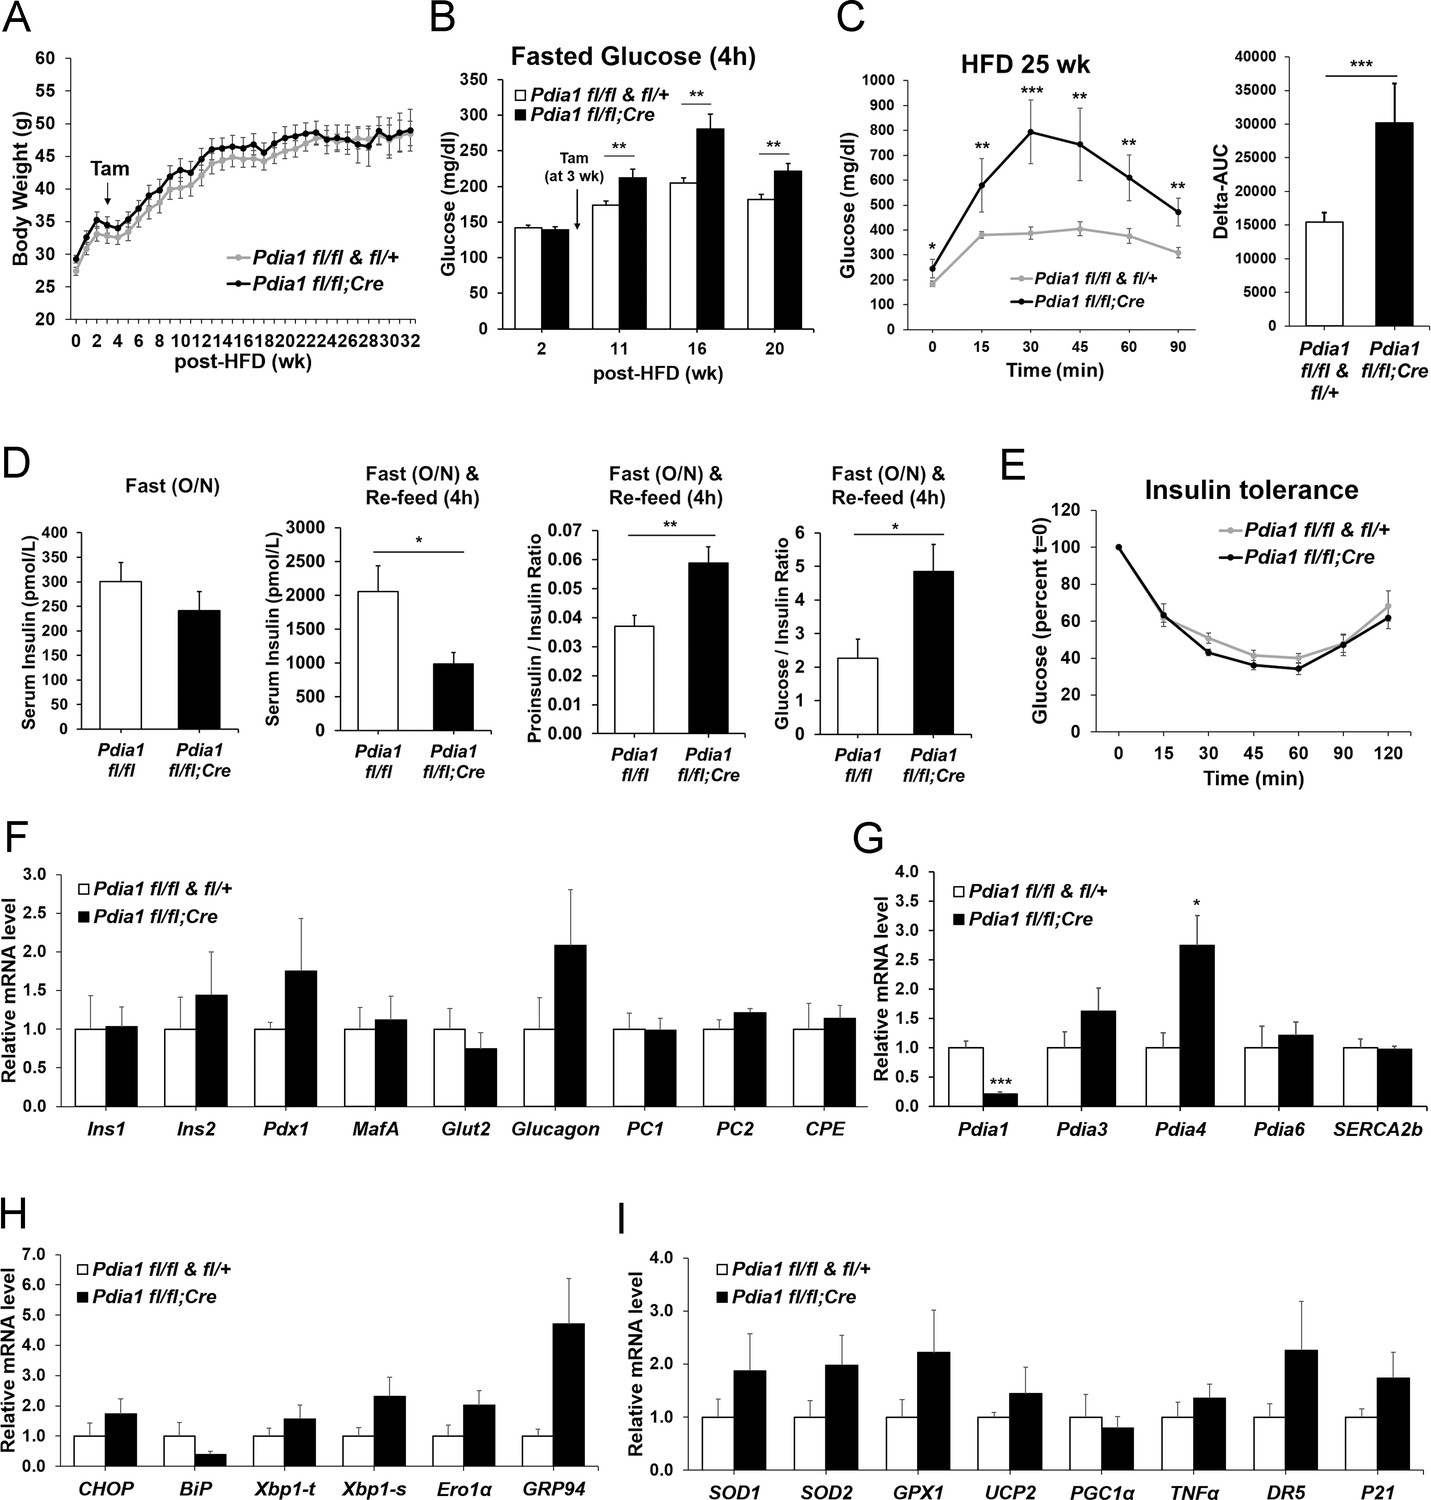
ß cell-specific Pdia1 deleted male mice are glucose intolerant with defective insulin secretion when fed a 45% High Fat Diet (HFD).
All mice were Tam injected at three wks after HFD was started. (A) No difference was observed in body weight (g) between control genotypes and KO mice. Mean ± SEM, controls; n = 17, KO; n = 12. (B) Fasting (4 hr) blood glucose levels were elevated in KO mice at 11, 16 and 20 wks after HFD. Glucose levels were measured by tail bleeding. Mean ± SEM, control genotypes; n = 17, KO; n = 12. (C) KO mice displayed higher blood glucose levels and area under the GTT curve (Δ-AUC) compared to control genotypes during glucose tolerance testing (GTT) after HFD for 25 wks. GTT were performed at multiple time points after HFD in two independent cohorts and representative results are shown. Mice were fasted (4 hr) prior to IP glucose injection (1 g/Kg body weight) and glucose levels were measured by tail bleeding at each time point (0; non-injected, 15, 30, 60, 90 min). control genotypes; n = 17, KO; n = 6. (D) KO mice exhibited decreased serum insulin levels and an increased serum proinsulin/insulin ratio compared to control genotypes. Insulin and proinsulin ELISAs were performed with the serum obtained from mice after fasting (overnight) and re-feeding (4 r) after HFD for 17 wks. control genotypes; n = 8, KO; n = 12. (E) No difference was observed in insulin tolerance tests performed after HFD for 20 wks. Mice were fasted for 4 hr before IP injection of insulin (1.5units/Kg). Glucose levels were measured by tail bleeding at each time point (0; non-injection, 15, 30, 60, 90, 120 min). control genotypes; n = 17, KO; n = 12. (F–I) Total RNA was extracted from islets isolated from mice after HFD for 30 wks. mRNA expression was measured by qRT-PCR. control genotypes; n = 3, KO; n = 3 mice. (F). ß cell-, α cell- and insulin processing genes. (G) PDI family and SERCA genes. (H) UPR genes. (I) Antioxidant response- and cell death- related genes. All data are shown as Mean ± SEM. p<0.05*, p<0.01**, p<0.001***.
-
Figure 3—source data 1
Primer sequences used for qRT-PCR.
- https://doi.org/10.7554/eLife.44528.007
Figure 3—figure supplement 1
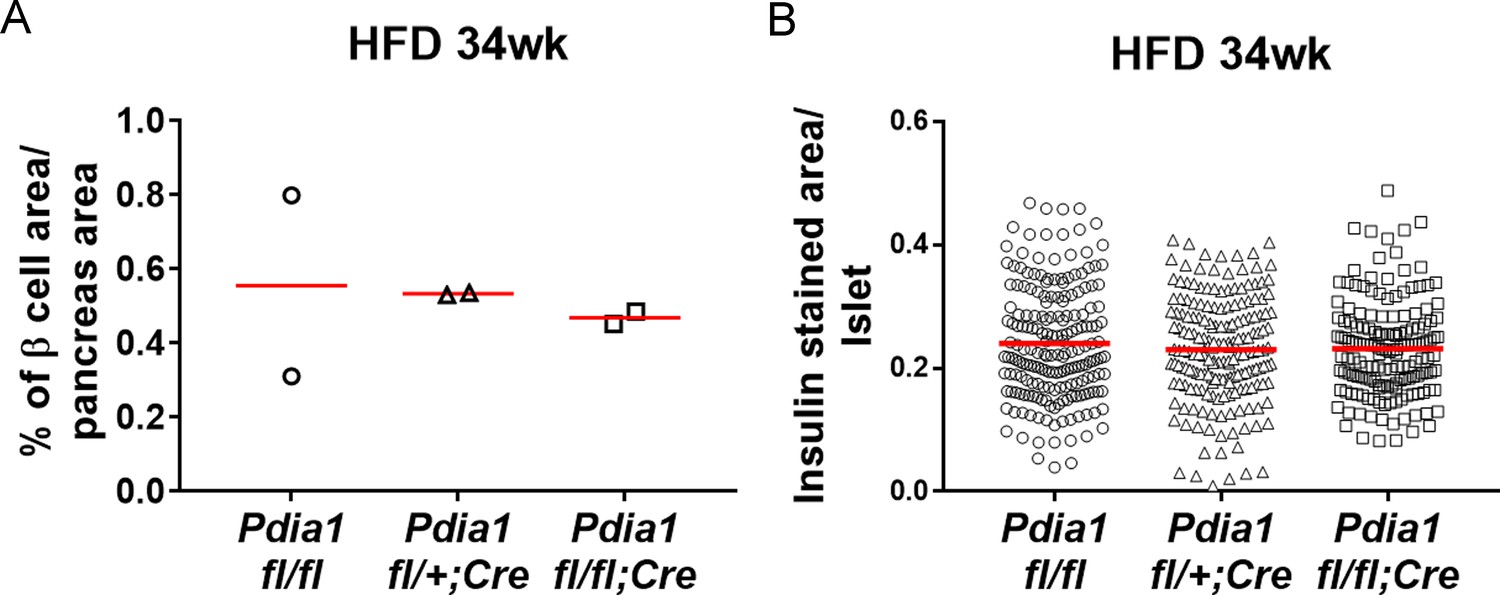
ß cell area relative to pancreas area and β cell number relative to islet area were not changed in ß cell-specific Pdia1 deleted male mice after 34 wks of HFD.
Pancreata were harvested, fixed in 4% PFA, and embedded in paraffin. For each pancreas three sections were prepared at 200 µm intervals and stained with guinea pig α-insulin antibody and DAPI. Images were taken by Aperio Imaging system. Insulin stained ß cell area, islet area and pancreas area were measured by Aperio Imagescope software. A. The percent of ß cell area relative to total pancreas area is shown. B. The number of insulin positive cells per islet is shown. Two mice for each genotype were combined and the mean value is indicated.
Figure 4
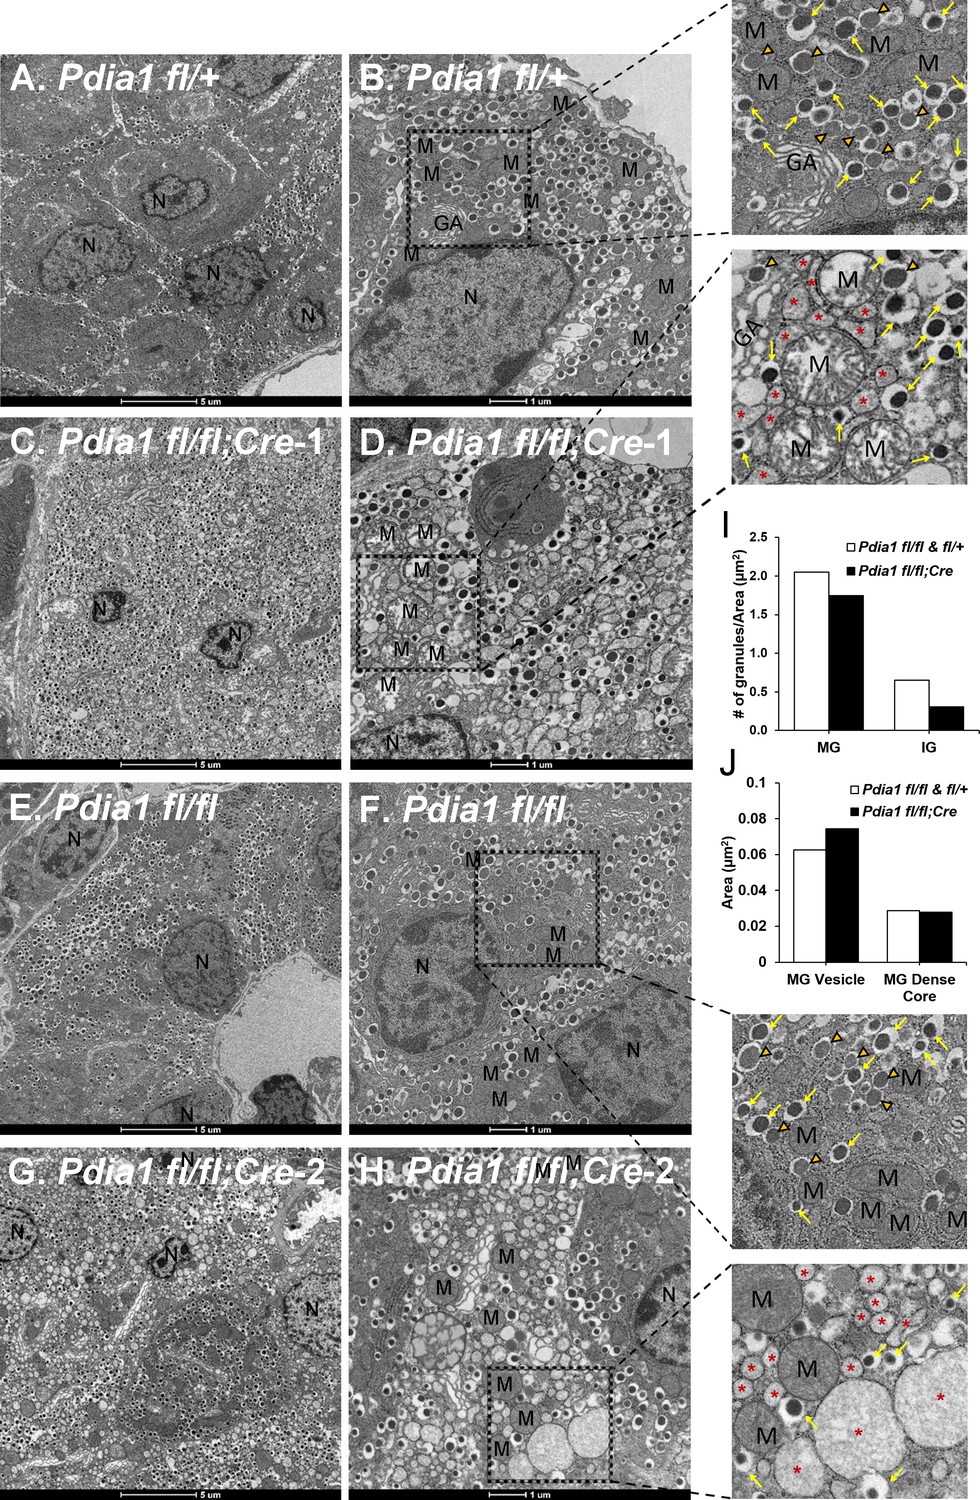
Pdia1 deletion induces morphological abnormalities including decreased insulin granule numbers, ER vesiculation and distention, mitochondrial swelling and nuclear condensation in ß cells.
(A–H). Transmission electron microscopy was performed on pancreata obtained from genetic controls (A, B, E, F) and KO (C, D, G, H) male mice after 40 wks of HFD. Images were obtained at 1900X (A, C, E, G) or 4800X (B, D, F, H) magnification. Scale bar represents 5 µm or 1 µm as indicated. Marked area is two times enlarged on the right side: N, nucleus; M, mitochondria; *, distended endoplasmic reticulum; GA, Golgi apparatus. Yellow arrows, mature granules. Orange filled open arrowheads, immature granules. (I) Pdia1 KO mice had reduced numbers of mature and immature granules. For each genotype 80–110 images were quantified. genetic controls; n = 3, KO; n = 2. Mean value is indicated. (J) Mature granule sizes were larger in Pdia1 KO mice compared to genetic controls without differences in mature granule dense core size. For each genotype, 40 images were quantified. genetic controls; n = 3, KO; n = 2.
Figure 5 with 3 supplements
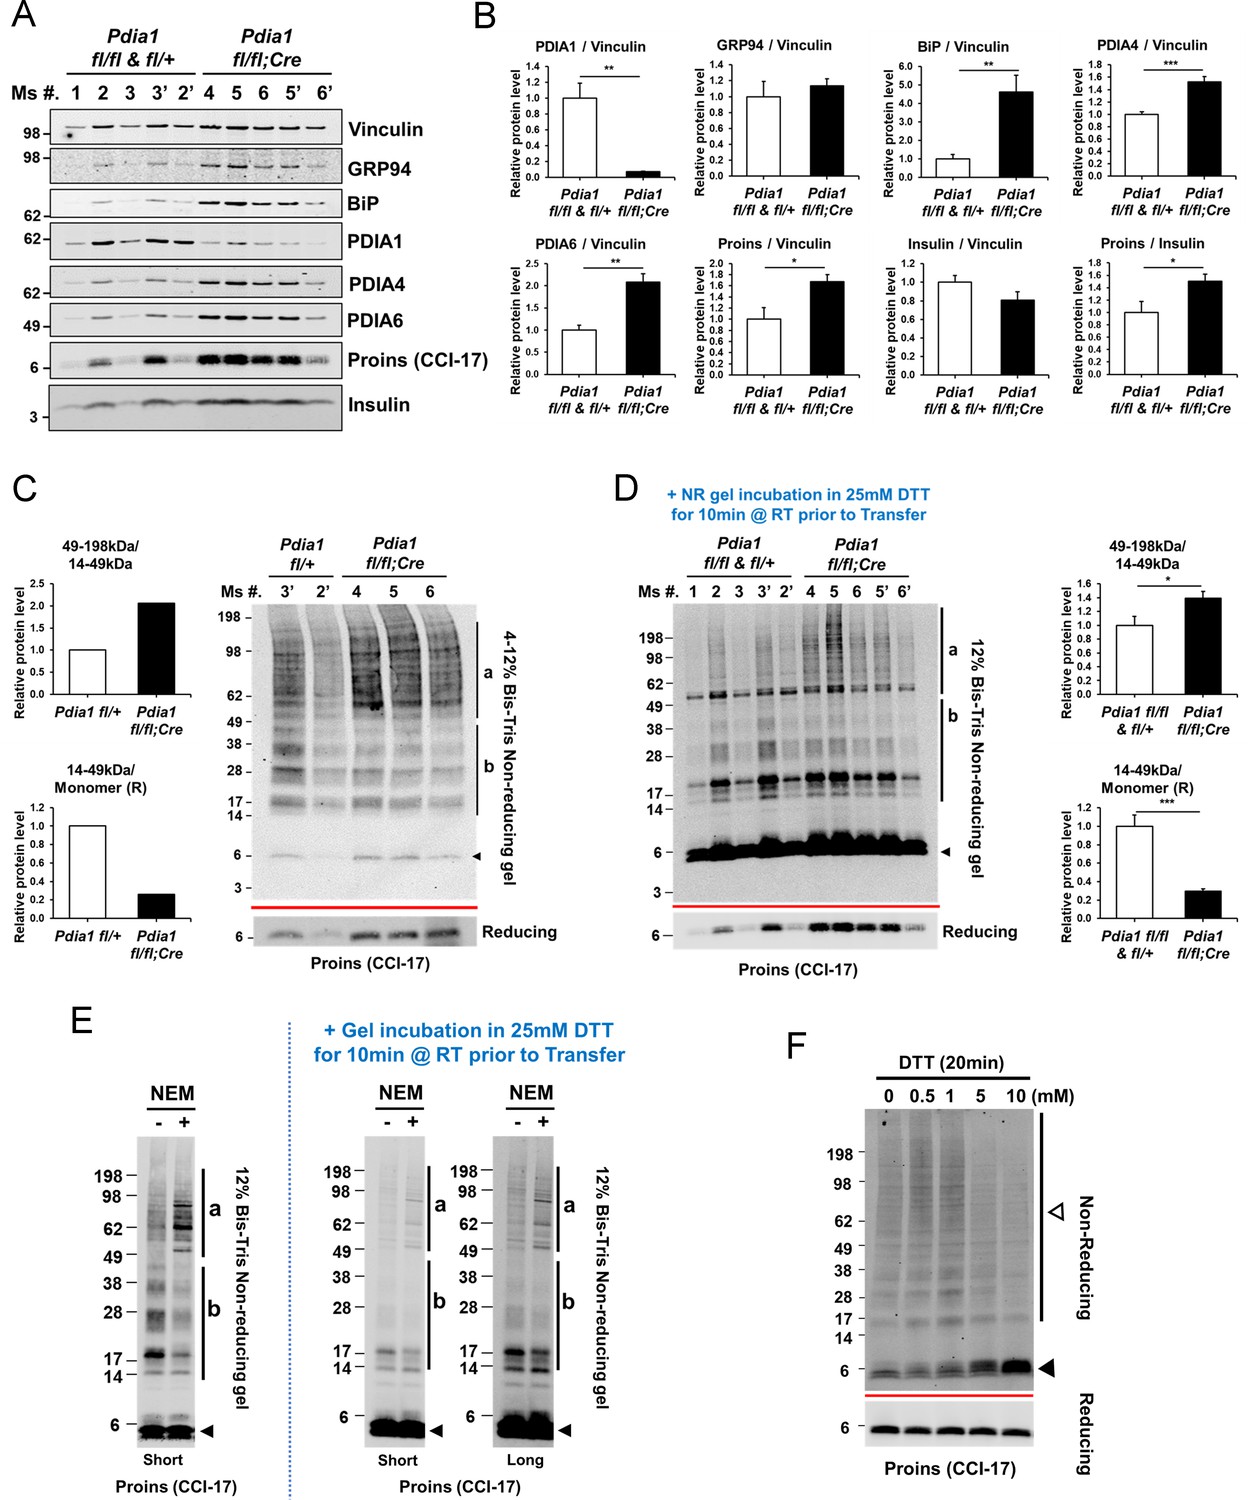
Pdia1 deletion in HFD fed mice increases islet steady state proinsulin to insulin ratio with accumulation of high molecular weight (HMW) proinsulin complexes.
(A, C) Western blotting was performed for murine islets isolated after HFD for 30 wks. After overnight recovery, islets were lysed and analyzed under reducing (A) or non-reducing (C, D) conditions by SDS-PAGE and Western blotting. Image exposed for a different time for reduced proinsulin (CCI-17) in (A) was used to represent the total proinsulin levels in (D). Six independent mice were analyzed and technical duplicates are indicated as’ on the top of gel. (B). Quantification of indicated proteins was performed under reducing conditions (A). Each value was normalized to vinculin. Proinsulin/insulin ratios were calculated based on the quantification of proinsulin and insulin species under reducing conditions (A). (C) Five samples from A were analyzed under non-reducing conditions on a 4–12% Bis-Tris SDS gel. The proinsulin blot under reducing conditions is under the red line. Left side. Quantification of HMW proinsulin complexes under non-reducing conditions is indicated. (C), left side, upper) The ratio of 49–198 kDa (a) to 14–49 kDa (b) proinsulin complexes is shown. (C), left side, lower) The ratio of 14–49 kDa (b) proinsulin complexes to proinsulin monomer under reducing conditions is shown. Mean value is indicated in graph. (D) The ten samples in A were analyzed under non-reducing conditions after the gel was incubated in 25 mM DTT for 10 min at RT prior to transfer. To control for variable transfer from a gradient gel, we used a fixed percentage gel (12% Bis-Tris SDS). Right side. Quantification is shown for HMW proinsulin complexes under non-reducing conditions. (D), right side, upper) The ratio of 49–198 kDa (a) to 14–49 kDa (b) proinsulin complexes is shown. (D), right side, lower) The ratio of 14–49 kDa (b) proinsulin complexes to proinsulin monomer under reducing conditions is shown. (A–D) genetic controls; n = 3, KO; n = 3 mice. Mean ± SEM, p<0.05*, p<0.01**, p<0.001***. (E) WT murine islets were treated with or without NEM and lysates were analyzed under non-reducing conditions. Equal numbers of islets were divided into two tubes. Left side islets were rinsed with cold-PBS and lysed on ice. Right side islets were rinsed with cold-PBS containing 20 mM NEM and lysed in lysis buffer containing 2 mM NEM. Samples were prepared alongside and lysates were boiled for 5 min. Equal amounts of lysates were loaded and analyzed with or without gel incubation in 25 mM DTT for 10 min at RT prior to transfer. Two different exposure time images (short, long) are shown after DTT incubation. (F) WT murine islets were treated with increasing concentrations of DTT for 20 min in culture at room temperature and then analyzed by non-reducing and reducing SDS-PAGE and Western blotting with proinsulin antibody (CCI-17). The range of oligomeric proinsulin species are identified by an open arrowhead and monomeric proinsulin is indicated by black arrowhead.
Figure 5—figure supplement 1
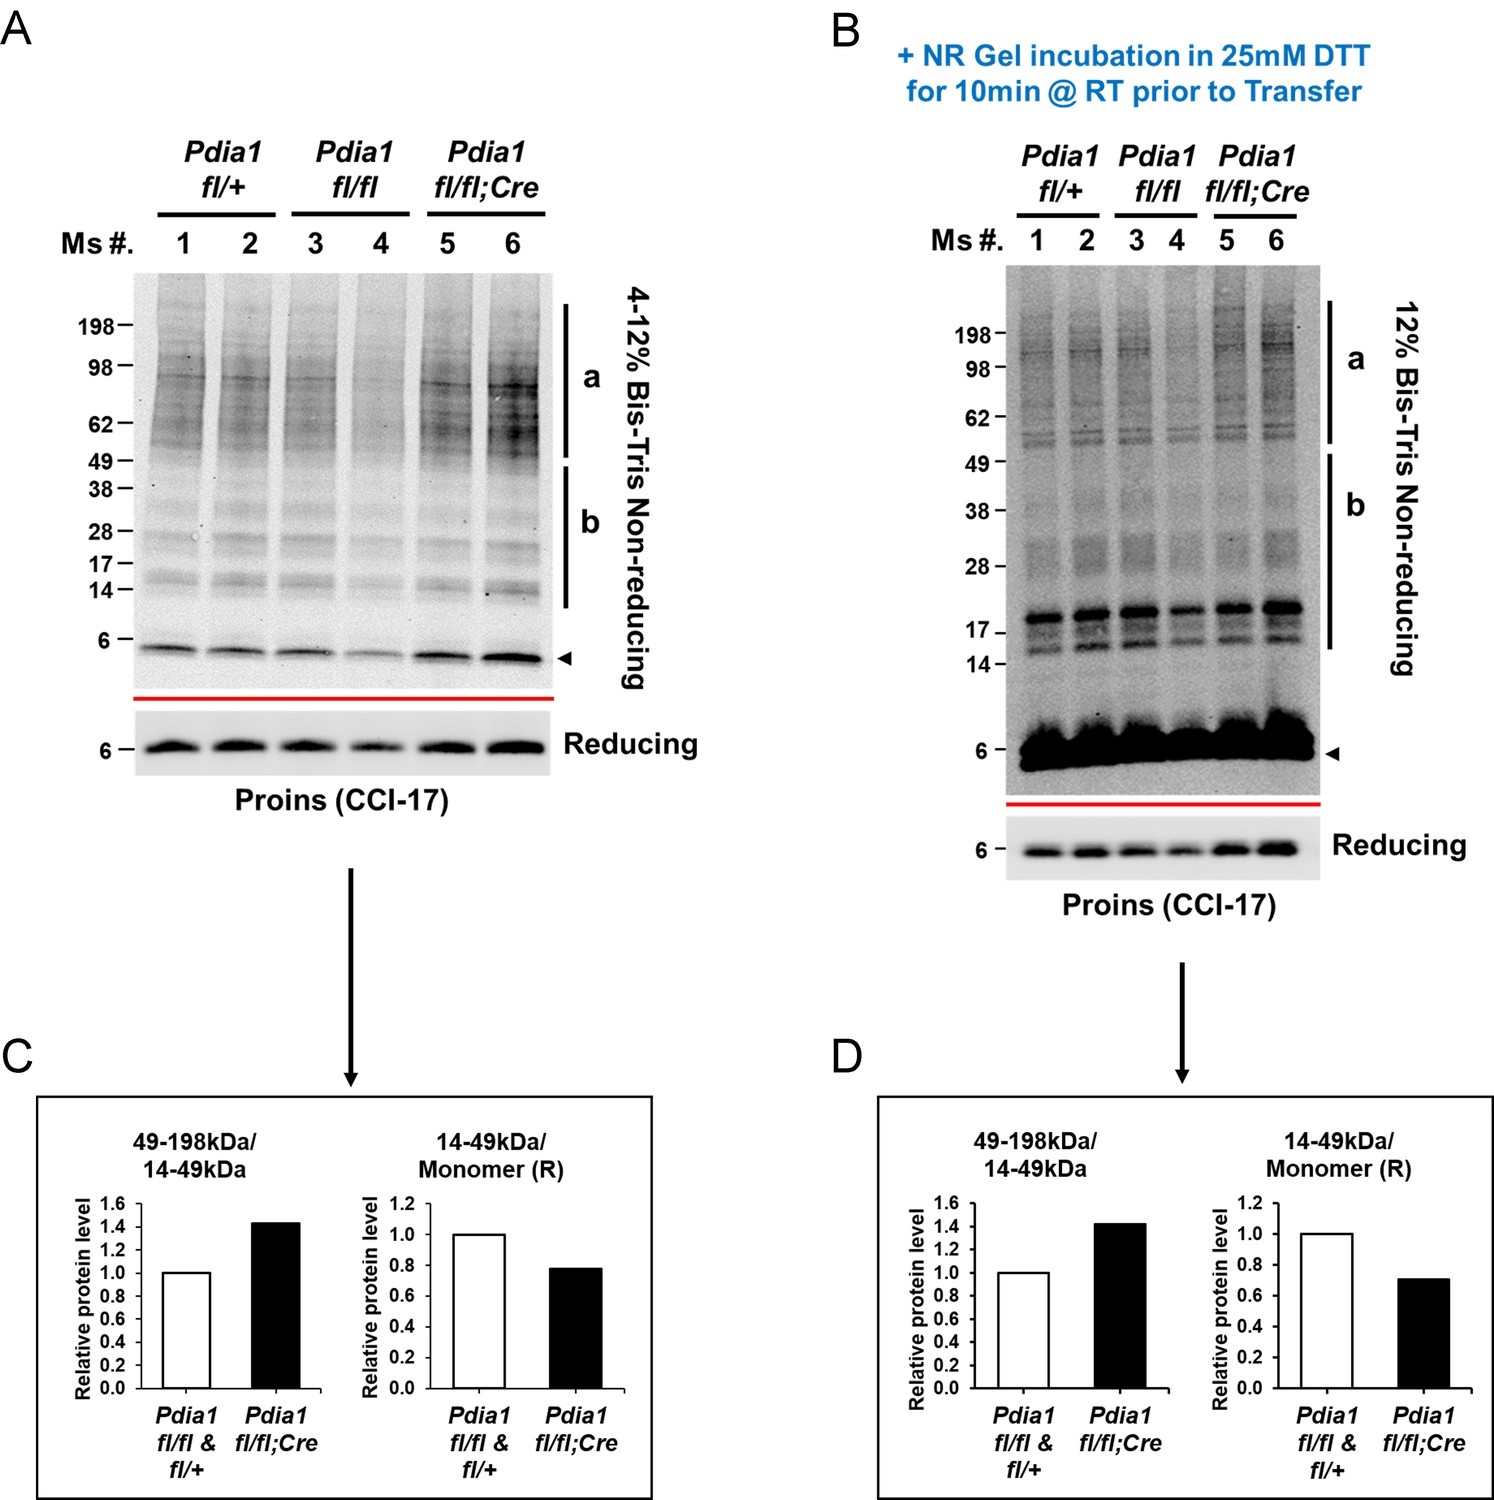
Pdia1 deletion increases accumulation of HMW proinsulin complexes under regular diet.
(A) Islets were isolated from female mice at 14 wks after Tam injection, as described in Figure 1C, and analyzed by Western blotting under non-reducing conditions. The longer exposed image of reduced proinsulin (CCI-17) in Figure 1C is shown to represent the total proinsulin levels. (B) The same amounts of lysates from A were analyzed under non-reducing conditions after the gel was incubated in 25 mM DTT for 10 min at RT prior to transfer. To avoid unequal transfer from a gradient gel, we used a fixed percentage gel (12% Bis-Tris SDS). The proinsulin blot under reducing conditions is located under the red line. (D) The quantification of disulfide-linked proinsulin complexes (B) is shown. The left side of (C–D) shows the ratio of 49–198 kDa (a) to 14–49 kDa (b) proinsulin complexes. The right side of (C–D) shows the ratio of 14–49 kDa (b) proinsulin complexes to proinsulin monomer under reducing conditions.
Figure 5—figure supplement 2
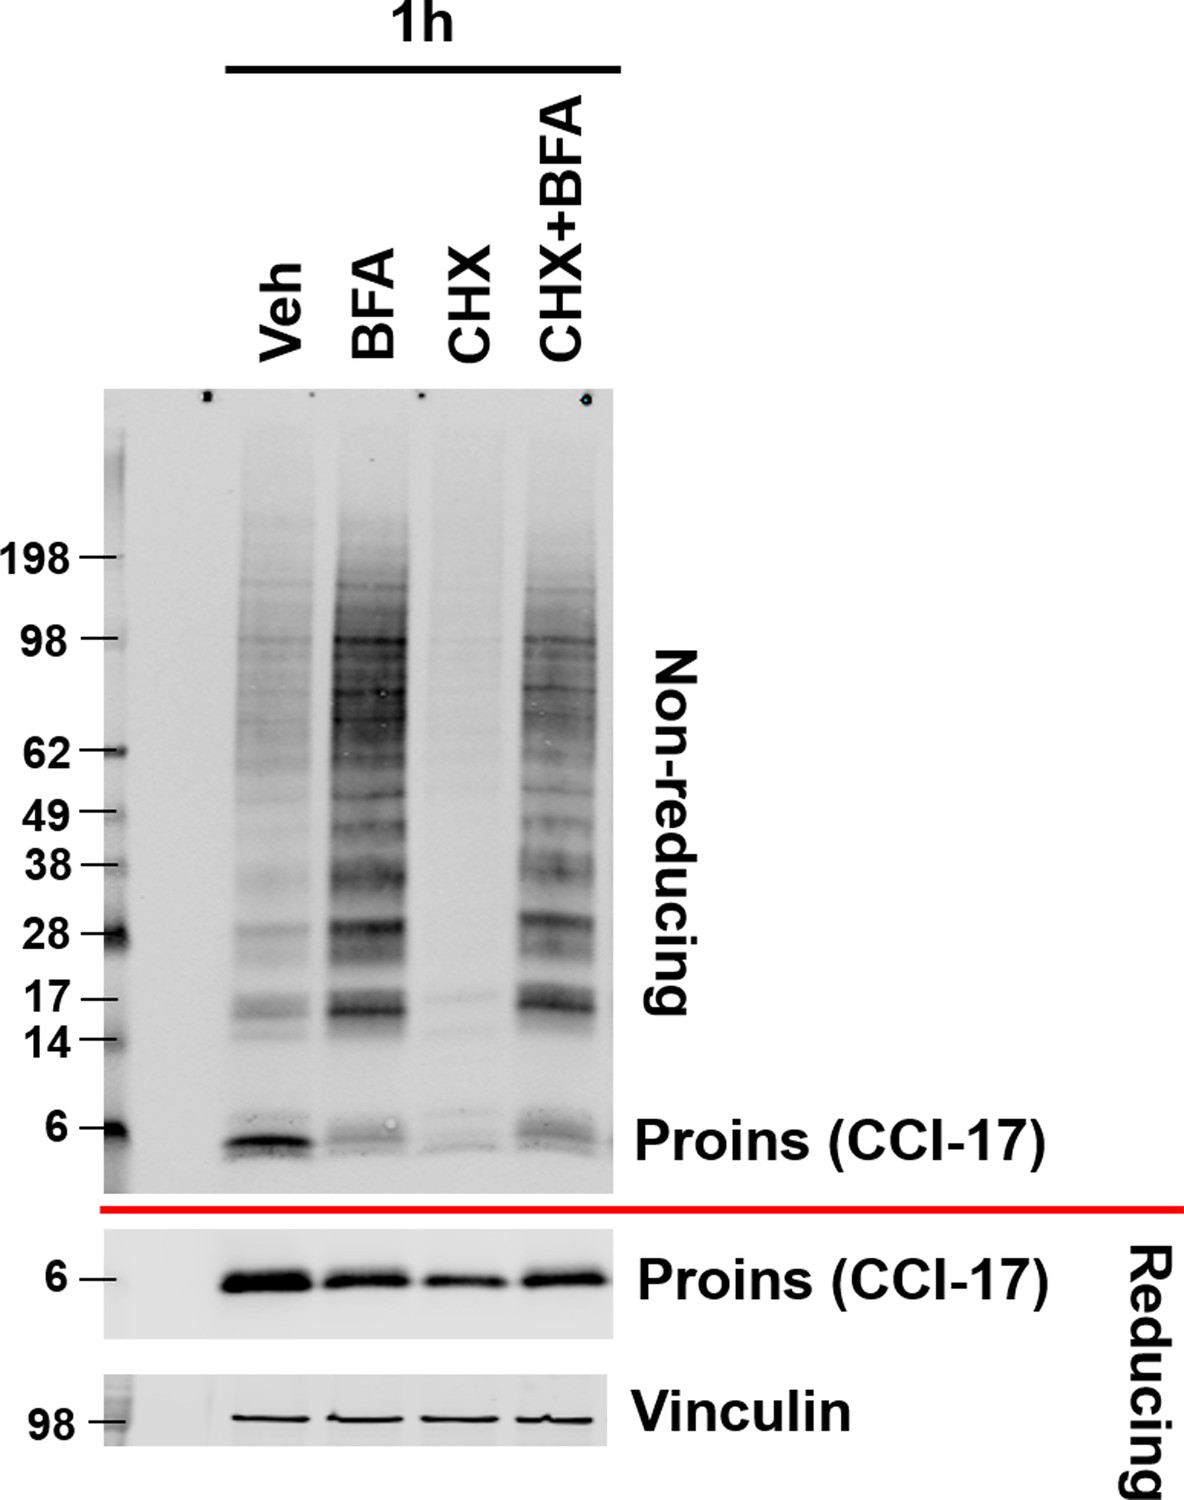
Inhibition of ER to Golgi trafficking increases proinsulin disulfide linked HMW complex formation.
After overnight recovery, WT islets were incubated in media containing brefeldin A (BFA, 5 µg/ml) and/or cycloheximide (CHX, 100 μg/ml) for 1 hr at 37°C and then analyzed by non-reducing and reducing SDS-PAGE and Western blotting with proinsulin antibody (CCI-17).
Figure 5—figure supplement 3
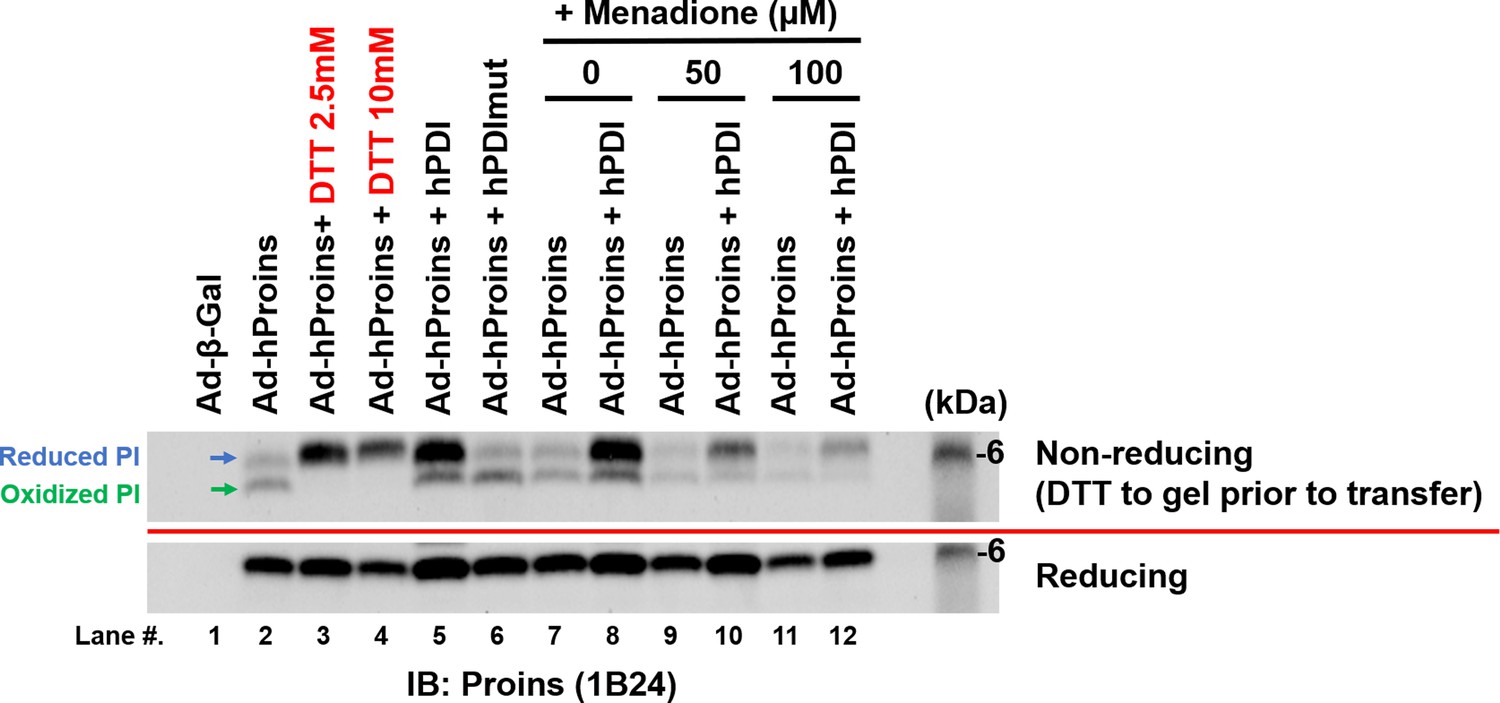
PDIA1 overexpression reduces proinsulin.
Adenoviruses that express human proinsulin (Ad-hProins) or human PDIA1 (Ad-hPDI) or catalytically inactive PDIA1 mutant (Ad-hPDImut) were infected into WT MEFs. After 48 hr, cells were treated with DTT (2.5, 5 mM) for 20 min or Menadione (50, 100 μM) for 1 hr. Lysates were analyzed by non-reducing and reducing SDS-PAGE and Western blotting with anti-human proinsulin antibody (1B24). Unfortunately, this antibody for human proinsulin does not recognize HMW proinsulin aggregates.
Figure 6 with 1 supplement
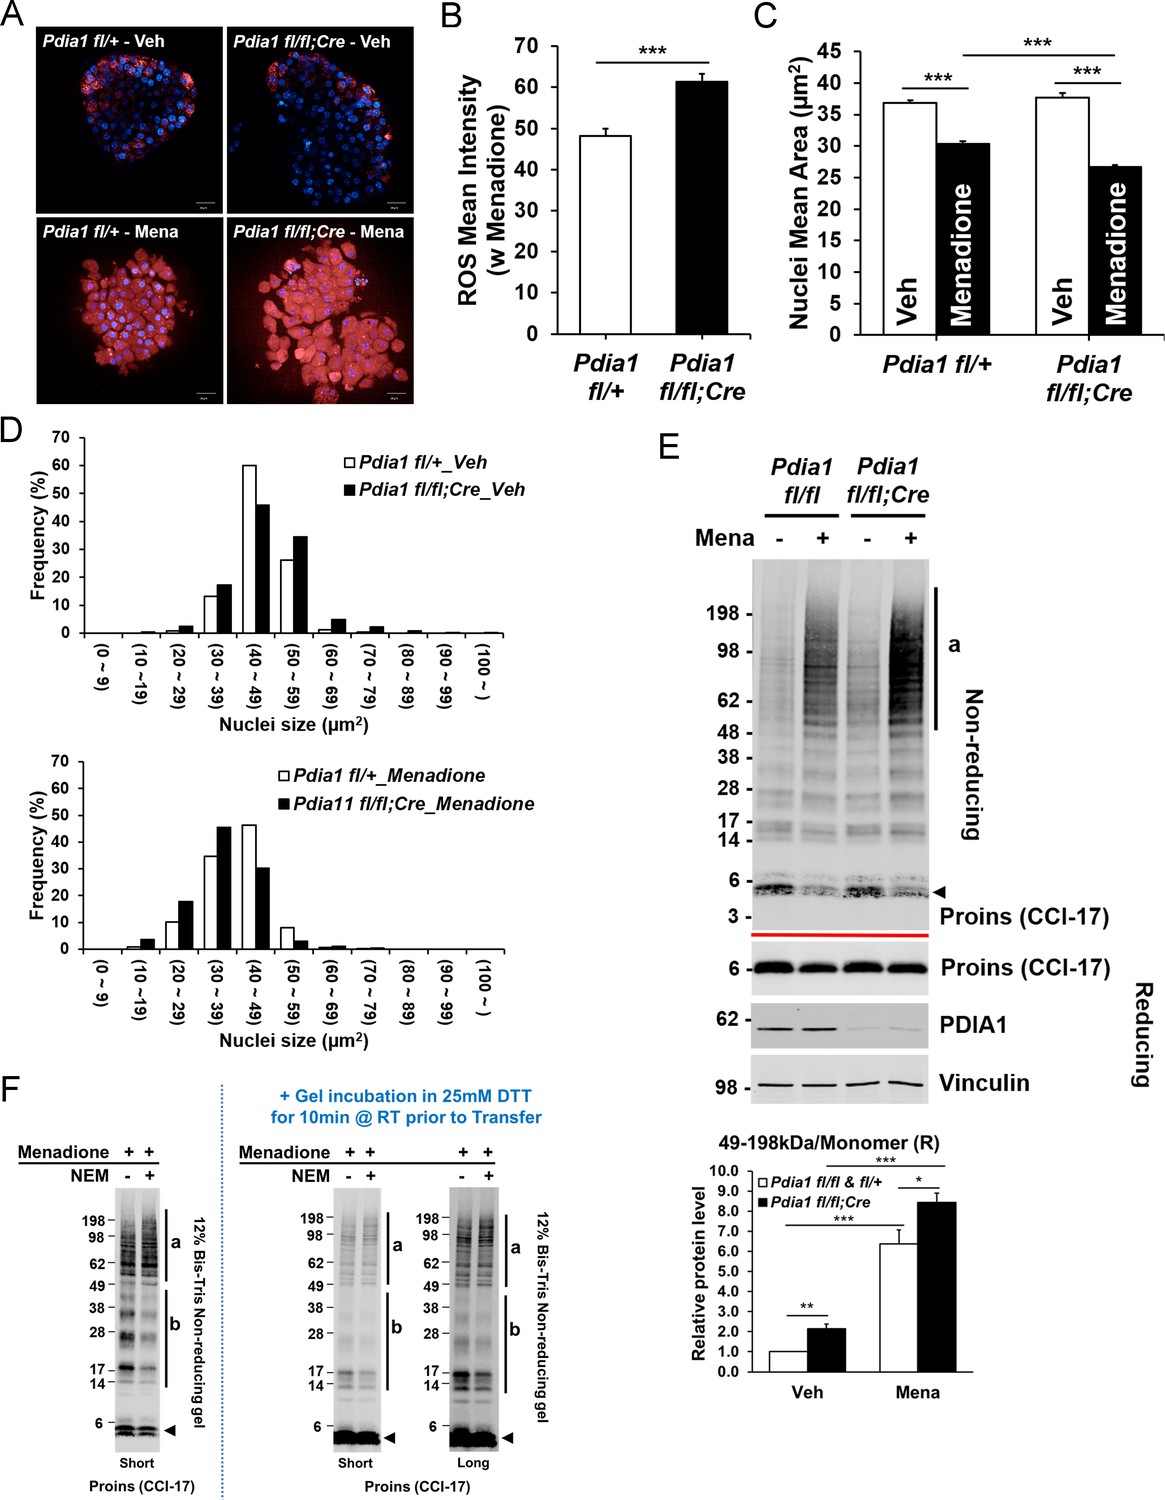
Pdia1 deletion increases sensitivity to menadione oxidant: Increased ROS, nuclear condensation, and HMW proinsulin complexes were observed in menadione-treated KO islets.
A. Islets isolated from mice after 30 wks HFD were treated with or without Menadione (10 µM, 3 hr) and co-stained with CellROX Deep Red (red) and Hoechst 33342 (blue). Live islet images were obtained by an Opera Phenix high content screening system (63X objective lens) and seven z-stack images (1 µm interval) were combined. Scale bar, 20 μm. genetic controls; n = 3, KO; n = 3. (B) Quantification of ROS mean intensity is shown. CellROX Deep Red mean intensity (divided by area) was measured by image J software. Mean ± SEM, p<0.001***. (C). Quantification of nuclear mean area (µm2) measured in Hoechst 33342 stained images by ImageJ software is shown. Mean ± SEM, p<0.001***. (D). Histogram analysis of nuclear sizes is shown. Percent frequencies are indicated in the graph. (E) Western blot of islets isolated from mice after 37 wks of HFD by SDS-PAGE under reducing and non-reducing conditions is shown. After overnight recovery, islets were treated with menadione (100 µM) for 1 hr. Islet preparations from five independent control and KO mice were performed and representative images are shown. Quantification of the ratio of HMW proinsulin complexes (a) to monomeric proinsulin under reducing conditions is shown in graph (lower). Mean ± SEM, p<0.05*, p<0.01**, p<0.001***. Controls; n = 5, KO; n = 5 mice. (F) WT murine islets were treated with Menadione (100 µM) for 1 hr, treated with or without NEM as in Figure 5E, and lysates were prepared and analyzed under non-reducing conditions.
Figure 6—figure supplement 1
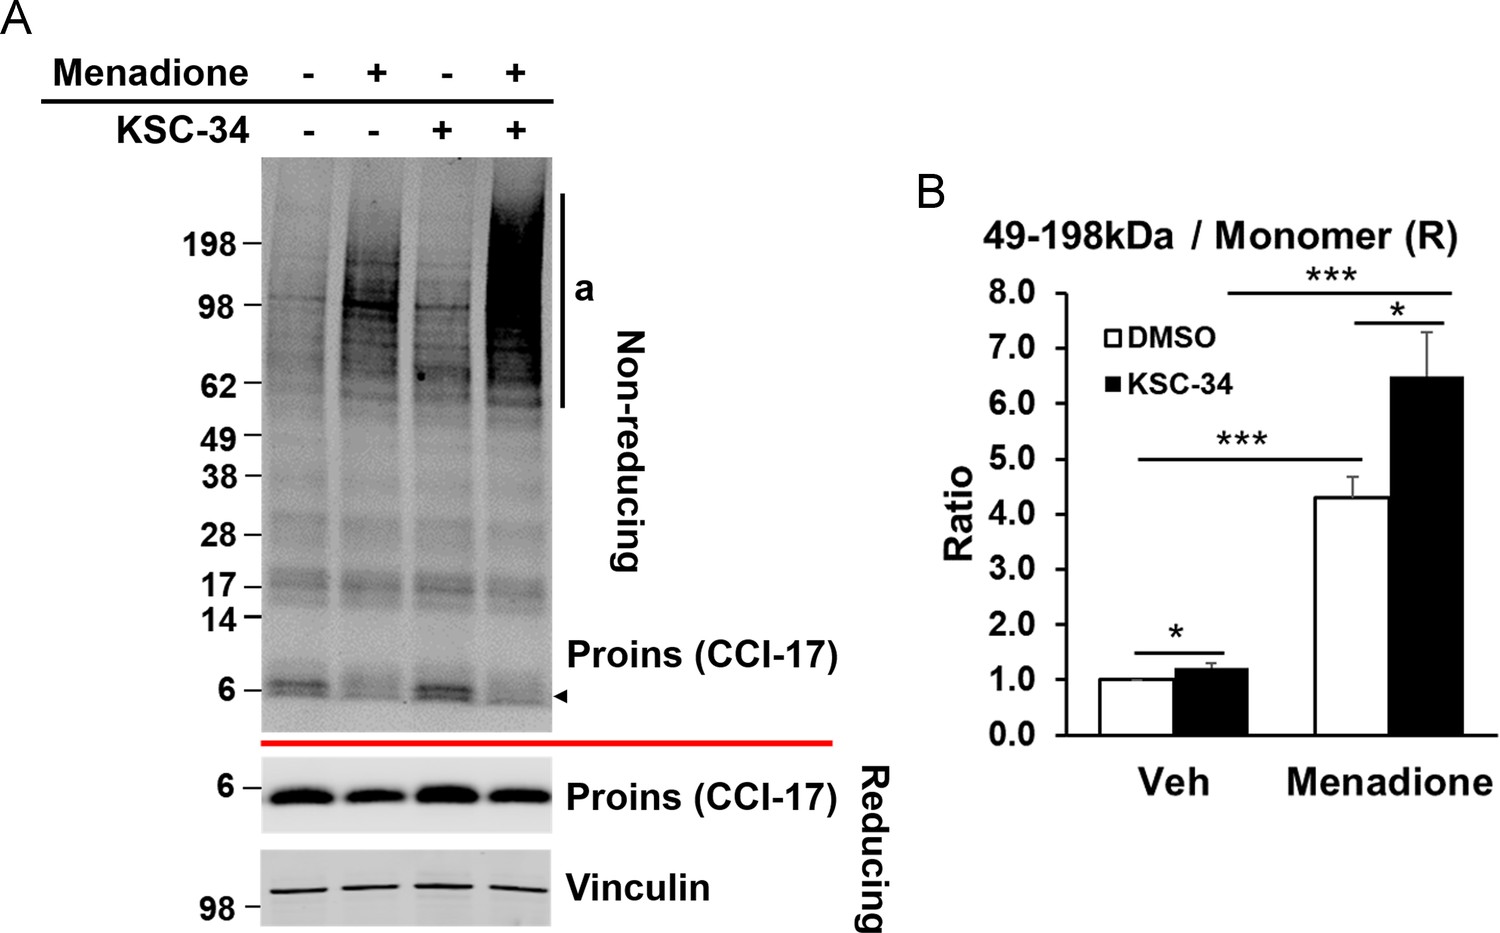
PDIA1 inhibitor KSC-34 recapitulates effects of Pdia1 deletion.
WT murine islets were treated with menadione in the presence or absence of 30 μM KSC-34 for 3 hr and then treated with menadione (100μM) for 1 hr at 37°C. Five independent experiments were performed and representative results are shown. (A) Islet lysates were prepared and analyzed by non-reducing and reducing SDS-PAGE for Western blotting with CCI-17 antibody. (B) Quantification shows the proportion of HMW complexes (49–198 kDa) relative to the amount of reduced proinsulin monomer. Mean ± SEM, p<0.05*, p<0.01**, p<0.001***. Controls; n = 5, KO; n = 5 mice.
Figure 7
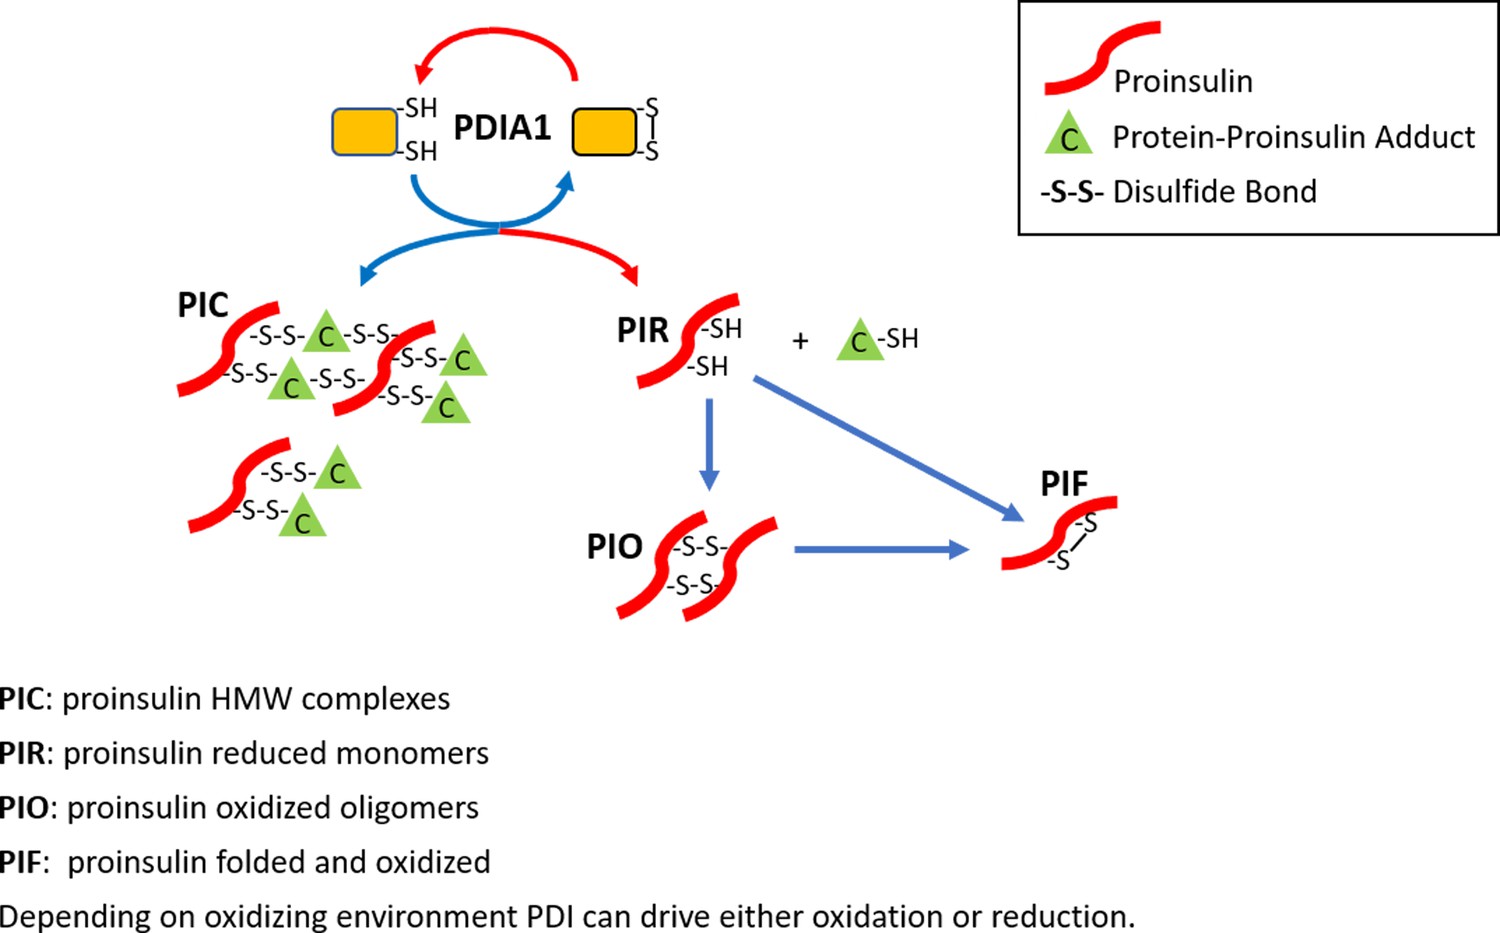
The role of PDIA1 in proinsulin disulfide bond formation.
Here, we show that PDIA1 is not required but increases the efficiency of proinsulin maturation, possibly by reducing HMW proinsulin complexes. In the absence of PDIA1, disulfide bond formation, reduction and/or isomerization in proinsulin are inadequate during increased demand so HMW proinsulin complexes accumulate in the ER upon metabolic pressure, such as a HFD. The figure depicts the formation of proinsulin HMW complexes with cellular proteins and the role of PDIA1 in interconversions to reduced proinsulin with subsequent oxidation to dimer/oligomeric proinsulin and oxidized folded proinsulin.
Tables
Key resources table
| Reagent type (species) or resource | Designation | Source or reference | Identifiers | Additional information |
|---|---|---|---|---|
| Gene (M. musculus) | Pdia1/P4hb | NA | MGI:97464 | |
| Strain, strain background (M. musculus) | Pdia1 fl/fl | Hahm et al., 2013 | ||
| Strain, strain background (M. musculus) | RIP-CreERT | Dor et al., 2004 | ||
| Strain, strain background (M. musculus) | Pdia1 fl/fl;RIP-CreERT | this paper | C57BL/6 mice with Pdia1 floxed alleles were obtained from Dr. J Cho (Univ. of Illinois-Chicago) and crossed with Rat Insulin Promoter (RIP-CreERT) transgenic mice. Congenic Pdia1 gene floxed littermates with or without the CreERT transgene were used for in vivo experiments. | |
| Cell line (M. musculus) | WT MEF | this paper | WT MEF | Freshly prepared primary WT MEFs prior to passage #5 were used for experiments. |
| Adenovirus | human PDI | Wang et al., 2012 | ||
| Adenovirus | human PDImut | Wang et al., 2012 | ||
| Adenovirus | human Proins | this paper | Human proinsulin was cloned into the pAd Easy system. | |
| Antibody | Mouse monoclonal anti-Vinculin | Proteintech | Cat. #: 66305–1-lg | WB (1:2000) |
| Antibody | Rabbit monoclonal anti-GRP94 | Cell signaling Technology | Cat. #: 20292P | WB (1:1000) |
| Antibody | Mouse monoclonal anti-BiP | BD Biosciences | Cat. #: 610979 | WB (1:1000) |
| Antibody | Rabbit polyclonal anti-PDIA1 | Proteintech | Cat. #: 11245–1-AP | WB (1:1000), IHC (1:200) |
| Antibody | Rabbit polyclonal anti-PDIA4 | Proteintech | Cat. #:14712–1-AP | WB (1:1000) |
| Antibody | Rabbit polyclonal anti-PDIA6 | Proteintech | Cat. #:18233–1-AP | WB (1:1000) |
| Antibody | Mouse monoclonal anti-Proinsulin | HyTest Ltd. | Cat. #: 2PR8 (Mabs: CCI-17) | WB (1:10000), IHC (1:200) |
| Antibody | Guinea pig polyclonal anti-Insulin | this paper | Produced in house WB (1:2000), IHC (1:200) | |
| Antibody | Mouse monoclonal anti-Glucagon | Abcam | Cat. #: K79bB10 | IHC (1:200) |
| Antibody | IRDye 800CW Goat anti-Mouse IgG (H + L) | Li-Cor | P/N: 926–32210 | WB (1:5000) |
| Antibody | IRDye 680RD Goat anti-Mouse IgG (H + L) | Li-Cor | P/N: 926–68070 | WB (1:5000) |
| Antibody | IRDye 800CW Goat anti-Rabbit IgG (H + L) | Li-Cor | P/N: 926–32211 | WB (1:5000) |
| Antibody | IRDye 680RD Goat anti-Rabbit IgG (H + L) | Li-Cor | P/N: 926–68071 | WB (1:5000) |
| Antibody | IRDye 800CW Donkey anti-Guinea Pig IgG (H + L) | Li-Cor | P/N: 926–32411 | WB (1:5000) |
| Antibody | IRDye 680RD Donkey anti-Guinea Pig IgG (H + L) | Li-Cor | P/N: 926–68077 | WB (1:5000) |
| Antibody | Alexa Fluor 488 goat anti-rabbit IgG | Invitrogen | Cat. #: A-11008 | IHC (1:500) |
| Antibody | Alexa Fluor 488 goat anti-mouse IgG | Invitrogen | Cat. #: A-11001 | IHC (1:500) |
| Antibody | Alexa Fluor 594 goat anti-mouse IgG | Invitrogen | Cat. #: A-11005 | IHC (1:500) |
| Antibody | Alexa Fluor 594 goat anti-guinea pig IgG | Invitrogen | Cat. #: A-11076 | IHC (1:500) |
| Commercial assay or kit | Mercodia Rat/Mouse Proinsulin ELISA | Mercodia | 10-1232-01 | |
| Commercial assay or kit | Mercodia Mouse Insulin ELISA | Mercodia | 10-1247-01 | |
| Commercial assay or kit | CellROX Deep Red reagent | Molecular Probes | C10422 | |
| Chemical compound, drug | DTT | Roche diagnostics | Product #.3117006001 | |
| Chemical compound, drug | Menadione | AdipoGen Life Science | AG-CR1-3631-G001 | |
| Chemical compound, drug | Cycloheximide | Sigma-Aldrich | C7698 | |
| Chemical compound, drug | Brefeldin A | Cell signaling Technology | Cat. #: 9972 | |
| Chemical compound, drug | KSC-34 | Cole et al., 2018 | Obtained from Dr. RL Wiseman (The Scripps Research Institute, La Jolla, CA) |
Additional files
-
Transparent reporting form
- https://doi.org/10.7554/eLife.44528.016
Download links
A two-part list of links to download the article, or parts of the article, in various formats.
Downloads (link to download the article as PDF)
Open citations (links to open the citations from this article in various online reference manager services)
Cite this article (links to download the citations from this article in formats compatible with various reference manager tools)
PDIA1/P4HB is required for efficient proinsulin maturation and ß cell health in response to diet induced obesity
eLife 8:e44528.
https://doi.org/10.7554/eLife.44528


