Sensory perception drives food avoidance through excitatory basal forebrain circuits
- Baylor College of Medicine, United States
- Texas Children’s Hospital, United States
- University of Texas Health Science Center, United States
Figures
Figure 1 with 1 supplement
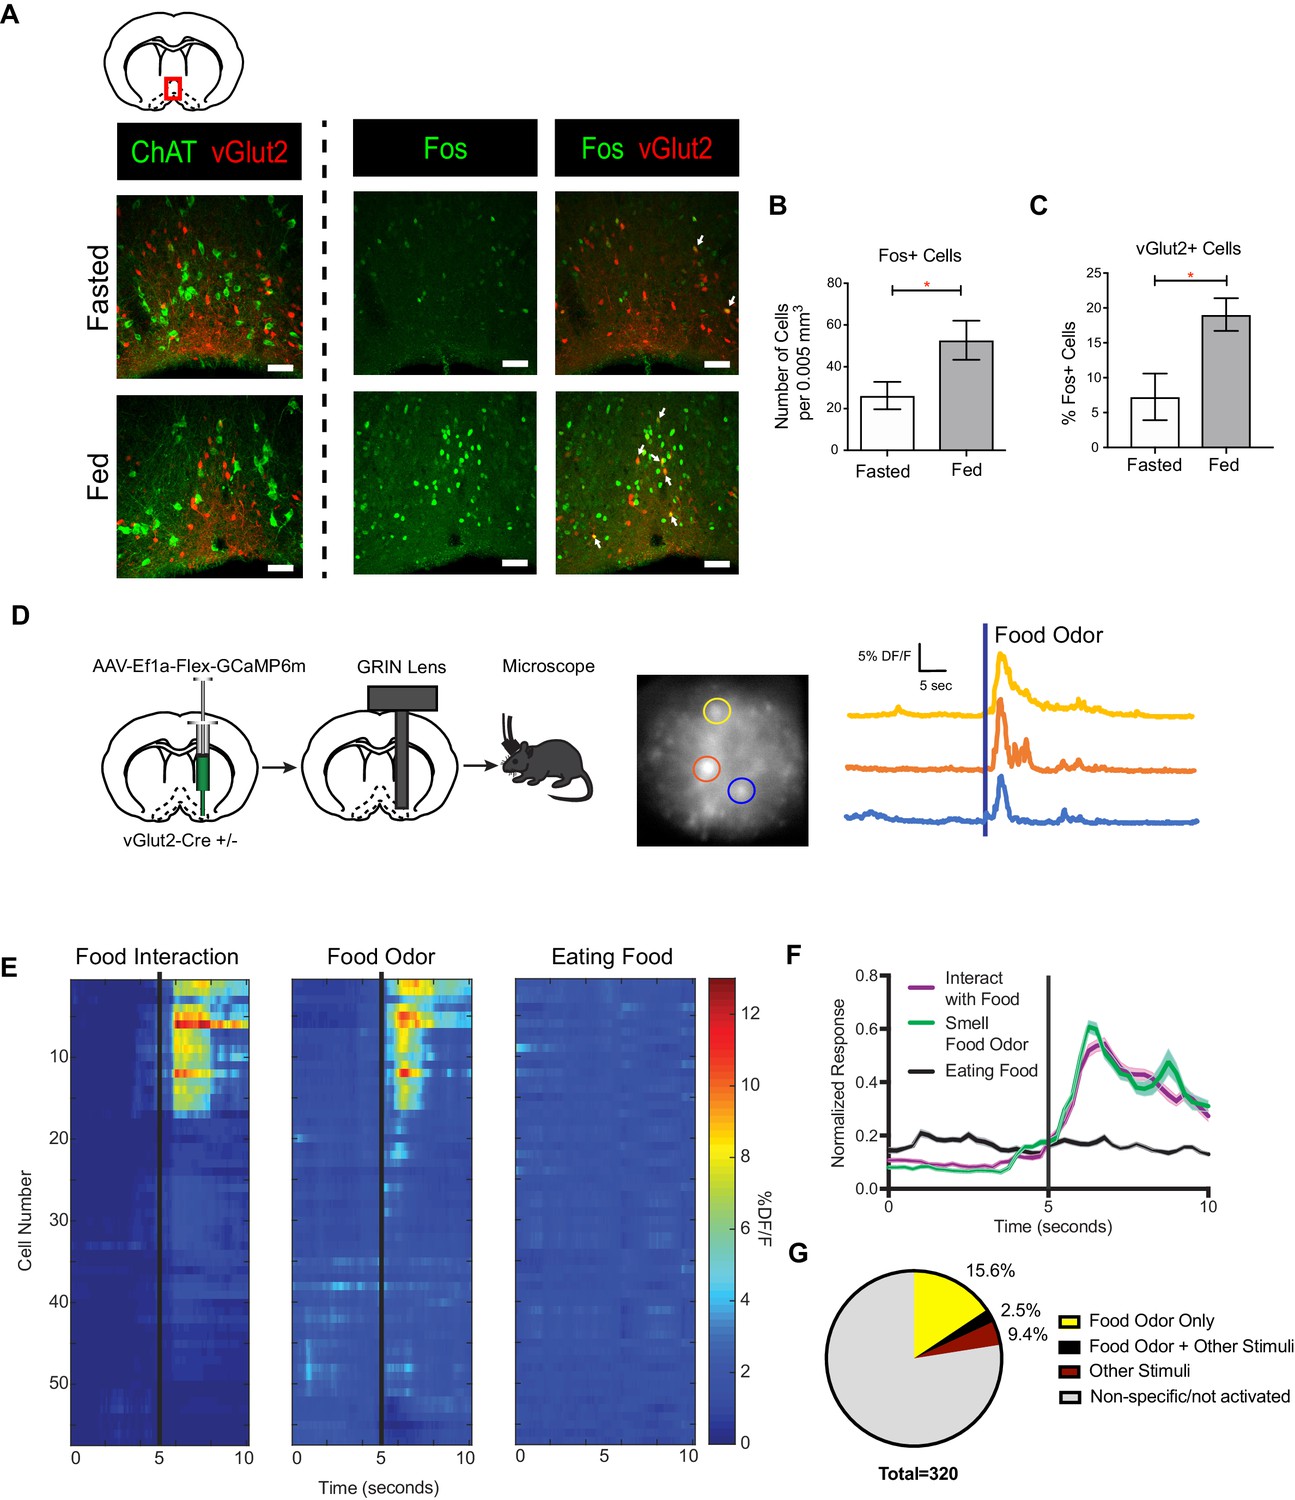
vGlut2BF neurons are activated by feeding and food associated odors.
(A) Coronal diagram showing slice location. Fos and ChAT immunohistochemistry in vGlut2-Cre +/- animals injected with AAV-Flex-mRuby to label vGlut2 +neurons. Scale bar = 50 µm. (B) Quantification of Fos positive cells in diagonal band of Broca (DBB) between fed and fasted animals. *p<0.05, student’s t-test, n = 3 animals per group. (C) Percentage of Fos positive DBB VGlut2 +cells in either fasted or fed state. *p<0.05, student’s t-test. n = 3 animals per group. scale bar = 50 µm. (D) Schematic of viral injection and GRIN lens implantation, example raw image 350 µm x 350 µm, and individual neuronal traces showing changes in GCaMP6m calcium fluorescence in corresponding regions of interest when sniffing food odor. (E) Changes in calcium-mediated fluorescence of 56 neurons from one animal under multiple conditions for one trial. The same cell is in the same row across each condition. Black bars indicate stimulus onset. (F) Combined normalized calcium fluorescence activity from five mice, n = 50 neurons showing neuronal activation to food interaction and/or smelling food odor. (p<0.05). (G) Percentage of total neurons recorded that showed activation to different stimuli. Other Stimuli include physical touch, grooming, and walking.
Figure 1—figure supplement 1
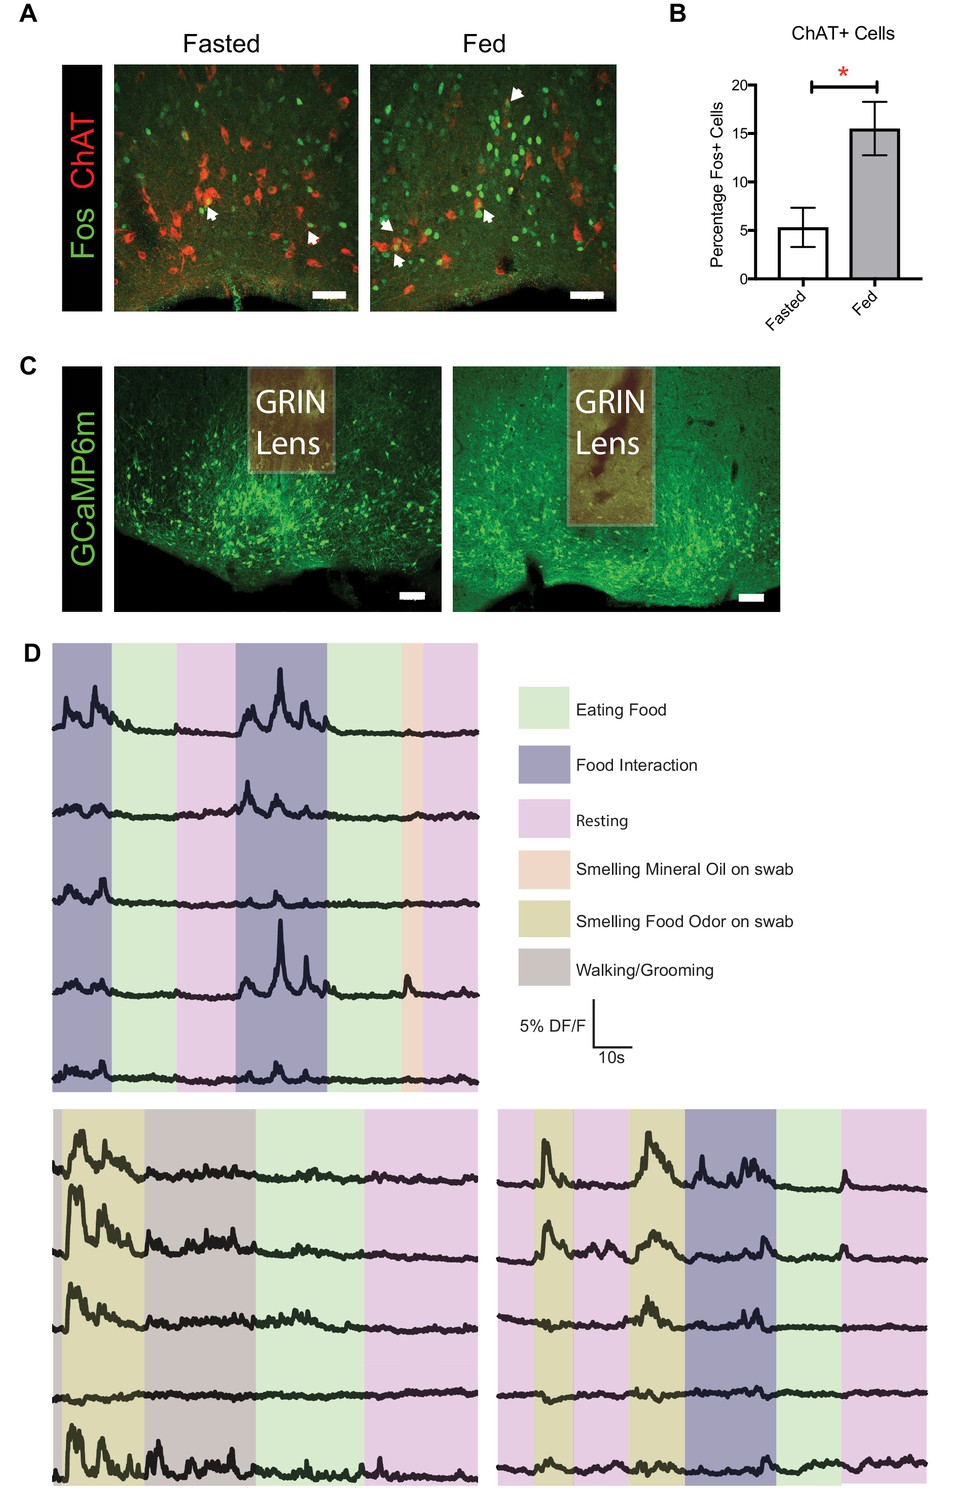
CholinergicBF neurons are activated by feeding, and vGlut2BF neuron activation patterns.
(A) Fos and ChAT immunohistochemistry in fasted and fed mice. (B) Percentage of cholinergicBF cells expressing Fos either fasted or fed states. *p<0.05, student’s t-test. n = 3 animals per group. data are mean ± SEM. scale bar = 50 µm (C) Representative images from vGlut2-Cre mice virally injected with AAV Flex-GCaMP6m, implanted with GRIN lenses, and showing the lens track. (D) Example annotated calcium traces from vGlut2BF neurons in freely behaving animals.
Figure 2 with 2 supplements
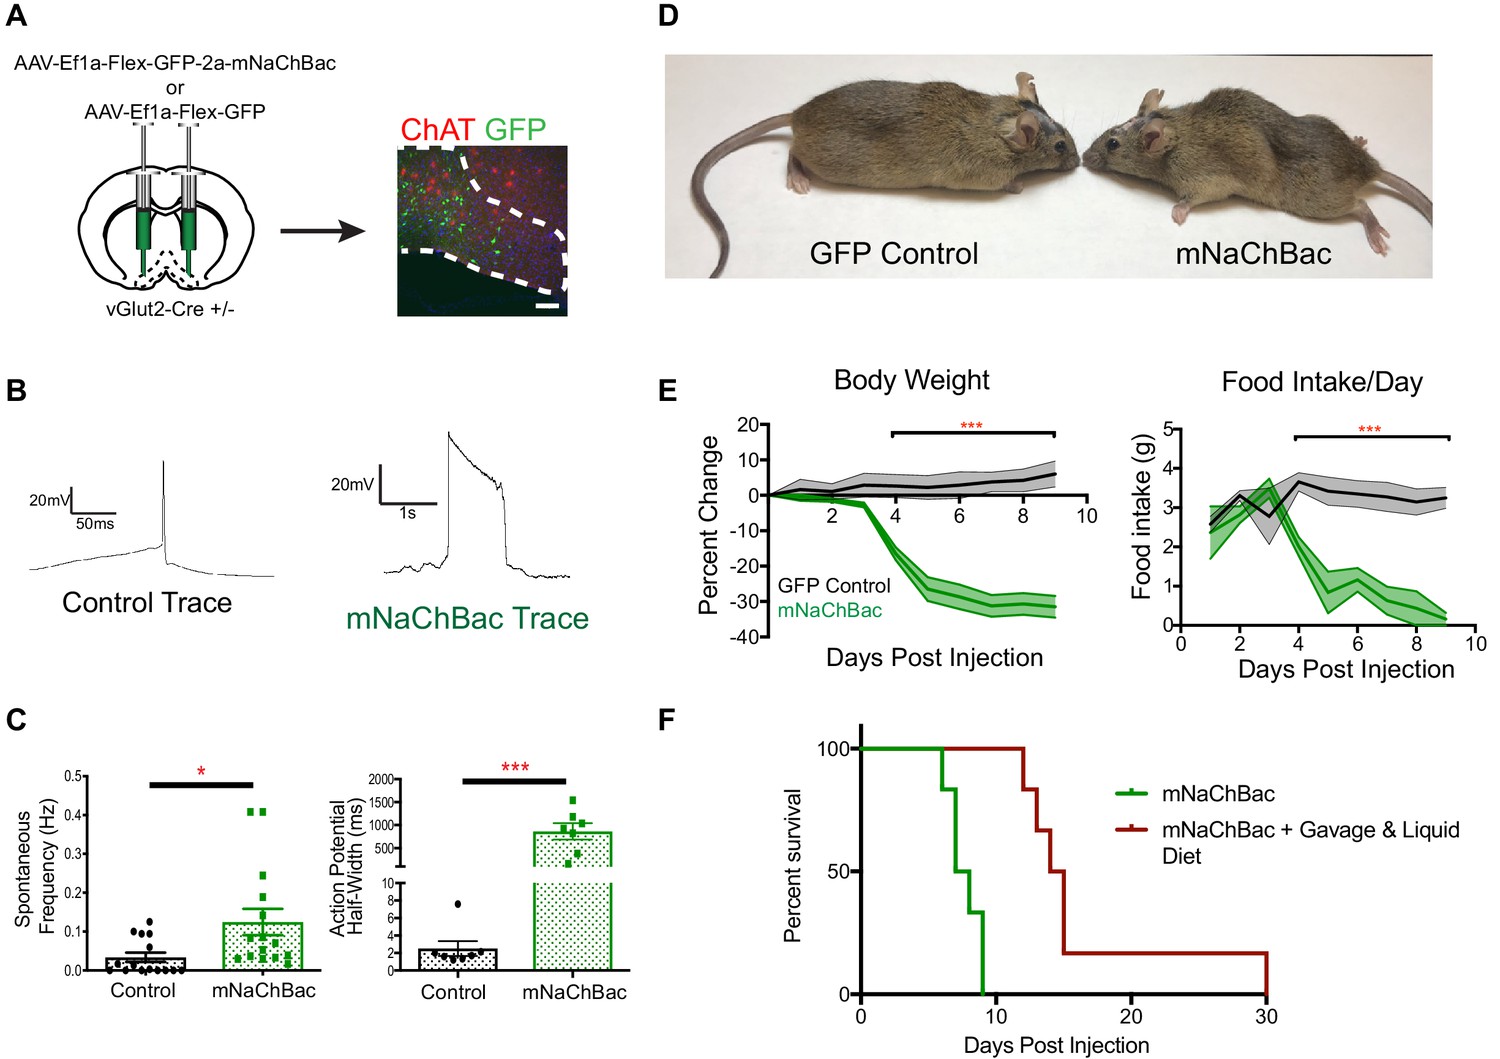
Over-activation of vGlut2BF neurons using mNaChBac results in hypophagia, weight loss, and starvation.
(A) Coronal brain section showing experimental procedure, viral labeling using eGFP-p2a-mNaChBac, and immunohistochemistry for ChAT in the basal forebrain. Scale bar = 100 µM. (B) Example action potential traces from vGlut2BF neurons 7 days post-injection of mNaChBac virus. (C) Spontaneous frequency and action potential half width between control vGlut2BF and mNaChBac vGlut2BF neurons 7 days post injection. *p<0.05, ***p<0.001. n = 14 neurons from six animals for frequency and n = 7 neurons from three animals for action potential half-width. (D) Representative vGlut2-Cre ± GFP (control) and mNaChBac injected animals 7 days post injection. (E) Percentage change in body weight from baseline (average 3 days prior to viral injection) and total daily food intake. ***p<0.001, n = 8 animals 4 male/4 female per group. Data are mean ± SEM. (F) Survival curve showing percent animals surviving post injection. n = 6 animals per group. Log-Rank Mantel-Cox test p<0.001. Gehan-Breslow-Wilcoxon test, p<0.01. Median survival 7.5 days vs 14.5 days.
Figure 2—figure supplement 1
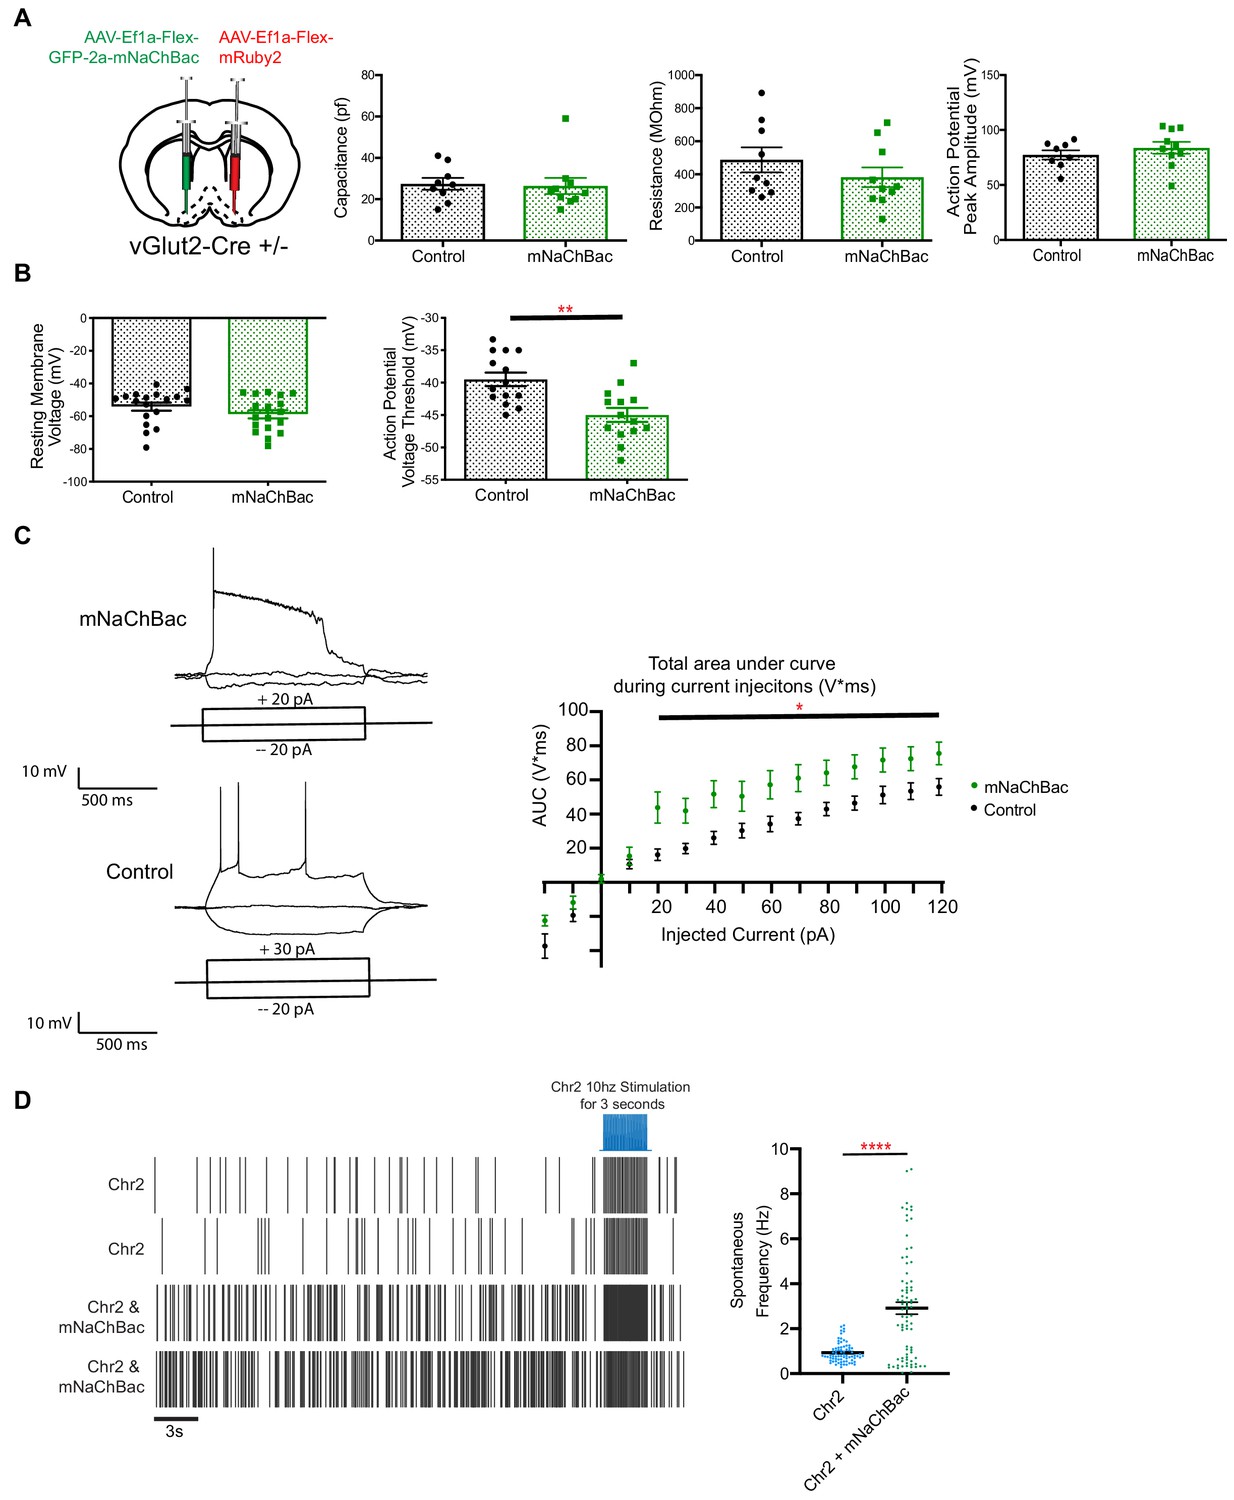
Electrophysiological properties of vGlut2BF neurons expressing mNaChBac.
(A) Membrane properties of vGlut2BF neurons expressing either mNaChBac or mRuby2 as a control, 7 days post injection. No statistical differences were observed in basic biophysical properties between mNaChBac experimental or GFP control mice, including membrane capacitance, membrane resistance, action potential peak amplitude. N = 7–10 neurons per group from three different animals. (B) Resting membrane potential and action potential voltage threshold. **p<0.01, student’s t-test. N = 14 neurons per group from six animals (C) Left - Current injection examples in mNaChBac and control neuron. Right – total area under curve for amount of current injected (pA). N = 12 neurons from three animals per group. *p<0.05 2-way ANOVA. (D) Left – example spike firing data from single-unit in-vivo recording from vGlut2-Cre animals injected with either Cre-dependent Chr2 or Chr2 and mNaChBac with cells identified by a 10 Hz photo-stimulation. Right - Spontaneous frequency of cells in basal forebrain. ****p<0.0001 Data show mean ± SEM.
Figure 2—figure supplement 2

Endocrine hormones are not altered in vGlut2BF-mNaChBac animals four days after viral injection.
(A) Pituitary hormone levels; n = 9 animals per group. (B) T4 levels; n = 8–9 animals per group. (C) T3 levels; n = 6 animals per group. (D) Glucose, Leptin, and Insulin levels; n = 6 animals per group. (E) Ghrelin levels; n = 12 mice for pre-injection groups, n = 6 mice for GFP injected, and n = 6 mice for mNaChBac injected. One-way ANOVA with multiple comparisons. **p<0.01. Data are mean ± SEM.
Figure 3
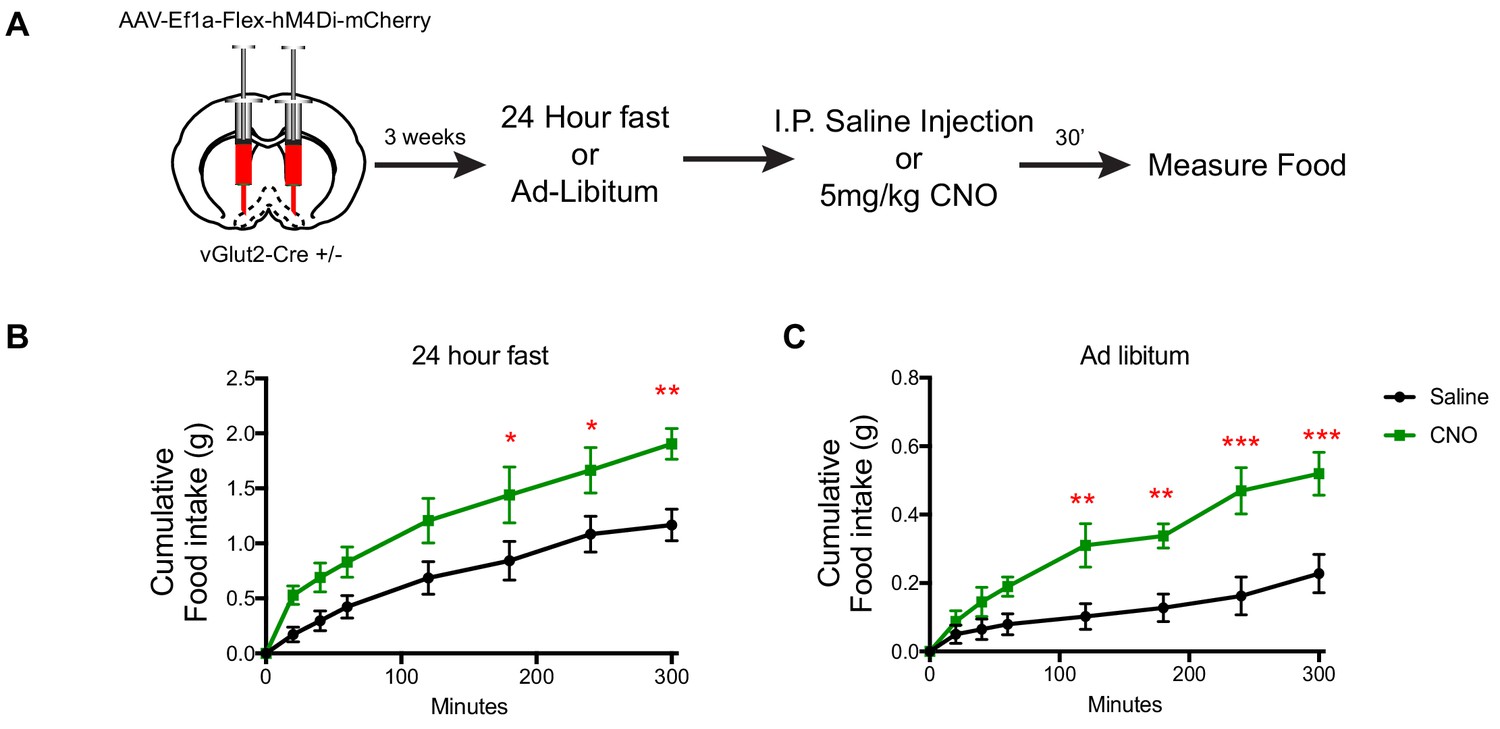
DREADD inhibition of vGlut2BF neurons increases food-intake.
(A) Schematic showing experimental paradigm. (B) Measurements of cumulative food intake in experimental and control mice following a 24 hr fast. (C) Measurements of cumulative food intake in experimental and control mice following ad-libitum over-night food access. Statistical measures include 2-way ANOVA multiple comparisons. Data are mean ± SEM. N = 5 animals per group. *p<0.05, **p<0.01, ***p<0.001.
Figure 4
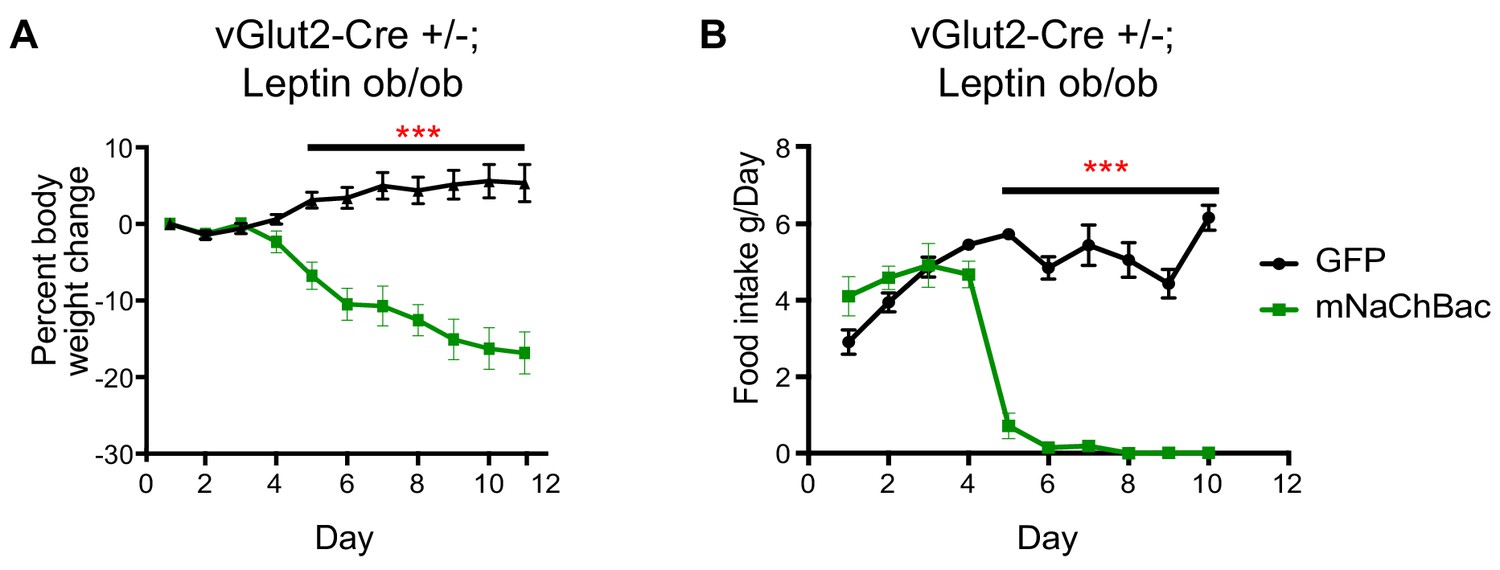
Chronic vGlut2BF activation causes hypophagia in Lepob/ob mice.
(A) Percent weight change from baseline in vGlut2-Cre+/-; Lepob/ob mice injected with either AAV-Flex-GFP (control) or AAV-Flex-eGFP-p2a-mNaChBac into the basal forebrain. N = 5 animals per group (three males/2 female) (B) Food intake in the same animals from (A) N = 5 animals per group. ***p<0.001, 2-way RM ANOVA with Sidak’s post-hoc. Data are mean ± SEM.
Figure 5
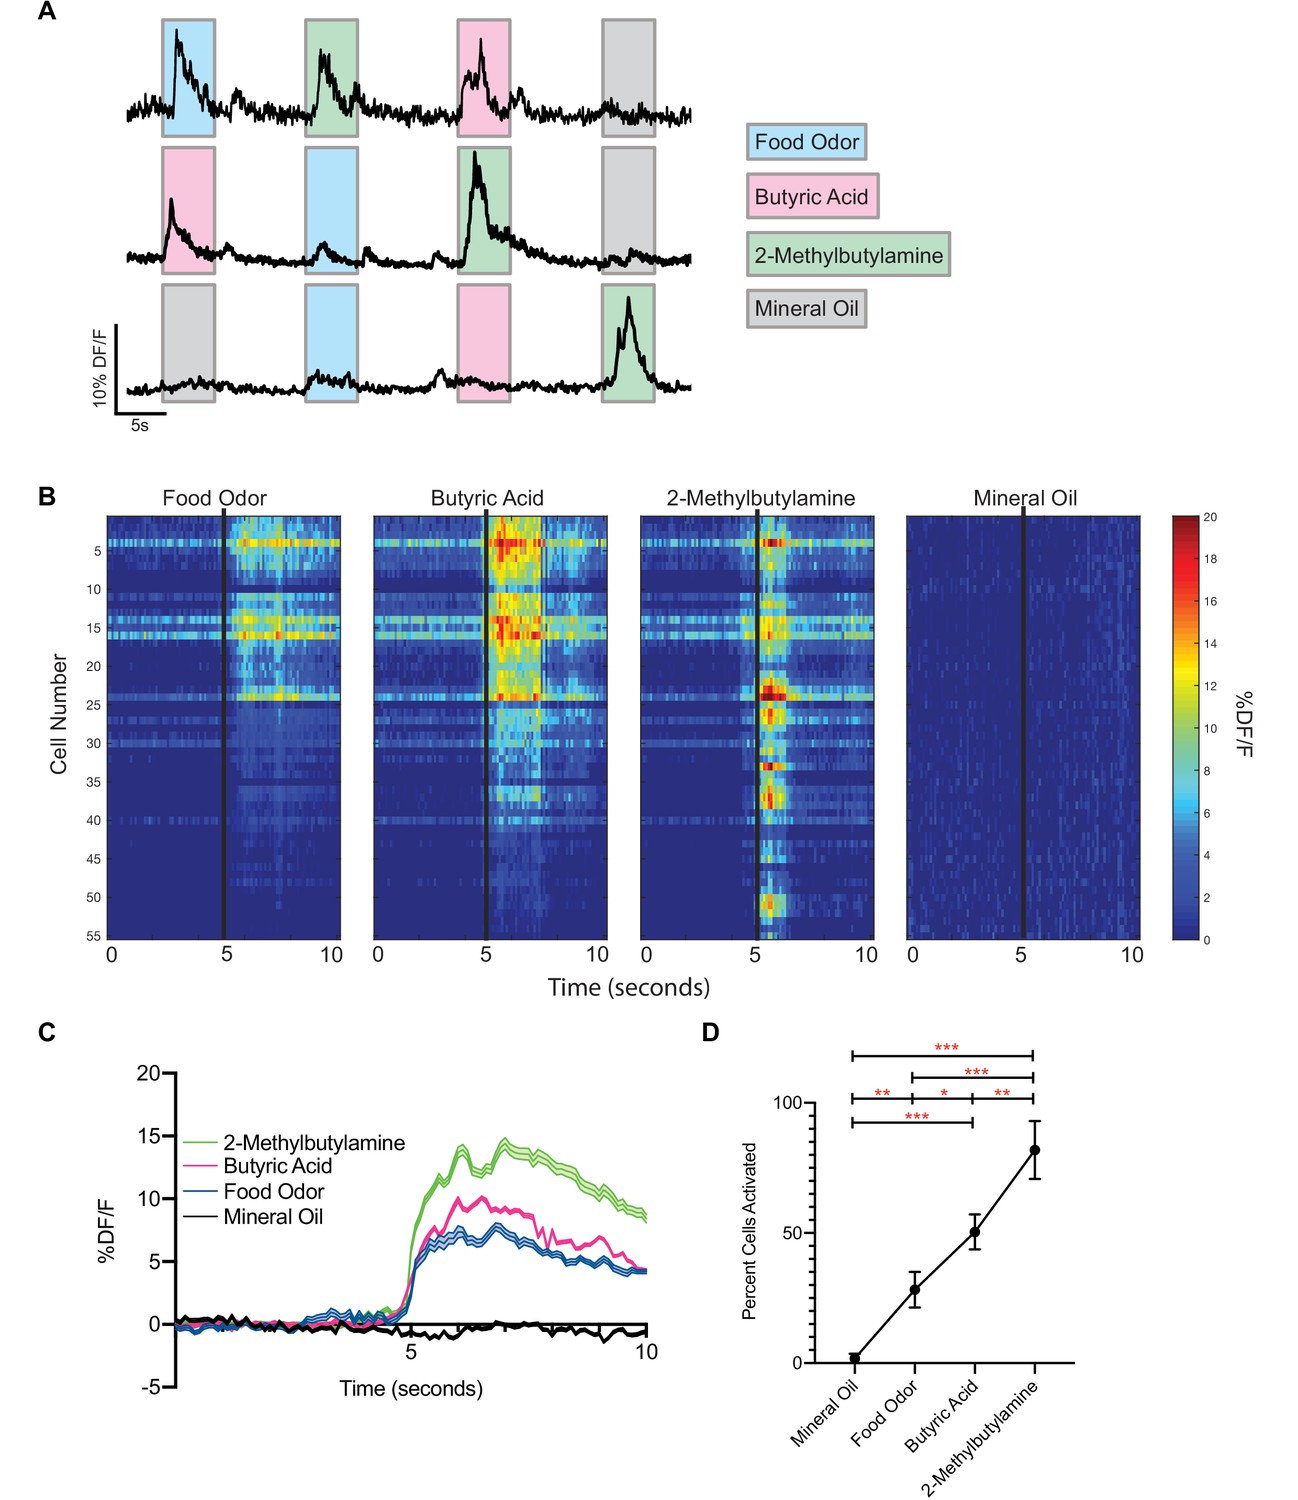
vGlut2BF neurons are activated by aversive odorants.
(A) Example calcium traces from vGlut2BF neurons to different odors presented for 5 s each. (B) Representative heat map of all cells recorded from one animal showing % DF/F responsivity to different odors over a 10 s window. (C) Combined calcium fluorescence activity from n = 5 mice showing neuronal activation to different odors (p<0.05 2-way ANOVA with post-hoc Tukey’s) (64 mineral oil cells, 142 food odor cells, 168 butyric acid cells, 310 2-methylbutylamine cells). (D) Percent cells activated in each animal to different odors n = 5 mice. *p<0.05, **p,0.01, ***p<0.001, RM one-way ANOVA with Tukey’s post-hoc analysis.
Figure 6
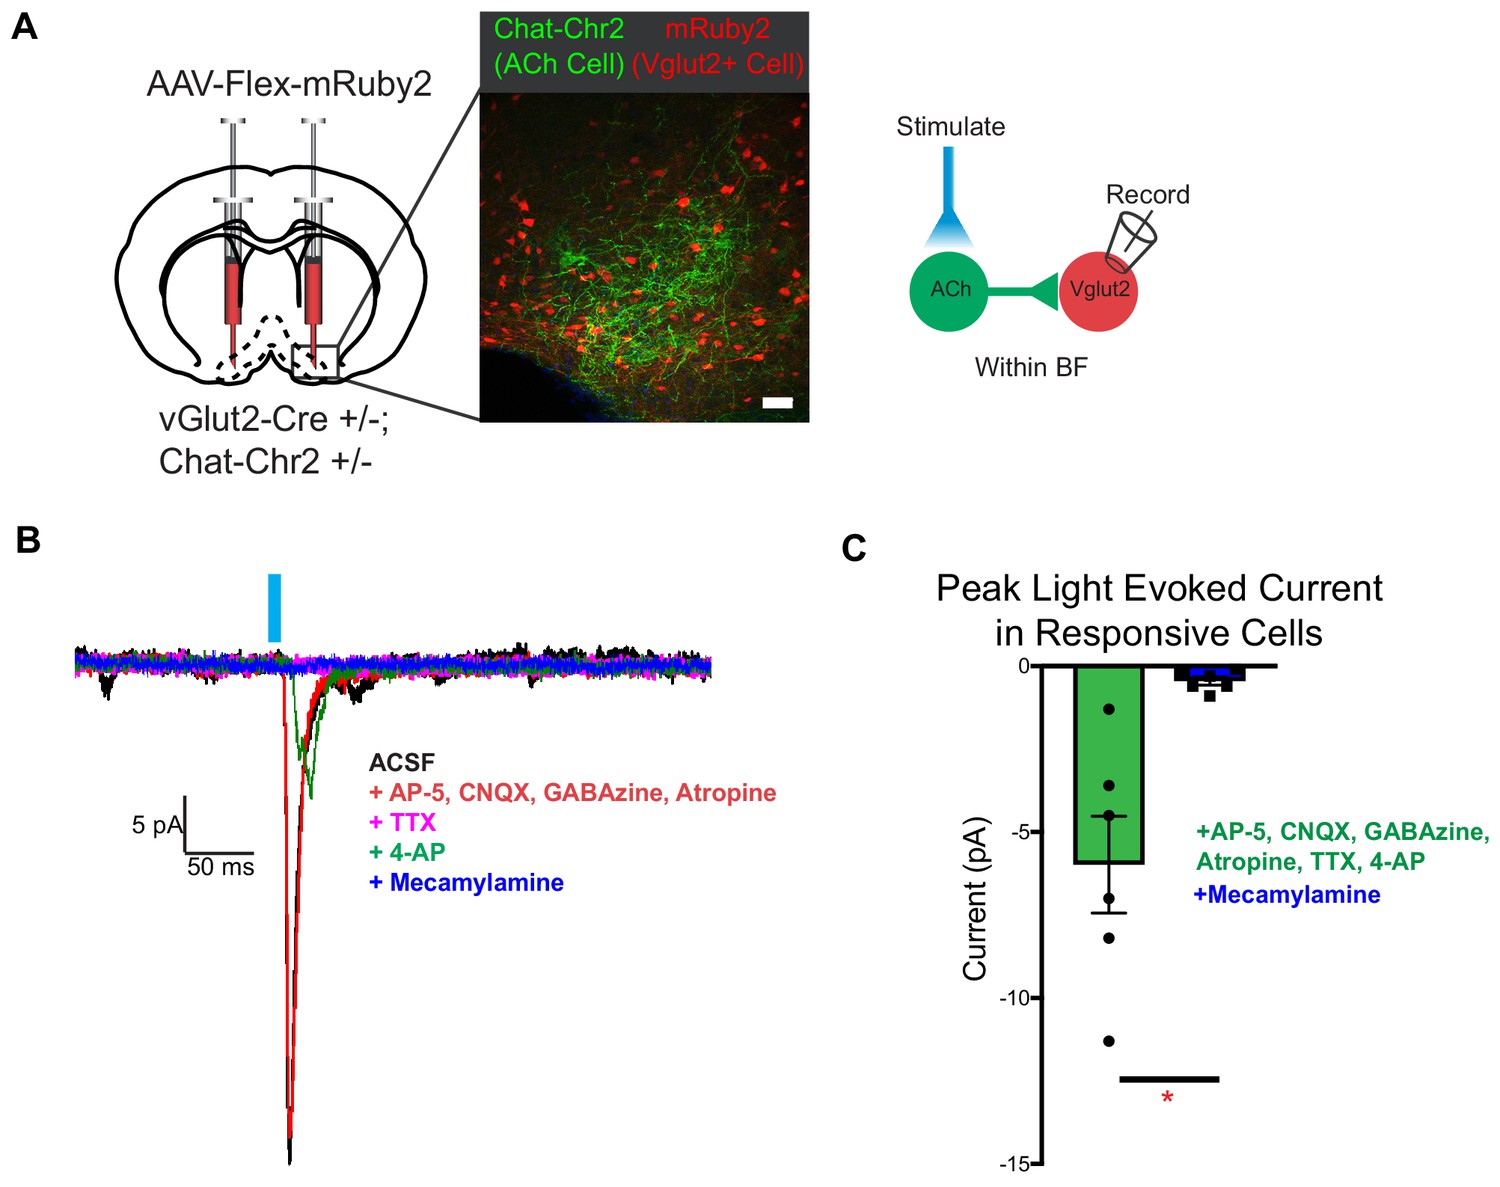
vGlut2BF neurons receive fast mono-synaptic nicotinic current.
(A) Schematic showing experimental paradigm with confocal picture of basal forebrain labeling cholinergic channelrhodopsin neurons (green) and vGlut2BF neurons (red). Scale bar = 100 µm. (B) Example trace from a vGlut2BF neuron with cholinergic neuron photostimulation. (C) Average evoked monosynaptic nicotinic current onto vGlut2BF neurons. N = 6 neurons out of 52 patched neurons from three animals. *p<0.05, student’s t-test.
Figure 7 with 1 supplement
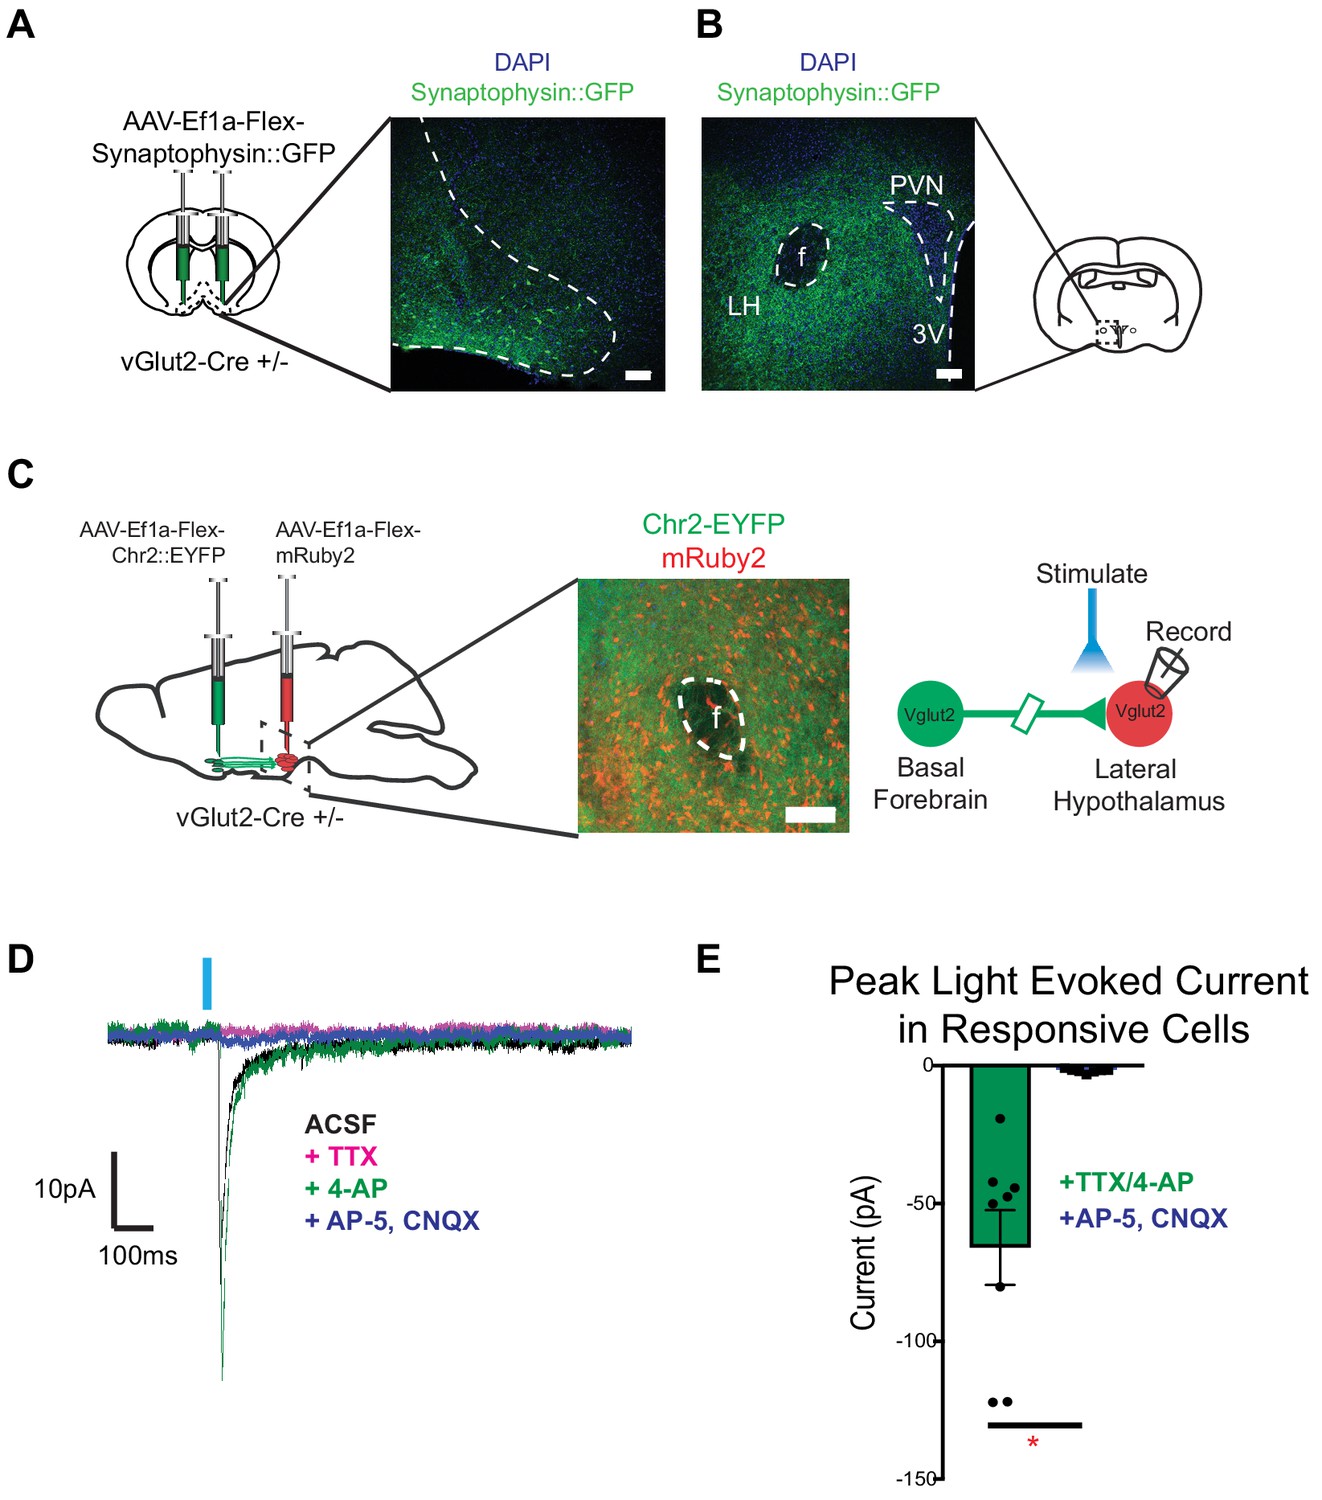
vGlut2BF neurons project to lateral hypothalamus and make monosynaptic connections onto vGlut2LH neurons.
(A) Coronal diagram showing viral injection site, and immunofluorescence image showing labeled cell-bodies in the basal forebrain. Scale bar = 100 µm (B) Coronal slice through hypothalamus showing synaptophysin::GFP nerve terminals. PVN = paraventricular nucleus, 3V = 3rd ventricle, f = fornix. LH = Lateral hypothalamic area. Scale bar = 100 µm. (C) Schematic for dual injection electrophysiology experiment. 300 µm thick acute slice showing green channelrhodopsin containing terminals from vGlut2BF neurons and red vGlut2LH cell bodies. Scale bar = 100 µm. (D) Example traces from a vGlut2LH neuron following photostimulation of vGlut2BF neuron terminals. (E) Average evoked monosynaptic glutamatergic current onto vGlut2LH neurons from vGlut2BF neurons. N = 8 neurons out of 9 patched neurons from three animals. *p<0.05, student’s t-test.
Figure 7—figure supplement 1

vGlut2BF neurons project throughout the brain.
(A) Diagram and 20X confocal zoomed in images of synaptophysin injection site and terminal fields. VDBB = vertical limb of the Diagonal Band of Broca. HDBB = horizontal limb of the Diagonal Band of Broca. LH = Lateral hypothalamus, PC = piriform cortex, OB = olfactory bulb, LhB = lateral habenula, VTA = ventral tegmental area..Scale bar = 100 um. (B) Average intensity of synaptophsyin::GFP in terminal fields normalized to DBB injection site. (C) Whole brain images of VDBB, HDBB and LH/LhB. Scale bar = 1 mm.
Figure 8
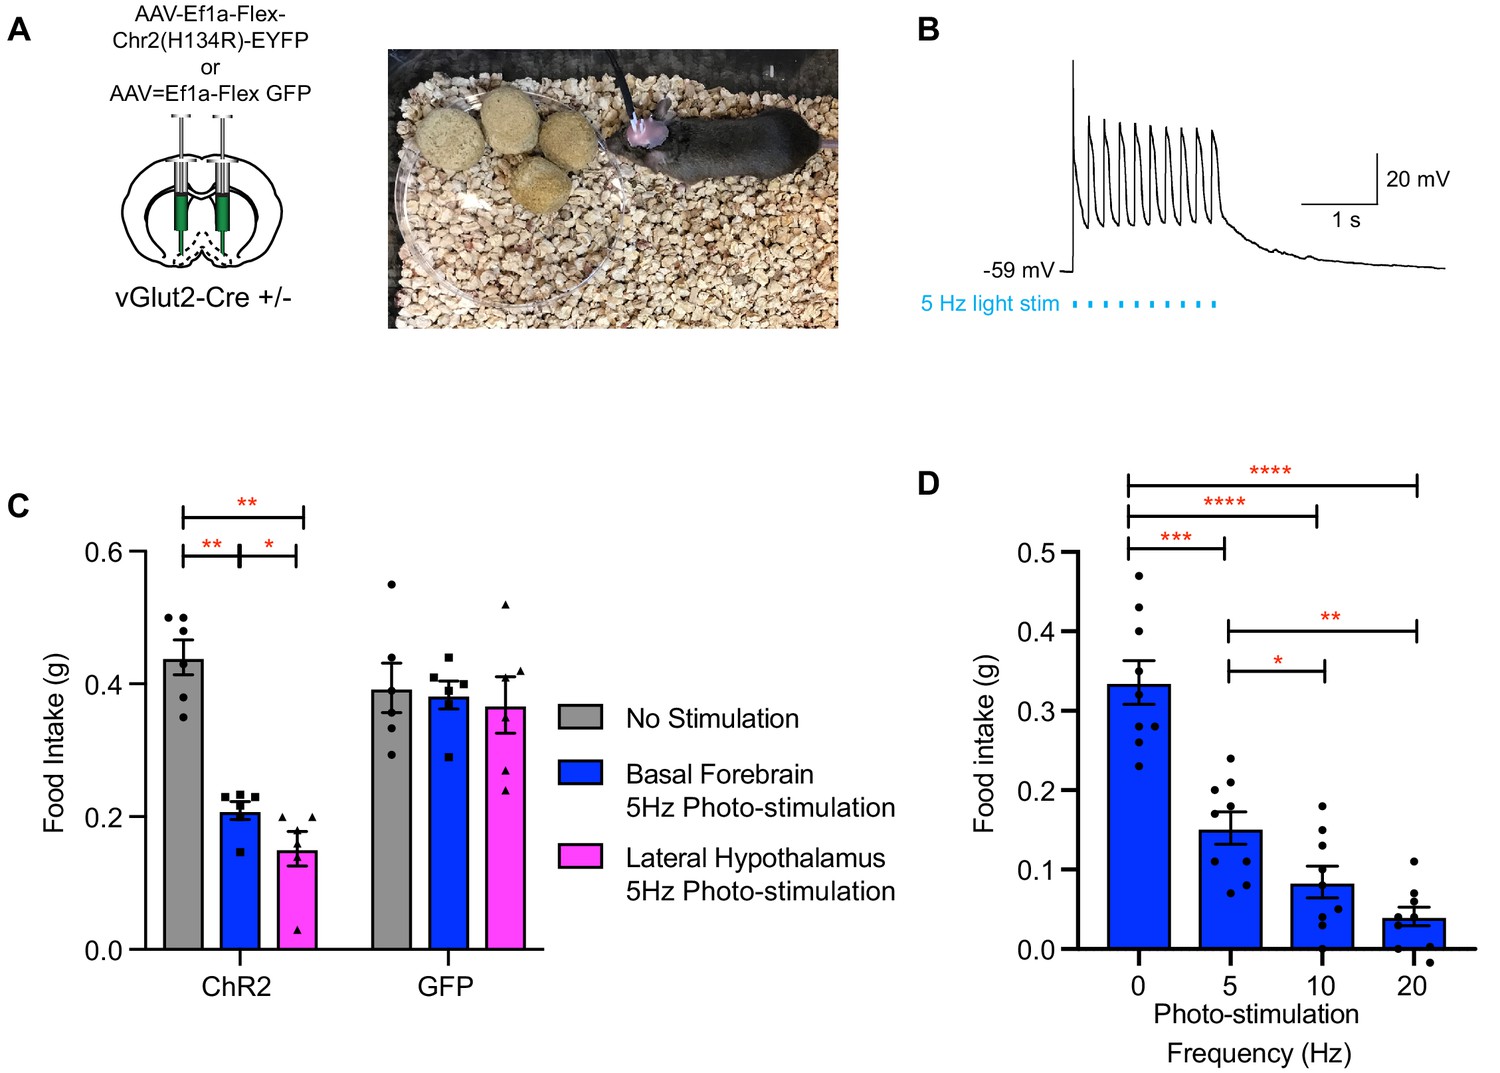
Photo-stimulation of vGlut2BF neuron cell bodies and vGlut2BF lateral hypothalamic projections decreases food-intake.
(A) Schematic showing viral injection into the basal forebrain (left), and a picture of a mouse with bilateral fiberoptic implants over both the basal forebrain and lateral hypothalamus (right). (B) Whole cell recordings from a channelrhodopsin expressing vGlut2BF neuron showing high fidelity activation with 5 Hz photo-stimulation. (C) Food intake of vGlut2BF channelrhodopsin or GFP expressing mice during 30 min of photo-stimulation. *p<0.05, **p<0.01. Two-way RM ANOVA, post-hoc Tukey’s multiple comparison. N = 6 animals, three males/3 females. (D) Food intake of fasted vGlut2BF channelrhodopsin expressing animals implanted only over the basal forebrain and subsequently photo-stimulated only over the basal forebrain at various photo-stimulation frequencies. *p<0.05, **p,0.01, ***p<0.001, ****p,0.0001. RM One-way ANOVA, post-hoc Tukey’s multiple comparison, N = 9 animals, five males/4 females.
Figure 9
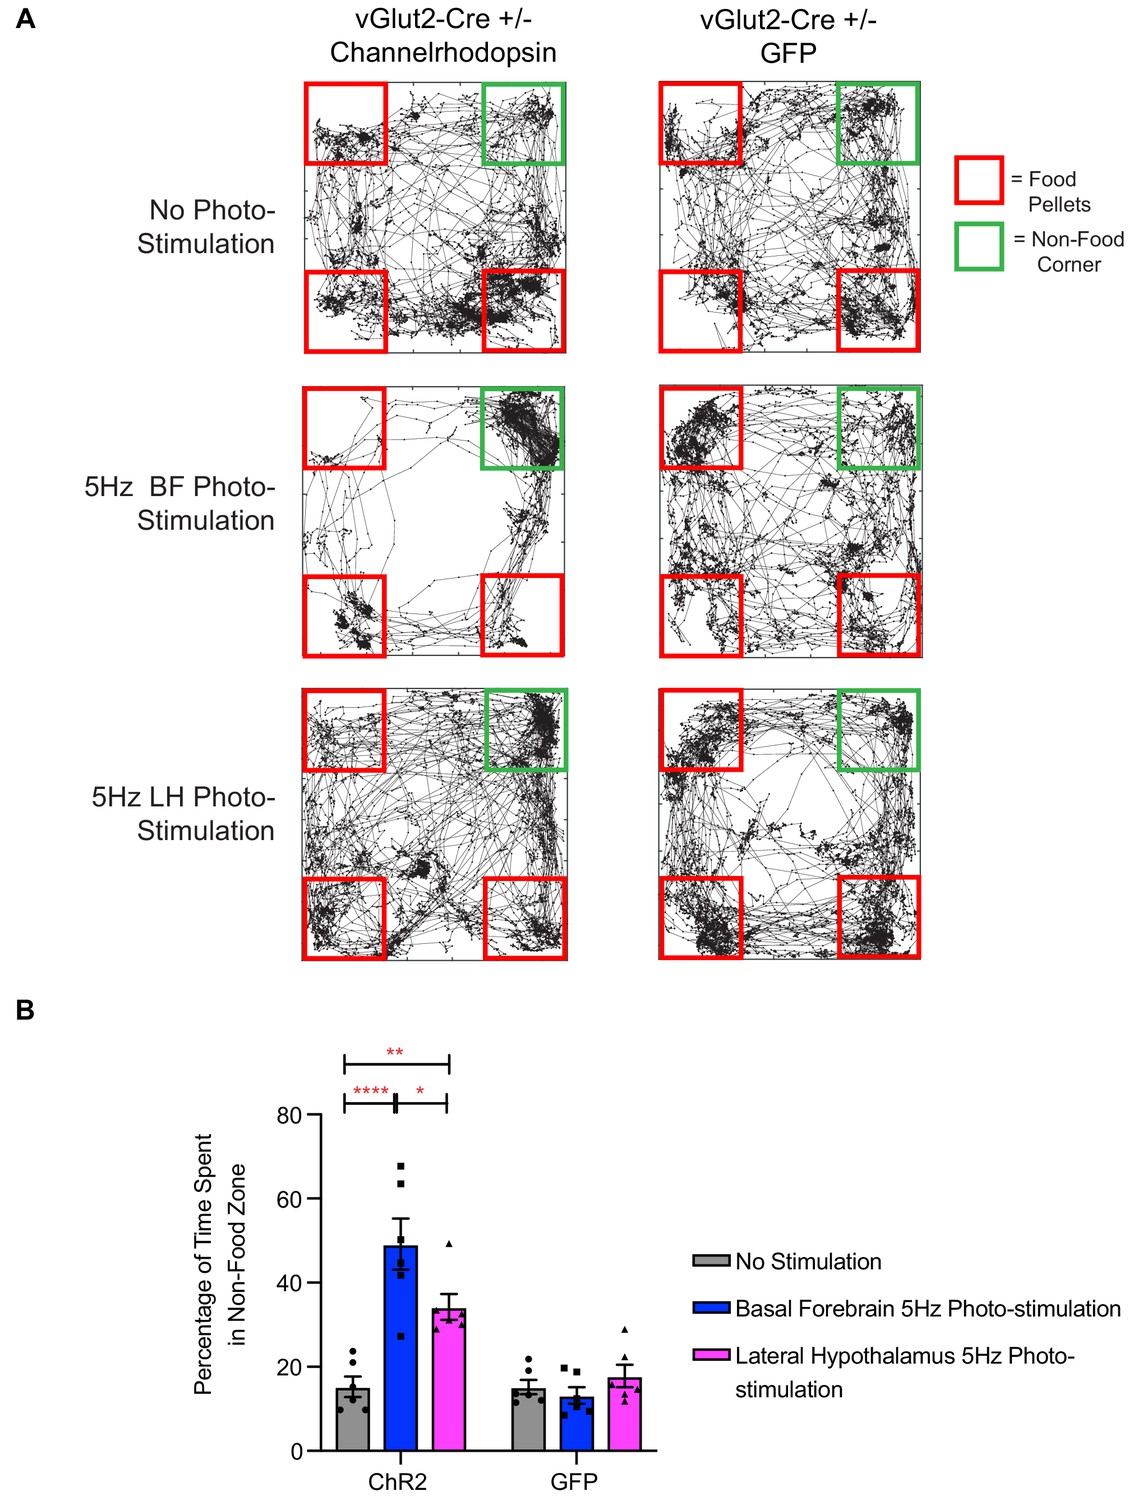
Photo-stimulation of vGlut2BF neuron cell bodies and vGlut2BF lateral hypothalamic projections induces food-avoidance behavior.
(A) Example locomotor traces of the same channelrhodopsin and control GFP injected vGlut2-Cre animals under three different conditions for 30 min. (B) Quantification of percentage time spent by channelrhodopsin-expressing (left) or control mice (right) in non-food corner during 30 min of photo-stimulation. *p<0.05. **p<0.01, ****p<0.0001. Two-way RM ANOVA, post-hoc Tukey’s multiple comparison test, n = 6 animals. three males/3 females. Data are mean ± SEM.
Figure 10
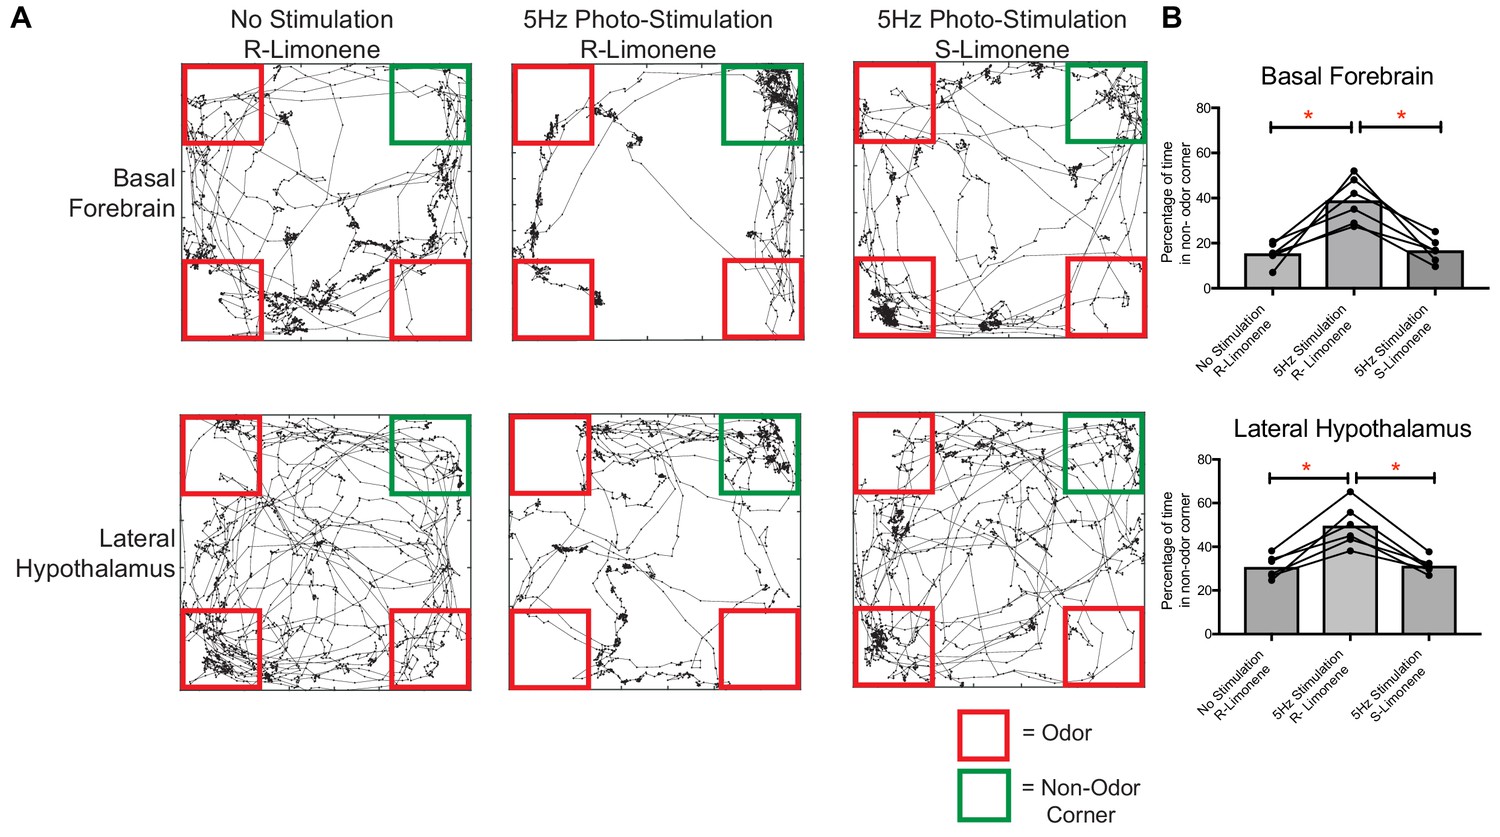
Food-associated odor induces avoidance behavior in vGlut2BF neuron and vGlut2BF LH projection photostimulated animals.
(A) Locomotor trace of the same channelrhodopsin mouse photo-stimulated either over the basal forebrain or lateral hypothalamus under three different conditions. R-Limonene is passively associated with food, whereas S-Limonene represents the non-associated control. (B) Quantification of percentage of time spent in non-odor corner over 10 min. *p<0.05, RM One-way ANOVA, post-hoc Tukey, n = 6 animals. 3 Males/3 females. Data are mean ± SEM.
Tables
Key resources table
| Reagent type (species) or resource | Designation | Source or reference | Identifiers | Additional information |
|---|---|---|---|---|
| Strain, strain background (M.Muscularus) | Vglut2-Cre (Slc17a6-Cre) | The Jackson Laboratory | RRID:IMSR_JAX:028863 | |
| Strain, strain background (M.Muscularus) | Chat-Chr2 (ChAT-ChR2-EYFP Line 6) | The Jackson Laboratory | RRID:IMSR_JAX:014546 | |
| Strain, strain background (Adeno-Associated Virus Serotype 2/9) | AAV-Ef1a-Flex-hChR2(H134)-EYFP-WPRE-hGHpA (2/9); Flex-Chr2 | This Paper; Neurocconnectivity Core at the Jan and Dan Duncan Neurological Research Institute | Plasmid subcloned from RRID:Addgene_26973 | |
| Strain, strain background (Adeno-Associated Virus Serotype 2/9) | AAV-Ef1a-Flex-hM4Di-mCherry (2/9); Flex-hM4Di-mCherry | This Paper; Neurocconnectivity Core at the Jan and Dan Duncan Neurological Research Institute | Plasmid subcloned from RRD:Addgene_44362 | |
| Strain, strain background (Adeno-Associated Virus Serotype 2/DJ8) | AAV-Ef1a-Flex-GCaMP6m-WPRE-hGHpA (DJ8); Flex-GCaMP6m | This Paper; Neurocconnectivity Core at the Jan and Dan Duncan Neurological Research Institute | Plasmid subcloned from RRID:Addgene_100839 | |
| Strain, strain background (Adeno-Associated Virus Serotype 2/DJ8) | AAV-Ef1a-Flex-eGFP-p2a-mNaChBac-WPRE-hGHpA (DJ8); Flex-mNaChBac; mNaChBac | This Paper; Neurocconnectivity Core at the Jan and Dan Duncan Neurological Research Institute | Plasmid subcloned from plasmid gift from Dr. Mingshan Xue (mxue@bcm.edu) | |
| Strain, strain background (Adeno-Associated Virus Serotype 2/DJ8) | AAV-Ef1a-Flex-Synaptophysin::eGFP-WPRE-hGHpA (DJ8); Flex-Synaptophysin | This Paper; Neurocconnectivity Core at the Jan and Dan Duncan Neurological Research Institute | Plasmid subcloned from RRID:Addgene_73816 | |
| Strain, strain background (Adeno-Associated Virus Serotype 2/DJ8) | AAV-Ef1a-Flex-mRuby2 (DJ8); Flex-mRuby2 | This Paper; Neurocconnectivity Core at the Jan and Dan Duncan Neurological Research Institute | Plasmid subcloned from Addgene:40260 | |
| Recombinant DNA reagent (plasmid) | pAAV-Ef1a-Flex-hChR2(H134)-EYFP-WPRE-hGHpA | This paper | RRID:Addgene_26973 | |
| Recombinant DNA reagent (plasmid) | pAAV-Ef1a-Flex-hM4Di-mCherry | This paper | RRID:Addgene_44362 | |
| Recombinant DNA reagent (plasmid) | pAAV-Ef1a-Flex-GCaMP6m-WPRE-hGHpA | This paper | RRID:Addgene_100839 | |
| Recombinant DNA reagent (plasmid) | pAAV-Ef1a-Flex-eGFP-p2a-mNaChBac-WPRE-hGHpA | Plasmid subcloned from plasmid gift from Dr. Mingshan Xue (mxue@bcm.edu) | ||
| Recombinant DNA reagent (plasmid) | pAAV-Ef1a-Flex-Synaptophysin::eGFP-WPRE-hGHpA | This paper | RRID:Addgene_73816 | |
| Recombinant DNA reagent (plasmid) | pAAV-Ef1a-Flex-mRuby2 | This Paper | RRID:Addgene_40260 | |
| Antibody | anti-ChAT (goat monoclonal) | Millipore | Millipore Cat# AB144P; RRID:AB_2079751 | (1: 500 dilution) |
| Antibody | anti-cFos (rabbit polyclonol) | Abcam | Abcam Cat# ab190289; RRID:AB_2737414 | (1:1000 dilution) |
| Chemical compound, drug | CNO (clozapine-n-oxide) | Tocris 4963 | ||
| Commercial assay or kit | Mouse/Rat T4 Elisa | Calbiotech, Inc | T4044T-100 | |
| Commercial assay or kit | Active Ghrelin ELISA | Millipore | EZRGRA-90K | |
| Software, algorithm | Doric Neuroscience Studio | Doric Lenses | ||
| Software, algorithm | MATLAB | Mathworks | RRID:SCR_001622 | |
| Software, algorithm | Optimouse | PMID:28506280 | ||
| Software, algorithm | Prism 8 | Graphpad | GraphPad Prism, RRID:SCR_002798 | |
| Software, algorithm | Rodent Liquid diet | Test Diet | Test Diet:101 5LD1 | |
| Other (Mouse Liquid Diet) | Synapse | Tucker-Davis Technologies | Tucker-Davis Technologies; RRID:SCR_006495 | |
| Other (GRIN Lens) | Grin lens | Doric Lenses | Doric:SICL_E_500_80 |
Additional files
-
Transparent reporting form
- https://doi.org/10.7554/eLife.44548.016
Download links
A two-part list of links to download the article, or parts of the article, in various formats.
Downloads (link to download the article as PDF)
Open citations (links to open the citations from this article in various online reference manager services)
Cite this article (links to download the citations from this article in formats compatible with various reference manager tools)
Sensory perception drives food avoidance through excitatory basal forebrain circuits
eLife 8:e44548.
https://doi.org/10.7554/eLife.44548


