RETRACTED: Endocytic recycling and vesicular transport systems mediate transcytosis of Leptospira interrogans across cell monolayer
Figures
Figure 1 with 2 supplements
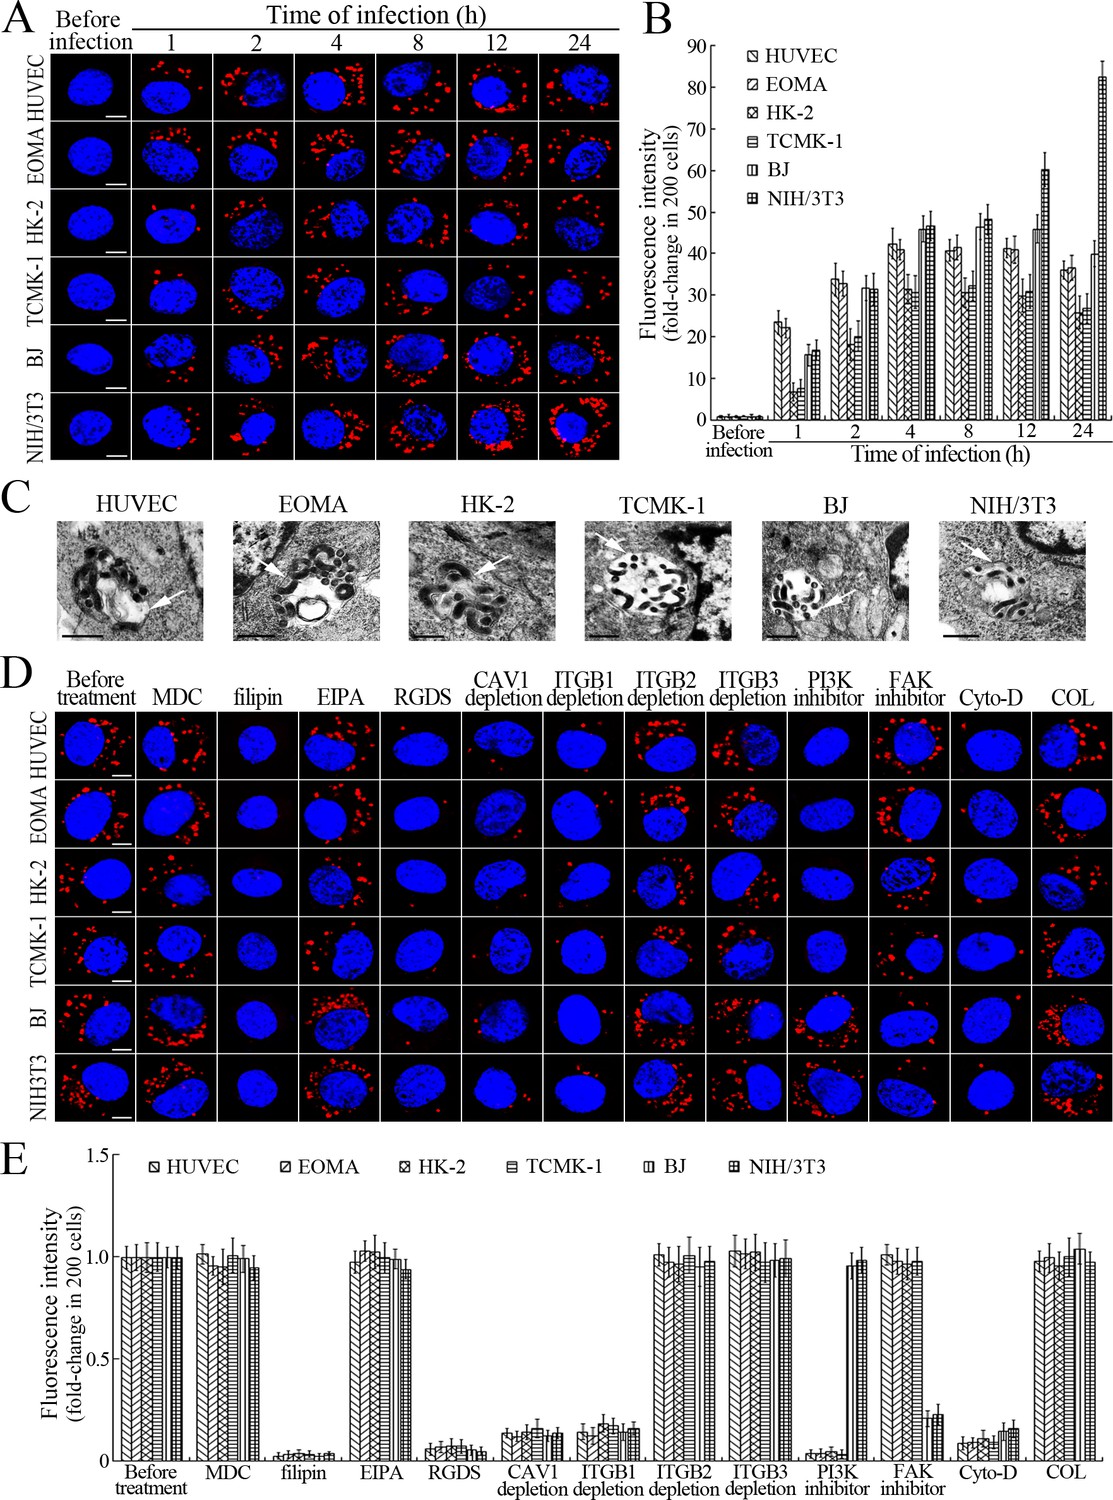
Internalization of L. interrogans into cells by CAV1/ITGB1-PI3K/FAK-mediated MF-dependent endocytosis.
(A) Leptospires in the cells infected with L. interrogans strain Lai for the indicated times, examined by confocal microscopy (scale bars = 5 μm). The blue plaques indicate the nucleus. The red spots around the nucleus indicate the intracellular leptospires. (B) Statistical summary of red fluorescence intensity reflecting the leptospires in the infected cells for the indicated times. Statistical data from experiments such as shown in (A). Bars show the means ± SD of three independent experiments. The red fluorescence intensity values from the cells without infection (before infection) were set as 1.0. (C) Lep-vesicles in the cells infected with L. interrogans strain Lai for 4 hr, examined by transmission electron microscopy (scale bars = 0.5 μm). The arrows indicate the intracellular leptospires in the membrane-bound vesicles. (D) Decrease of leptospires in the different inhibitor- or siRNA-treated cells infected with L. interrogans strain Lai for 4 hr, examined by confocal microscopy (scale bars = 5 μm). The legends are the same as shown in (A). (E) Statistical summary of red fluorescence intensity reflecting the leptospires in the different inhibitor- or siRNA-treated cells infected with L. interrogans strain Lai for 4 hr. Statistical data from experiments such as shown in (D). The other legends are the same as shown in (B).
-
Figure 1—source data 1
Representative source data for Figure 1B.
- https://doi.org/10.7554/eLife.44594.005
Figure 1—figure supplement 1
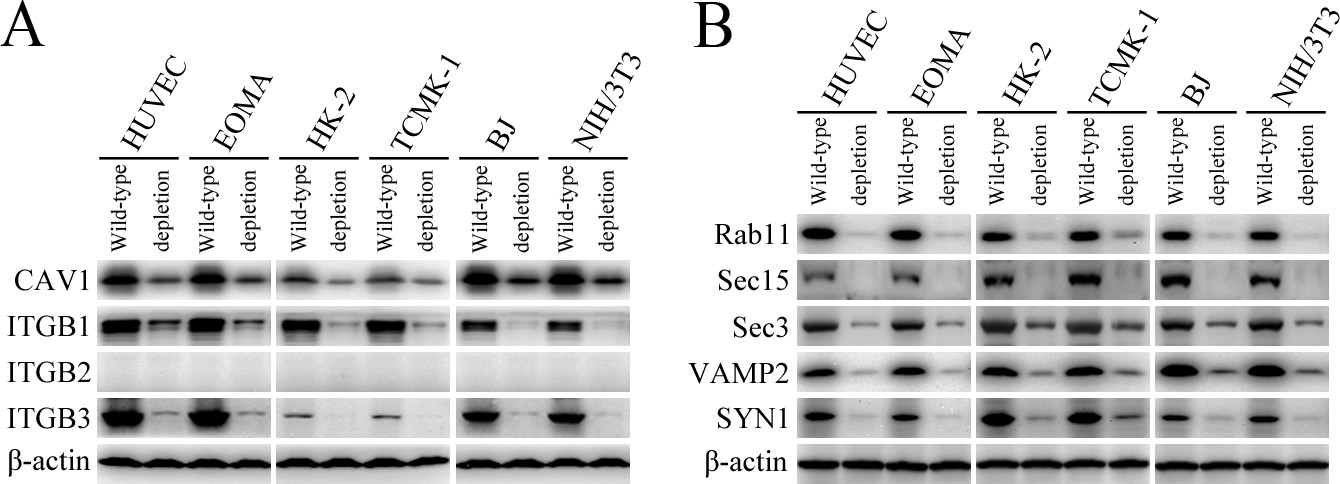
Depletion of target proteins in the cells.
(A) Depletion of CAV1, ITGB1, ITGB2 or ITGB3 in the siRNA-interfered cells, determined by Western Blot assay. (B) Depletion of Rab11, Sec15, Sec3, VAMP2 or SYN1 in the siRNA-interfered cells, determined by Western Blot assay.
Figure 1—figure supplement 2
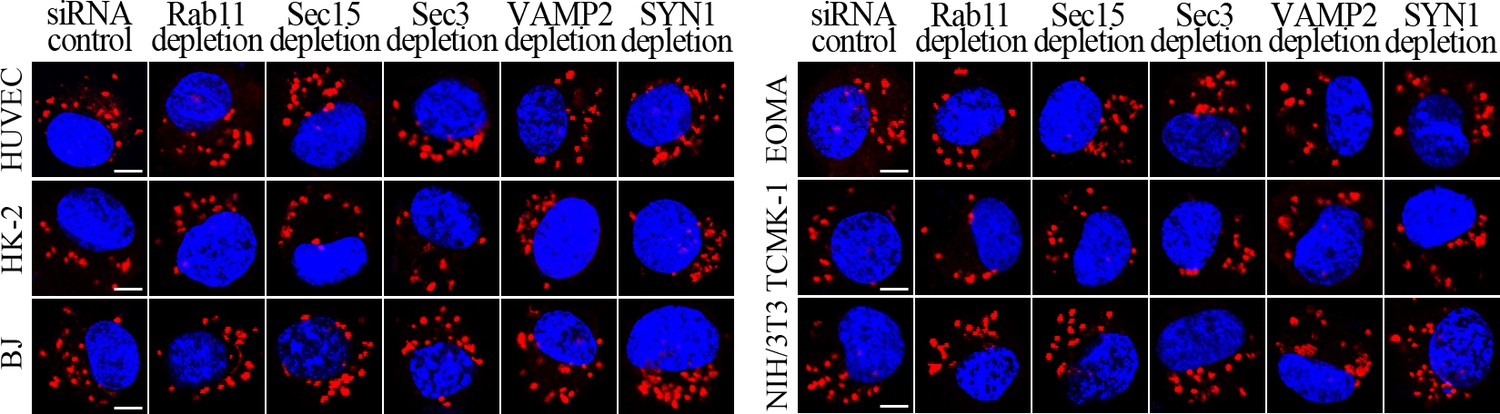
No decrease of leptospiral uptake in target protein-depleted cells.
The leptospires in the Rab11-, Sec15-, Sec3-, VAMP2- or SYN1-delepted cells infected with L. interrogans strain Lai for 4 hr, examined by confocal microscopy (scale bars = 5 μm). The blue plaques indicate the nucleus. The red spots around the nucleus indicate the intracellular leptospires.
Figure 2
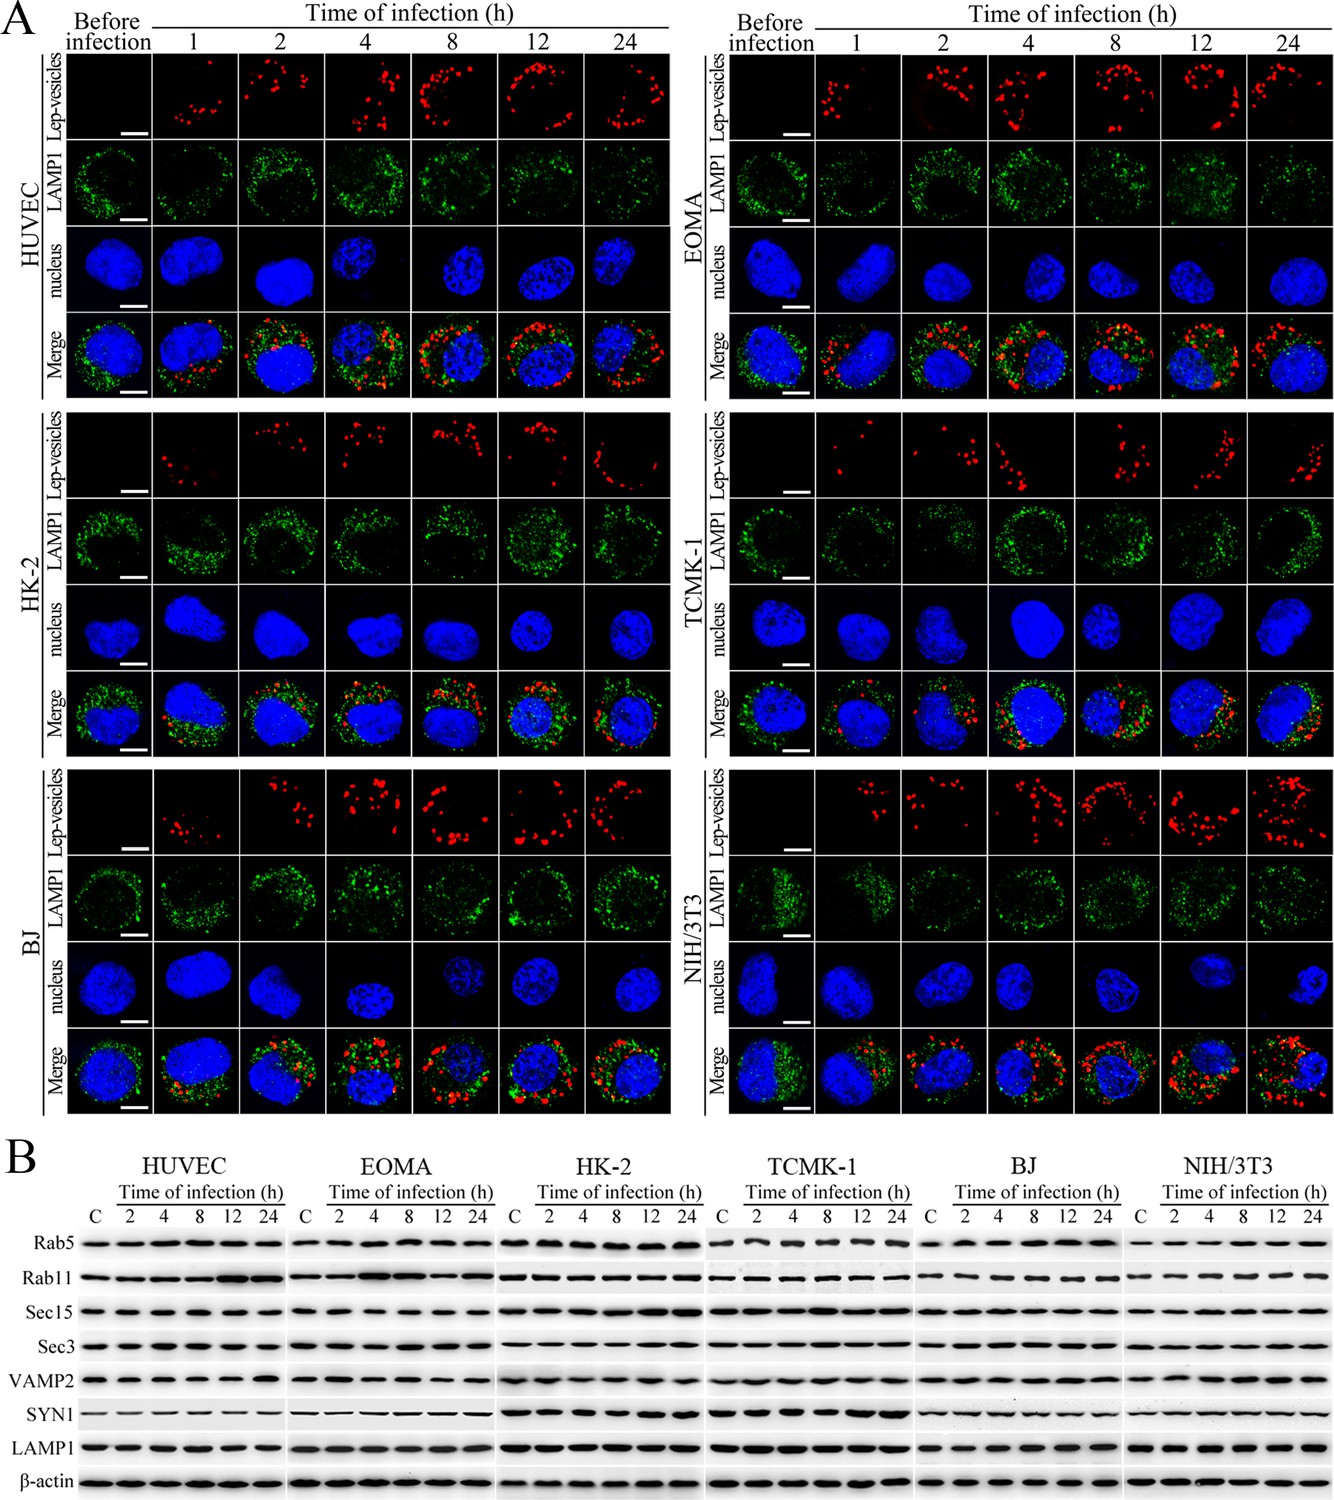
No fusion of Lep-vesicles with lysosomes and increase of target protein expression during infection.
(A) No co-localization of Lep-vesicles with lysosomes in the cells during infection with L. interrogans strain Lai, examined by confocal microscopy (scale bars = 5 μm). The blue plaques indicate the nucleus. The red or green spots indicate the Lep-vesicles or lysosomal marker LAMP1 molecules. No Lep-vesicle-LAMP1 co-localization (yellow) was found. (B) No significant expression increase of endocytic/excytotic and lysosomal proteins in the cells during infection with L. interrogans strain Lai, detected by Western Blot assay. C: the uninfected control cells.
Figure 3 with 1 supplement
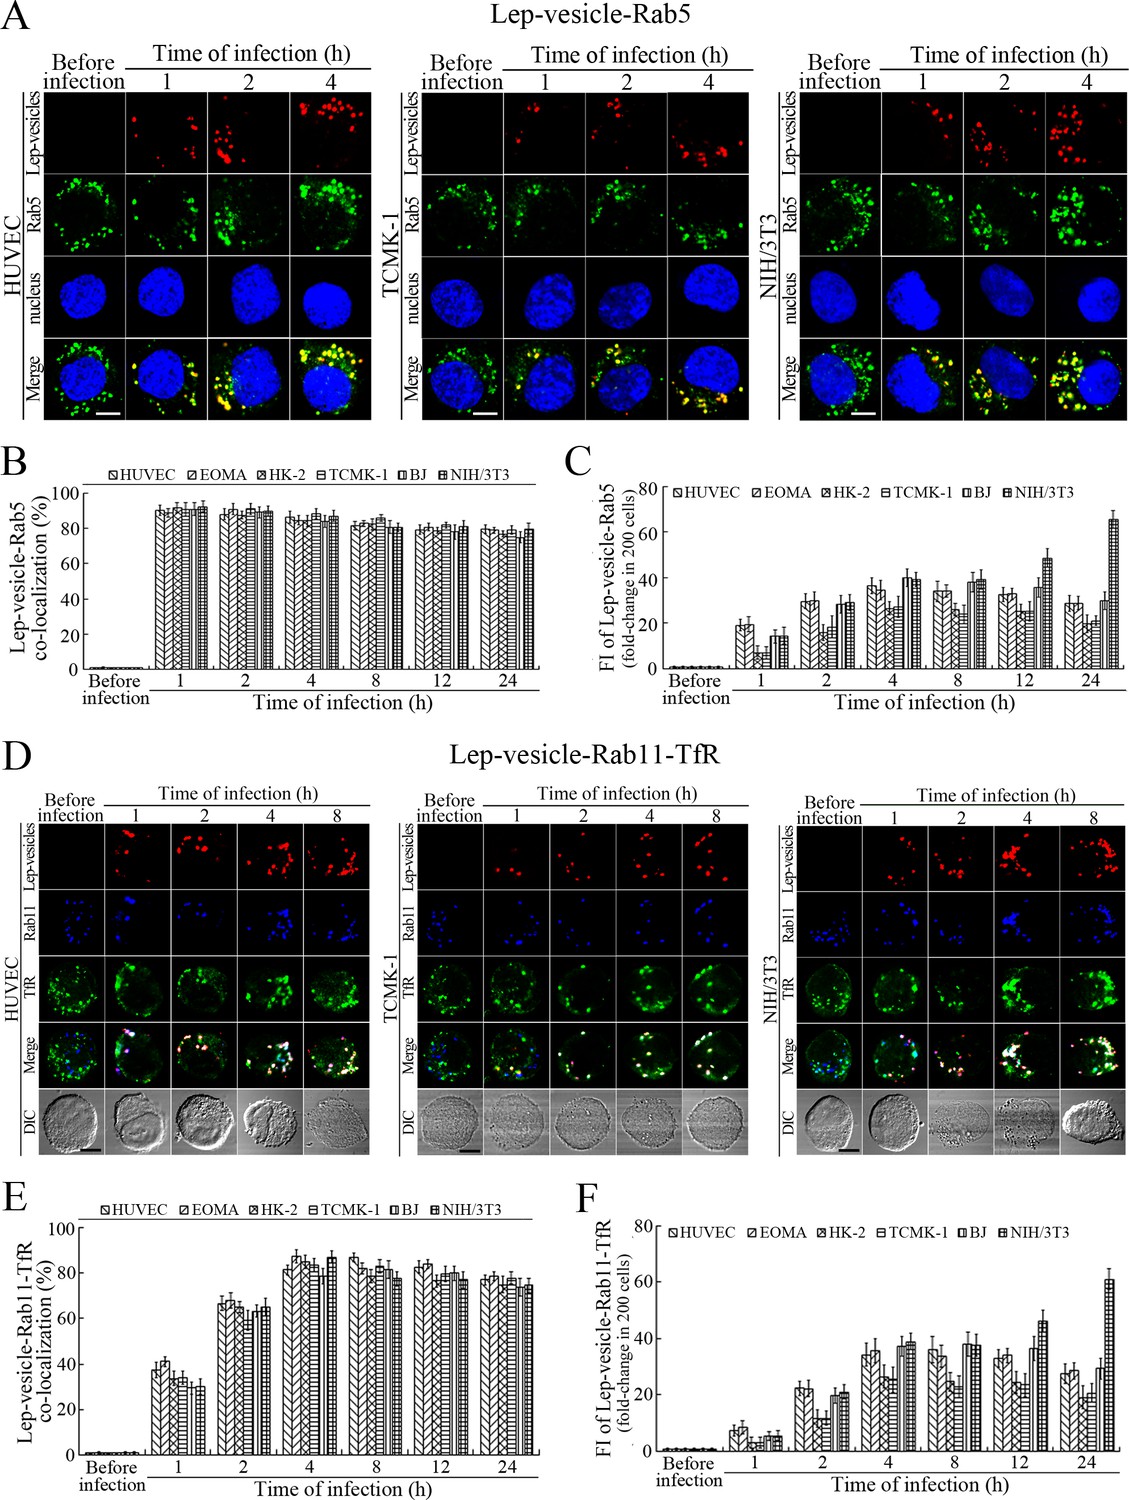
Early and recycling endosomes formation of Lep-vesicles by recruitment of Rab5 or Rab11/TfR.
(A) Co-localization of Lep-vesicles with Rab5 in the cells infected with L. interrogans strain Lai for the indicated times, determined by confocal microscopy (scale bars = 5 μm). The blue plaques indicate the nucleus. The red or green spots indicate the Lep-vesicles or early endosome marker Rab5. The yellow spots indicate the Lep-vesicle-Rab5 co-localization. The Lep-vesicle-Rab5 co-localization in the EOMA, HK-2 and BJ cells during infection was shown in the Figure 3—figure supplement 1A . (B) Statistical summary of Lep-vesicle-Rab5 co-localization percentages for the indicated times. Statistical data from experiments such as shown in (A). Bars show the means ± SD of three independent experiments. Two hundred cells in each experiment were analyzed to calculate the percentages. (C) Statistical summary of yellow fluorescence intensity reflecting the Lep-vesicle-Rab5 co-localization for the indicated times. The legends are the same as shown in (B) but for detection of the yellow fluorescence intensity (FI). The yellow FI values from the uninfected cells (before infection) were set as 1.0. (D) Co-localization of Lep-vesicles with Rab11 and TfR in the cells infected with L. interrogans strain Lai for the indicated times, determined by confocal microscopy (scale bars = 5 μm). The red, blue or green spots indicate the Lep-vesicles, recycling endosome marker Rab11 or TfR. The white spots indicate the Lep-vesicle-Rab11/TfR co-localization. The Lep-vesicle-Rab11/TfR co-localization in the EOMA, HK-2 and BJ cells during infection was shown in the Figure 3—figure supplement 1B . (E) Statistical summary of Lep-vesicle-Rab11/TfR co-localization percentages for the indicated times. Statistical data from experiments such as shown in (D). The other legends are the same as shown in (B) but for determination of Lep-vesicle-Rab11/TfR co-localization percentages. (F) Statistical summary of white fluorescence intensity reflecting the Lep-vesicle-Rab11/TfR co-localization for the indicated times. Statistical data from experiments such as shown in (D). The other legends are the same as shown in (C) but for detection of white FI.
Figure 3—figure supplement 1
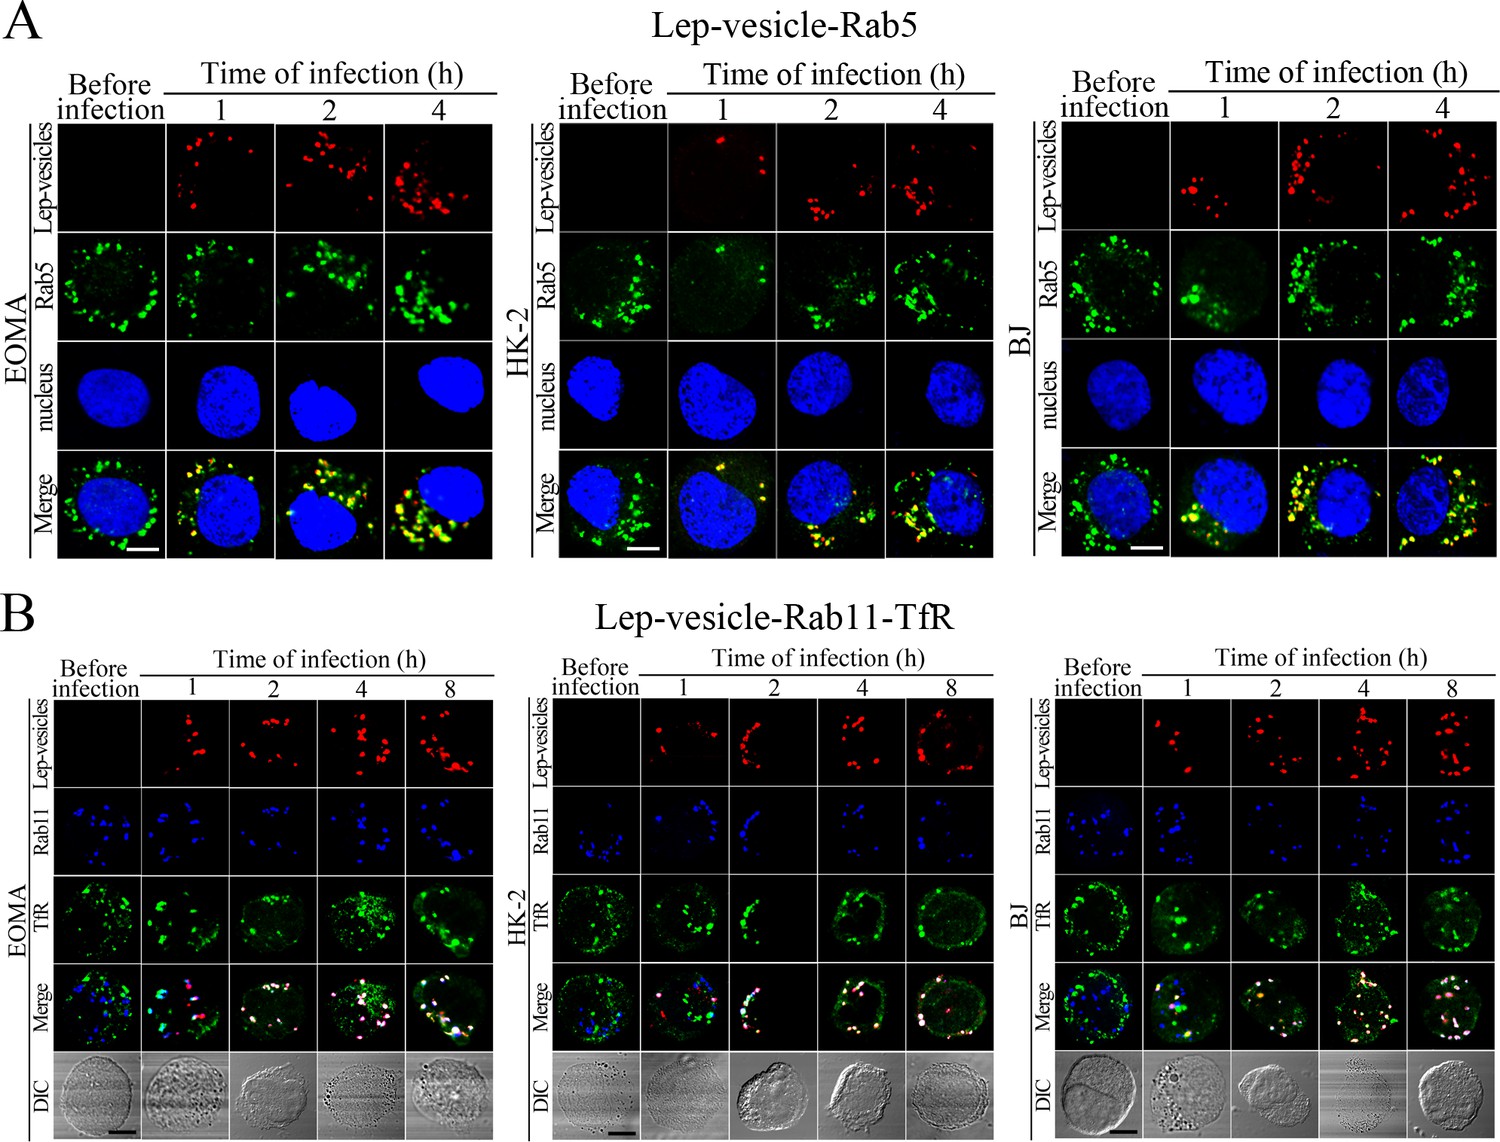
Early and recycling endosomes formation of Lep-vesicles by recruitment of Rab5 or Rab11/TfR.
(A) Co-localization of Lep-vesicles with Rab5 in the cells infected with L. interrogans strain Lai for the indicated times, determined by confocal microscopy (scale bars = 5 μm). The blue plaques indicate the nucleus. The red or green spots indicate the Lep-vesicles or early endosome marker Rab5. The yellow spots indicate the Lep-vesicle-Rab5 co-localization. (B) Co-localization of Lep-vesicles with Rab11 and TfR in the cells infected with L. interrogans strain Lai for the indicated times, determined by confocal microscopy (scale bars = 5 μm). The red, blue or green spots indicate the Lep-vesicles, recycling endosome marker Rab11 or TfR. The legends are the same as shown in (A) but for detection of Lep-vesicle-Rab11/TfR co-localization.
Figure 4 with 1 supplement
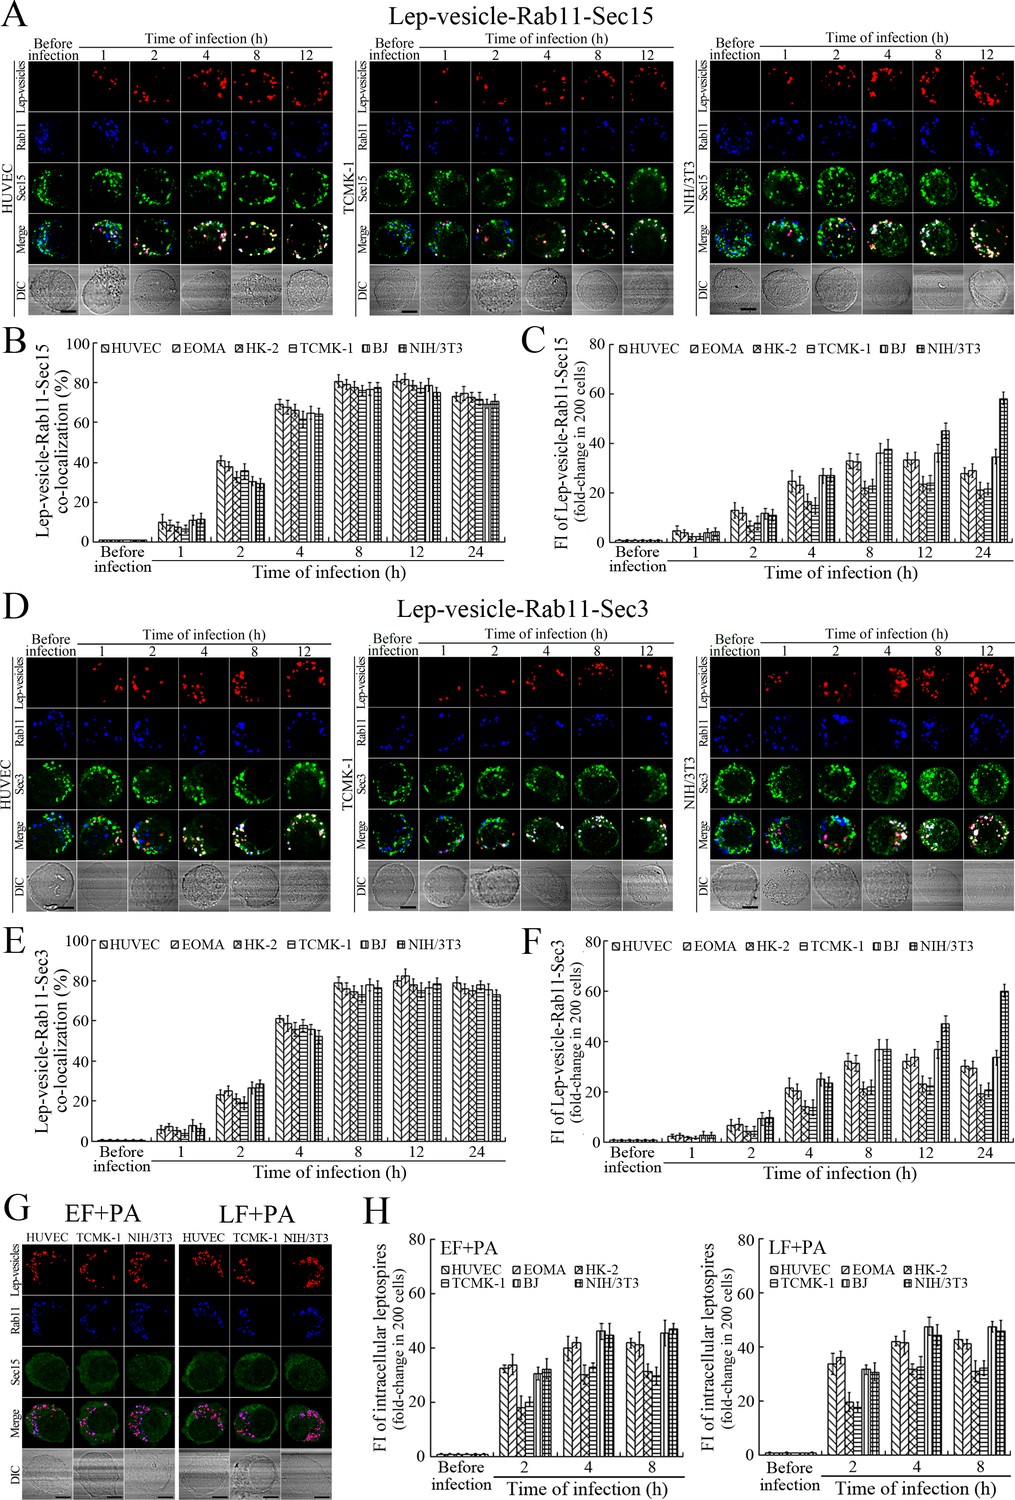
Recycling endosome-exocyst complex formation of Lep-vesicles by recruitment of Sec15/Sec3.
(A) Co-localization of Lep-vesicle-Rab11 with Sec15 in the cells infected with L. interrogans strain Lai for the indicated times, determined by confocal microscopy (scale bars = 5 μm). The red, blue or green spots indicate the Lep-vesicles, recycling endosome marker Rab11 or exocyst complex marker Sec15. The white spots indicate the Lep-vesicle-Rab11-Sec15 co-localization. The Lep-vesicle-Rab11-Sec15 co-localization in the EOMA, HK-2 and BJ cells during infection was shown in the Figure 4—figure supplement 1A . (B) Statistical summary of Lep-vesicle-Rab11-Sec15 co-localization percentages for the indicated times. Statistical data from experiments such as shown in (A). Bars show the means ± SD of three independent experiments. Two hundred cells in each experiment were analyzed to calculate the percentages. (C) Statistical summary of white fluorescence intensity reflecting the Lep-vesicle-Rab11-Sec15 co-localization for the indicated times. The legends are the same as shown in (B) but for detection of the white fluorescence intensity (FI). The white FI values from the uninfected cells (before infection) were set as 1.0. (D) Co-localization of Lep-vesicle-Rab11 with Sec3 in the cells infected with L. interrogans strain Lai for the indicated times, determined by confocal microscopy (scale bars = 5 μm). The red, blue or green spots indicate the Lep-vesicles, recycling endosome marker Rab11 or exocyst complex marker Sec3. The white spots indicate the Lep-vesicle-Rab11-Sec3 co-localization. The Lep-vesicle-Rab11-Sec3 co-localization in the EOMA, HK-2 and BJ cells during infection was shown in Figure 4—figure supplement 1B . (E) Statistical summary of Lep-vesicle-Rab11-Sec3 co-localization percentages for the indicated times. Statistical data from experiments such as shown in (D). The legends are the same as shown in (B) but for determination of Lep-vesicle-Rab11-Sec3 co-localization percentages. (F) Statistical summary of white fluorescence intensity reflecting the Lep-vesicle-Rab11-Sec3 co-localization for the indicated times. Statistical data from experiments such as shown in (D). The other legends are the same as shown in (C). (G) Absence of Lep-vesicle-recycling endosome-exocyst complexes in the anthrax toxin-treated cells infected with L. interrogans strain Lai for 8 hr, determined by confocal microscopy (scale bars = 5 μm). No white spots indicating the co-localization of Lep-vesicles with recycling endosome marker Rab11 and exocyst complex marker Sec15 were found. The Lep-vesicle-recycling endosome-exocyst complexes in the anthrax toxin-treated EOMA, HK-2 and BJ cells at 8 hr post-infection were shown in the Figure 4—figure supplement 1C . (H) Statistical summary of red fluorescence intensity reflecting the leptospires in the anthrax toxin-treated cells for the indicated times, examined by confocal microscopy. Bars show the means ± SD of three independent experiments. The red fluorescence intensity values from the uninfected cells (before infection) were set as 1.0.
Figure 4—figure supplement 1
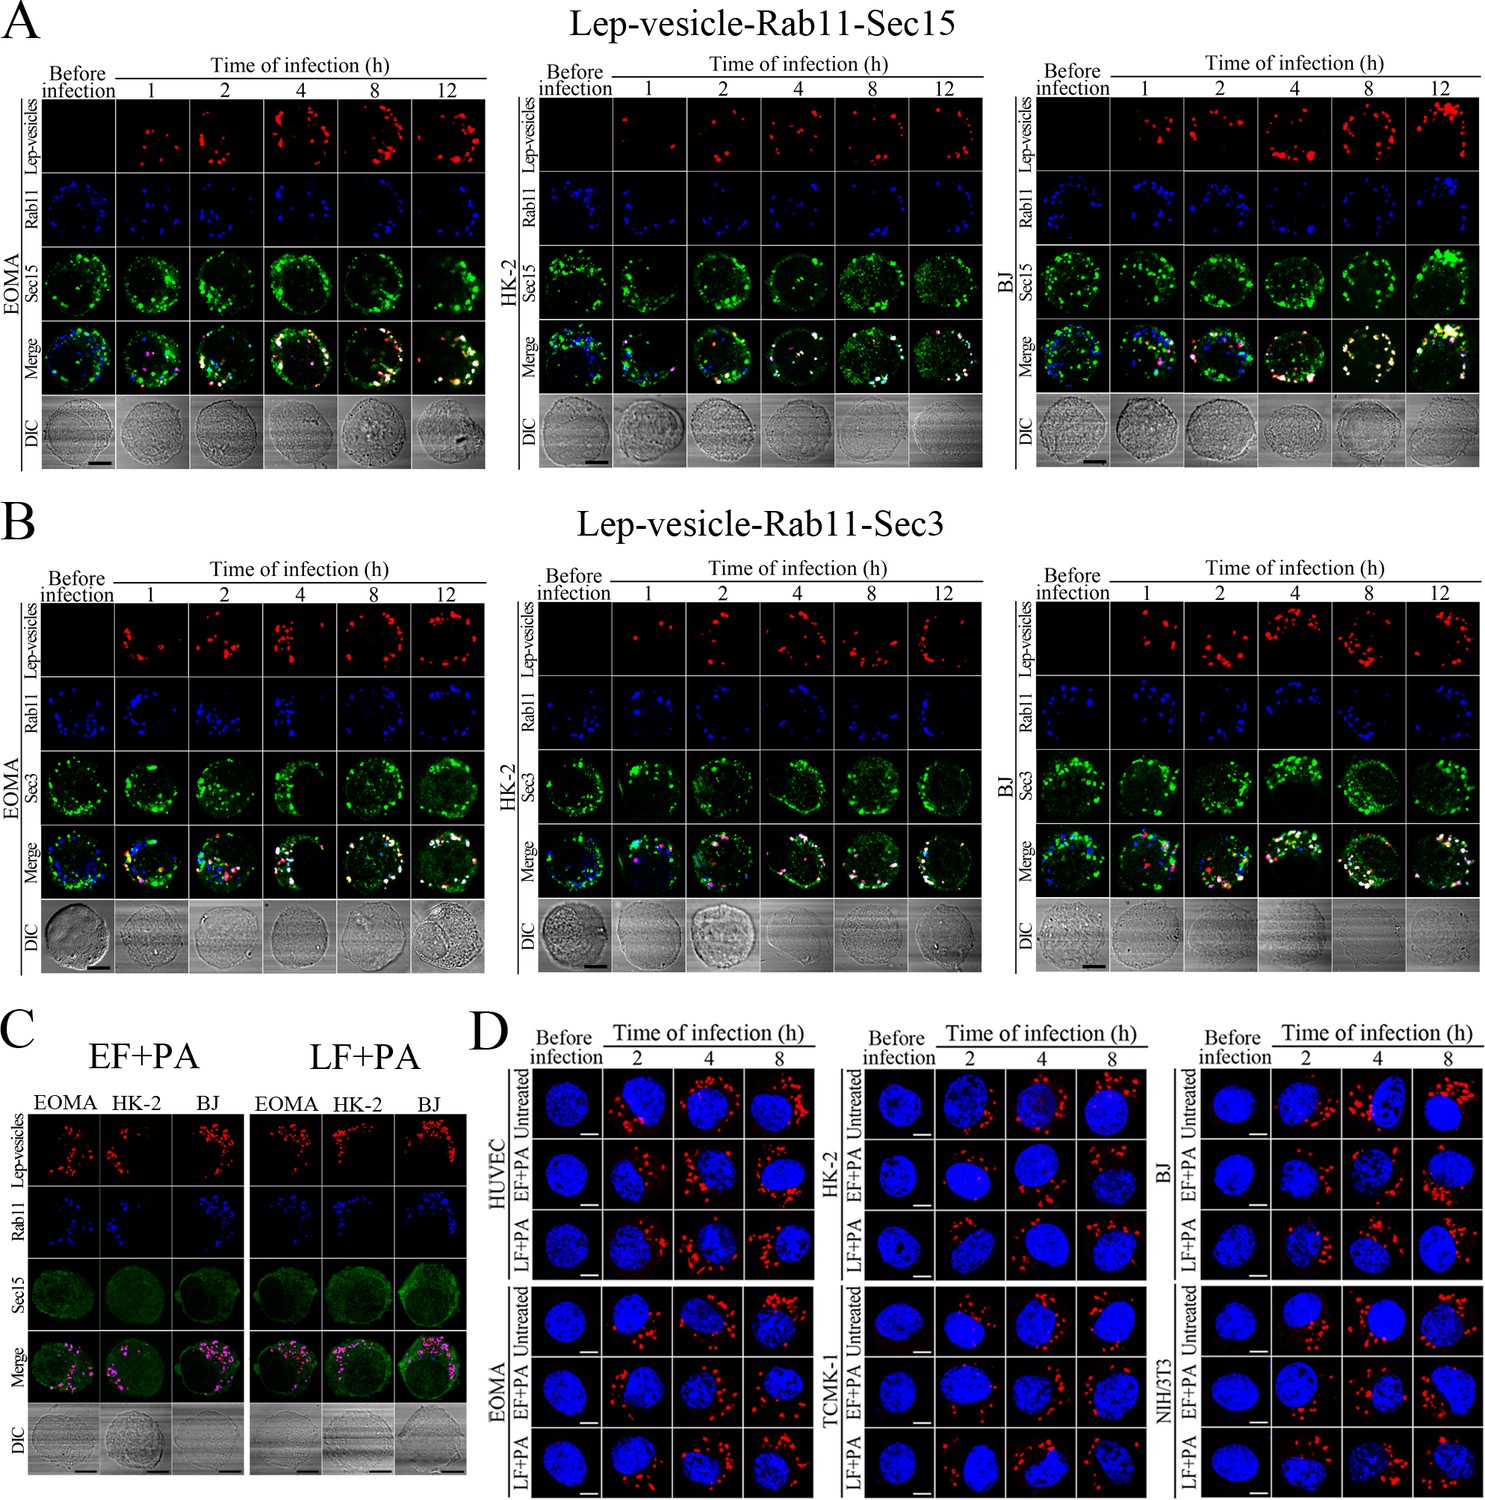
Recycling endosome-exocyst complex formation of Lep-vesicles by recruitment of Sec15/Sec3.
(A) Co-localization of Lep-vesicle-Rab11 with Sec15 in the cells infected with L. interrogans strain Lai for the indicated times, determined by confocal microscopy (scale bars = 5 μm). The red, blue or green spots indicate the Lep-vesicles, recycling endosome marker Rab11 or exocyst complex marker Sec15. The white spots indicate the Lep-vesicle-Rab11-Sec15 co-localization. (B) Co-localization of Lep-vesicle-Rab11 with Sec3 in the cells infected with L. interrogans strain Lai for the indicated times, determined by confocal microscopy (scale bars = 5 μm). The legends are the same as shown in (A) but for detection of Lep-vesicle-Rab11-Sec3 co-localization. (C) Absence of Lep-vesicle-recycling endosome-exocyst complexes in the anthrax toxin-treated cells infected with L. interrogans strain Lai for 8 hr, determined by confocal microscopy (scale bars = 5 μm). No white spots indicating the co-localization of Lep-vesicles with recycling endosome marker Rab11 and exocyst complex marker Sec15 were found. (D) Leptospires in the anthrax toxin-treated cells infected with L. interrogans strain Lai for the indicated times, examined by confocal microscopy (scale bars = 5 μm). The blue plaques indicate the nucleus. The red spots around the nucleus indicate the intracellular leptospires.
Figure 5 with 2 supplements
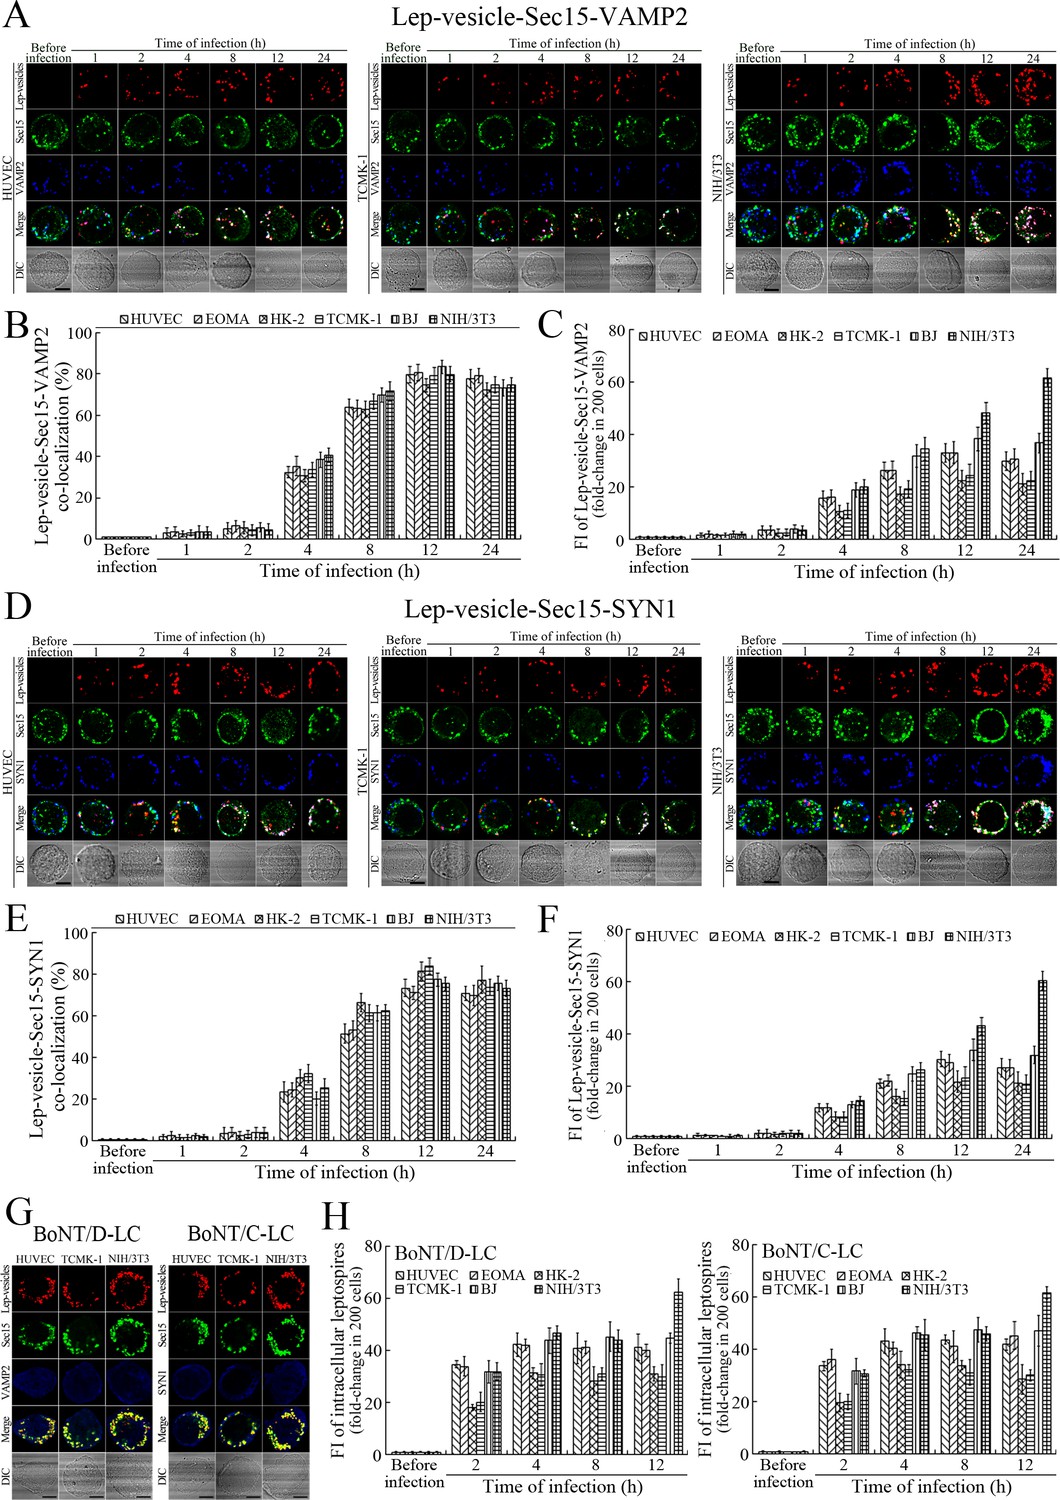
Recycling endosome-exocyst-SNARE complex formation of Lep-vesicles by recruitment of VAMP2/SYN1.
(A) Co-localization of Lep-vesicle-Sec15 with VAMP2 in the cells infected with L. interrogans strain Lai for the indicated times, determined by confocal microscopy (scale bars = 5 μm). The red, green or blue spots indicate the Lep-vesicles, exocyst complex marker Sec15 or SNARE complex marker VAMP2. The white spots indicate the Lep-vesicle-Sec15-VAMP2 co-localization. The Lep-vesicle-Sec15-VAMP2 co-localization in the EOMA, HK-2 and BJ cells during infection was shown in the Figure 5—figure supplement 1A. (B) Statistical summary of Lep-vesicle-Sec15-VAMP2 co-localization percentages for the indicated times. Statistical data from experiments such as shown in (A). Bars show the means ± SD of three independent experiments. Two hundred cells in each experiment were analyzed to calculate the percentages. (C) Statistical summary of white fluorescence intensity values reflecting the Lep-vesicle-Sec15-VAMP2 co-localization for the indicated times. The legends are the same as shown in (B) but for detection of the white fluorescence intensity (FI). The white FI values from the uninfected cells (before infection) were set as 1.0. (D) Co-localization of Lep-vesicle-Sec15 with SYN1 in the cells infected with L. interrogans strain Lai for the indicated times, determined by confocal microscopy (scale bars = 5 μm). The red, green or blue spots indicate the Lep-vesicles-RE, EC marker Sec15 or SNARE-C marker SYN1. The white spots indicate the Lep-vesicle-Sec15-SYN1 co-localization. The Lep-vesicle-Sec15-SNY1 co-localization in the EOMA, HK-2 and BJ cells during infection was shown in the Figure 5—figure supplement 1B. (E) Statistical summary of Lep-vesicle-Sec15-SYN1 co-localization percentages for the indicated times. Statistical data from experiments such as shown in (D). The legends are the same as shown in (B) but for determination of Lep-vesicle-Sec15-SYN1 co-localization percentages. (F) Statistical summary of white fluorescence intensity reflecting the Lep-vesicle-Sec15-SYN1 co-localization for the indicated times. Statistical data from experiments such as shown in (D). The other legends are the same as shown in (C). (G) Absence of Lep-vesicle-exocyst-SNARE complexes in the botulismotoxin-treated cells infected with L. interrogans strain Lai for 12 hr, determined by confocal microscopy (scale bars = 5 μm). No white spots indicating the co-localization of Lep-vesicles with exocyst complex marker Sec15 and SNARE complex markers VAMP2/SYN1 were found. The Lep-vesicle-exocyst-SNARE complexes in the botulismotoxin-treated EOMA, HK-2 and BJ cells at 12 hr post-infection were shown in the Figure 5—figure supplement 1C. (H) Statistical summary of red fluorescence intensity reflecting the leptospires in the botulismotoxin-transfected cells for the indicated times, examined by confocal microscopy. Bars show the means ± SD of three independent experiments. The red fluorescence intensity values from the uninfected cells (before infection) were set as 1.0.
Figure 5—figure supplement 1
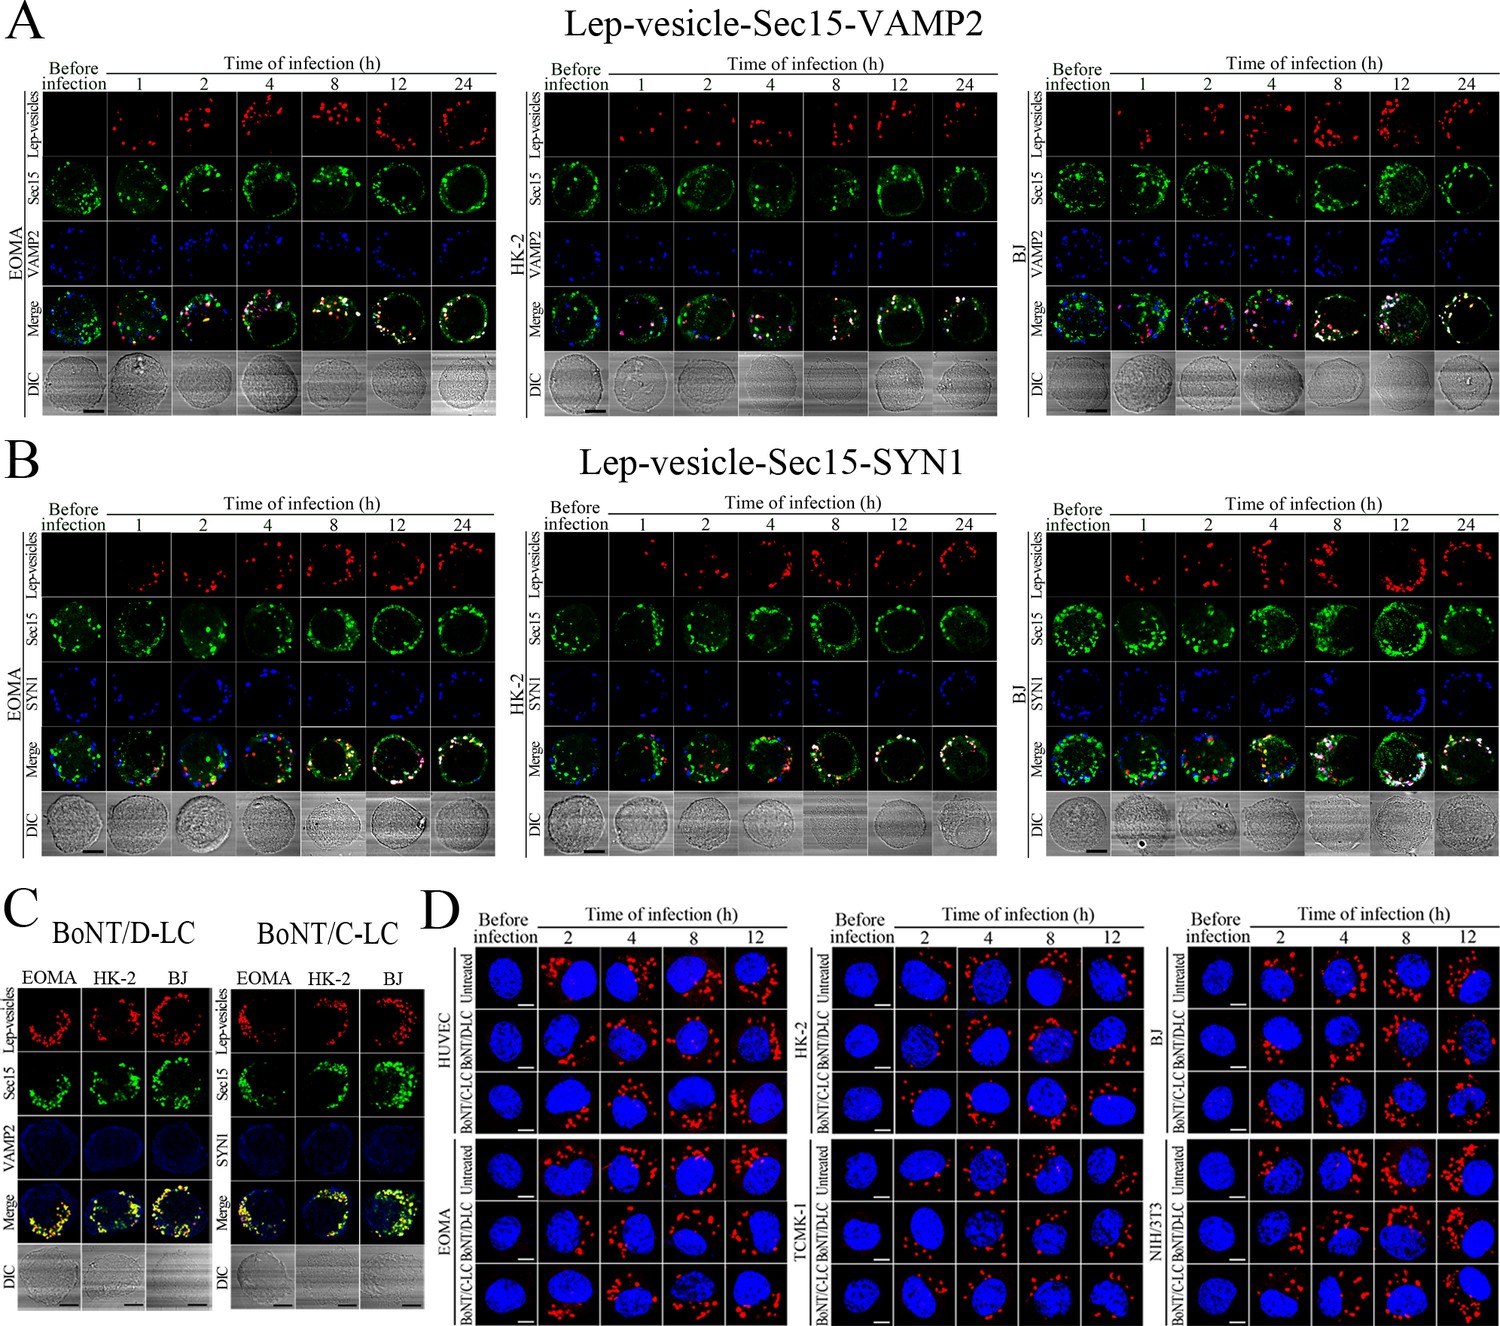
Recycling endosome-exocyst-SNARE complex formation of Lep-vesicles by recruitment of VAMP2/SYN1.
(A) Co-localization of Lep-vesicle-Sec15 with VAMP2 in the cells infected with L. interrogans strain Lai for the indicated times, determined by confocal microscopy (scale bars = 5 μm). The red, green or blue spots indicate the Lep-vesicles, exocyst complex marker Sec15 or SNARE complex marker VAMP2. The white spots indicate the Lep-vesicle-Sec15-VAMP2 co-localization. (B) Co-localization of Lep-vesicle-Sec15 with SYN1 in the cells infected with L. interrogans strain Lai for the indicated times, determined by confocal microscopy (scale bars = 5 μm). The legends are the same as shown in (A) but for detection of Lep-vesicle-Seca5-SYN1 co-localization. (C) Absence of Lep-vesicle-exocyst-SNARE complexes in the botulismotoxin-treated cells infected with L. interrogans strain Lai for 12 hr, determined by confocal microscopy (scale bars = 5 μm). No white spots indicating the co-localization of Lep-vesicles with exocyst complex marker Sec15 and SNARE complex markers VAMP2/SYN1 were found. (D) Leptospires in the botulismotoxin-treated or untreated cells infected with L. interrogans strain Lai for the indicated times, examined by confocal microscopy (scale bars = 5 μm). The blue plaques indicate the nucleus. The red spots around the nucleus indicate the intracellular leptospires.
Figure 5—figure supplement 2
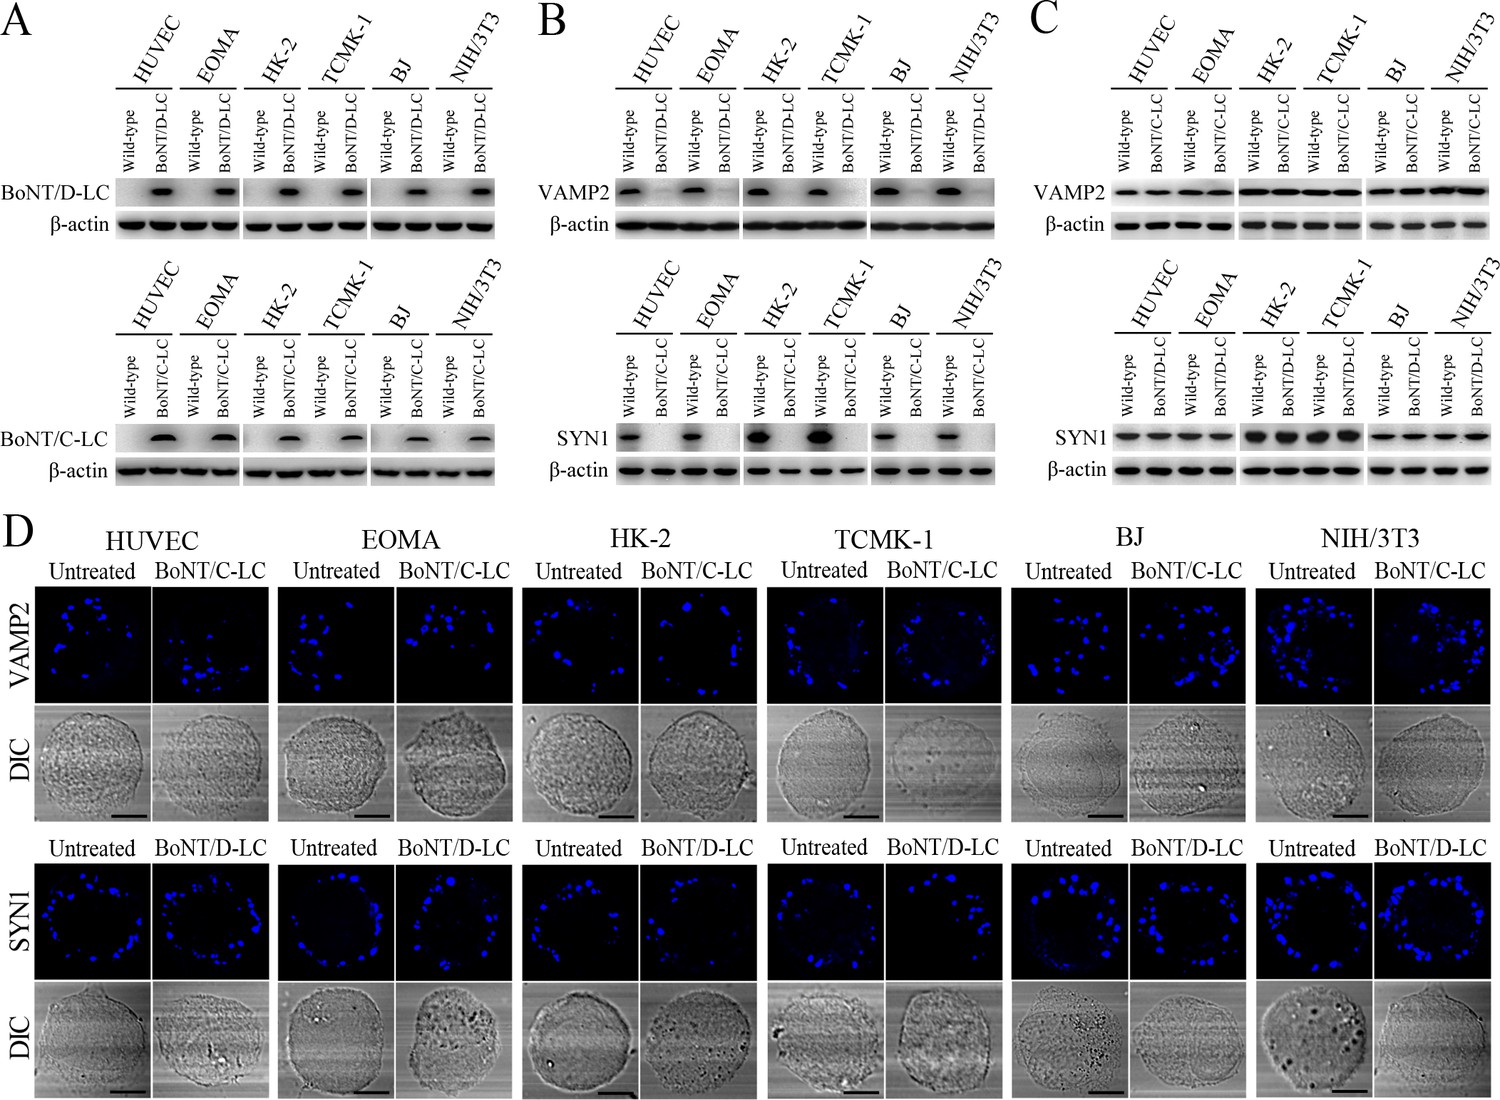
VAMP2/SYN1 cleavage by BoNT/D-LC/BoNT/C-LC transfection and VAMP2/SYN1 expression in BoNT/C-LC-/BoNT/D-LC-transfected cells.
(A) The expressed BoNT/D-LC or BoNT/C-LC in the pcDNA3.1BoNT/C-LC- or pcDNA3.1BoNT/D-LC-transfected cells, determined by Western Blot assay. (B) Absence of VAMP2 or SYN1 in the BoNT/D-LC- or BoNT/C-LC-expressed cells, determined by Western Blot assay. (C) Expression of VAMP2 in the BoNT/C-LC-transfected cells and SYN1 in the BoNT/D-LC-transfected cells, determined by Western Blot assay. (D) Fluorescence staining of VAMP2 in the BoNT/C-LC-transfected cells and SYN1 in the BoNT/D-LC-transfected cells, determined by confocal microscopy (scale bars = 5 μm).
Figure 6 with 1 supplement

Exocytosis and propagation of intracellular L. interrogans.
(A) Endocytic recycling and vesicular transport systems-mediated exocytosis of L. interrogans strain Lai from the infected cells after a 24 hr extracellular leptospire-free re-incubation, examined by dark field microscopic Petroff-Hausser enumeration. Bars show the means ± SD of three independent experiments. (B) Release of L. interrogans strain Lai from the infected cells for the indicated times during extracellular leptospire-free re-incubation, examined by dark field microscopic Petroff-Hausser enumeration. Bars show the means ± SD of three independent experiments. (C) Number of L. interrogans strain Lai in the infected cells for the indicated times during extracellular leptospire-free re-incubation, examined by dark field microscopic Petroff-Hausser enumeration. The legend is the same as shown in (B). (D) Statistical summary of fluorescence intensity reflecting the number of L. interrogans strain Lai in the infected cells for the indicated times during extracellular leptospire-free re-incubation, examined by confocal microscopy. Bars show the means ± SD of three independent experiments. The fluorescence intensity values reflecting the leptospires in the cells after a 4 hr infection with the spirochete (without re-incubation) were set as 1.0. (E) Number of L. interrogans strain Lai in the siRNA- or toxin-treated infected cells after a 24 hr extracellular leptospire-free re-incubation, examined by dark field microscopic Petroff-Hausser enumeration. The legend is the same as shown in (B). (F) Statistical summary of fluorescence intensity reflecting the number of L. interrogans strain Lai in the siRNA- or toxin-treated infected cells after a 24 hr extracellular leptospire-free re-incubation, examined by confocal microscopy. The legends are the same as shown in (D).
-
Figure 6—source data 1
Representative source data for Figure 6B–D.
- https://doi.org/10.7554/eLife.44594.016
Figure 6—figure supplement 1
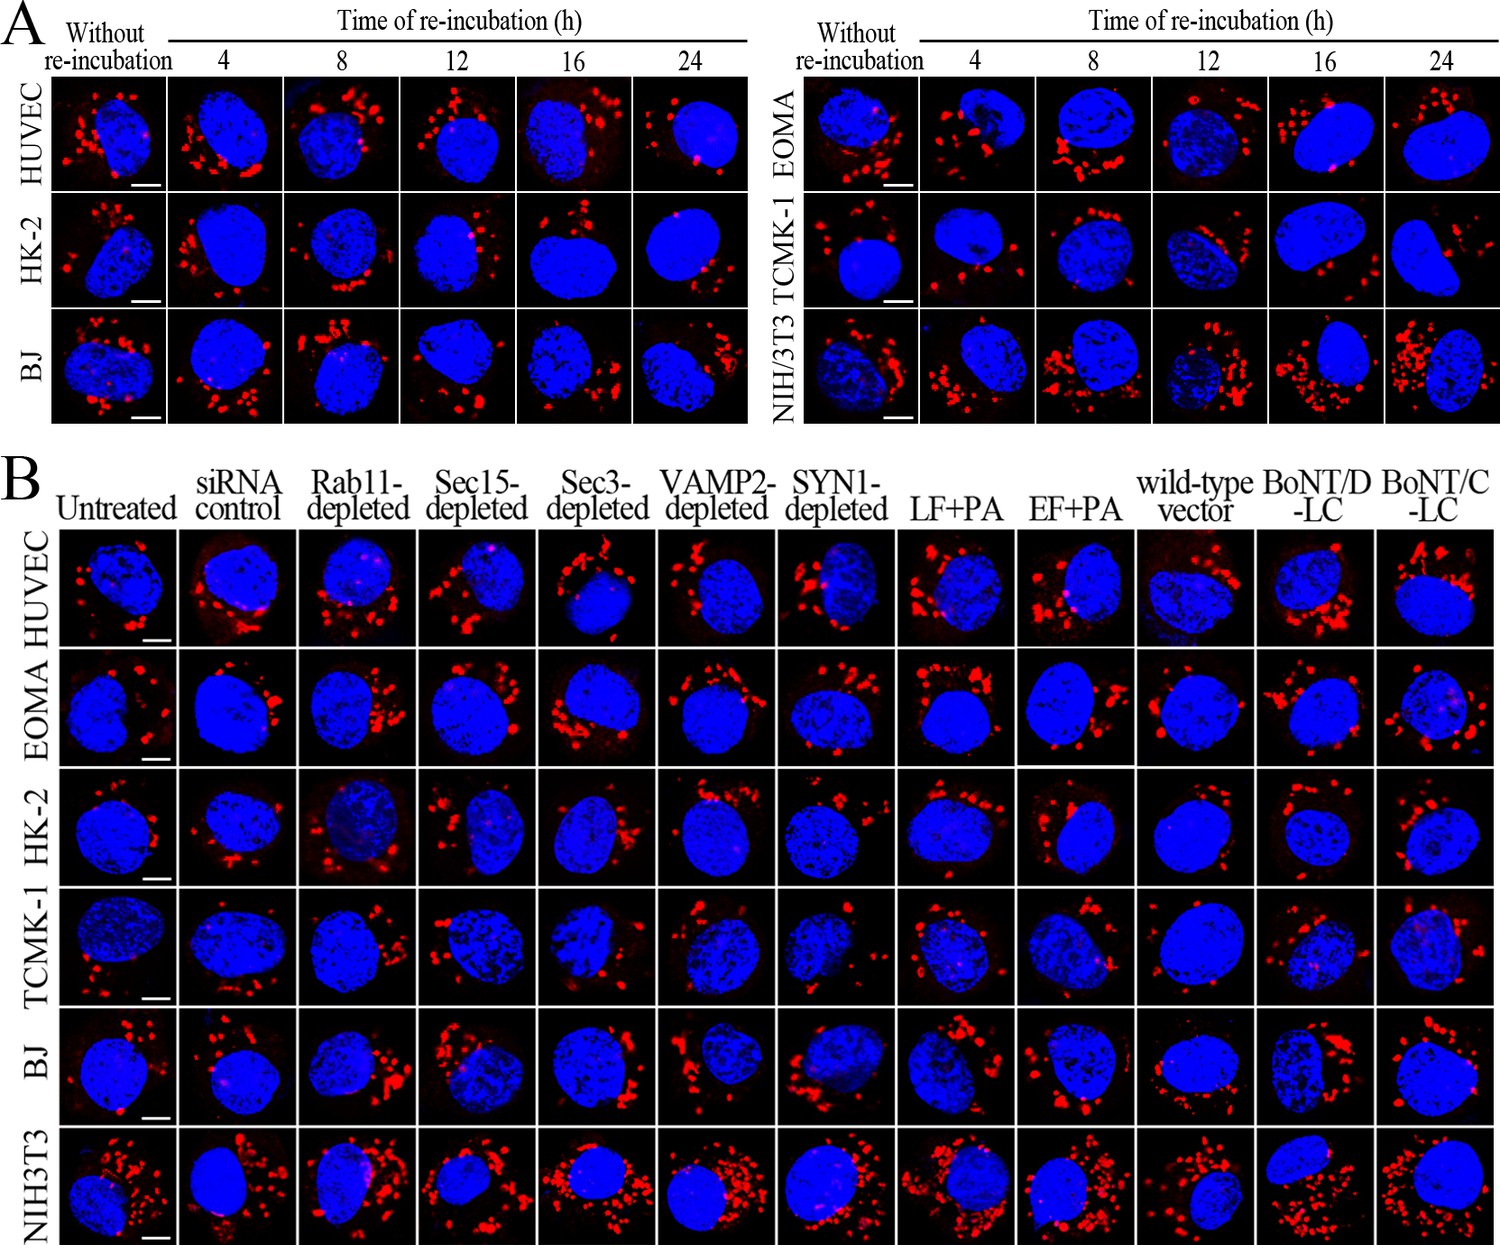
Change of leptospiral numbers in the cells during re-incubation.
(A) Leptospires in the cells after a 4 hr infection with L. interrogans strain Lai for the indicated times during extracellular leptospire-free re-incubation, examined by confocal microscopy (scale bars = 5 μm). The blue plaques indicate the nucleus. The red spots around the nucleus indicate the intracellular leptospires. (B) Leptospires in the siRNA- or toxin-treated cells after a 4 hr infection with L. interrogans strain Lai for a 24 hr extracellular leptospire-free re-incubation, examined by confocal microscopy (scale bars = 5 μm). The legends are the same as shown in (A).
Figure 7 with 1 supplement
Viability of released L. interrogans and infected cells.
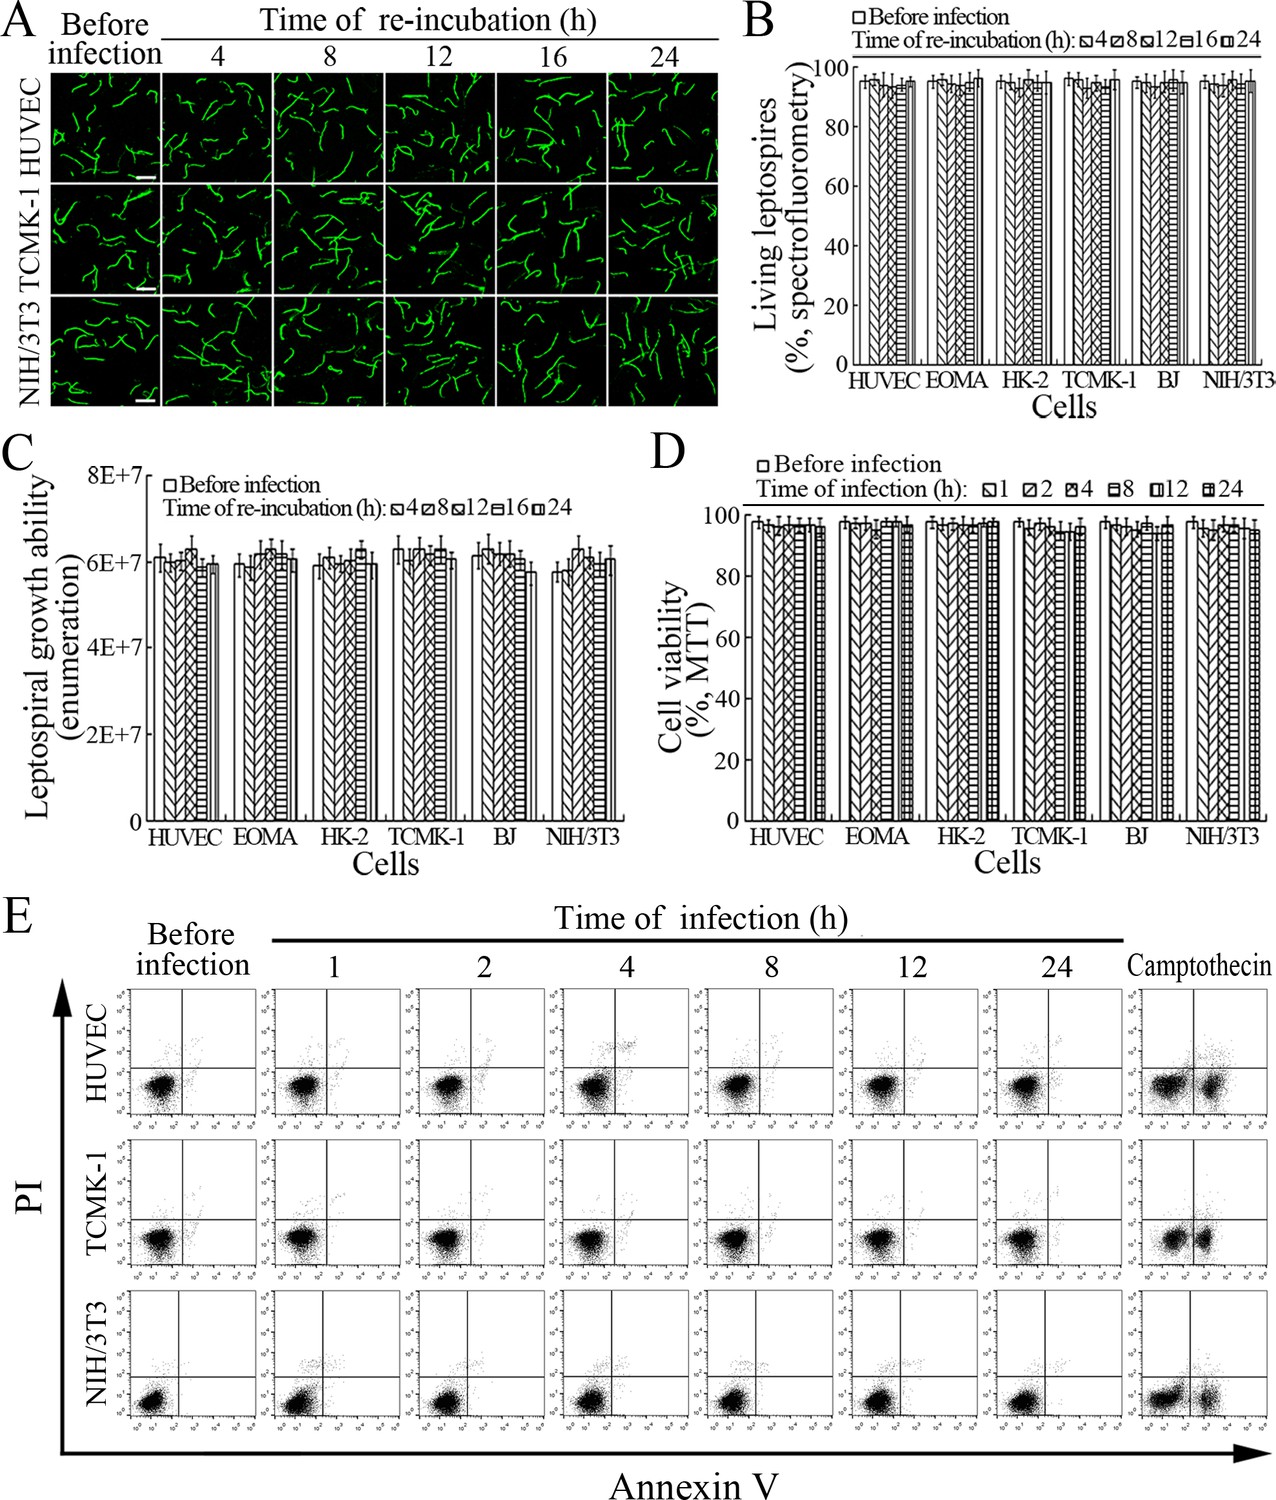
(A) Viability of L. interrogans strain Lai released from the infected cells for the indicated times, examined by confocal microscopy (scale bars = 10 μm). The green leptospires are living and the red leptospires are dead. Almost no dead leptospires could be found. Viability of the spirochete released from the infected EOMA, HK-2 and BJ cells was shown in the Figure 7—figure supplement 1A . (B) Percentages of living L. interrogans strain Lai released from the infected cells for the indicated times, examined by spectrofluorometry. Bars show the means ± SD of three independent experiments. (C) Growth ability of L. interrogans strain Lai released from the infected cells in EMJH medium for a 7-d incubation at 28°C for the indicated times, determined by dark field microscopic Petroff-Hausser enumeration. Bars show the means ± SD of three independent experiments. The leptospiral inoculated dose was 107. (D) Viability of the cells during infection with L. interrogans strain Lai for the indicated times, determined by MTT. Bars show the means ± SD of three independent experiments. (E) No apoptotic/necrotic cells during infection with L. interrogans strain Lai for the indicated times, determined by flow cytometry. The annexin-V+/PI- cells are early-apoptotic and the annexin-V+/PI+ cells are post-apoptotic/necrotic. Camptothecin, a cellular apoptotic inducer, is used as the positive control. Almost no apoptotic/necrotic infected cells were found. Viability of the EOMA, HK-2 and BJ cells during infection with the spirochete by flow cytometry was shown in the Figure 7—figure supplement 1B .
-
Figure 7—source data 1
Representative source data for Figure 7B–D.
- https://doi.org/10.7554/eLife.44594.019
Figure 7—figure supplement 1
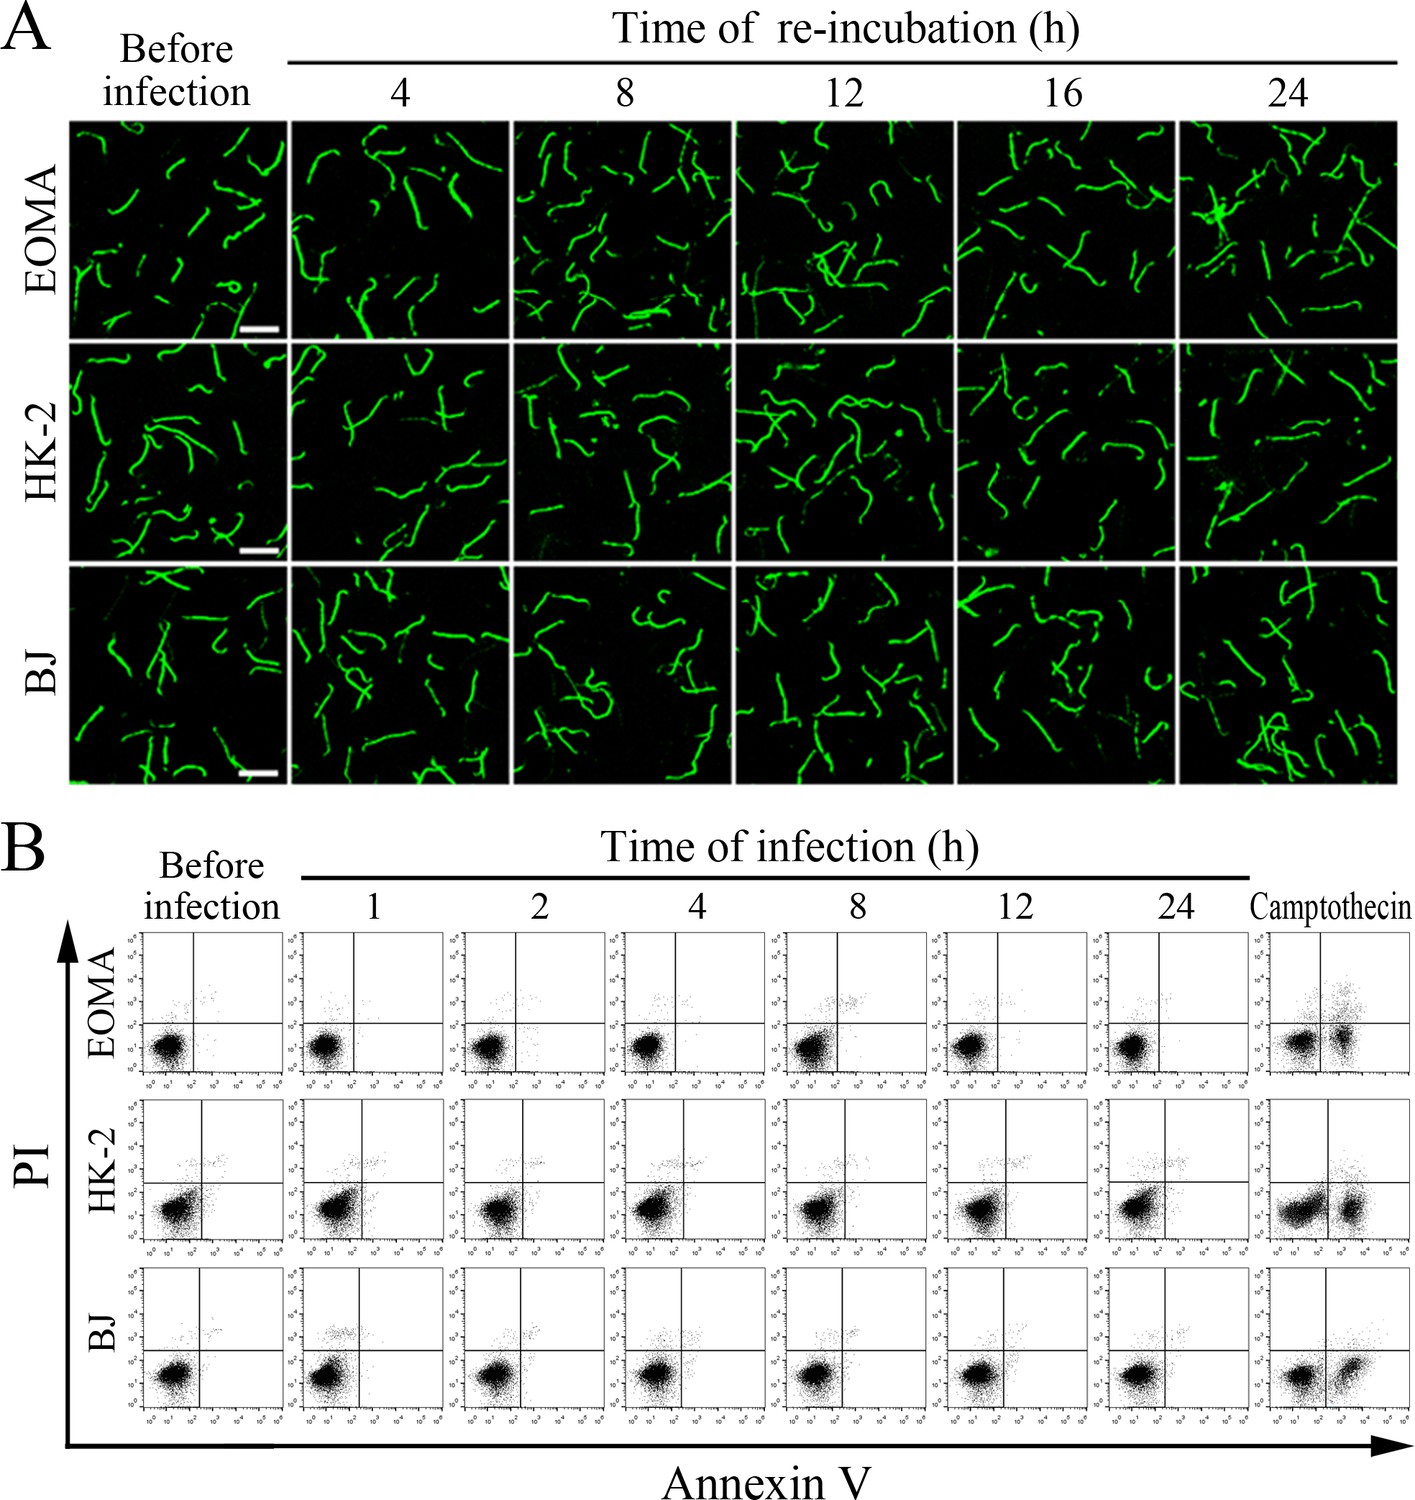
Viability of released leptospires and infected cells.
(A) Viability of L. interrogans strain Lai released from the infected cells for the indicated times, examined by confocal microscopy (scale bars = 10 μm). The green leptospires are living and the red leptospires are dead. Almost no dead leptospires were found. (B) No apoptotic or necrotic cells during infection with L. interrogans strain Lai for the indicated times, determined by flow cytometry. The annexin-V+/PI- cells are early-apoptotic and the annexin-V+/PI+ cells are post-apoptotic/necrotic. Almost no apoptotic or necrotic cells were found. Camptothecin, a cellular apoptotic inducer, is used as the positive control.
Figure 8

Rapid transcytosis of L. interrogans through different cell monolayers.
(A) Transcytosis of L. interrogans strain Lai through different cell monolayers for the indicated times, examined by confocal microscopy. The green lines indicate the cytomembrane and cellular spaces. The red spots indicate the leptospires passing through cell monolayers. (B) Transcytosis percentages of L. interrogans strain Lai through different cell monolayers for the indicated times, determined by dark field microscopic Petroff-Hausser enumeration. The time points show the means ± SD of three independent experiments. (C) The TEER change of cell monolayers during infection with L. interrogans strain Lai, examined using a cell electric resistance indicator. The time points show the means ± SD of three independent experiments. The TEER values > 200 Ω /cm2 indicate the integrity of cell monolayers and undamage of cells. (D) The permeability percentage of FITC-dextran passing through cell monolayers during infection with L. interrogans strain Lai, detected by spectrofluorometry. The time points show the means ± SD of three independent experiments. The permeability percentages < 15–20% indicate the integrity of cell monolayers and undamage of cells.
-
Figure 8—source data 1
Representative source data for Figure 8B–D.
- https://doi.org/10.7554/eLife.44594.021
Figure 9 with 1 supplement
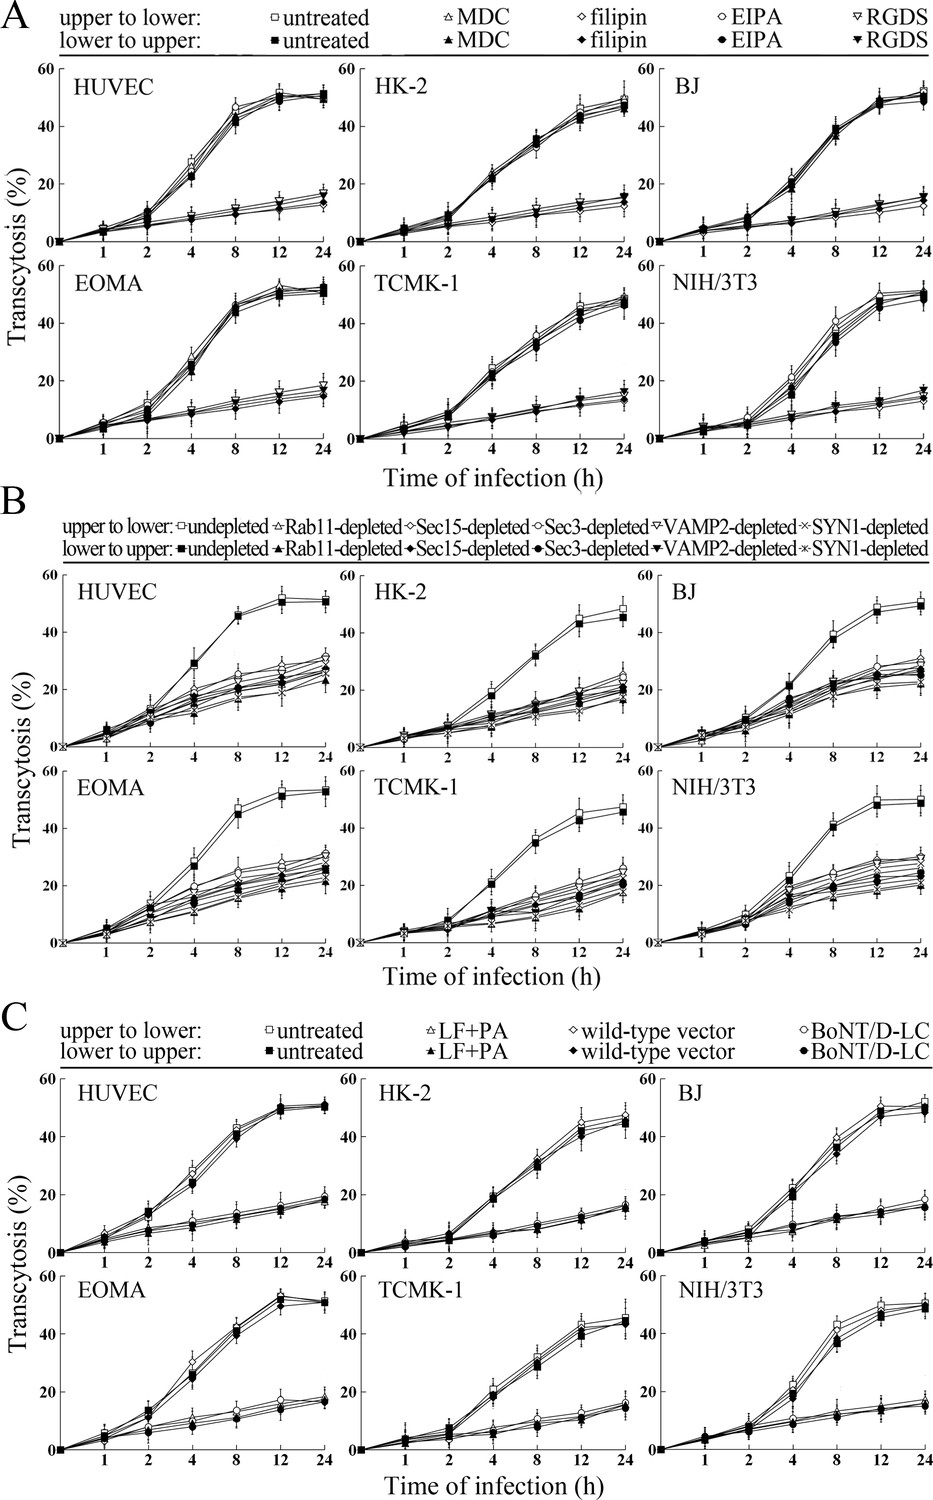
Transcytosis of L. interrogans through cell monolayers mediated by endocytic recycling and vesicular transport systems.
(A) Decreased transcytosis of L. interrogans strain Lai through the filipin- or RGDS-inhibited cell monolayers, examined by transwell test and dark field microscopic Petroff-Hausser enumeration. The time points show the means ± SD of three independent experiments. (B) Decreased transcytosis of L. interrogans strain Lai through the Rab11-, Sec15-, Sec-3, VAMP2- or SYN1-depleted cell monolayers, examined by transwell test and dark field microscopic Petroff-Hausser enumeration. The legends are the same as shown in (A). (C) Decreased transcytosis of L. interrogans strain Lai through the LF + PA or BoNT/D-LC-treated cell monolayers, examined by transwell test and dark field microscopic Petroff-Hausser enumeration. The legends are the same as shown in (A).
Figure 9—figure supplement 1
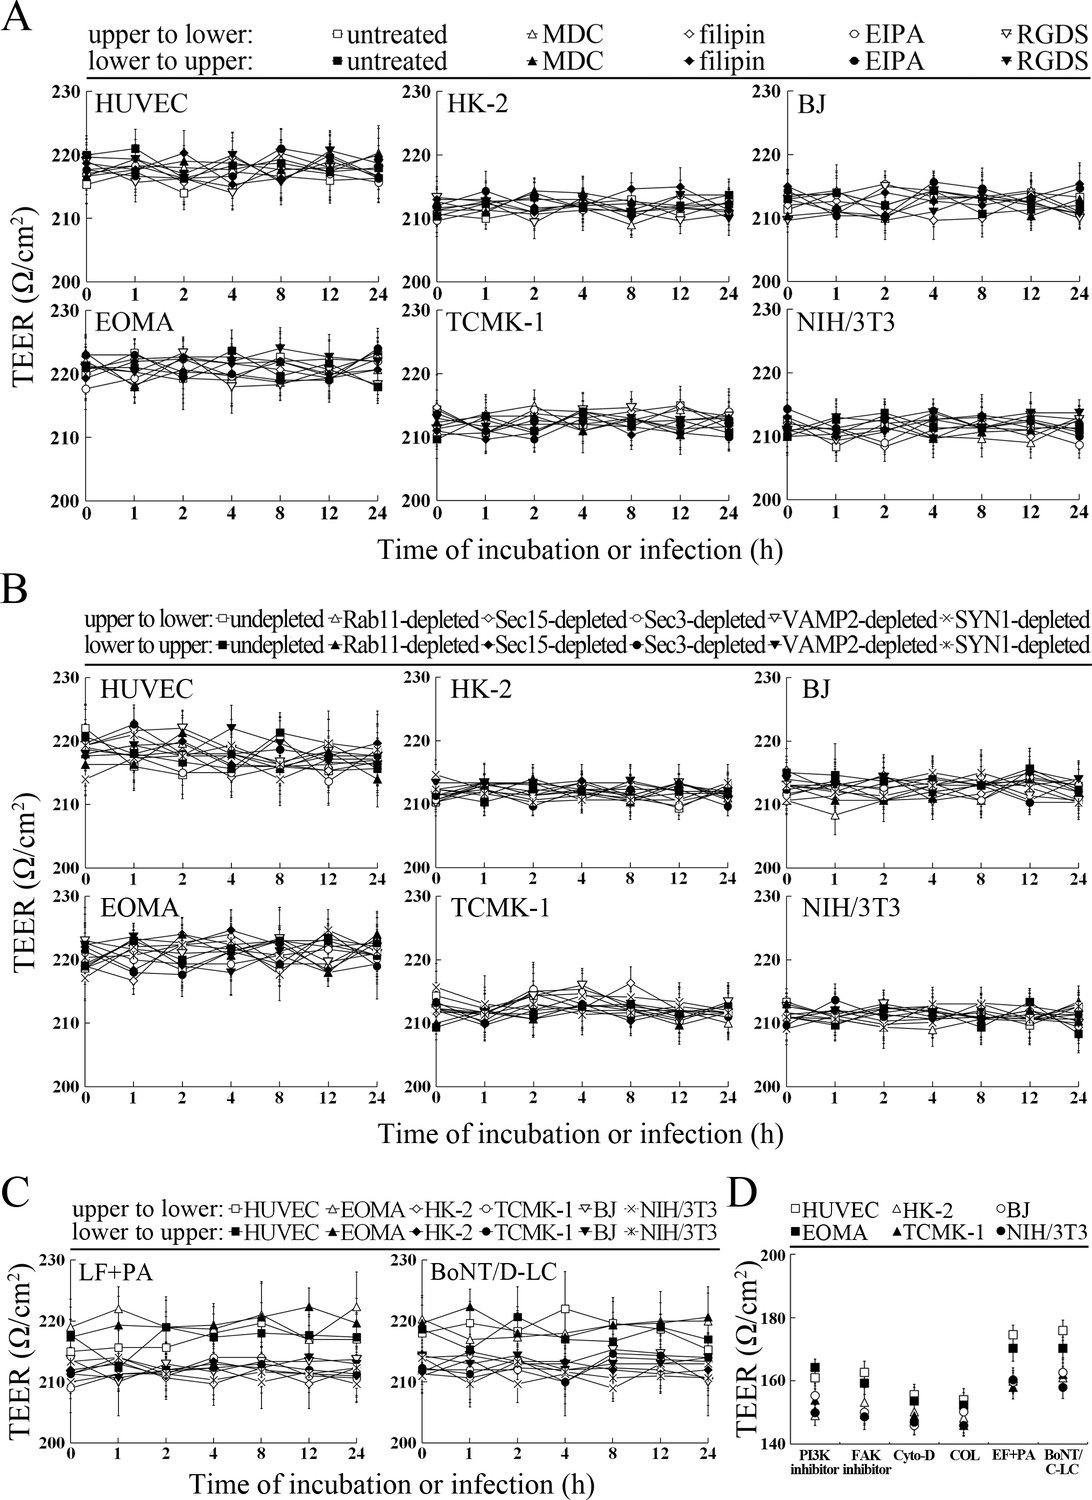
TEER values of cell monolayers in transwell test.
(A) Higher TEER of the MDC-, filipin-, EIPA- or RGDS-treated cell monolayers during incubation or infection with L. interrogans for the indicated times, detected using a cell electric resistance indicator. (B) Higher TEER of the Rab11-, Sec15-, Sec3-, VAMP2- or SYN1-depleted cell monolayers during incubation or infection with L. interrogans for the indicated times, detected using a cell electric resistance indicator. (C) Higher TEER of the LF + PA or BoNT/D-LC-treated cell monolayers during incubation or infection with L. interrogans for the indicated times, detected using a cell electric resistance indicator. (D) Lower TEER of the LY294002-, 14/Y15-, Cyto-D, COL-, EF + PA or BoNT/C-LC-pretreated cell monolayers, detected using a cell electric resistance indicator.
Figure 10
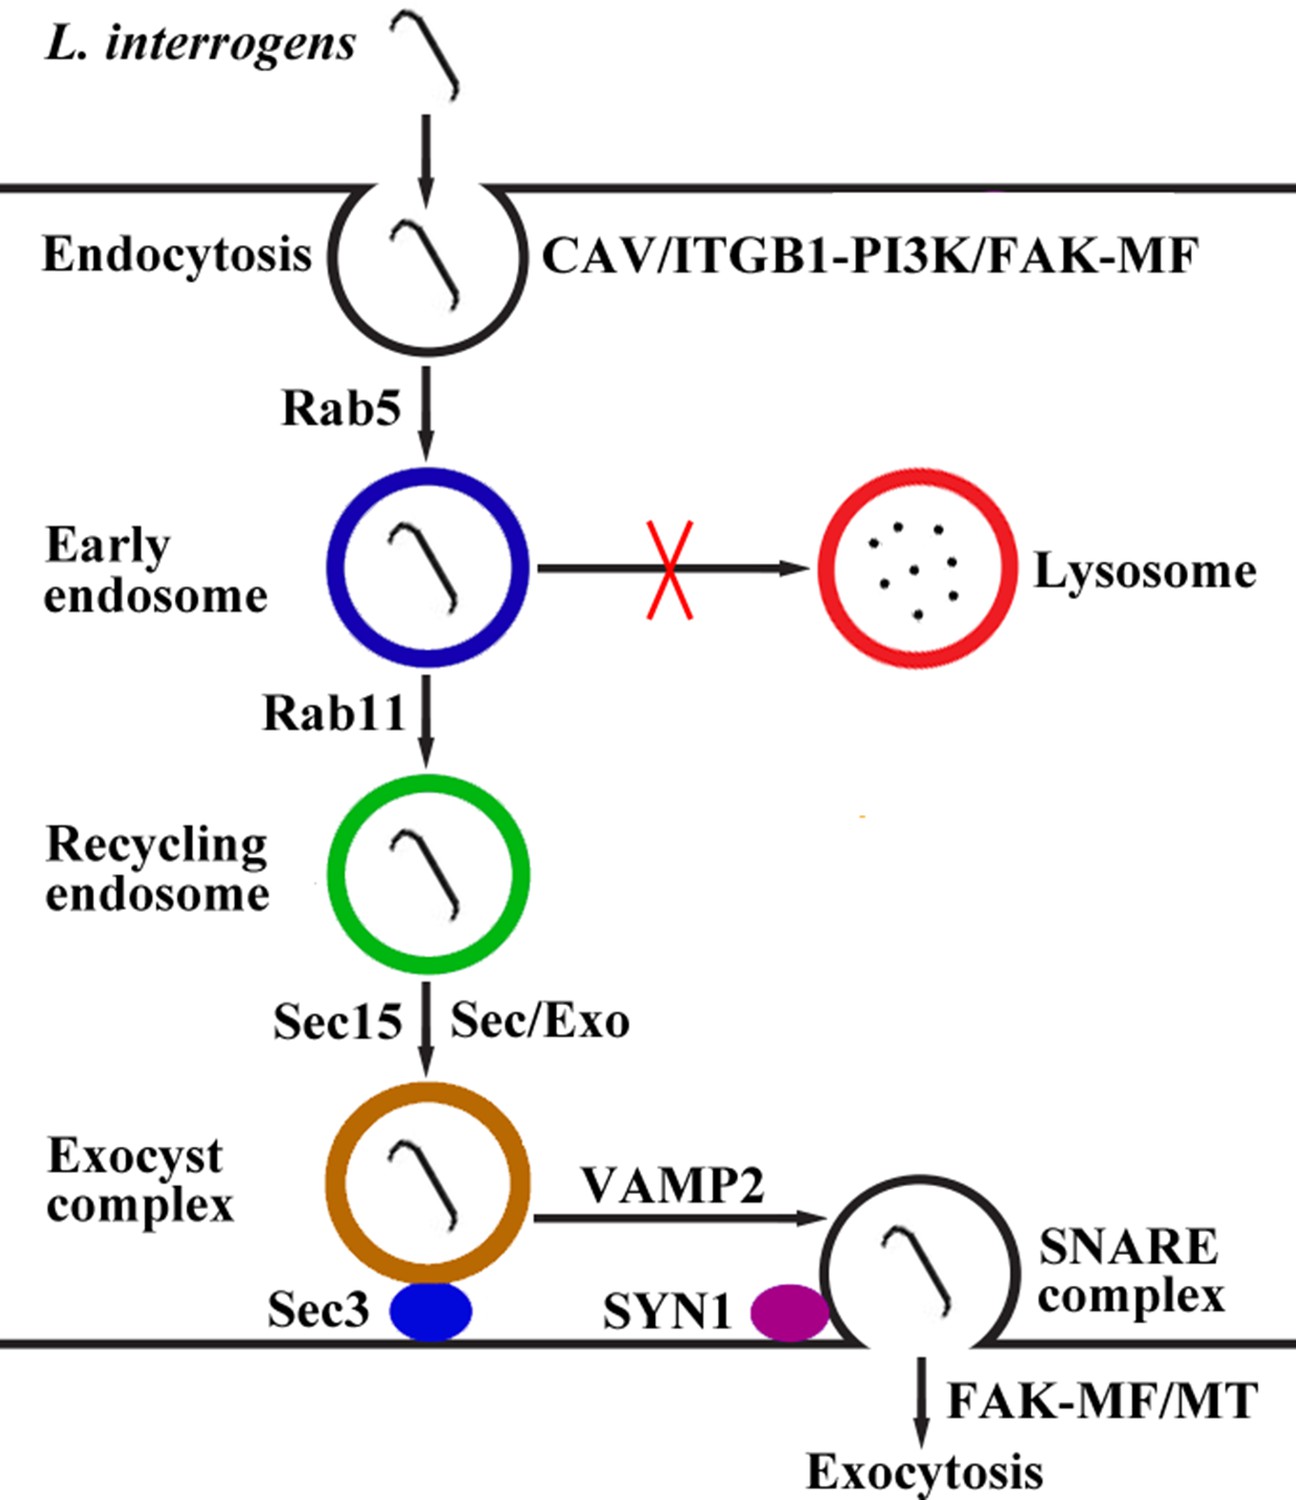
Schematic drawing of leptospiral endocytosis, intracellular transport and exocytosis.
Leptospira interrogans entered human/mouse endothelial and epithelial cells and fibroblasts by caveolae/integrin-β1-PI3K/FAK-mediated microfilament-dependent endocytosis to form Leptospira (Lep)-vesicles that did not fuse with lysosomes. Lep-vesicles recruited Rab5/Rab11 and Sec/Exo-SNARE proteins in endocytic recycling and vesicular transport systems for intracellular transport and release by SNARE-complex/FAK-mediated microfilament/microtubule-dependent exocytosis.
Tables
Key resources table
| Reagent type (species) or resource | Designation | Source or reference | Identifiers | Additional information |
|---|---|---|---|---|
| Gene (Clostridium botulinum) | The DNA segments encoding BoNT/C-LC (1–449 residues) | GenBank accession No.: X53751 | ||
| Gene (Clostridium botulinum) | The DNA segments encoding BoNT/D-LC (1–445 residues) | GenBank accession No.: AB012112 | ||
| Strain, strain background (Leptospira interrogans) | serogroup Icterohaemorrhagiae serovar Lai strain Lai | National Institute for Control of Pharmaceutical and Biological Products, China | ||
| Cell line (Homo sapiens) | HUVEC | ATCC | CRL-1730 | |
| Cell line (Homo sapiens) | HK-2 | Cell Bank, Chinese Academy of Sciences | SCSP-511 | |
| Cell line (Homo sapiens) | BJ | ATCC | CRL-2522 | |
| Cell line (Mus musculus) | EOMA | ATCC | CRL-2586 | |
| Cell line (Mus musculus) | TCMK-1 | ATCC | CCL-139 | |
| Cell line (Mus musculus) | NIH/3T3 | Cell Bank, Chinese Academy of Sciences | SCSP-515 | |
| Antibody | Rat anti-strain Lai-IgG | This study | Immuno fluorescence (IF; 1:200) | |
| Antibody | AlexaFluor594-conjugated donkey anti-rat-IgG | Abcam | Cat#ab150156 | IF(1:1000) |
| Antibody | Rabbit anti-Rab5-IgG | Cell Signaling Technology | Cat#2143 | IF(1:100); Western Blot (WB; 1:1000) |
| Antibody | Rabbit anti-Rab11-IgG | Cell Signaling Technology | Cat#5589 | IF(1:100); WB(1:2000) |
| Antibody | Rabbit anti-VAMP2-IgG | Cell Signaling Technology | Cat#13508 | IF(1:200); WB(1:1000) |
| Antibody | Rabbit anti-LAMP1-IgG | Cell Signaling Technology | Cat#3243 | WB(1:1000) |
| Antibody | Goat anti-Sec15-IgG | Santa Cruz Biotechnology | Cat#sc-34365 | IF(1:100); WB(1:500) |
| Antibody | Goat anti-Sec3-IgG | Santa Cruz Biotechnology | Cat#sc-244104 | IF(1:100); WB(1:500) |
| Antibody | Rabbit anti-SYN1-IgG | Abcam | Cat#ab41453 | IF(1:500); WB(1:1000) |
| Antibody | HRP-conjugated goat anti-rabbit-IgG | Abcam | Cat#ab6721 | WB(1:2000) |
| Antibody | HRP-conjugated donkey anti-goat-IgG | Abcam | Cat#ab97110 | WB(1:2000) |
| Antibody | Rabbit anti-LAMP1-IgG | Abcam | Cat#ab62562 | IF(1:100); WB(1:1000) |
| Antibody | AlexaFluor488-conjugated donkey anti-rabbit-IgG | Abcam | Cat#ab150073 | IF(1:1000) |
| Antibody | Goat anti-transferrin receptor (TfR)-IgG | Santa Cruz Biotechnology | Cat#sc-7087 | IF(1:100); WB(1:500) |
| Antibody | AlexaFluor488-conjugated donkey anti-goat-IgG | Abcam | Cat#ab150129 | IF(1:1000) |
| Antibody | AlexaFluor405-conjugated donkey anti-rabbit-IgG | Abcam | Cat#ab175651 | IF(1:1000) |
| Antibody | Rabbit anti- Na/K-ATPase-IgG | Abcam | Cat#ab76020 | IF(1:500) |
| Antibody | Rabbit anti-CAV1-IgG | Cell Signaling Technology | Cat#3267 | WB(1:1000) |
| Antibody | Rabbit anti-ITGB1-IgG | Abcam | Cat#ab179471 | WB(1:1000) |
| Antibody | Mouse anti-ITGB2-IgG | Santa Cruz Biotechnology | Cat#sc-8420 | WB(1:500) |
| Antibody | Rabbit anti-ITGB3-IgG | Abcam | Cat#ab119992 | WB(1:1000) |
| Antibody | Rabbit anti-BoNT/C-LC-IgG | MyBioSource | Cat#MBS1497273 | WB(1:500) |
| Antibody | Sheep anti-BoNT/D-LC-IgG | R&D | Cat#AF6037 | WB(1:1000) |
| Antibody | HRP-conjugated goat anti-mouse-IgG | Abcam | Cat#ab205719 | WB(1:2000) |
| Antibody | HRP-conjugated donkey anti-sheep-IgG | Abcam | Cat#ab97125 | WB(1:5000) |
| Commercial assay or kit | BCA Protein Assay Kit | Thermo Fisher Scientific | Cat#23225 | |
| Commercial assay or kit | LIVE/DEAD Bacterial Viability Kit | Invitrogen | Cat#L7012 | |
| Commercial assay or kit | Cell Proliferation Kit | Sigma | Cat#11465007001 | |
| Commercial assay or kit | Cell Dead/Apoptosis Kit | Invitrogen | Cat#V13241 | |
| Chemical compound, drug | Edema factor of anthrax toxin | List Biological Laboratories | Cat#178A | |
| Chemical compound, drug | Lethal factor of anthrax toxin | List Biological Laboratories | Cat#169A | |
| Chemical compound, drug | Protective antigen of anthrax toxin | List Biological Laboratories | Cat#171E | |
| Other | DMEM medium | GiBco | Cat#11965–092 | |
| Other | RPMI-1640 medium | GiBco | Cat#11875–093 | |
| Other | Fetal calf serum | GiBco | Cat#10099141 | |
| Other | Human CAV1 siRNA | Thermo Fisher Scientific | Cat#HSS141466 | |
| Other | Mouse CAV1 siRNA | Thermo Fisher Scientific | Cat#MSS273501 | |
| Other | Human ITGB1 siRNA | Thermo Fisher Scientific | Cat#HSS105559 | |
| Other | Mouse ITGB1 siRNA | Thermo Fisher Scientific | Cat#MSS205553 | |
| Other | Human ITGB2 siRNA | Thermo Fisher Scientific | Cat#HSS105562 | |
| Other | Mouse ITGB2 siRNA | Thermo Fisher Scientific | Cat#MSS205556 | |
| Other | Human ITGB3 siRNA | Thermo Fisher Scientific | Cat#HSS105565 | |
| Other | Mouse ITGB3 siRNA | Thermo Fisher Scientific | Cat#MSS205563 | |
| Other | Human Sec15 siRNA | Thermo Fisher Scientific | Cat#HSS123022 | |
| Other | Mouse Sec15 siRNA | Thermo Fisher Scientific | Cat#MSS200786 | |
| Other | Human Sec3 siRNA | Thermo Fisher Scientific | Cat#HSS124985 | |
| Other | Mouse Sec3 siRNA | Thermo Fisher Scientific | Cat#MSS229985 | |
| Other | Human VAMP2 siRNA | Thermo Fisher Scientific | Cat#HSS144163 | |
| Other | Mouse VAMP2 siRNA | Thermo Fisher Scientific | Cat#MSS278658 | |
| Other | Human Rab11 siRNA | Dharmacon | Cat#D-004726–01 | |
| Other | Mouse Rab11 siRNA | Dharmacon | Cat#D-040863–01 | |
| Other | Human SYN1 siRNA | Dharmacon | Cat#D-012677–01 | |
| Other | Mouse SYN1 siRNA | Dharmacon | Cat#D-050438–01 | |
| Other | Negative control siRNA | Thermo Fisher Scientific | Cat#12935100 | |
| Other | Lipofectamine RNAiMAX | Thermo Fisher Scientific | Cat#13778500 | |
| Other | Lipofectamine 3000 | Thermo Fisher Scientific | Cat#L3000008 |
Additional files
-
Transparent reporting form
- https://doi.org/10.7554/eLife.44594.025
Download links
A two-part list of links to download the article, or parts of the article, in various formats.
Downloads (link to download the article as PDF)
Open citations (links to open the citations from this article in various online reference manager services)
Cite this article (links to download the citations from this article in formats compatible with various reference manager tools)
RETRACTED: Endocytic recycling and vesicular transport systems mediate transcytosis of Leptospira interrogans across cell monolayer
eLife 8:e44594.
https://doi.org/10.7554/eLife.44594


