Early-generated interneurons regulate neuronal circuit formation during early postnatal development
- Jing'an District Centre Hospital of Shanghai, State Key Laboratory of Medical Neurobiology and MOE Frontiers Center for Brain Science, Institutes of Brain Science, Fudan University, China
- School of Life Sciences, Tsinghua-Peking Joint Center for Life Sciences, IDG/McGovern Institute for Brain Research, Tsinghua University, China
Figures
Figure 1 with 3 supplements
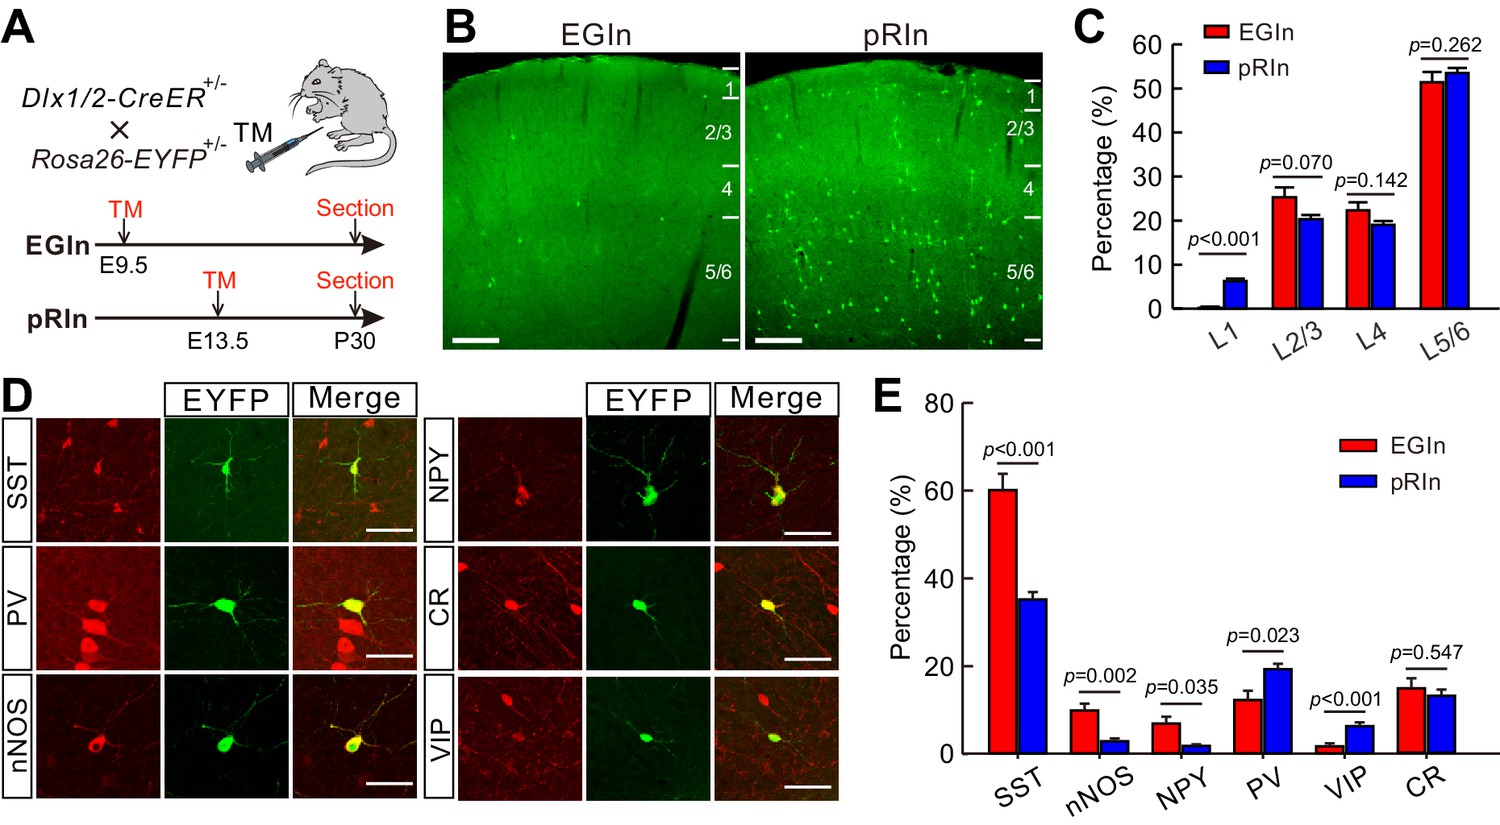
Laminar distribution and molecular marker expression of EGIns and pRIns in the somatosensory cortex at P30.
(A) Schematic diagram representing the inducible transgenic strategy for labeling EGIns and pRIns. (B) Representative images showing the laminar distribution of EGIns (left) and pRIns (right). Scale bar, 200 μm. (C) Percentages of EGIns and pRIns located in different layers of the somatosensory cortex. (D) Sample images showing the co-expression of EYFP+ neurons with SST, nNOS, NPY, PV, VIP and CR. Scale bar, 50 μm. (E) Percentages of EGIns and pRIns that were also positive for various molecular markers. Detailed statistical analysis, detailed data, and exact sample numbers are presented in Figure 1—source data 1. Error bars indicate mean ± SEM.
-
Figure 1—source data 1
Detailed statistical analysis, detailed data, exact sample numbers, and p values in Figure 1 and Figure 1—figure supplements 2 and 3 and detailed cell densities of EGIns and pRIns.
- https://doi.org/10.7554/eLife.44649.006
Figure 1—figure supplement 1
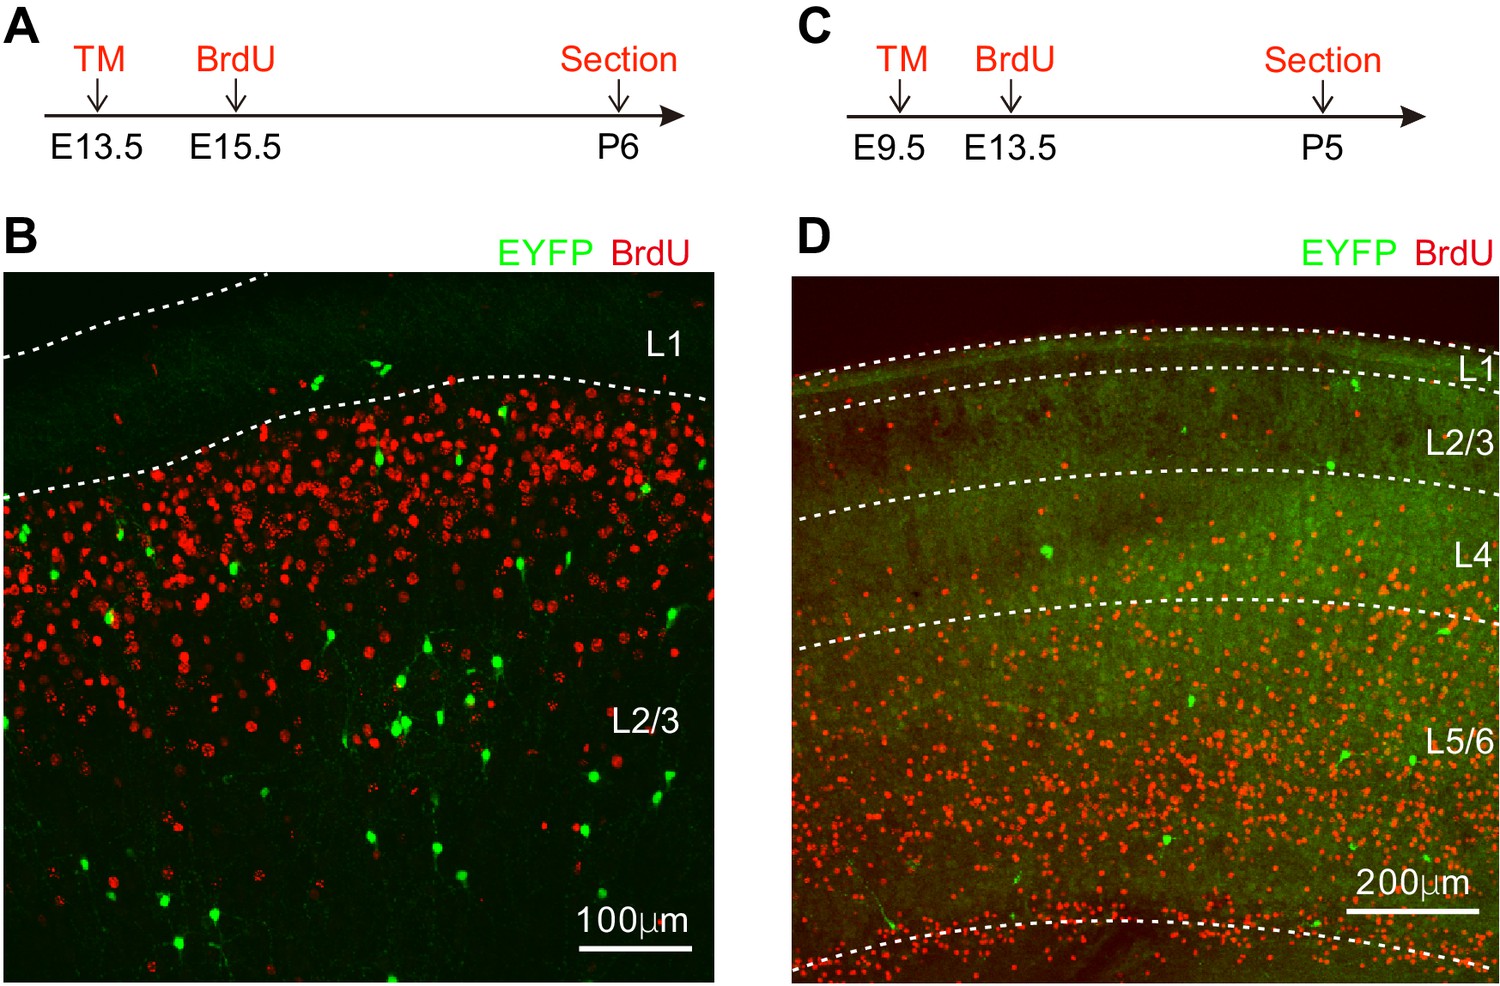
Short-term fate mapping of Dlx1/2-CreER+/-; Rosa26-EYFP+/- line.
(A) Schematic diagram representing TM (E13.5) and BrdU administration (E15.5). (B) Few EYFP+ cells co-expressed BrdU at P6 under TM (E13.5) and BrdU administration (E15.5). (C) Schematic diagram representing TM (E9.5) and BrdU administration (E13.5). (D) Few EYFP+ cells co-expressed BrdU at P5 under TM (E9.5) and BrdU administration (E13.5).
Figure 1—figure supplement 2
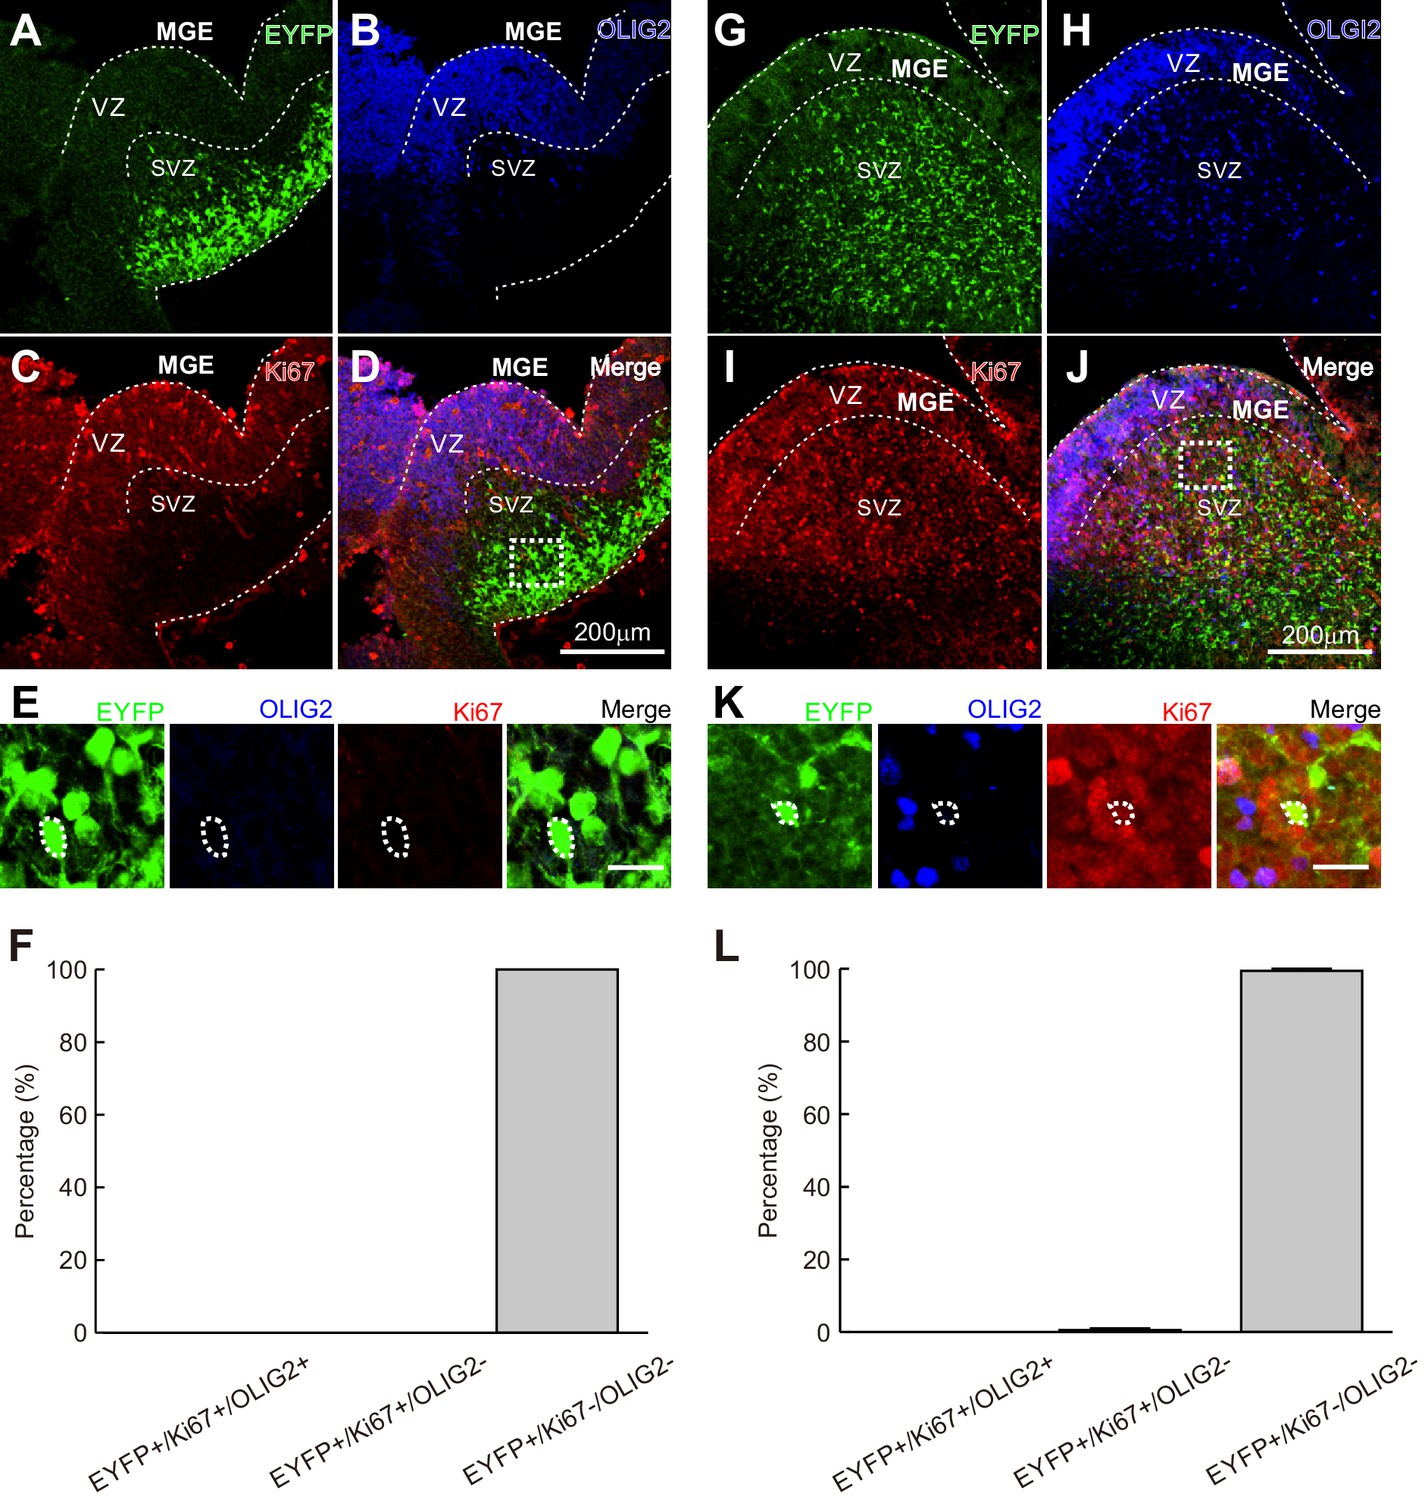
Characterization of the original cells labeled by Dlx1/2-CreER at E9.5 and E13.5.
(A–D) Confocal microphotograph showing EYFP (Dlx1/2-CreER-labeled cells at E9.5), OLIG2 and Ki67 expression in MGE. (E) Magnified images in (D) (rectangular region). Scale bar, 20 μm. (F) Histogram of the percentages of OLIG2+/Ki67+, OLIG2-/Ki67+, and OLIG2-/Ki67- cells in EYFP+ cells (Dlx1/2-CreER-labeled cells at E9.5). (G–J) Confocal microphotograph showing EYFP (Dlx1/2-CreER-labeled cells at E13.5), OLIG2 and Ki67 expression in MGE. (K) Magnified images in (J) (rectangular region). Scale bar, 20 μm. (F) Histogram of the percentages of OLIG2+/Ki67+, OLIG2-/Ki67+, and OLIG2-/Ki67- cells in EYFP+ cells (Dlx1/2-CreER-labeled cells at E13.5). Detailed statistical analysis, detailed data and exact sample numbers are presented in the Figure 1—source data 1. Error bars indicate mean ± SEM.
Figure 1—figure supplement 3
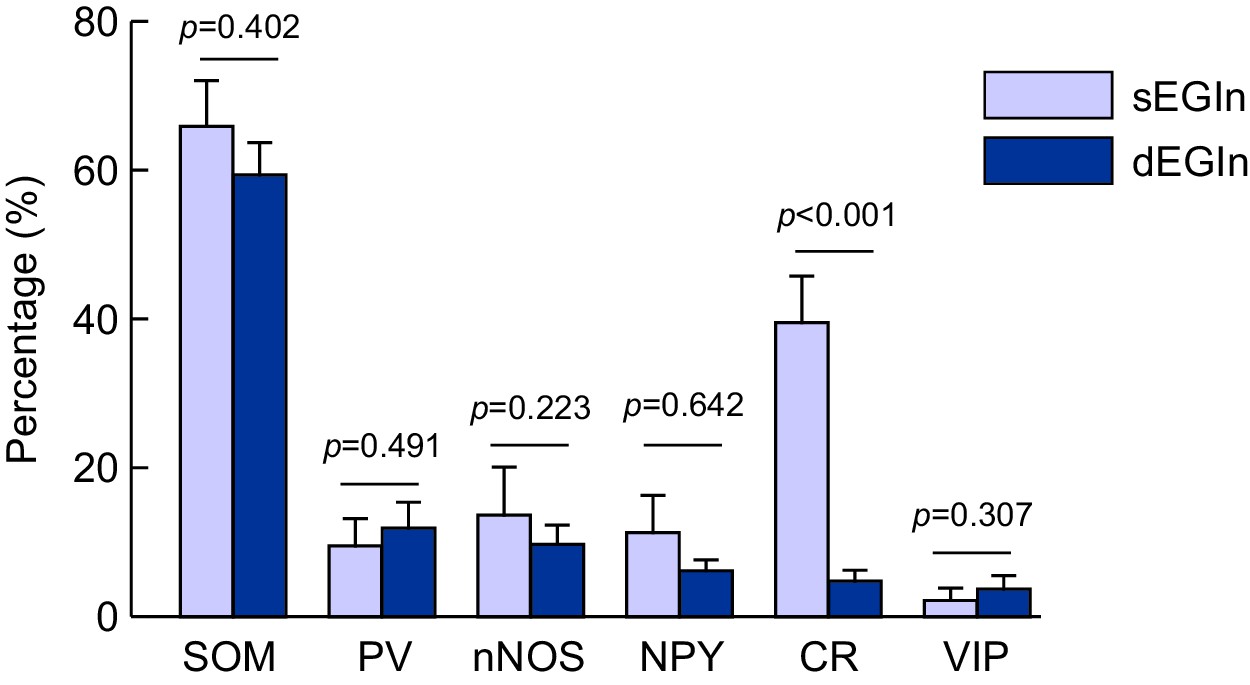
The percentages of sEGIns (layer 2/3) and dEGIns (layer 5/6) that express various molecular markers.
Detailed statistical analysis, detailed data, and exact sample numbers are presented in Figure 1—source data 1. Error bars indicate mean ± SEM.
Figure 2 with 4 supplements
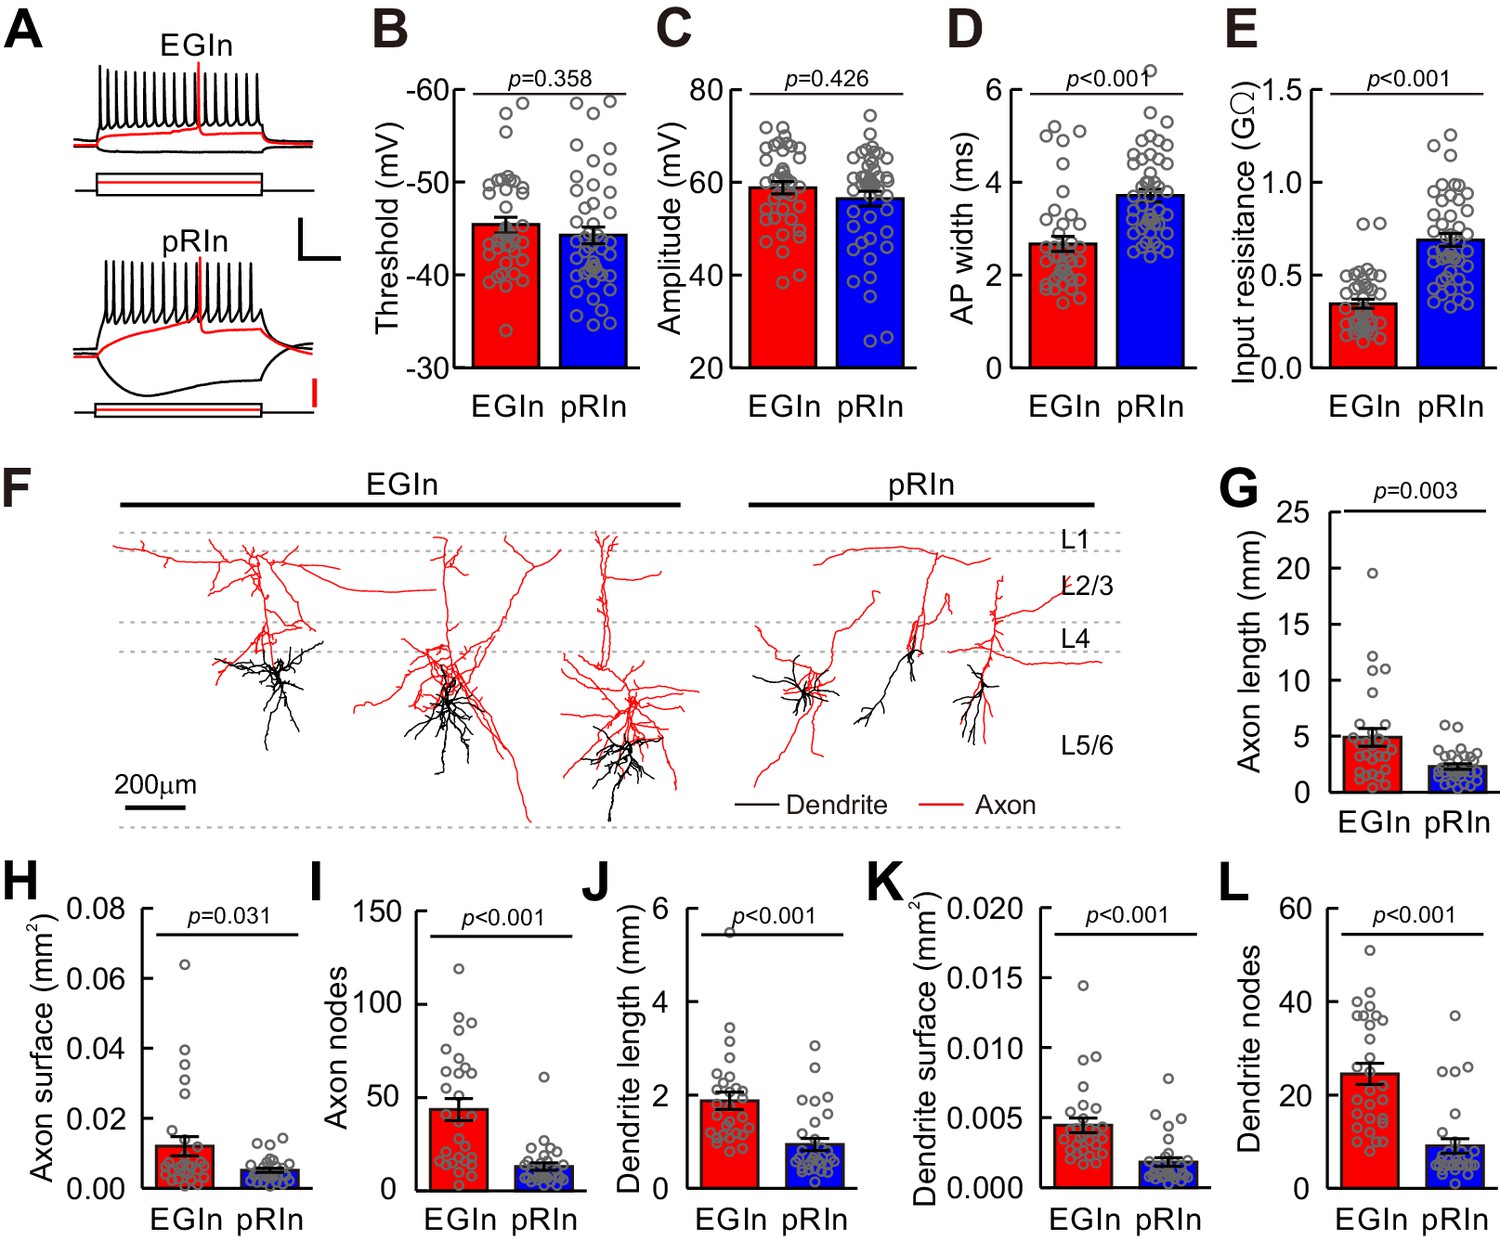
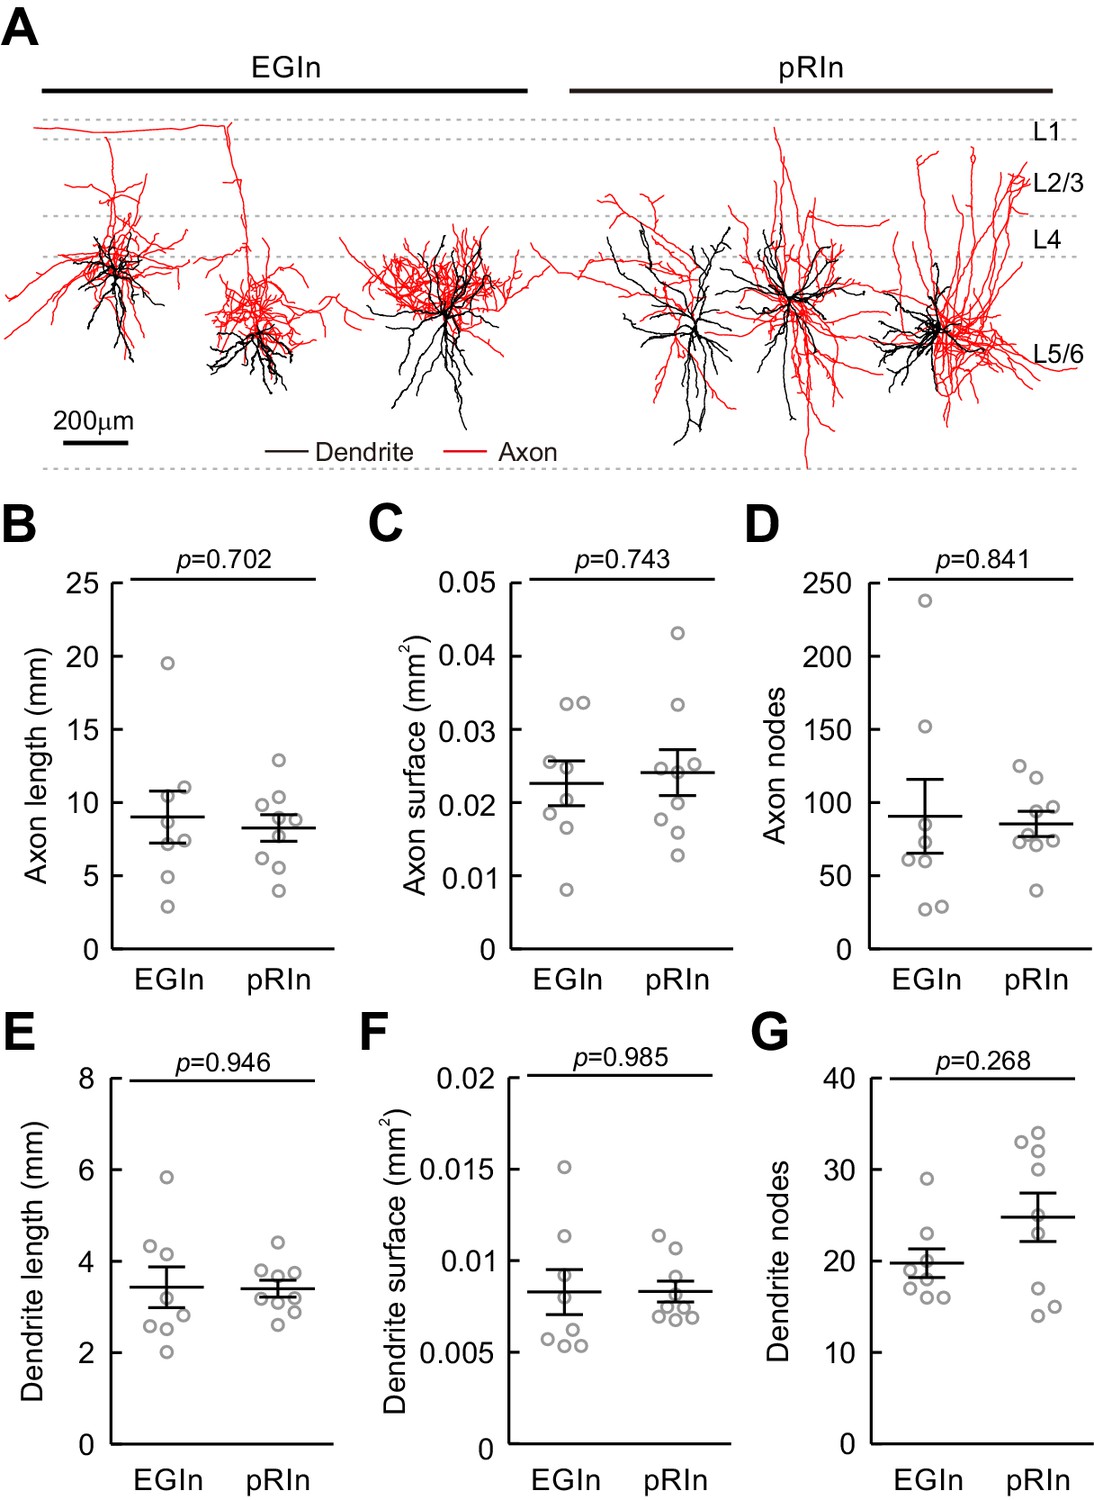
Electrophysiological and morphological properties of EGIns and pRIns at P5–7.
(A) Representative traces showing voltage responses of EGIns (top) and pRIns (bottom) to step current injections. Red traces indicate the first evoked action potential. Scale bars: 40 mV (vertical, black), 200 pA (vertical, red), and 200 ms (horizontal, black). (B–E) Comparison of AP threshold (B), AP amplitude (C), AP width (D) and input resistance (E) between EGIns and pRIns. (F) Neurolucida reconstructions of EGIns (left 3 cells) and pRIns (right 3 cells) in layer 5/6 of the somatosensory cortex. Scale bar, 200 μm. (G–L) Comparison of axon length (G), axon surface (H), axon nodes (I), dendrite length (J), dendrite surface (K) and dendrite nodes (L) between EGIns and pRIns. Detailed statistical analysis, detailed data, and number of experiments are presented in the Figure 2—source data 1.
-
Figure 2—source data 1
Detailed statistical analysis, detailed data, exact sample numbers, and p values in Figure 2 and Figure 2—figure supplement 1–4.
- https://doi.org/10.7554/eLife.44649.012
Figure 2—figure supplement 1
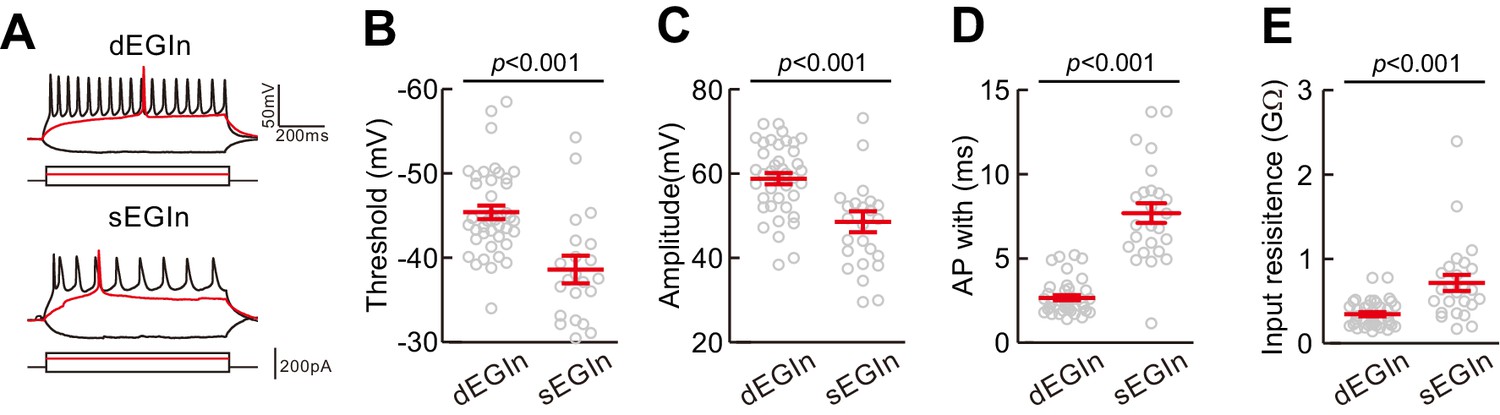
Electrophysiological properties of sEGIns (layer 2/3) and dEGIns (layer 5/6) at P5–7.
(A) Representative traces showing voltage responses of dEGIns (top) and sEGIns (bottom) to step current injections. Red traces indicate the first evoked action potential. (B–E) Comparison of AP threshold (B), AP amplitude (C), AP width (D) and input resistance (E) between dEGIns and sEGIns. Detailed statistical analysis, detailed data and exact sample numbers are presented in the Figure 2—source data 1. Error bars indicate mean ± SEM.
Figure 2—figure supplement 2
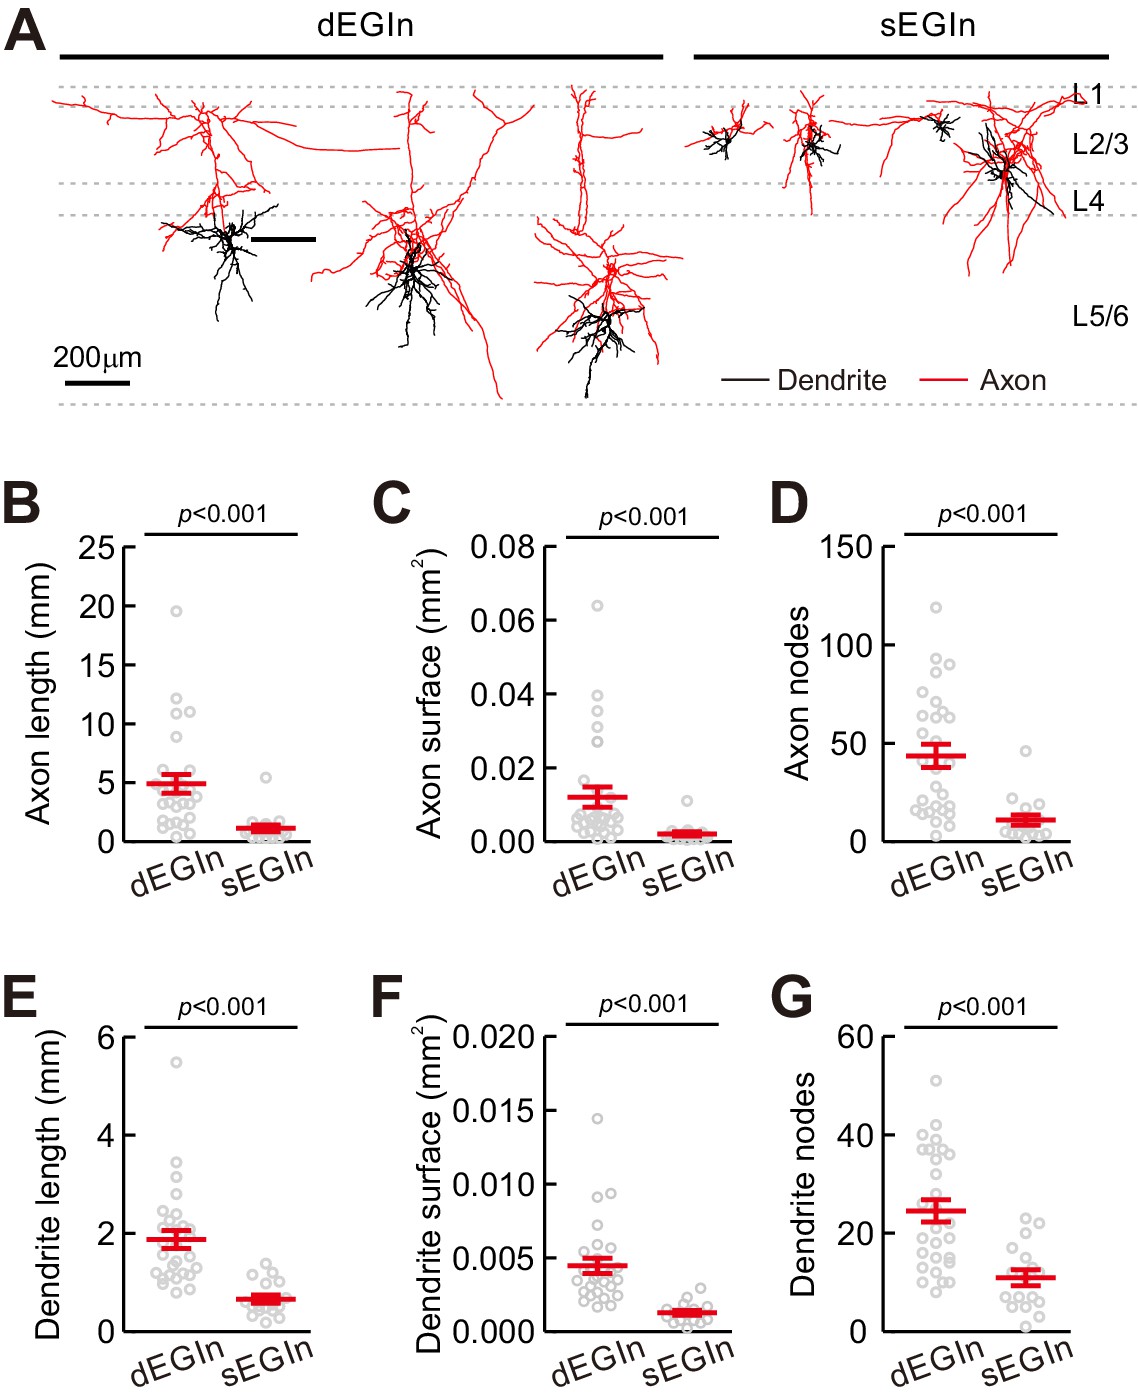
Morphological properties of dEGIns and sEGIns at P5–7.
(A) Morphological samples of dEGIns (left 3 cells) and sEGIns (right 4 cells) in the somatosensory cortex. Scale bar, 200 μm. (B–G) Comparison of axon length (B), axon surface (C), axon nodes (D), dendrite length (E), dendrite surface (F) and dendrite nodes (G) between dEGIns and sEGIns. Detailed statistical analysis, detailed data and exact sample numbers are presented in the Figure 2—source data 1. Error bars indicate mean ± SEM.
Figure 2—figure supplement 3
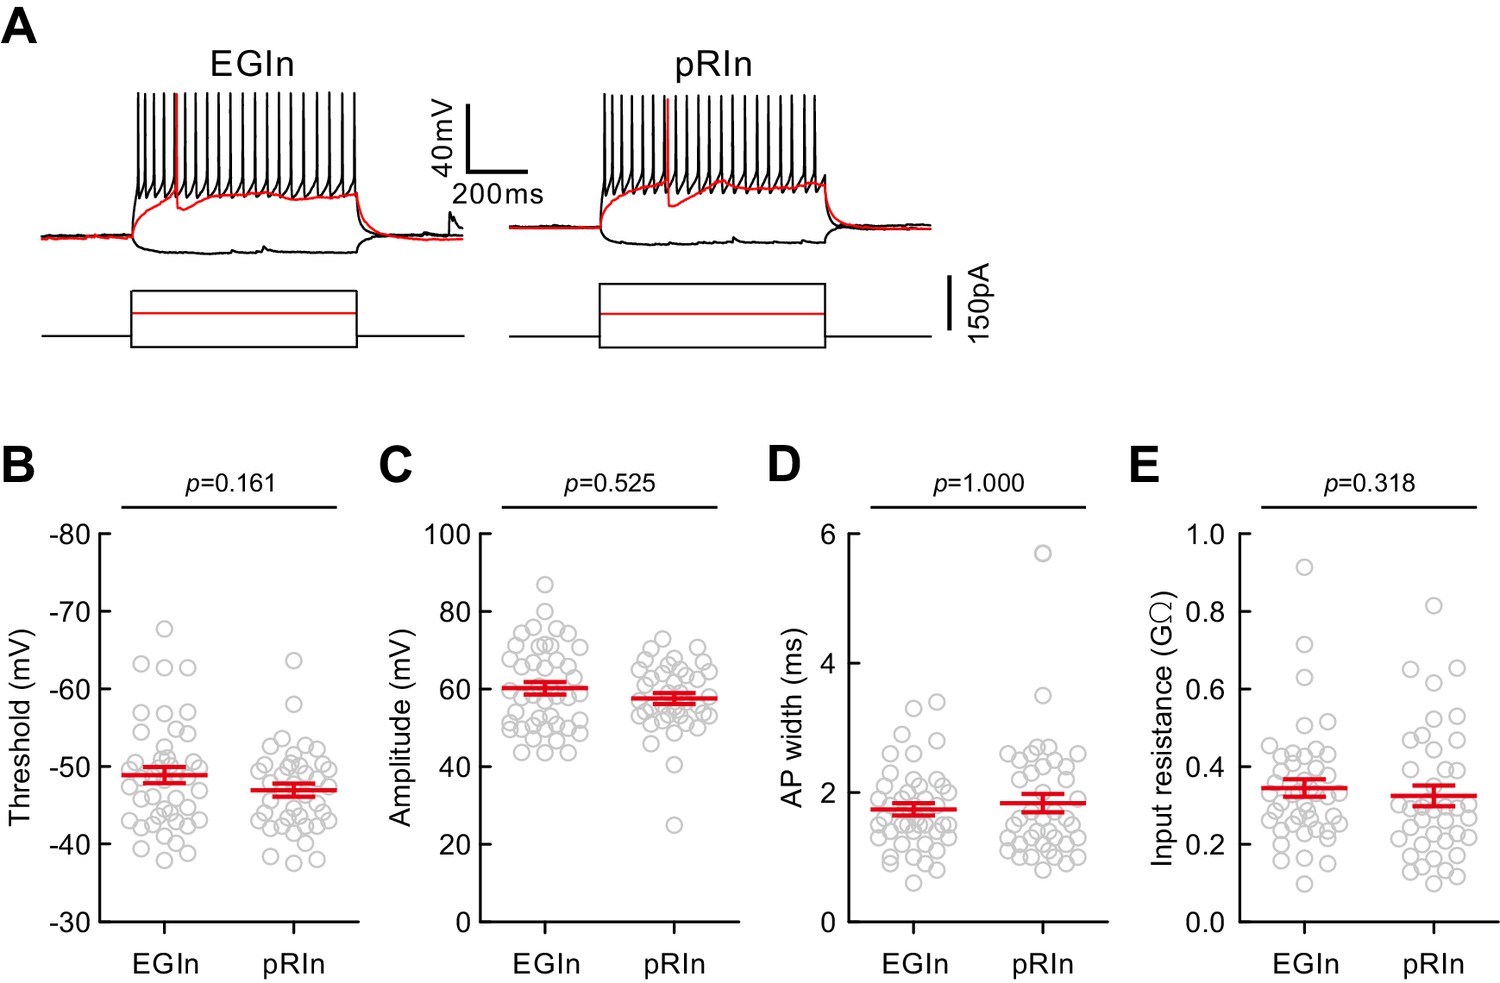
Electrophysiological properties of EGIns and pRIns at P15–20.
(A) Representative traces showing voltage responses of EGIns (top) and pRIns (bottom) to step current injections. Red traces indicate the first evoked action potential. (B–E) Comparison of AP threshold (B), AP amplitude (C), AP width (D) and input resistance (E) between EGIns and pRIns. Detailed statistical analysis, detailed data and exact sample numbers are presented in the Figure 2—source data 1. Error bars indicate mean ± SEM.
Figure 2—figure supplement 4
Morphological properties of EGIns and pRIns at P15–20.
(A) Morphological samples of EGIns (left 3 cells) and pRIns (right 3 cells) from layer 5/6 of the somatosensory cortex. Scale bar, 200 μm. (B–G) Comparison of axon length (B), axon surface (C), axon nodes (D), dendrite length (E), dendrite surface (F) and dendrite nodes (G) between EGIns and pRIns. Detailed statistical analysis, detailed data and exact sample numbers are presented in the Figure 2—source data 1. Error bars indicate mean ± SEM.
Figure 3 with 1 supplement

EGIns display more miniature postsynaptic currents than pRIns at early postnatal stages.
(A) Schematic time schedule of electrophysiological recordings. (B) Schematic diagram of whole-cell recording of an EYFP+ neuron in layer 5. (C) Representative fluorescent (EYFP, EGIn; Alexa 568, recorded neurons), IR-DIC and merged images of whole- cell recording from an EYFP+ neuron in layer 5. Scale bar, 20 μm. (D) Representative traces of inward mEPSCs (green traces) and outward mIPSCs (black traces) recorded from EGIn and pRIn. Scale bars: 20 pA (vertical), 2 s (horizontal). (E and F) Histograms of mEPSC frequencies (E) and peak amplitudes (F) for EGIns and pRIns. (G and H) Histograms of mIPSC frequencies (G) and peak amplitudes (H) for EGIns and pRIns. Detailed statistical analysis, detailed data and number of experiments are presented in the Figure 3—source data 1.
-
Figure 3—source data 1
Detailed statistical analysis, detailed data, exact sample numbers, and p values in Figure 3 and Figure 3—figure supplement 1.
- https://doi.org/10.7554/eLife.44649.015
Figure 3—figure supplement 1
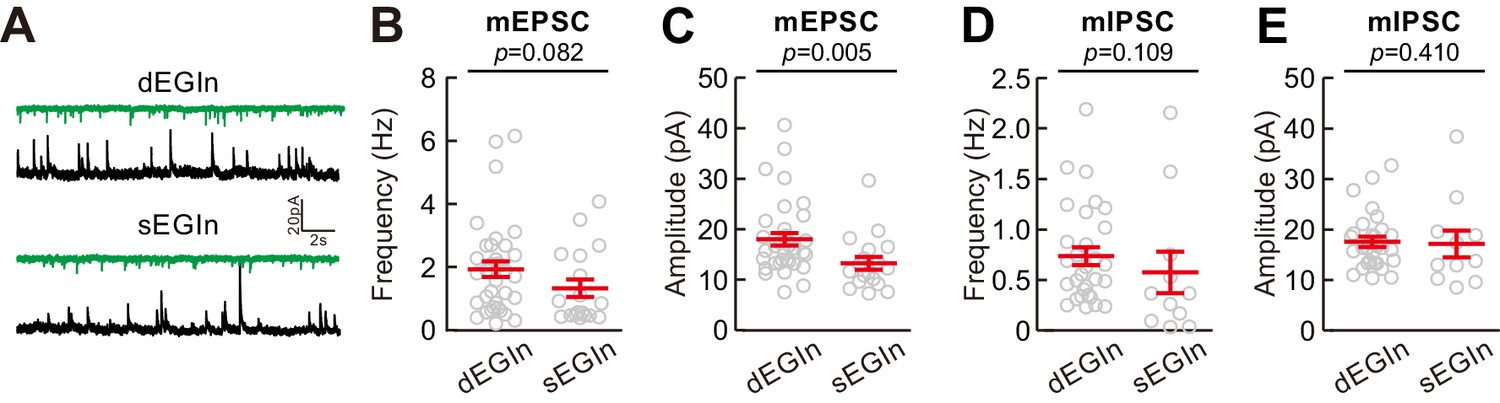
Comparison of mEPSCs and mIPSCs between dEGIns and sEGIns at P5–7.
(A) Representative traces of inward mEPSCs (green traces) and outward mIPSCs (black traces) recorded in dEGIns and sEGIns of the somatosensory cortex. Scale bars: 20 pA (vertical), 2 s (horizontal). (B–E) Histograms of the frequencies (B) and amplitudes (C) of mEPSCs, and the frequencies (D) and amplitudes (E) of mIPSCs in dEGIns and sEGIns of the somatosensory cortex. Detailed statistical analysis, detailed data, and exact sample numbers are presented in the Figure 3—source data 1. Error bars indicate mean ± SEM.
Figure 4
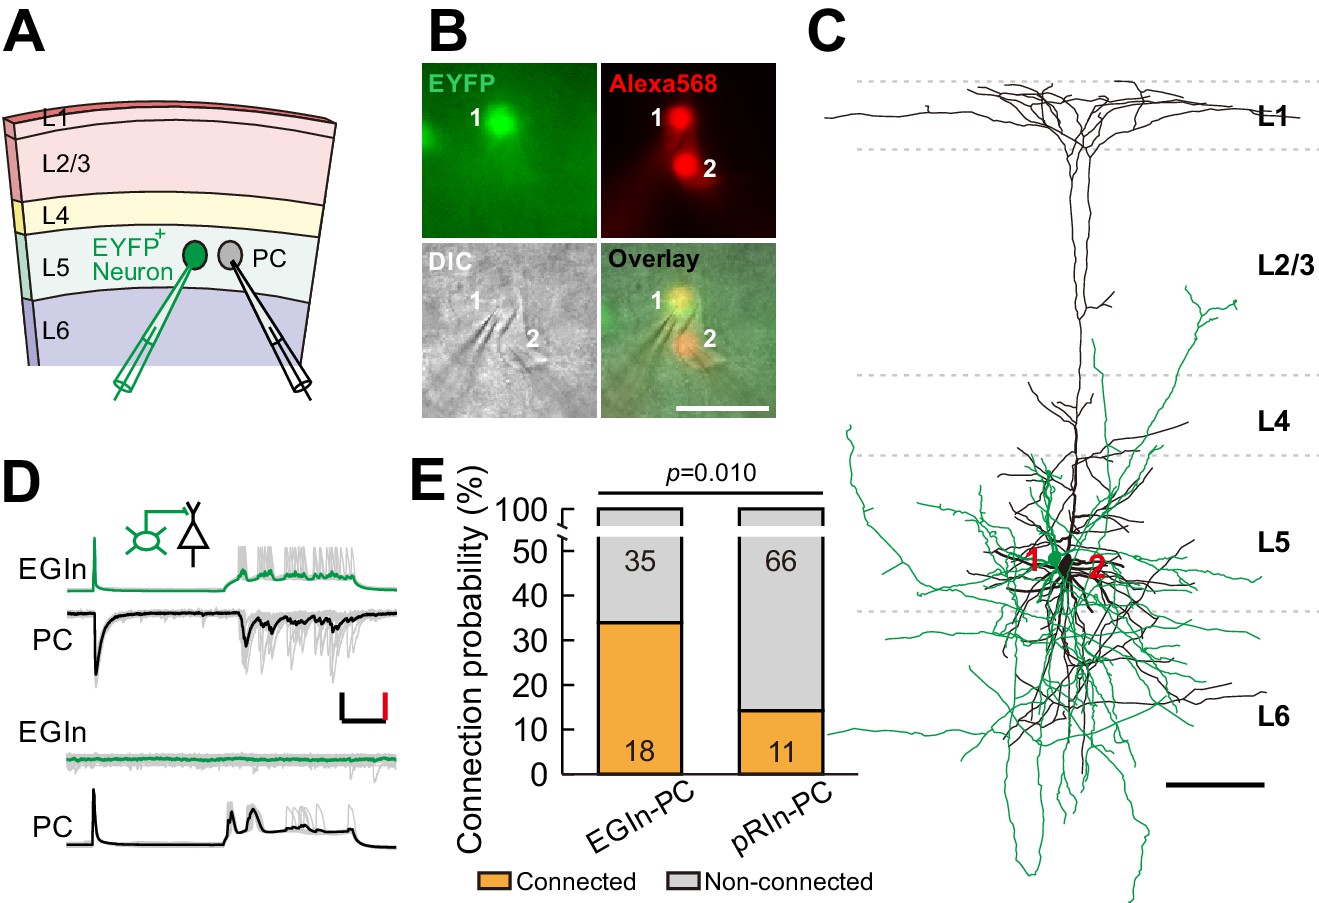
EGIns exhibit higher synaptic connectivity than pRIns at P5–7.
(A) Schematic diagram represents dual patch-clamp recording of an EYFP+ neuron and a neighboring PC in layer 5. (B) Representative fluorescent (EYFP, EGIn; Alexa 568, recorded neurons), IR-DIC and merged images of dual patch-clamp recording from an EYFP+ neuron and a neighboring PC. Cell one is an EYFP+ EGIn and cell two is a neighboring PC. Scale bar, 50 μm. (C) Reconstructed morphology of the two neurons patched in (B). Reconstructed EGIn is shown in green and PC is shown in black. Scale bar, 100 μm. (D) Representative traces showing an EGIn exert unidirectional chemical synapse onto a neighboring PC. The green (EGIn) and black (PC) lines indicate the average traces. Inset indicates unidirectional synaptic input from an EGIn to a PC. Scale bars: 50 pA (vertical, black), 50 mV (vertical, red), and 100 ms (horizontal, black). (E) Proportion of synaptic connections between EGIns and pyramidal cells and between pRIns and pyramidal cells.
Figure 5 with 1 supplement
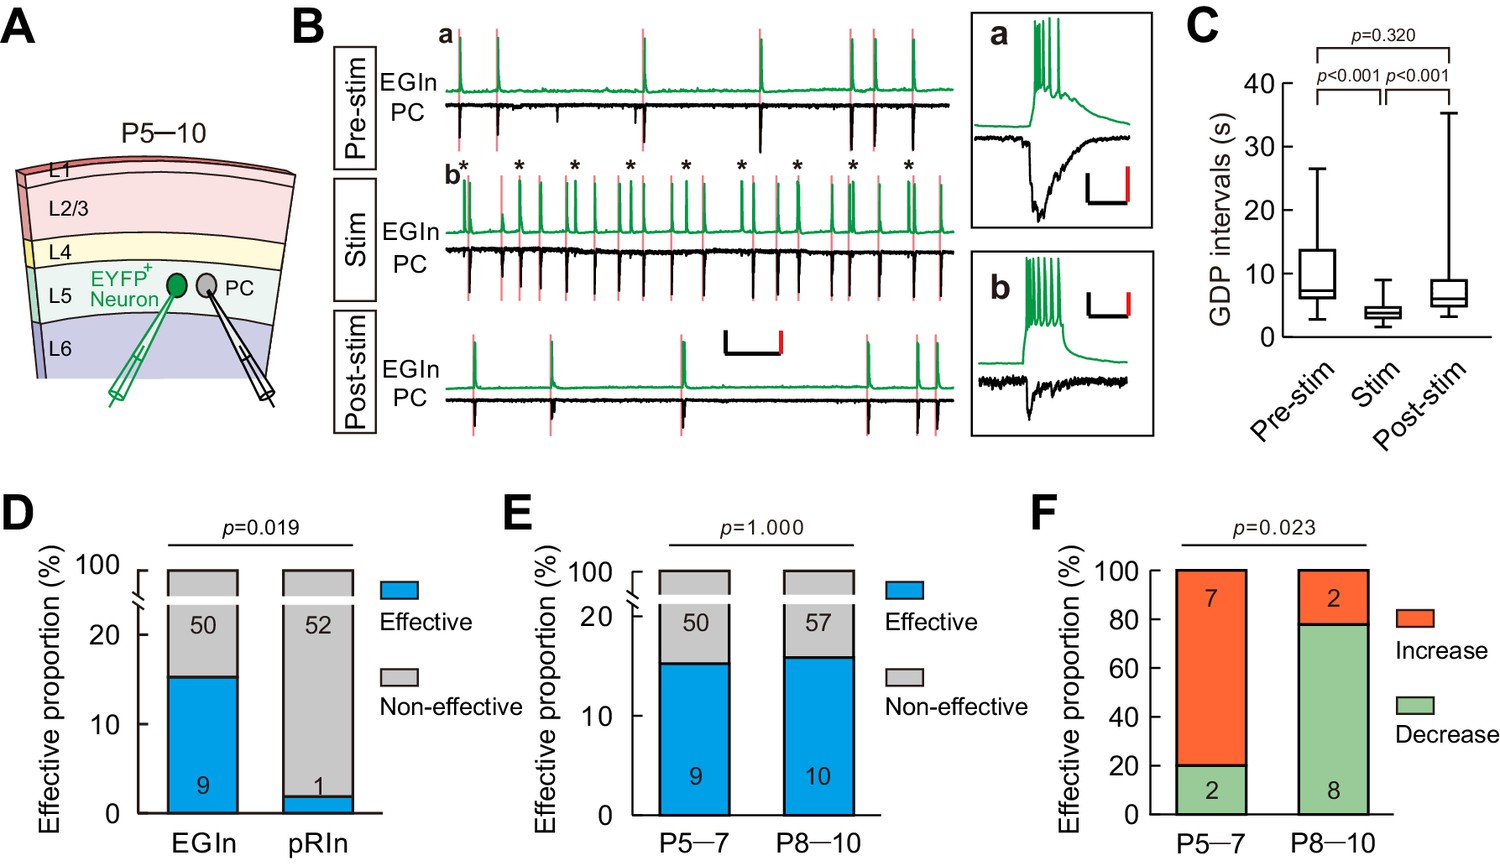
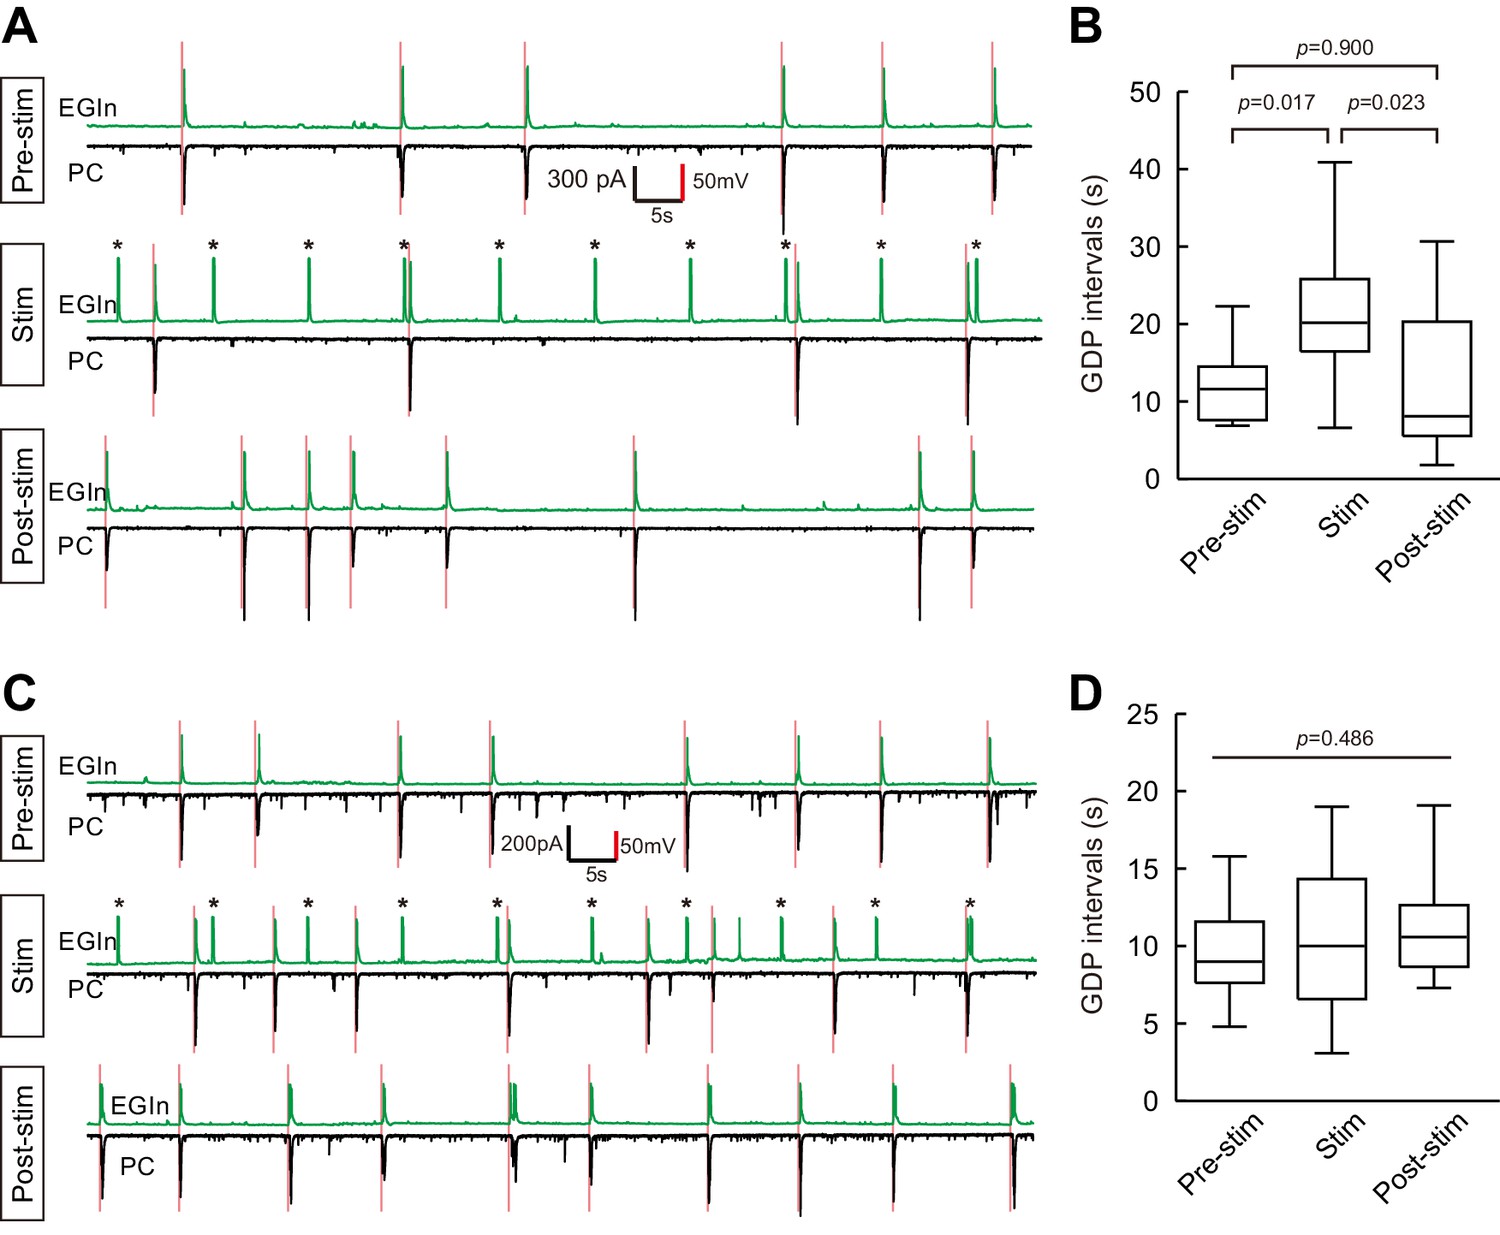
A subpopulation of EGIns can single-handedly influence network dynamics.
(A) Schematic diagram showing a dual patch-clamp recording to test whether stimulating an EYFP+ neuron can influence network dynamics. (B) Representative traces indicate that stimulating an EYFP+ EGIn significantly increased the frequency of GDPs. Spontaneous activities were recorded from an EGIn and a pyramidal cell (PC) during different stimulus conditions. Scale bars: 200 pA (vertical, black), 40 mV (vertical, red), and 10 s (horizontal, black). Inset (a) showing a representative enlarged GDP recorded in EGIn and PC during pre-stimulus condition. Scale bars: 100 pA (vertical, black), 30 mV (vertical, red), and 200 ms (horizontal, black). Inset (b) showing synaptic transmission from EGIn to PC. Scale bars: 40 pA (vertical, black), 20 mV (vertical, red), and 200 ms (horizontal, black). Pink lines indicate the onsets of GDPs and asterisks indicate the 0.1 Hz, 200 ms current stimulation to EGIn. (C) Quantification of GDP intervals recorded in (B). (D) Proportion of EGIns that alter GDP frequency was significantly higher than that of pRIns at P5–7. Two-tailed Fisher’s exact test, p=0.019. (E) Proportion of EGIns that alter GDP frequency exhibited no significant difference between P5–7 and P8–10. Two-tailed Fisher’s exact test, p=1.000. (F) Proportion of EGIns that increased or decreased GDP frequency were compared between P5–7 and P8–10. Two-tailed Fisher’s exact test, p=0.023. Detailed statistical analysis, detailed data, and exact sample numbers are presented in the Figure 5—source data 1. Error bars indicate mean ± SEM.
-
Figure 5—source data 1
Detailed statistical analysis, detailed data, exact sample numbers, and p values in Figure 5 and Figure 5—figure supplement 1.
- https://doi.org/10.7554/eLife.44649.019
Figure 5—figure supplement 1
Samples of decreasing and unaltered GDP frequency upon EGIn stimulation.
(A) Representative traces where stimulation of an EYFP+ EGIn significantly decreased GDP frequency. (B) Quantification of GDP intervals recorded in (A). (C) Representative traces where stimulation of an EYFP+ EGIn did not change GDP frequency. (D) Quantification of GDP intervals recorded in (C). Detailed statistical analysis, detailed data and exact sample numbers are presented in the Figure 5—source data 1.
Figure 6 with 3 supplements
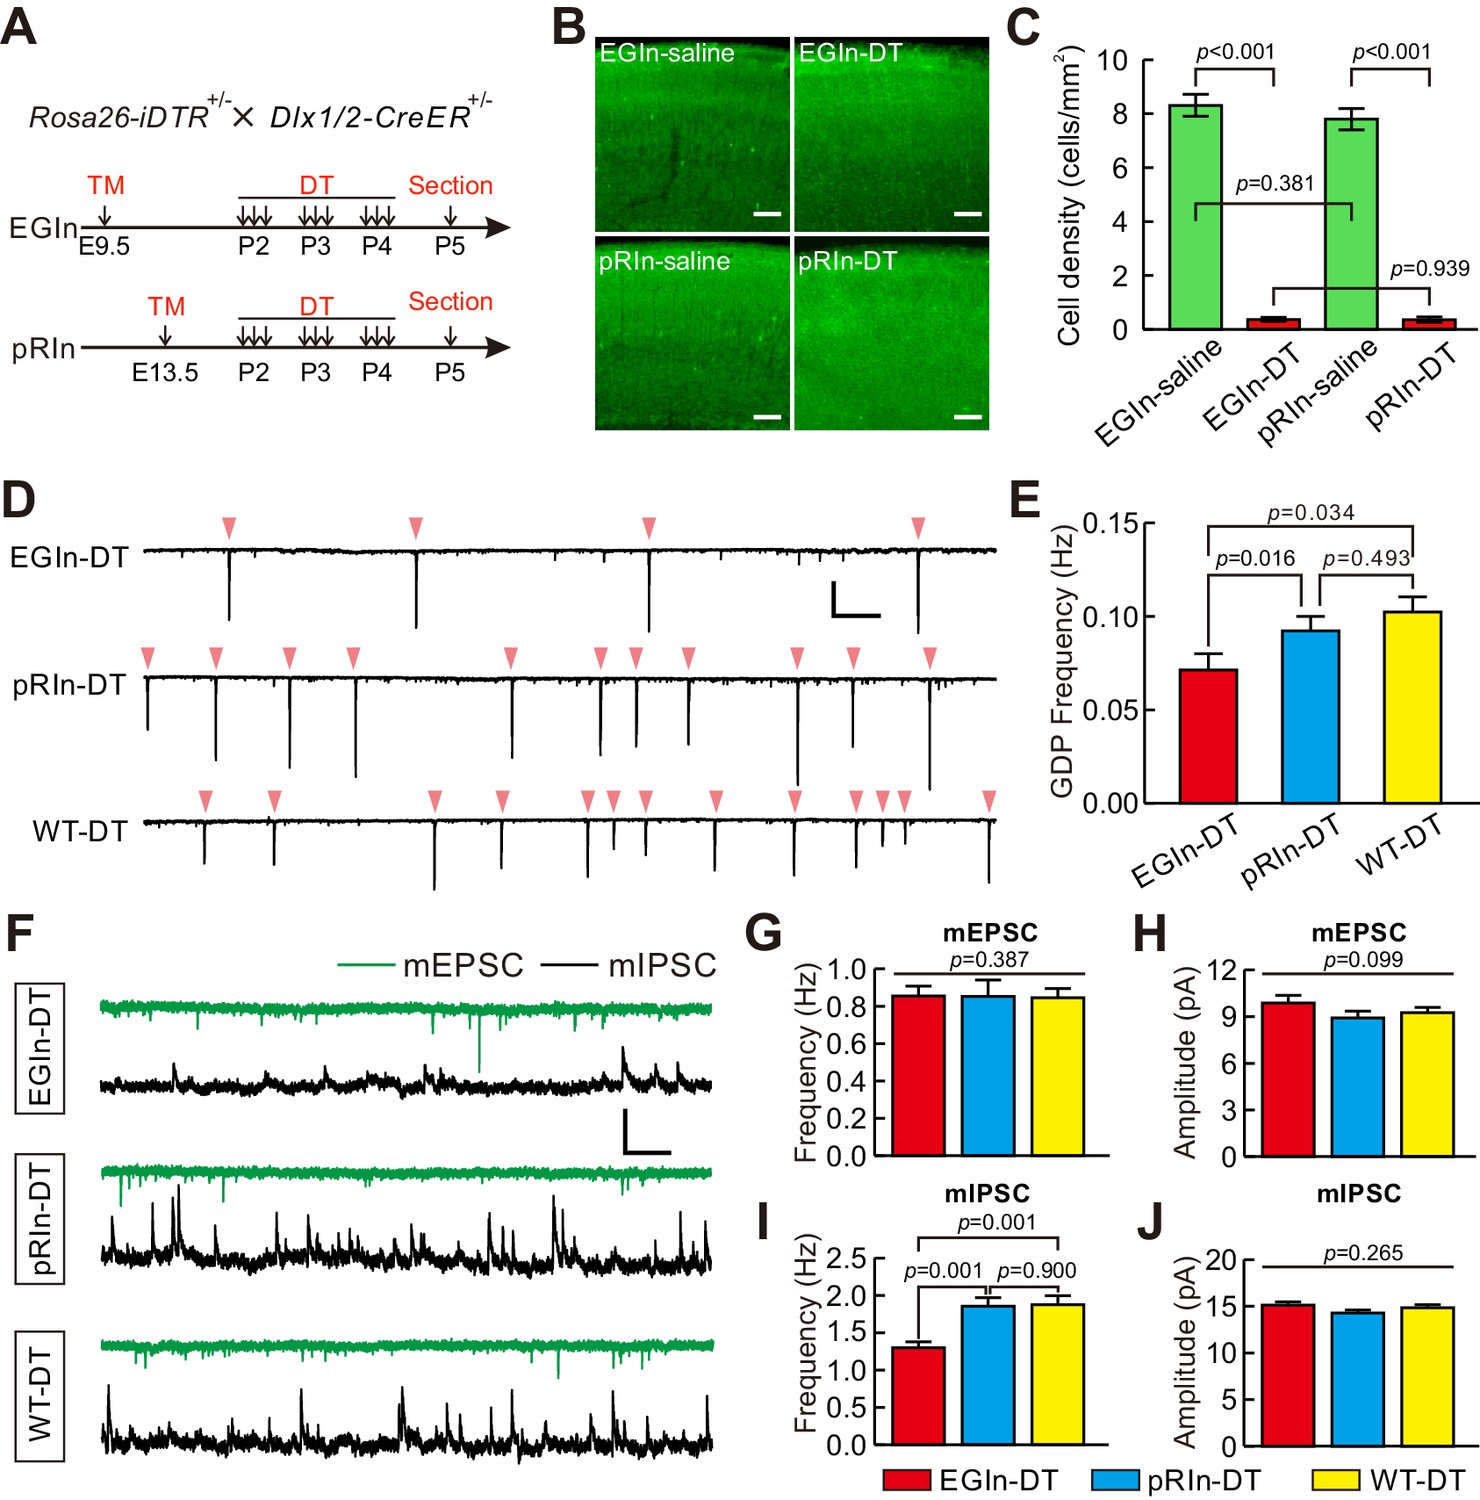
Ablation of EGIns reduced neocortical spontaneous network synchronization and the frequency of mIPSCs at early postnatal stages.
(A) Schematic diagram representing ablation of EGIns and pRIns after P2. (B) Sample images showing DT administration can significantly reduce cell density of EGIns and pRIns at P5. Scale bar, 100 μm. (C) Quantitative analysis of DT ablation efficiency. (D) Sample traces showing GDPs recorded from EGIn DT-injected mice (top), pRIn DT-injected mice (middle) and wild-type DT-injected mice (bottom). Pink arrowheads indicate onsets of synchronized activities. Scale bars: 200 pA (vertical), 10 s (horizontal). (E) Quantitation of GDP frequencies in EGIn DT-injected mice, pRIn DT-injected mice and wild-type DT-injected mice. (F) Representative traces of inward mEPSCs (green traces) and outward mIPSCs (black traces) recorded in layer five pyramidal neurons in EGIn DT-injected mice, pRIn DT-injected mice and wild-type DT-injected mice. Scale bars: 20 pA (vertical), 1 s (horizontal). (G–J) Histograms of the frequencies (G) and amplitudes (H) of mEPSCs, and the frequencies (I) and amplitudes (J) of mIPSCs in EGIn DT-injected mice, pRIn DT-injected mice and wild-type DT-injected mice. Detailed statistical analysis, detailed data, and exact sample numbers are presented in the Figure 6—source data 1. Error bars indicate mean ± SEM.
-
Figure 6—source data 1
Detailed statistical analysis, detailed data, exact sample numbers, and p values in Figure 6 and Figure 6—figure supplement 1–3.
- https://doi.org/10.7554/eLife.44649.024
Figure 6—figure supplement 1
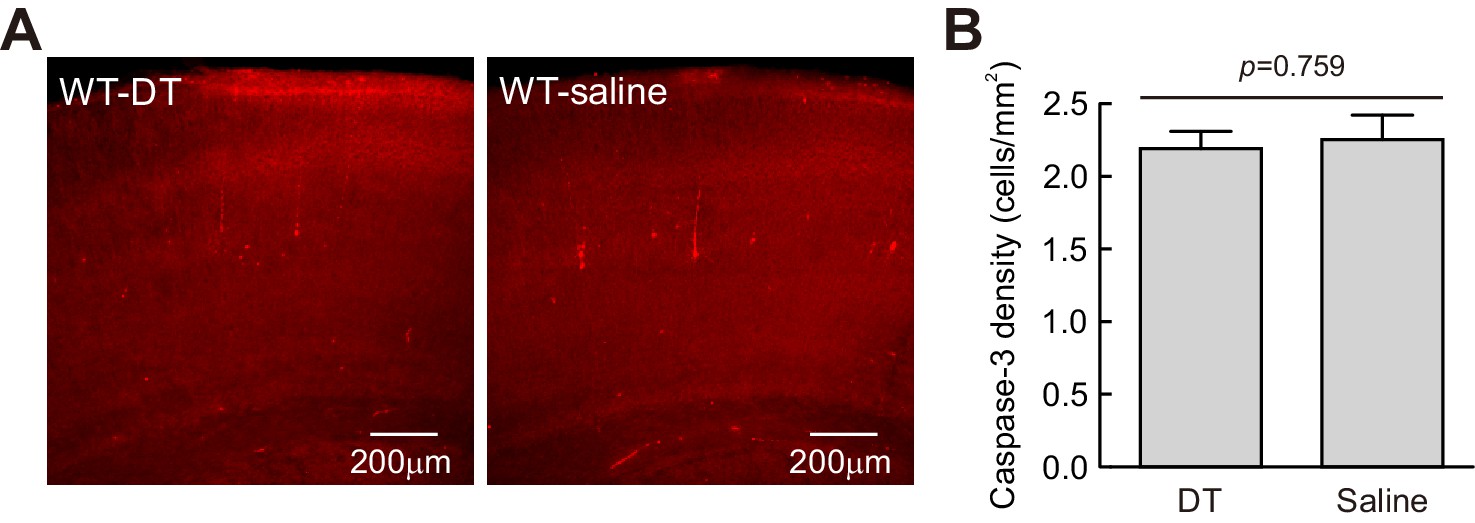
The effect of DT is specific for Cre-expressing cells.
(A) Confocal microphotograph showing the cells that expressed caspase-3 in the somatosensory cortex in DT-injected CD1 mice (WT-DT, left) and saline-injected CD1 mice (WT-saline, right) at P5. (B) Comparison of the density of caspase-3 positive cells between WT-DT and WT-saline mice. Detailed statistical analysis, detailed data and exact sample numbers are presented in theFigure 6—source data 1.
Figure 6—figure supplement 2
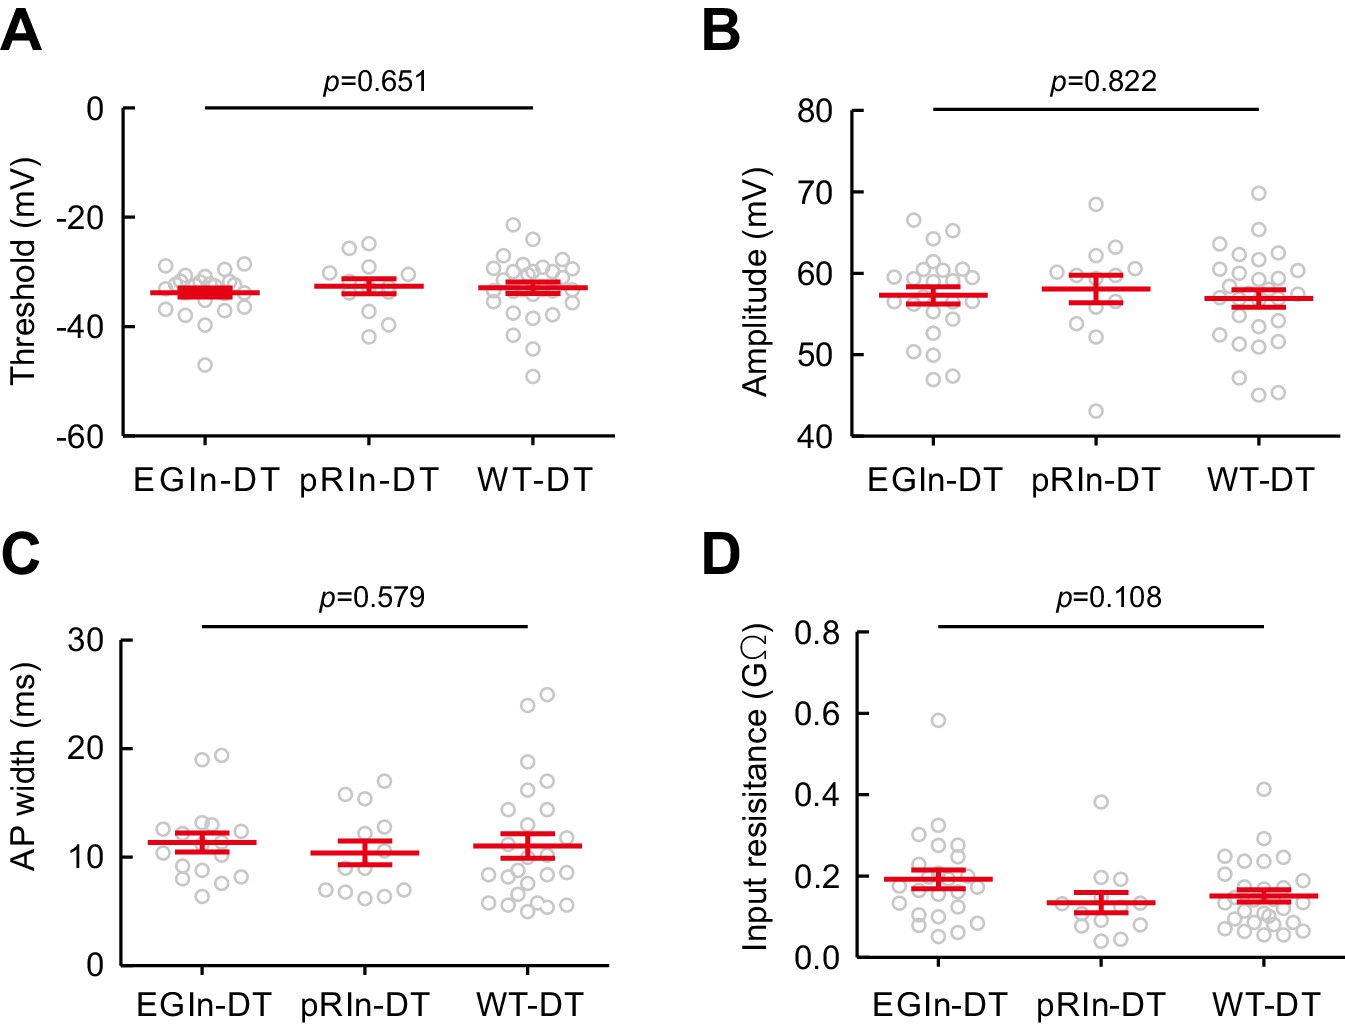
Ablation of EGIns did not change the intrinsic electrophysiological properties of layer five pyramidal cells at P5–7.
Histograms of AP threshold (A), AP amplitude (B), AP width (C) and input resistance (D) in EGIn DT-injected mice, pRIn DT-injected mice and wild-type DT-injected mice. Detailed statistical analysis, detailed data and exact sample numbers are presented in the Figure 6—source data 1. Error bars indicate mean ± SEM.
Figure 6—figure supplement 3
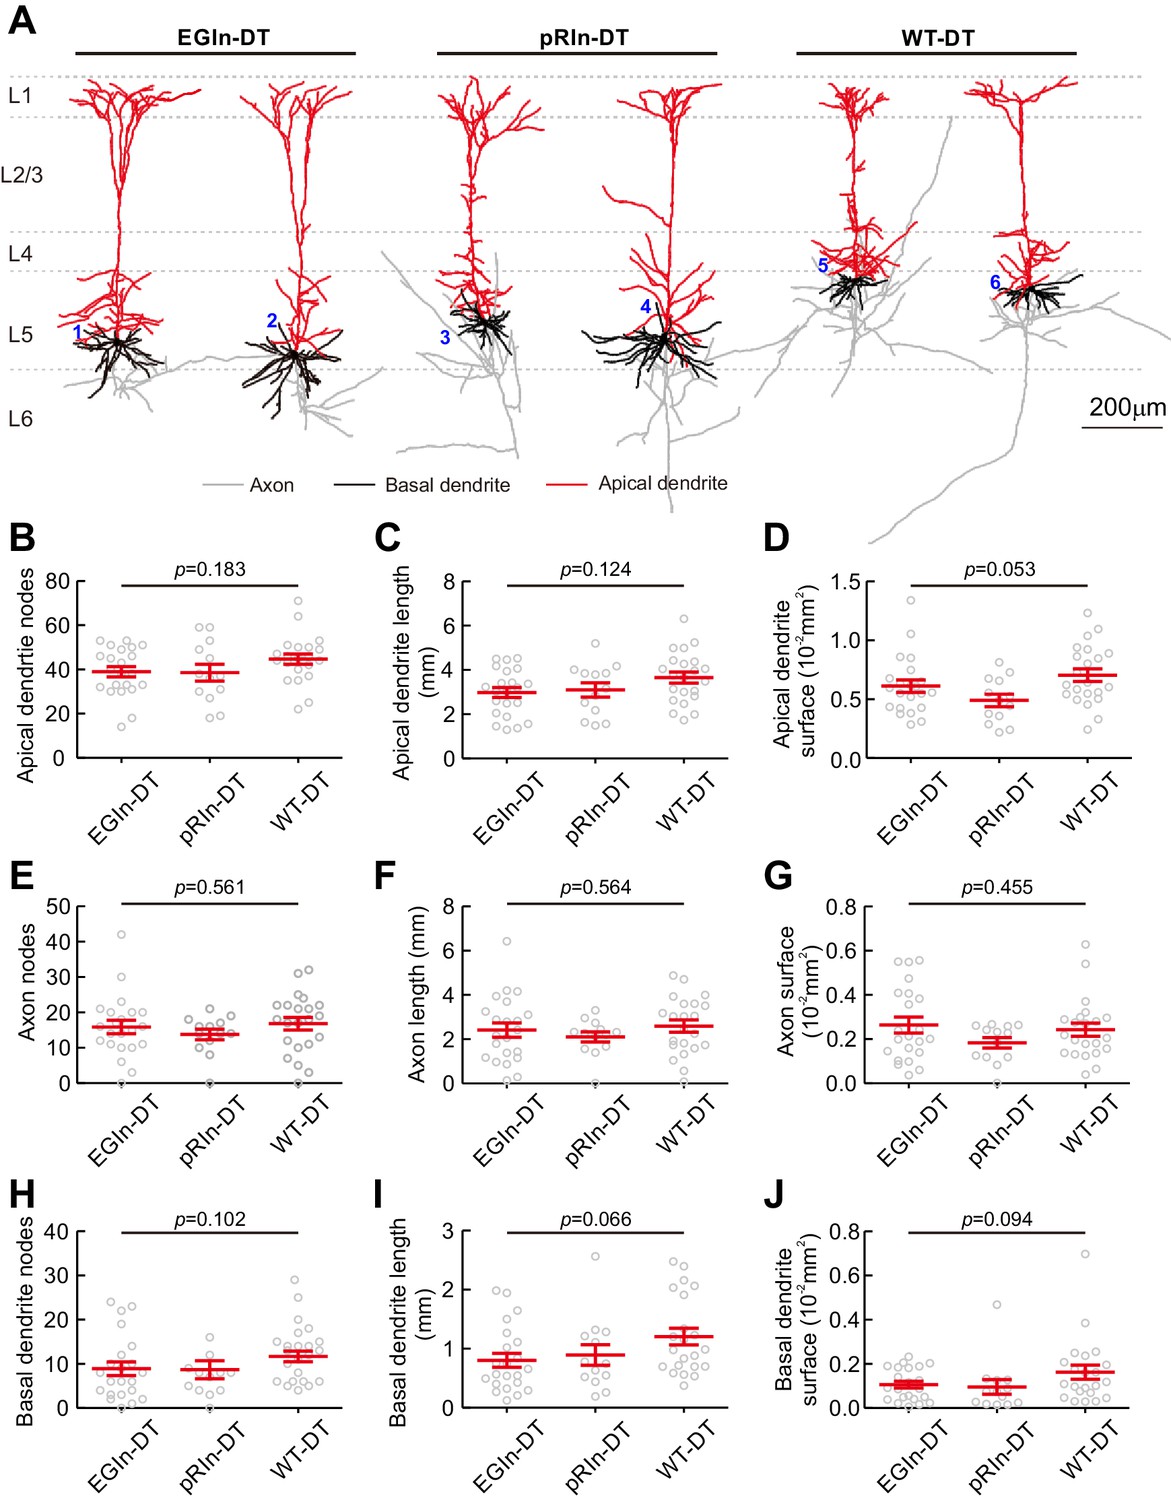
Ablation of EGIns did not change morphological properties of layer five pyramidal cells at P5–7.
(A) Morphological samples of pyramidal cells in EGIn DT-injected mice (cell 1 and 2), pRIn DT-injected mice (cell 3 and 4) and wild-type DT-injected mice (cell 5 and 6). Scale bar, 200 μm. (B–J) Histograms of apical dendrite nodes (B), apical dendrite length (C), apical dendrite surface (D), axon nodes (E), axon length (F), axon surface (G), basal dendrite nodes (H), basal dendrite length (I) and basal dendrite surface (J). Detailed statistical analysis, detailed data and exact sample numbers are presented in the Figure 6—source data 1. Error bars indicate mean ± SEM.
Figure 7
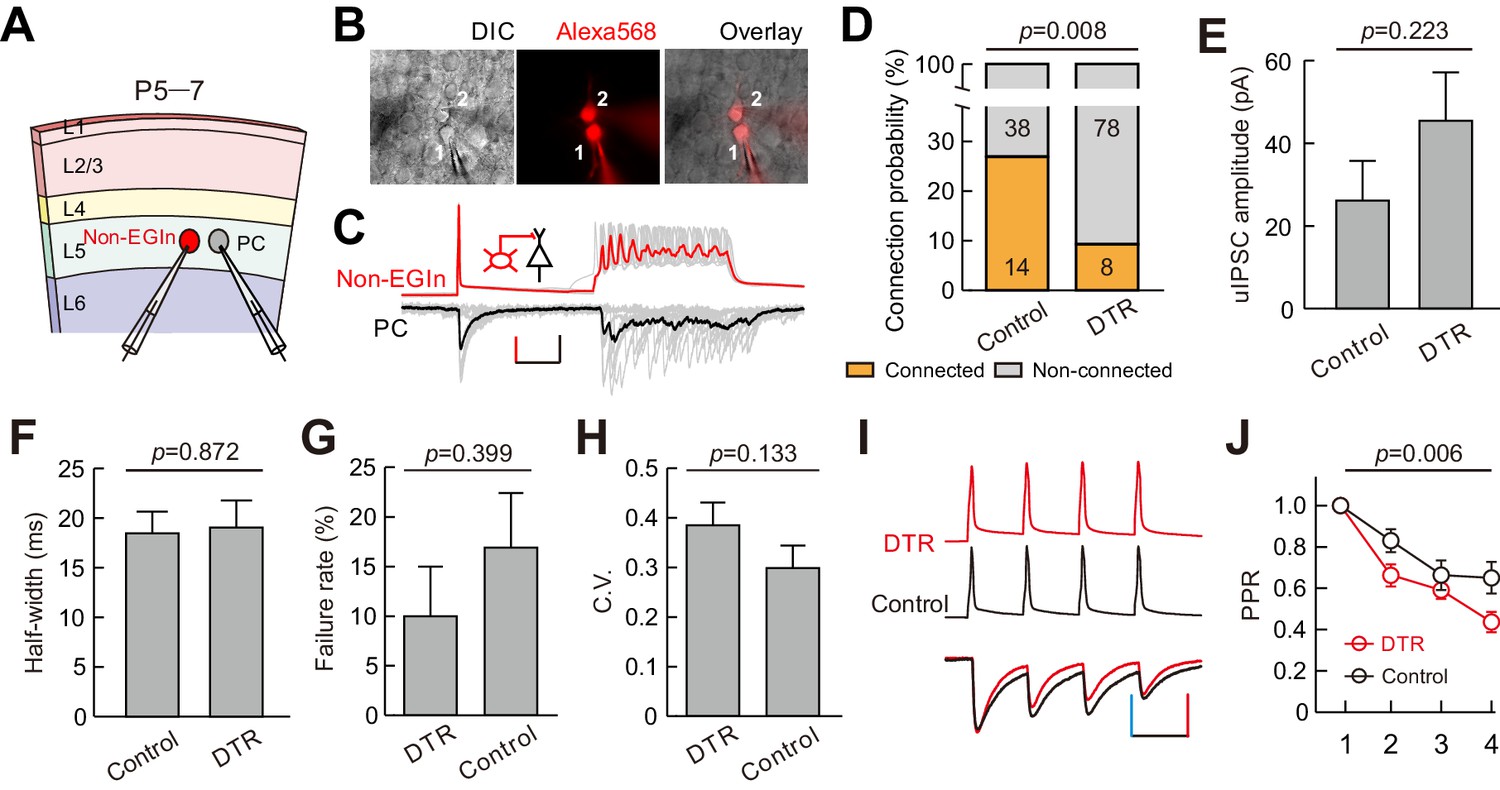
EGIns ablation altered synaptic formation and presynaptic transmitter release from non-EGIns to PCs at early postnatal stage.
(A) Schematic diagram represents dual patch-clamp recording of an EYFP- non-EGIn and a neighboring PC in layer 5. (B) Representative fluorescent (Alexa 568, recorded neurons), IR-DIC and merged images of dual patch-clamp recording from a non-EGIn and a neighboring PC. Cell one is a non-EGIn and cell two is a neighboring PC. (C) Representative traces showing a non-EGIn exert unidirectional chemical synapse onto a neighboring PC. The red (non-EGIn) and black (PC) lines indicate the average traces. Inset indicates unidirectional synaptic input from a non-EGIn to a PC. Scale bars: 30 pA (vertical, black), 30 mV (vertical, red), and 100 ms (horizontal, black). (D) Proportion of non-EGIns→PCs synaptic connections between EGIn-EYFP mice (control) and EGIn-ablated mice (DTR). (E–F) Quantification of the peak amplitude (E) and half-width (F) of non-EGIns→PCs uIPSCs between EGIn-EYFP mice (control) and EGIn-ablated mice (DTR). (G–H) Quantification of failure rate (G) and the coefficient of variation (C.V.) (H) of non-EGIns→PCs synaptic transmission. (I) Amplitude-scaled overlay of paired-pulse ratio (PPR) responses in non-EGIns→PCs connections between EGIn-EYFP mice (control) and EGIn-ablated mice (DTR). Red, DTR; black, control. Scale bars: 60 pA (vertical blue), 60 mV (vertical, red), and 50 ms (horizontal). Four presynaptic action potentials were evoked at 20 Hz. (J) The normalized peak amplitude of non-EGIns→PCs uIPSCs showed short-term depression, and significant difference in PPR was found between EGIn-EYFP mice (control) and EGIn-ablated mice (DTR). Detailed statistical analysis, detailed data, and exact sample numbers are presented in the Figure 7—source data 1. Error bars indicate mean ± SEM. Figure Supplement and Source data.
-
Figure 7—source data 1
Detailed statistical analysis, detailed data, exact sample numbers, and p values in Figure 7.
- https://doi.org/10.7554/eLife.44649.026
Tables
Key resources table
| Reagent type (species) or resource | Designation | Source or reference | Identifiers | Additional information |
|---|---|---|---|---|
| Strain, strain background (Mus musculus) | Dlx1/2-creER | PMID: 21867885 | RRID: IMSR_JAX:014600 | |
| Strain, strain background (Mus musculus) | Rosa26-EYFP | PMID: 11299042 | RRID: IMSR_JAX:006148 | |
| Strain, strain background (Mus musculus) | Rosa26-iDTR | PMID: 22016545 | RRID: IMSR_JAX:007900 | |
| Antibody | anti-GFP, chicken polyclonal | AVES, USA | RRID: AB_10000240 | 1:1000 |
| Antibody | anti-Calretinin, goat polyclonal | Millipore, USA | RRID: AB_90764 | 1:1000 |
| Antibody | anti-GABA, rabbit polyclonal | Sigma, USA | RRID: AB_477652 | 1:500 |
| Antibody | anti-HB-EGF(DTR), goat polyclonal | R and H System, USA | RRID: AB_354429 | 1:100 |
| Antibody | anti-NPY, rabbit polyclonal | Immunostar, USA | RRID: AB_2307354 | 1:400 |
| Antibody | anti-nNOS, rabbit polyclonal | Millipore, USA | RRID: AB_91824 | 1:1000 |
| Antibody | anti-NOS, rabbit monoclonal | Sigma, USA | RRID: AB_260754 | 1:1000 |
| Antibody | anti-PV, rabbit polyclonal | Abcam, USA | RRID: AB_298032 | 1:500 |
| Antibody | anti-SST, goat polyclonal | Santa-Cruz, USA | RRID: AB_2302603 | 1:100 |
| Antibody | anti-VIP, rabbit polyclonal | Immunostar, USA | RRID: AB_572270 | 1:200 |
| Antibody | anti-BrdU, rat monoclonal | Abcam, USA | RRID: AB_305426 | 1:250 |
| Antibody | anti-cleaved caspase-3 (Asp175), rabbit polyclonal | Cell signaling, USA | RRID: AB_2341188 | 1:400 |
| Antibody | anti-Ki67, mouse monoclonal | BD Pharmingen, USA | RRID: AB_396287 | 1:500 |
| Antibody | anti-OLIG2, rabbit polyclonal | Millipore, USA | RRID: AB_570666 | 1:500 |
| Antibody | Alexa Fluor 555 Donkey anti-goat, donkey polyclonal | Life Technologies, USA | RRID: AB_2535853 | 1:250 |
| Antibody | Alexa Fluor 555 Donkey anti-rabbit, donkey polyclonal | Life Technologies, USA | RRID: AB_162543 | 1:250 |
| Antibody | Alexa Fluor 555 Donkey anti-mouse, donkey polyclonal | Life Technologies, USA | RRID: AB_2536180 | 1:250 |
| Antibody | Alexa Fluor 568 Goat anti-rat, goat polyclonal | Life Technologies, USA | RRID: AB_2534121 | 1:250 |
| Antibody | Alexa Fluor 647 Goat anti-rabbit, goat polyclonal | Life Technologies, USA | RRID: AB_2535864 | 1:250 |
| Software | GraphPad Prism | GraphPad Software, USA | RRID: SCR_002798 | |
| Software | Sigma Plot | Systat Software, USA | RRID: SCR_003210 | |
| Software | SPSS | IBM, USA | RRID: SCR_002865 | |
| Software | pCLAMP | Molecular Devices, USA | RRID:SCR_011323 | |
| Software | Neurolucida | MicroBrightField, USA | RRID:SCR_001775 | |
| Software | Adobe Photoshop | Adobe system, USA | RRID:SCR_014199 |
Additional files
-
Transparent reporting form
- https://doi.org/10.7554/eLife.44649.027
Download links
A two-part list of links to download the article, or parts of the article, in various formats.
Downloads (link to download the article as PDF)
Open citations (links to open the citations from this article in various online reference manager services)
Cite this article (links to download the citations from this article in formats compatible with various reference manager tools)
Early-generated interneurons regulate neuronal circuit formation during early postnatal development
eLife 8:e44649.
https://doi.org/10.7554/eLife.44649


