CNS myelination and remyelination depend on fatty acid synthesis by oligodendrocytes
- Institute of Molecular Health Sciences, Swiss Federal Institute of Technology, ETH Zürich, Switzerland
- Medical University of Graz, Austria
- Washington University Medical School, United States
Figures
Figure 1 with 2 supplements
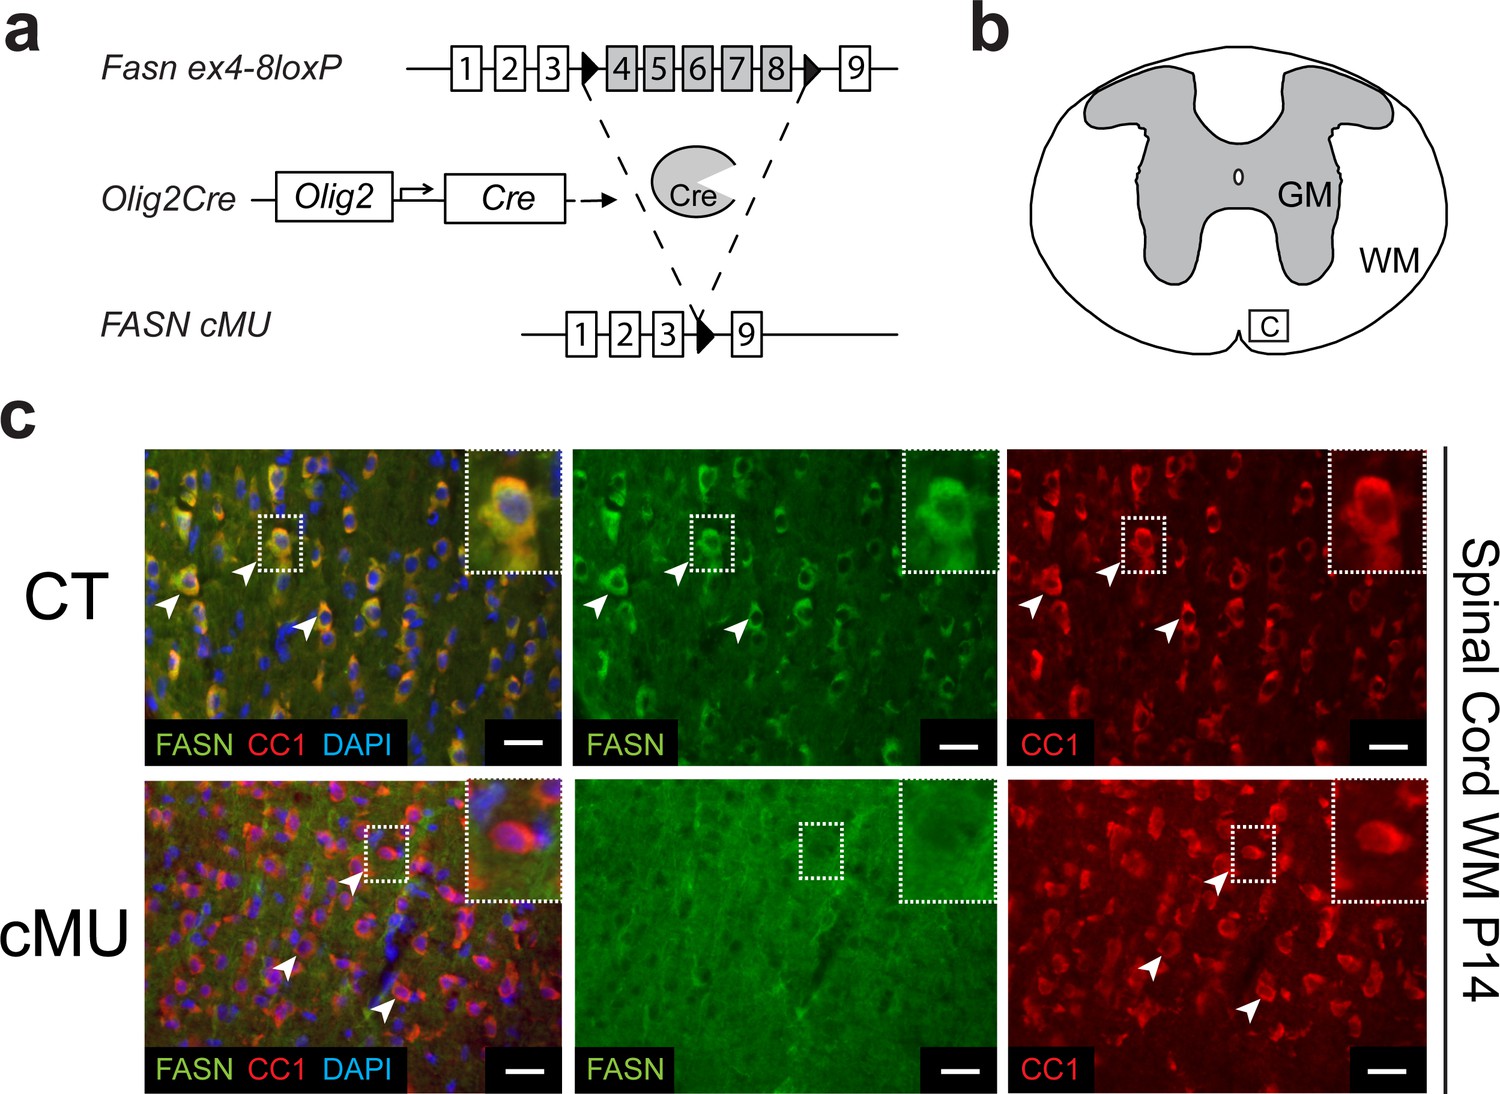
Generation of mutant mice lacking FASN in the oligodendrocyte lineage.
(a) Experimental strategy of conditional Fasn allele inactivation upon Olig2-driven Cre expression in vivo. (b) Schematic of thoracic spinal cord. Square insert ‘c’: White matter (WM) where subsequent immunostaining images were acquired. GM = gray matter (c) Representative immunostaining of cross-sectioned spinal cord from P14 CT and cMU mice, n = 3 mice examined for each, CT and cMU. Prominent cytoplasmic FASN expression in differentiated OLs (CC1+; examples indicated by arrowheads) in CT, but not in cMU. Nuclear marker: DAPI. Scale bars: 20 μm. CT = control, cMU = conditional mutant, GM = gray matter, WM = white matter.
Figure 1—figure supplement 1
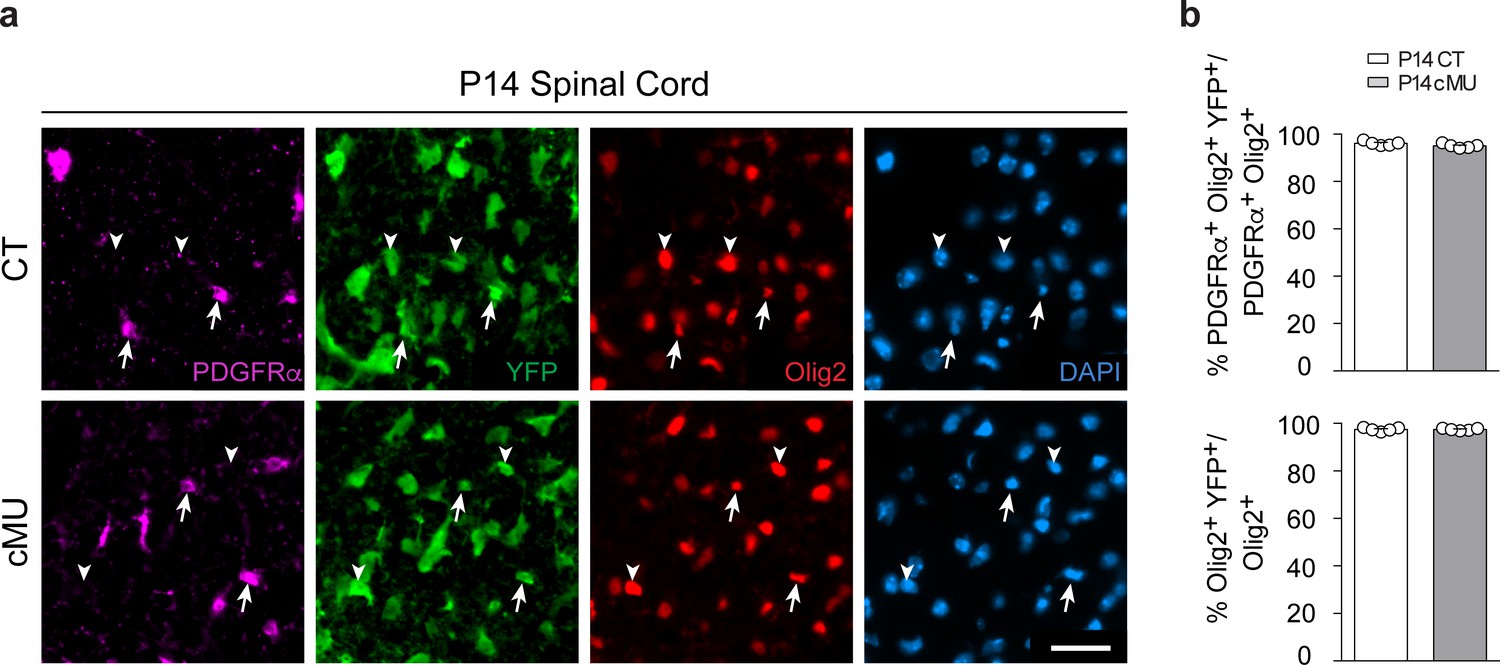
Recombination efficiency in spinal cord white matter.
(a) Representative immunostaining of cross-sectioned thoracic spinal cord white matter from P14 CT and cMU mice, n = 5 mice for each, CT and cMU. Cre-dependent expression of the reporter Rosa26-loxPstoploxP-YFP allele is detectable in oligodendrocyte lineage cells (Olig2+, examples indicated by arrowheads), including OPCs (PDGFRα+ Olig2+, examples indicated by arrows). Nuclear marker: DAPI. Scale bar: 25 μm, applying to the entire panel. (b) Corresponding graphs to (a) with quantification of percentage of recombined OPCs (PDGFRα+ Olig2+ YFP+) over total OPCs (PDGFRα+ Olig2+), and quantification of percentage of recombined oligodendrocyte lineage cells (Olig2+ YFP+) over total oligodendrocyte lineage cells (Olig2+). Data points represent n = 5 mice for each, CT and cMU; both dorsal and ventral white matter of 3 spinal cord hemi-sections were quantified per animal, with at least 43 PDGFRα+ YFP+ and at least 255 Olig2+ YFP+ cells quantified per hemi-section (unpaired two-tailed two sample Student’s t-test; for recombination frequency of OPCs: cMU vs. CT, p=0.0967, t = 1.881; for recombination frequency of oligodendrocyte lineage cells: cMU vs. CT, p=0.9943, t = 0.0074. Bars represent mean ±SEM. CT = control, cMU = conditional mutant.
Figure 1—figure supplement 2
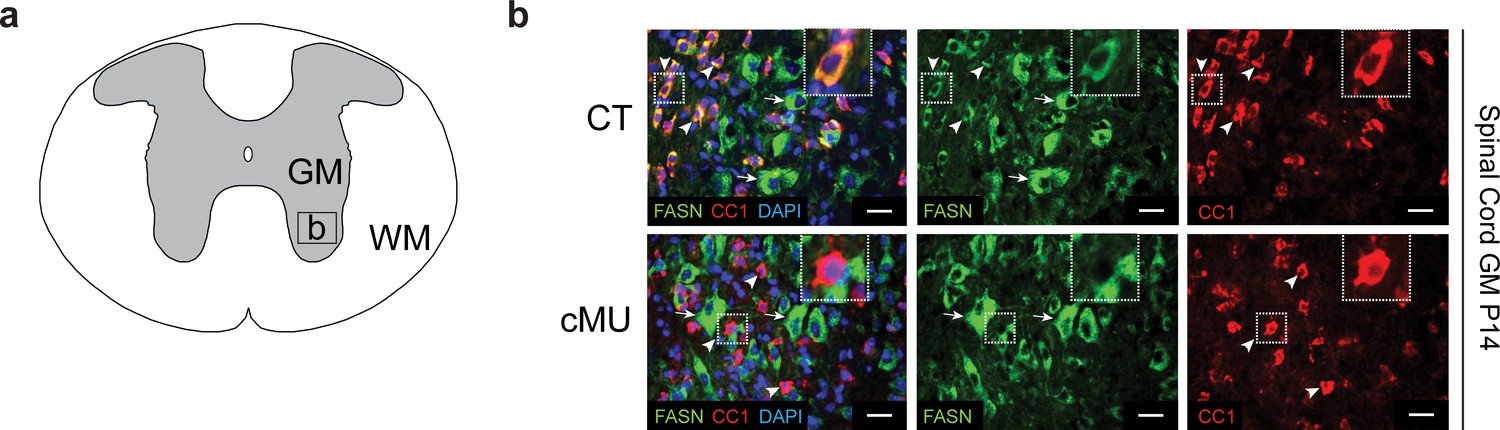
FASN expression in gray matter oligodendrocytes of CT but not in cMU mice.
(a) Schematic of the thoracic spinal cord. Square insert ‘b’: Gray matter (GM) area where subsequent immunostaining images were acquired. WM = white matter. (b) Representative immunostaining of cross-sectioned thoracic spinal cord from P14 CT and cMU mice, n = 3 mice examined for each, CT and cMU. Prominent cytoplasmic FASN expression in differentiated OLs (CC1+; examples indicated by arrowheads) in CT, but not in cMU. FASN is present in CC1- motoneurons (identified by their characteristic large size) in the ventral horn of the spinal cord GM in CT mice and also retained in cMUs (examples indicated by arrows). Nuclear marker: DAPI. Scale bars: 20 μm. CT = control, cMU = conditional mutant, GM = gray Matter, WM = white matter.
Figure 2 with 1 supplement
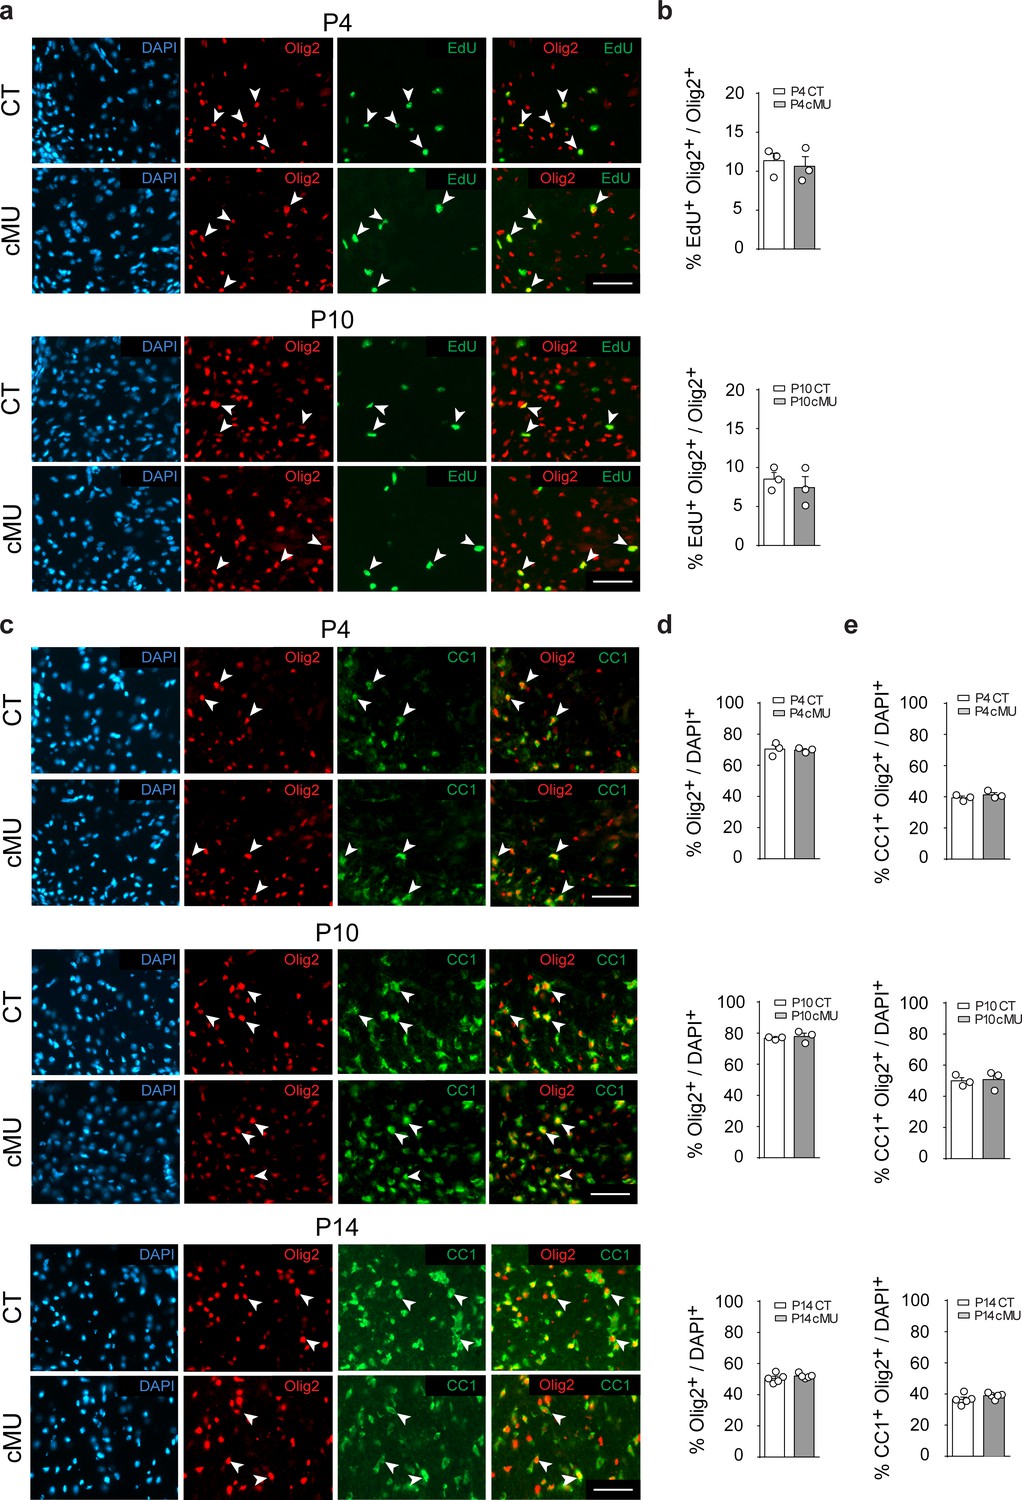
De novo fatty acid synthesis is not required to achieve correct numbers of oligodendrocyte lineage cells during development.
(a) Representative immunostaining of ventral white matter in cross-sectioned spinal cords of P4 and P10 mice identifying proliferating (EdU+) OLs (Olig2+; examples indicated by arrowheads), n = 3 mice for each, CT and cMU. Nuclear marker: DAPI. Scale bar: 50 μm, applying to entire panel. (b) Corresponding graphs to (a) with quantification of percentage of proliferating OLs (EdU+ Olig2+) over total number of OLs (Olig2+) in spinal cord white matter of CT and cMU mice at P4 and P10. Data points represent n = 3 mice for each, CT and cMU; random fields of both dorsal and ventral white matter of 4 sections quantified per animal, with at least 83 Olig2+ cells quantified per section (unpaired two-tailed two sample Student’s t-test; at P4: cMU vs. CT, p=0.6876, t = 0.4326; P10: cMU vs. CT, p=0.5448, t = 0.6608). (c) Representative immunostaining of ventral white matter in cross-sectioned spinal cords from P4, P10, and P14 mice identifying differentiated OLs (CC1+; examples indicated by arrowheads), OLs (Olig2+) and total number of cells (DAPI+), n = 3 mice for each, CT and cMU at P4 and P10, n = 5 mice for each, CT and cMU at P14. Nuclear marker: DAPI. Scale bar: 50 μm, applying to entire panel. (d, e) Corresponding graphs to (c) with quantification of percentage of total OLs (Olig2+) (d) and differentiated OLs (CC1+ Olig2+) (e) over total number of cells (DAPI+), in the spinal cord white matter of CT and cMU mice at P4, P10 and P14. Data points represent n = 3 mice for each, CT and cMU at P4 and P10, and n = 5 mice for each, CT and cMU at P14. Random fields of both dorsal and ventral white matter of at least 3 sections quantified per animal, with at least 83 Olig2+ cells quantified per section (unpaired two-tailed two sample Student’s t-test; % Olig2+/DAPI+ at P4: cMU vs. CT, p=0.8280, t = 0.2319; at P10: cMU vs. CT, p=0.6694, t = 0.46; at P14: cMU vs. CT, p=0.3340, t = 1.028; % CC1+ Olig2+ / DAPI+ at P4: cMU vs. CT, p=0.3405, t = 1.081; at P10: cMU vs. CT, p=0.8490, t = 0.2031; at P14: cMU vs. CT, p=0.2061, t = 1.376). Bars represent mean ±SEM. CT = control, cMU = conditional mutant.
Figure 2—figure supplement 1
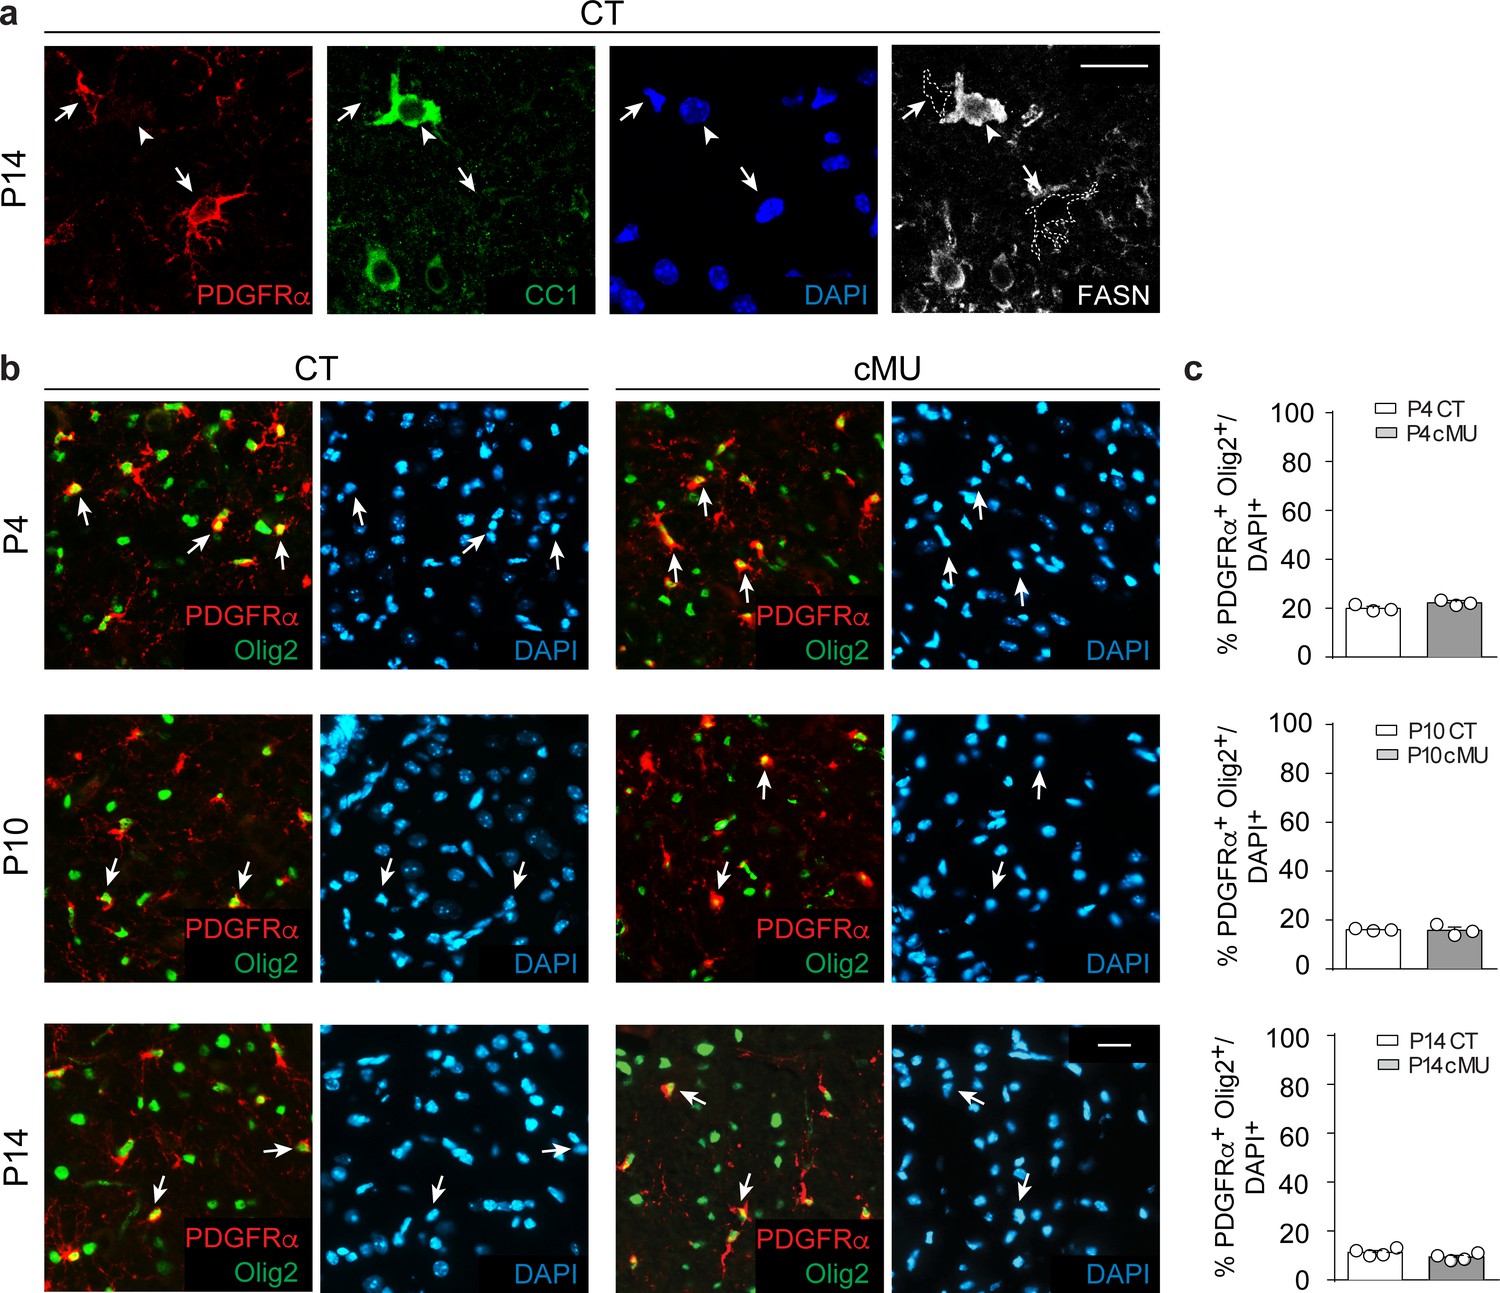
FASN expression in oligodendrocyte progenitors is marginal and dispensable for their early maintenance.
(a) Representative immunostaining of ventral white matter in cross-sections of lumbar spinal cords from P14 CT mice depicting marginal (if any) FASN expression in OPCs (PDGFRα+; examples indicated by arrows and outlining) compared to comparatively high expression in differentiated OLs (CC1+; example indicated by arrowhead). n = 3 examined CT mice. Scale bar: 20 μm, applying to entire panel. (b) Representative immunostainings of ventral white matter in cross-sectioned lumbar spinal cords from P4, P10 and P14 CT and cMU mice, n = 3 mice for each, CT and cMU, at P4 and P10, and n = 4 mice for each, CT and cMU, at P14. Images identify OPCs (PDGFRα+ Olig2+, arrows). Nuclear marker: DAPI. Scale bar: 20 μm, applying to entire panel. (c) Corresponding graphs to (b) with quantification of percentage of OPCs (PDGFRα+ Olig2+) over total number of cells (DAPI+) in the spinal cord white matter of CT and cMU mice at P4, P10 and P14. Data points represent n = 3 mice for each, CT and cMU, at P4 and P10, and n = 4 mice for each, CT and cMU, at P14. Random fields of both dorsal and ventral white matter in at least 3 sections quantified per animal, with at least 121 PDGFRα+ Olig2+ cells quantified per section (unpaired two-tailed two sample Student’s t-test; at P4: cMU vs. CT, p=0.0903, t = 2.223; at P10: cMU vs. CT, p=0.8527, t = 0.198; at P14: cMU vs. CT, p=0.1030, t = 1.922). Bars represent mean ±SEM. CT = control, cMU = conditional mutant.
Figure 3 with 3 supplements
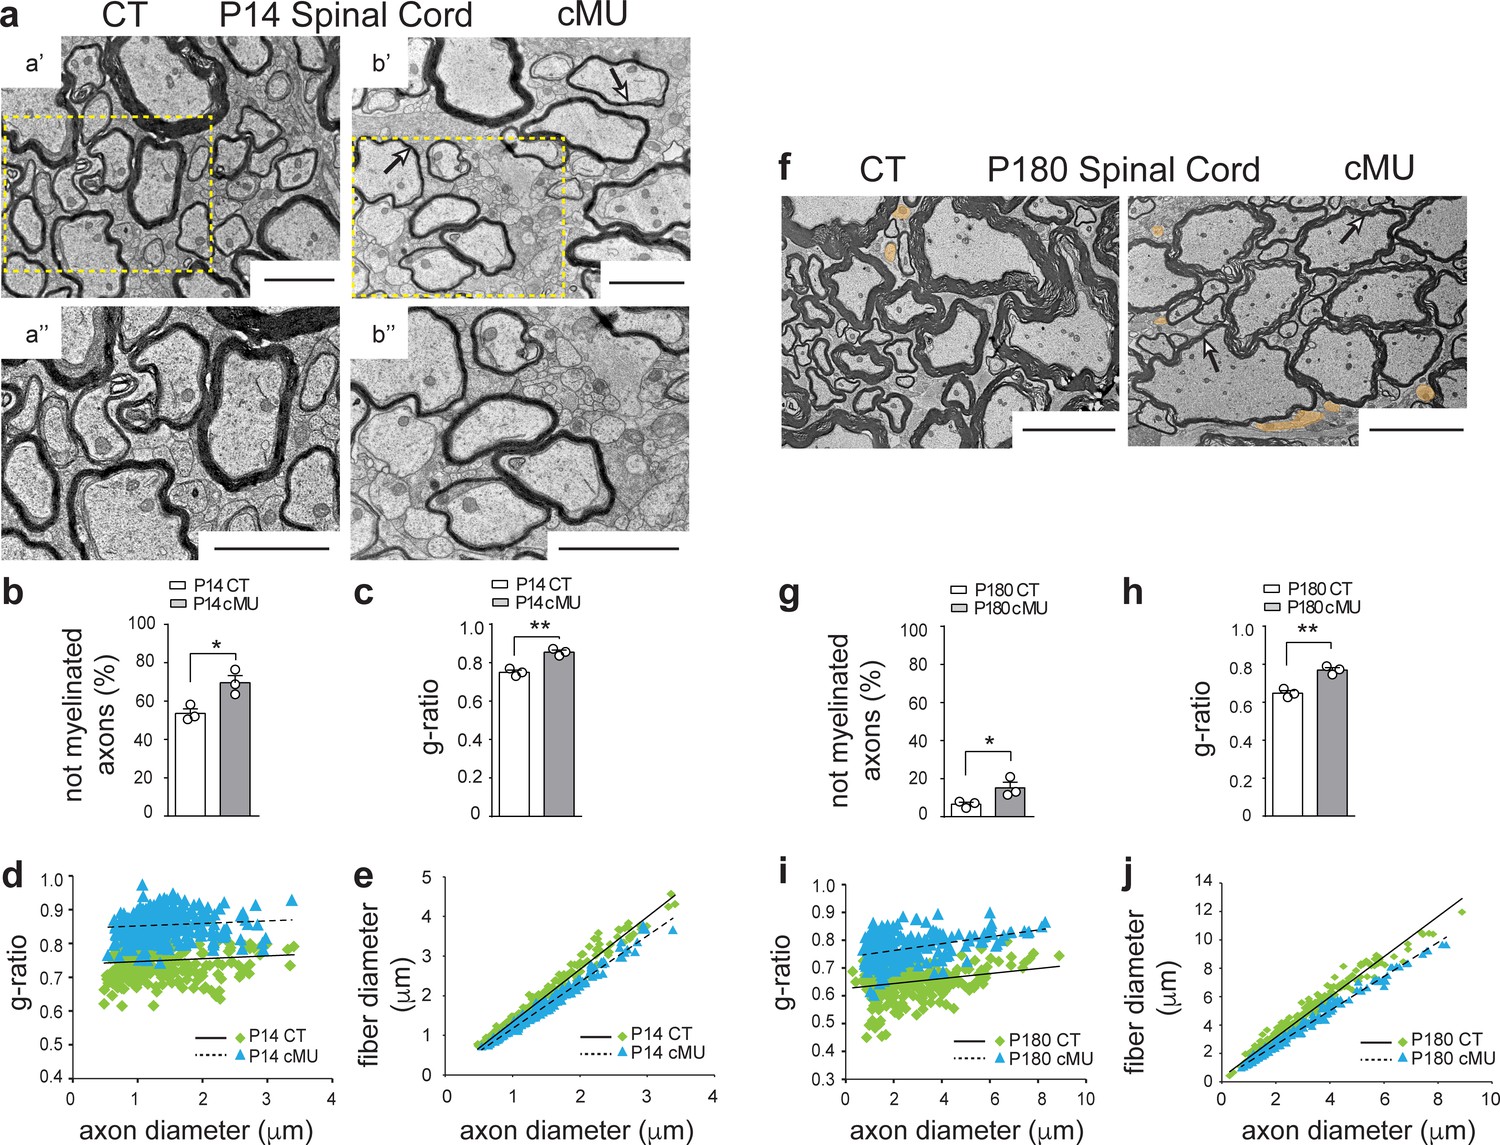
De novo fatty acid synthesis by oligodendrocytes is essential to achieve accurate myelination in the spinal cord.
(a) Representative EM images of P14 control (CT, a’ and a’’) and conditional mutant (cMU, b’ and b’’) white matter from the ventral funiculi of lumbar spinal cords. cMUs show more naked axons, not-yet enwrapped by myelin, when compared to CTs. cMUs also display thinner myelin (examples indicated by arrows). Scale bars: 2 μm. (b) Corresponding graph with quantification of percentage of not myelinated axons at P14. Data points represent n = 3 mice for each, CT and cMU, with at least 590 axons quantified per animal in random fields selected in the same anatomical area (unpaired two-tailed two sample Student’s t-test; at P14: cMU vs. CT, p=0.0225, t = 3.614), *p<0.05. (c) Overall hypomyelination at P14 in cMU as shown by g-ratio analysis. Data points represent n = 3 mice for each, CT and cMU (unpaired two-tailed two sample Student’s t-test; at P14: cMU vs. CT, p=0.0025, t = 6.731), **p<0.01. (d, e) Linear correlation of g-ratio versus axon diameter (d) and of fiber diameter versus axon diameter (e), in the ventral white matter spinal cord of cMU compared to CT at P14. 100 myelinated axons per mouse analyzed in random fields selected in the same anatomical area, n = 3 mice for each, CT and cMU. (f) Representative EM images of P180 CT and cMU white matter from ventral funiculi of lumbar spinal cords. cMUs show more naked axons (false colored in orange) compared to CTs. cMU axons are encased by thinner myelin (examples indicated by arrows) compared to CTs. Scale bars: 5 μm. (g) Corresponding graph with quantification of percentage of not myelinated axons at P180. Data points represent n = 3 mice for each, CT and cMU, with at least 220 axons quantified per animal, in random fields selected in the same anatomical area (unpaired two-tailed two sample Student’s t-test; at P180: cMU vs. CT, p=0.0493, t = 2.791), *p<0.05. (h) Overall hypomyelination at P180 in cMU compared to CT, as shown by g-ratio analysis. Data points represent n = 3 mice for each, CT and cMU (unpaired two-tailed two sample Student’s t-test; at P180: cMU vs. CT, p=0.0027, t = 6.651), **p<0.01. (i, j) Linear correlation of g-ratio versus axon diameter (i) and of fiber diameter versus axon diameter (j), in the ventral white matter spinal cord of cMU compared to CT at P180. At least 65 myelinated axons per mouse analyzed in random fields selected in the same anatomical area, n = 3 mice for each, CT and cMU. Bars represent mean ±SEM. CT = control, cMU = conditional mutant.
Figure 3—figure supplement 1
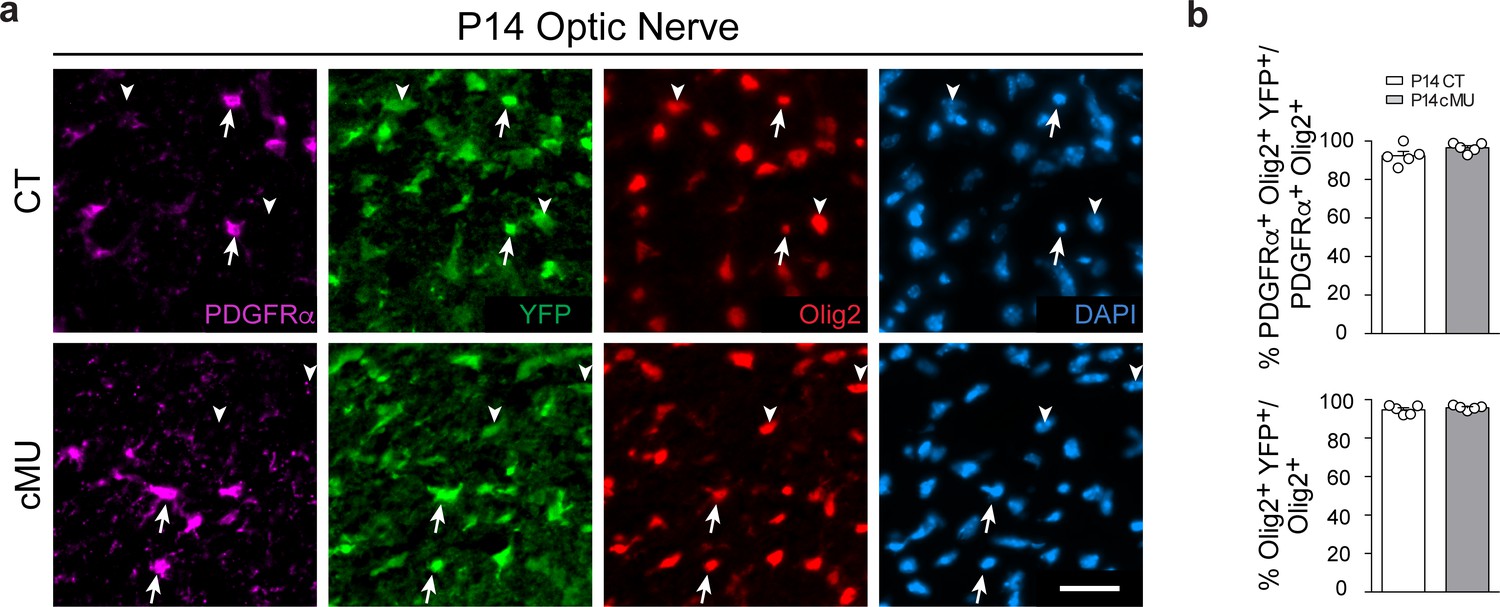
Recombination efficiency in the optic nerve.
(a) Representative immunostaining of cross-sectioned optic nerves from P14 CT and cMU mice, n = 5 mice for each, CT and cMU. Cre-dependent expression of the reporter Rosa26-loxPstoploxP-YFP allele is detectable in oligodendrocyte lineage cells (Olig2+, examples indicated by arrowheads), including OPCs (PDGFRα+ and Olig2+, examples indicated by arrows). Nuclear marker: DAPI. Scale bar: 25 μm, applying to entire panel. (b) Corresponding graphs to (a) with quantification of percentage of recombined OPCs (PDGFRα+ Olig2+ YFP+) over total OPCs (PDGFRα+ Olig2+), and quantification of percentage of recombined oligodendrocyte lineage cells (Olig2+ YFP+) over total oligodendrocyte lineage cells (Olig2+). Data points represent n = 5 mice for each, CT and cMU; whole surface of 3 optic nerve sections were quantified per animal, with at least 19 PDGFRα+ YFP+ and at least 80 Olig2+ YFP+ cells quantified per section (unpaired two-tailed two sample Student’s t-test; for recombination frequency of OPCs: cMU vs. CT, p=0.1394, t = 1.641; for recombination frequency of oligodendrocyte lineage cells: cMU vs. CT, p=0.3650, t = 0.9603. Bars represent mean ±SEM. CT = control, cMU = conditional mutant.
Figure 3—figure supplement 2
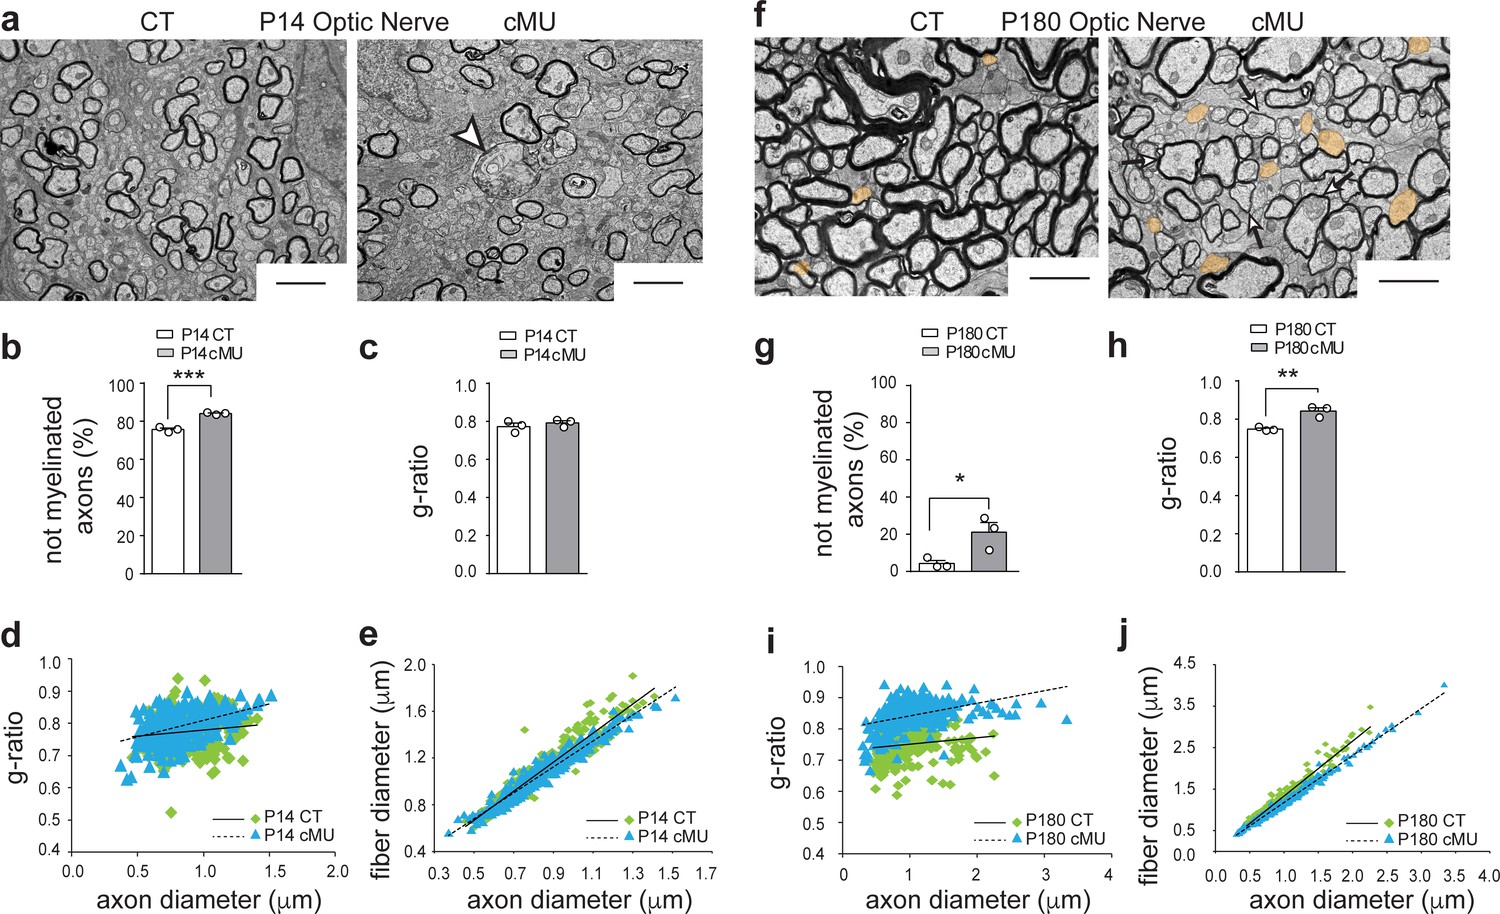
De novo fatty acid synthesis by oligodendrocytes is essential to achieve accurate myelination of the optic nerve.
(a) Representative EM images of optic nerves from P14 control (CT) and conditional mutant (cMU) mice. Note the increased number of axons not-yet enwrapped by myelin in cMUs when compared to CTs. cMUs also display aberrant myelinated-axon profiles (example indicated by arrowhead). Scale bars: 2 μm. (b) Corresponding graph with quantification of the percentage of not myelinated axons at P14. Data points represent n = 3 mice for each, CT and cMU, with at least 4500 axons quantified per animal in random fields selected in the same anatomical area (unpaired two-tailed two sample Student’s t-test; at P14: cMU vs. CT, p=0.0006, t = 9.999), ***p<0.001. (c) g-ratio analysis. Data points represent n = 3 mice for each, CT and cMU (unpaired two-tailed two sample Student’s t-test; at P14: cMU vs. CT, p=0.4162, t = 0.906). (d, e) Linear correlation of g-ratio versus axon diameter (d) and of fiber diameter versus axon diameter (e) in optic nerves of cMU compared to CT at P14. 100 myelinated axons per mouse analyzed in random fields selected in the same anatomical area, n = 3 mice for each, CT and cMU. (f) Representative EM images of optic nerves from P180 CT and cMU mice. cMUs show more axons not-yet enwrapped by myelin (examples false colored in orange) when compared to CTs. cMU axons are also covered by thinner myelin (examples indicated by arrows) compared to CTs. Scale bars: 2 μm. (g) Corresponding graph with quantification of percentage of not myelinated axons at P180. Data points represent n = 3 mice for each, CT and cMU, with at least 1500 axons quantified per animal, in random fields selected in the same anatomical area (unpaired two-tailed two sample Student’s t-test; at P180: cMU vs. CT, p=0.0345, t = 3.15), *p<0.05. (h) Overall hypomyelination in cMU compared to CT at P180, as shown by g-ratio analysis. Data points represent n = 3 mice for each, CT and cMU (unpaired two-tailed two sample Student’s t-test; at P180: cMU vs. CT, p=0.0062, t = 5.269), **p<0.01. (i, j) Linear correlation of g-ratio versus axon diameter (i) and of fiber diameter versus axon diameter (j), in optic nerves of cMU compared to CT at P180. 100 myelinated axons per mouse analyzed, in random fields selected in the same anatomical area, n = 3 mice for each, CT and cMU. Bars represent mean ±SEM. CT = control, cMU = conditional mutant.
Figure 3—figure supplement 3
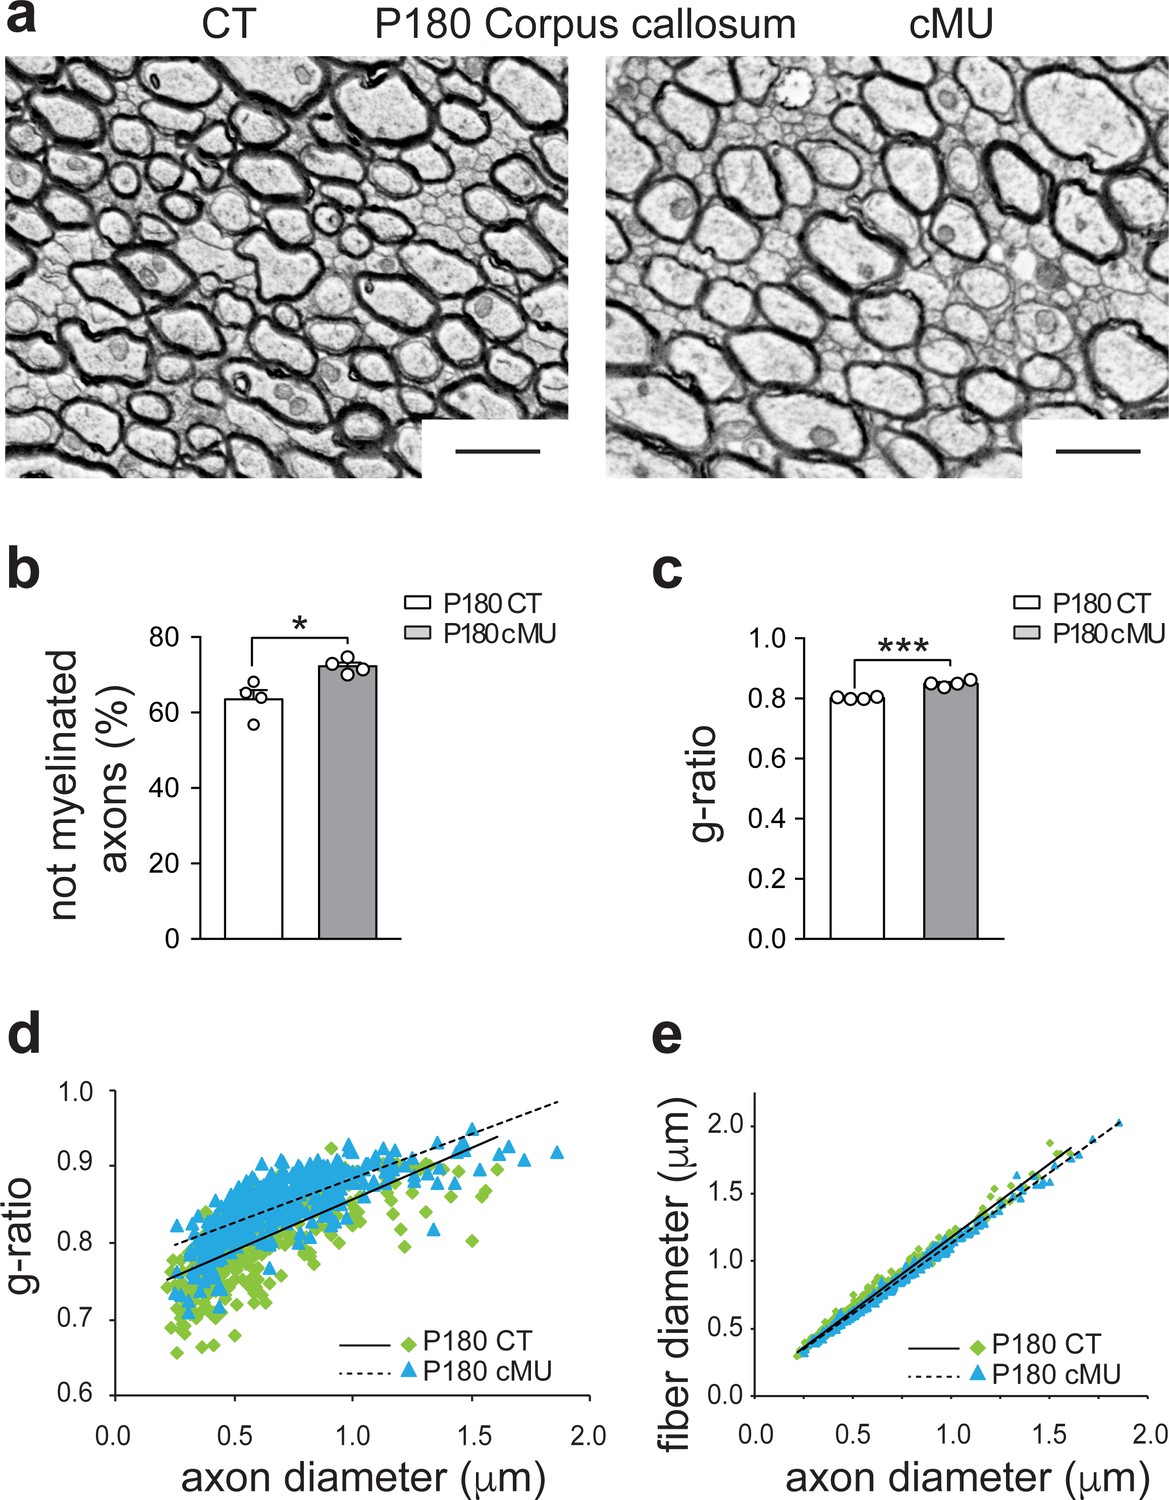
De novo fatty acid synthesis by oligodendrocytes is essential to achieve accurate myelination of the corpus callosum.
(a) Representative EM images of corpus callosum from P180 CT and cMU mice. cMUs show slightly more axons not-yet enwrapped by myelin compared to CTs. cMU axons are also covered by thinner myelin compared to CTs. Scale bars: 1 μm (b) Corresponding graph with quantification of the percentage of not myelinated axons at P180. Data points represent n = 4 mice for each, CT and cMU, with at least 2243 axons quantified per animal in random fields selected in the same anatomical area (unpaired two-tailed two sample Student’s t-test; cMU vs. CT, p=0.0152, t = 3.362), *p<0.05. Bars represent mean ±SEM. (c) g-ratio analysis. Data points represent n = 4 mice for each, CT and cMU (unpaired two-tailed two sample Student’s t-test; cMU vs. CT, p<0.0001, t = 8.841), ***p<0.001. Bars represent mean ±SEM. (d, e) Linear correlation of g-ratio versus axon diameter (d) and of fiber diameter versus axon diameter (e) in corpus callosum of cMU compared to CT at P180. At least 100 myelinated axons per mouse analyzed in random fields selected in the same anatomical area, n = 4 mice for each, CT and cMU. CT = control, cMU = conditional mutant.
Figure 4 with 2 supplements
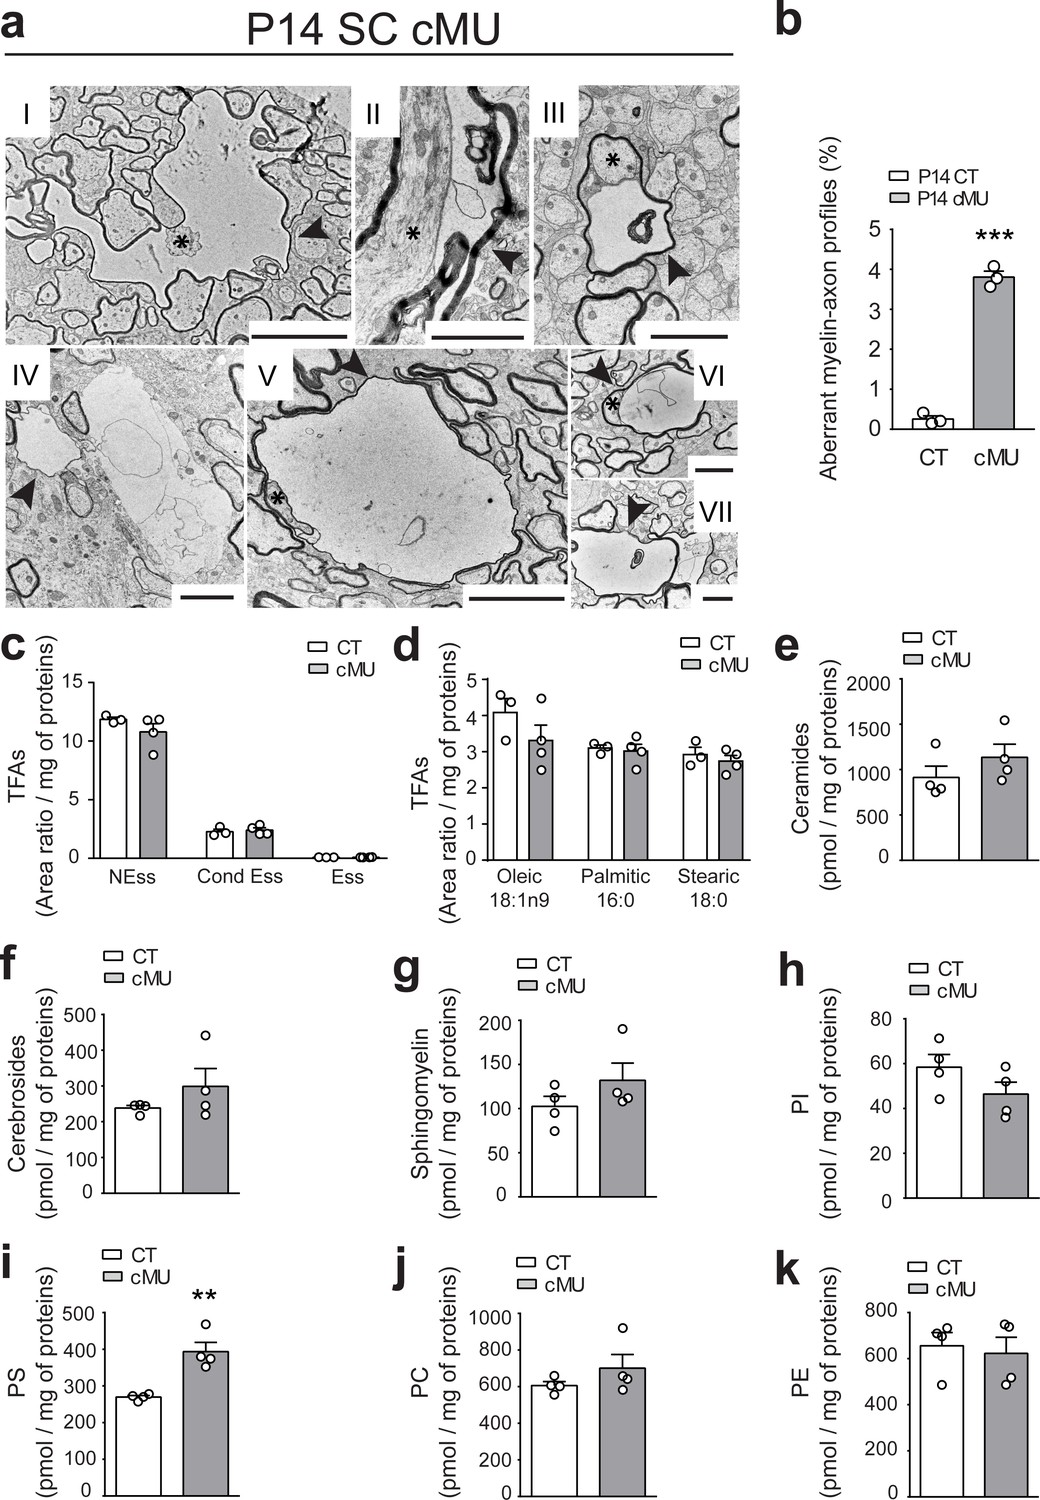
De novo fatty acid synthesis by oligodendrocytes is required to maintain structural stability of myelinated axons.
(a) Exemplary EM images of aberrant myelin-axon profiles showing vacuolation (examples indicated by arrowheads) in the ventral white matter of spinal cords of P14 cMUs. Where identifiable, axons associated with aberrant structures are indicated by asterisks. Scale bars: I = 5 µm, II = 2 µm, III = 2 µm, IV = 2 µm, V = 5 µm, VI = 2 µm, VII = 2 µm. (b) Corresponding graph with quantification of the percentage of aberrant myelin-axon profiles. Data points represent n = 3 mice for each, CT and cMU (unpaired two-tailed two sample Student’s t-test; at P14: cMU vs. CT p<0.0001, t = 21.16), ***p<0.001. At least 8300 axons per mouse analyzed in random fields selected in the same anatomical area. (c) Total FA composition of myelin purified from spinal cords of P60 CT and cMU mice, divided in non-essential FAs (NEss), conditional-essential FAs (Cond Ess) and essential FAs (Ess). Data points represent n = 3 mice for CT and n = 4 mice for cMU (unpaired two-tailed two sample Student’s t-test; NEss: cMU vs. CT, p=0.2609, t = 1.267; Cond Ess: cMU vs. CT, p=0.6625, t = 0.4635; Ess: cMU vs. CT, p=0.4435, t = 0.8317). (d) Quantification of the most abundant FAs found in myelin purified from spinal cords of CT and cMU mice. Data points represent n = 3 mice for CT and n = 4 mice for cMU (unpaired two-tailed two sample Student’s t-test; Oleic: cMU vs. CT, p=0.2525, t = 1.293; Palmitic: cMU vs. CT, p=0.7377, t = 0.3542; Stearic: cMU vs. CT, p=0.4966, t = 0.7328). (e, f, g) Content of ceramides (e), cerebrosides (f) and sphingomyelin (g) in myelin isolated from spinal cords of cMU compared to CT mice. Data points represent n = 4 mice for each, CT and cMU (unpaired two-tailed two sample Student’s t-test; ceramides: cMU vs. CT, p=0.2822, t = 1.181; cerebrosides: cMU vs. CT, p=0.2722, t = 1.209; sphingomyelin: cMU vs. CT, p=0.2310, t = 1.333). (h, i, j, k) Total content of phosphatidylinositols (PI), phosphatidylserines (PS), phosphatidylcholines (PC) and phosphatidylethanolamines (PE) in myelin isolated from spinal cords of CT and cMU mice. Data points represent n = 4 mice for each, CT and cMU (unpaired two-tailed two sample Student’s t-test; PI: cMU vs. CT, p=0.1765, t = 1.532; PS: cMU vs. CT, p=0.0031, t = 4.784; PC: cMU vs. CT, p=0.2698, t = 1.216; PE: cMU vs. CT, p=0.7236, t = 0.3706), **p<0.01. Bars represent mean ±SEM. CT = control, cMU = conditional mutant.
Figure 4—figure supplement 1
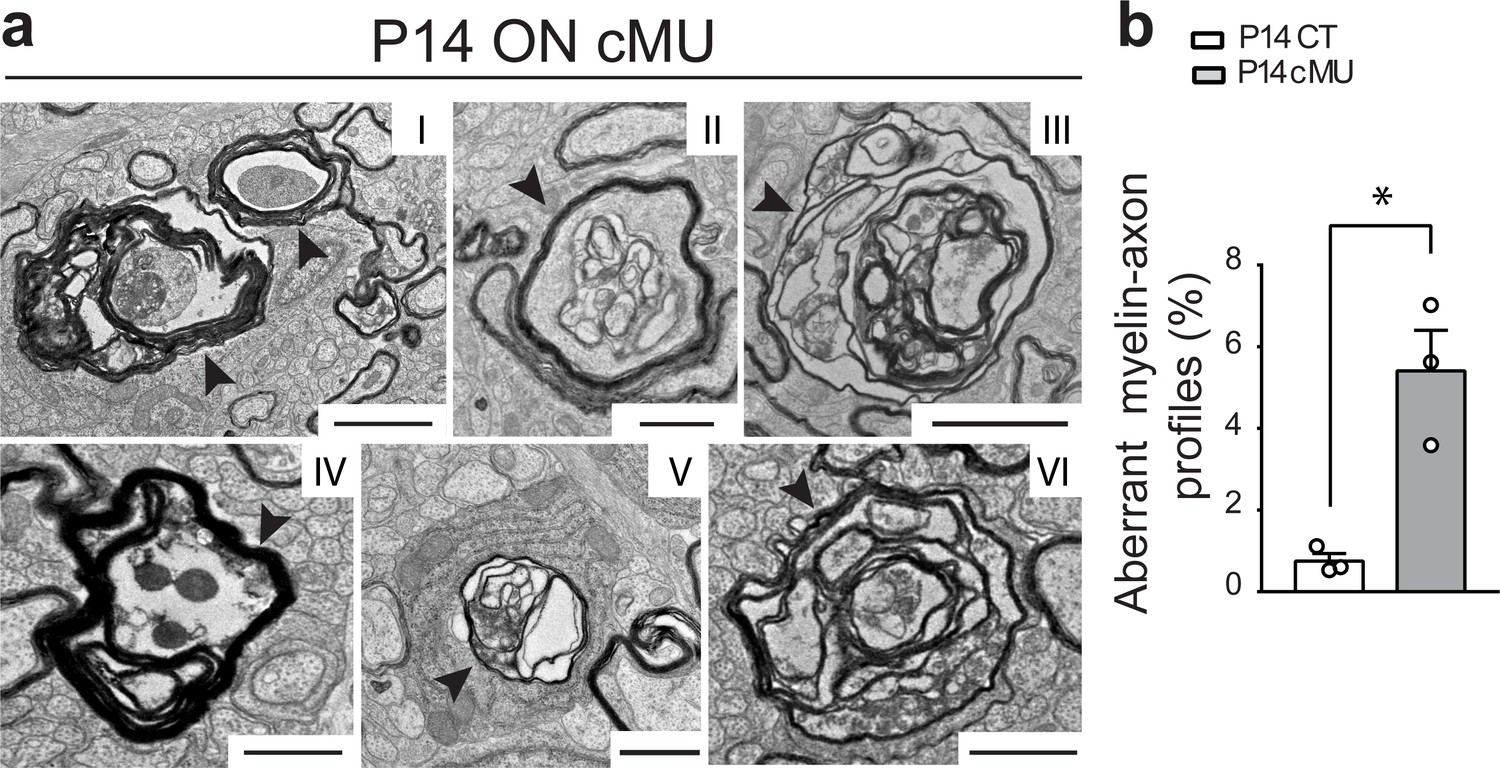
De novo fatty acid synthesis by oligodendrocytes supports structural stability of myelinated axons in the optic nerve.
(a) EM images of aberrant myelinated axon profiles (examples indicated by arrowheads) in the optic nerve of P14 cMU mice. Scale bars: I = 2 µm, II = 1 µm, III = 2 µm, IV = 1 µm, V = 1 µm, VI = 1 µm. (b) Corresponding graph with quantification of percentage of aberrant myelin-axon profiles. Data points represent n = 3 mice for each, CT and cMU (unpaired two-tailed two sample Student’s t-test; at P14: cMU vs. CT, p=0.0101, t = 4.595), *p<0.05. At least 3600 axons per mouse analyzed, in random fields selected in the same anatomical area. Bars represent mean ±SEM. CT = control, cMU = conditional mutant.
Figure 4—figure supplement 2
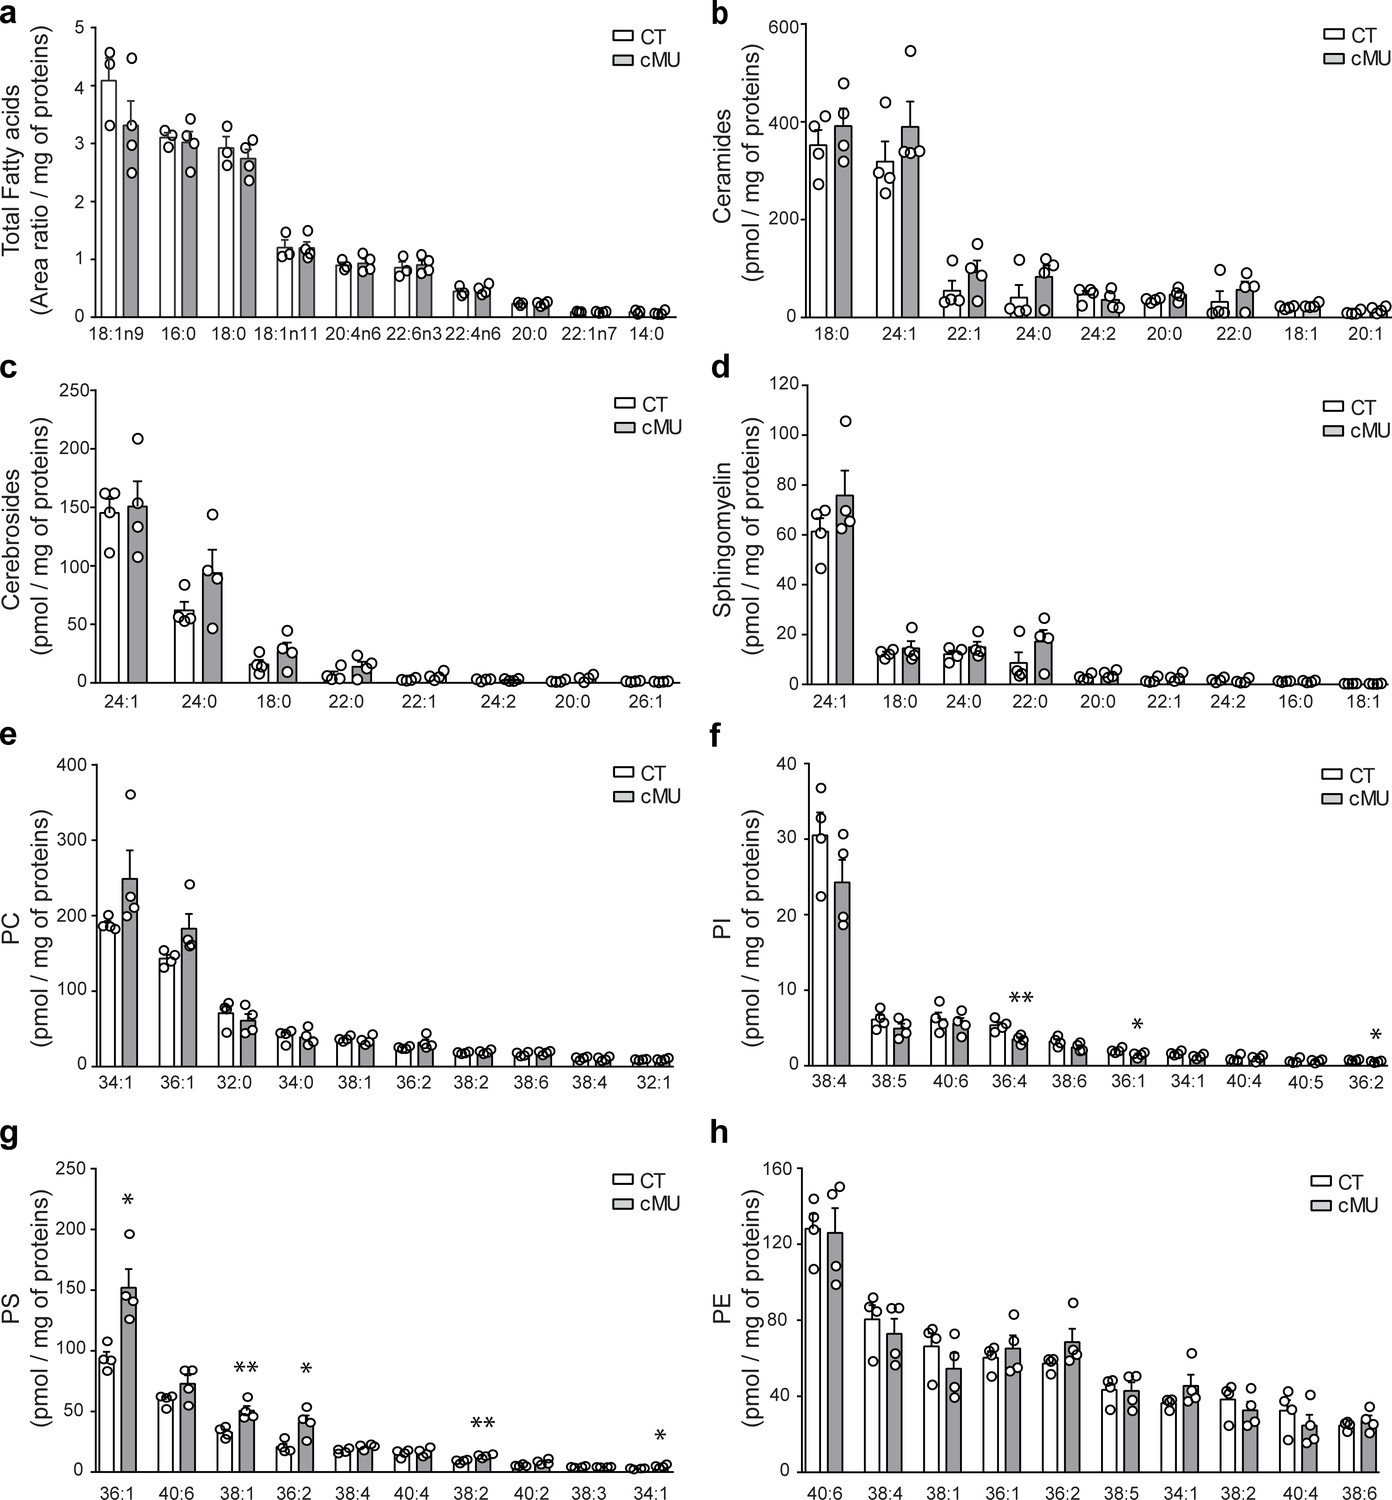
Lipid profiles of spinal cord myelin of adult control and FASN mutant mice.
Lipids extracted from myelin isolated from spinal cords of control (CT) and mutant (cMU) mice were identified and quantified by liquid chromatography-mass spectrometry. Individual species of 10 highest total FAs (a), all identified ceramides (b), cerebrosides (c), and sphingomyelin (d), 10 highest phosphatidylcholines (PC) (e), phosphatidylinositols (PI) (f), phosphatidylserines (PS) (g), and phosphatidylethanolamines (PE) (h) are shown. Lipid amounts were normalized to total protein content of samples. Significance was calculated compared to controls. Data points represent n = 3 mice for CT and n = 4 mice for cMU for analysis of total FAs, and n = 4 mice for each, CT and cMU for all other lipid analysis (unpaired two-tailed two sample Student’s t-test; Total Fatty Acids: 18:1n9, p=0.2525, t = 1.293; 16:0, p=0.7377, t = 0.3542; 18:0, p=0.4966, t = 0.7328; 18:1n11, p=0.9865, t = 0.01774; 20:4n6, p=0.7340, t = 0.3593; 22:6n3, p=0.6994, t = 0.4091; 22:4n6, p=0.6471, t = 0.4866; 20:0, p=0.9834, t = 0.02188; 22:1n7, p=0.4538, t = 0.8119; 14:0, p=0.5017, t = 0.7237; Ceramides: 18:0, p=0.4388, t = 0.8291; 24:1, p=0.3224, t = 1.078; 22:1, p=0.2792, t = 1.189; 24:0, p=0.2705, t = 1.214; 24:2, p=0.4223, t = 0.8609; 20:0, p=0.1532, t = 1.635; 22:0, p=0.4065, t = 0.8925; 18:1, p=0.2146, t = 1.387; 20:1, p=0.1721, t = 1.55; Cerebrosides: 24:1, p=0.8276, t = 0.2274; 24:0, p=0.1838, t = 1.502; 18:0, p=0.2138, t = 1.39; 22:0, p=0.2293, t = 1.338; 22:1, p=0.1417, t = 1.691; 24:2, p=0.9312, t = 0.0899; 20:0, p=0.1270, t = 1.771; 26:1, p=0.3540, t = 1.004; Sphingomyelin: 24:1, p=0.2507, t = 1.271; 18:0, p=0.4947, t = 0.7268; 24:0, p=0.3124, t = 1.103; 22:0, p=0.2253, t = 1.352; 20:0, p=0.2421, t = 1.298; 22:1, p=0.2618, t = 1.239; 24:2, p=0.4736, t = 0.7643; 16:0, p=0.9749, t = 0.03276; 18:1, p=0.8476, t = 0.2007; PC: 34:1, p=0.1620, t = 1.594; 36:1, p=0.0993, t = 1.948; 32:0, p=0.4570, t = 0.7948; 34:0, p=0.8025, t = 0.2614; 38:1, p=0.5828, t = 0.5803; 36:2, p=0.1624, t = 1.593; 38:2, p=0.4233, t = 0.8591; 38:6, p=0.3106, t = 1.107; 38:4, p=0.7018, t = 0.4018; 32:1, p=0.7399, t = 0.3478; PI: 38:4, p=0.1932, t = 1.465; 38:5, p=0.2254, t = 1.351; 40:6, p=0.6283, t = 0.5099; 36:4, p=0.0097, t = 3.73; 38:6, p=0.1153, t = 1.84; 36:1, p=0.0445, t = 2.534; 34:1, p=0.0715, t = 2.186; 40:4, p=0.8491, t = 0.1986; 40:5, p=0.9242, t = 0.09923; 36:2, p=0.0351, t = 2.711; PS: 36:1, p=0.0113, t = 3.602; 40:6, p=0.1262, t = 1.775; 38:1: p=0.0075, t = 3.949; 36:2, p=0.0193, t = 3.173; 38:4, p=0.0631, t = 2.277; 40:4, p=0.6789, t = 0.4349; 38:2, p=0.0065, t = 4.075; 40:2, p=0.0544, t = 2.385; 38:3, p=0.7193, t = 0.3768; 34:1, p=0.0276, t = 2.893; PE: 40:6, p=0.8894, t = 0.1451; 38:4, p=0.5126, t = 0.6958; 38:1, p=0.2972, t = 1.141; 36:1, p=0.5587, t = 0.619; 36:2, p=0.1676, t = 1.57; 38:5, p=0.9192, t = 0.1058; 34:1, p=0.1794, t = 1.52; 38:2, p=0.4110, t = 0.8834; 40:4, p=0.3597, t = 0.9915; 38:6, p=0.4677, t = 0.7751), *p<0.05, **p<0.01. Bars represent mean ±SEM. CT = control, cMU = conditional mutant.
Figure 5 with 1 supplement
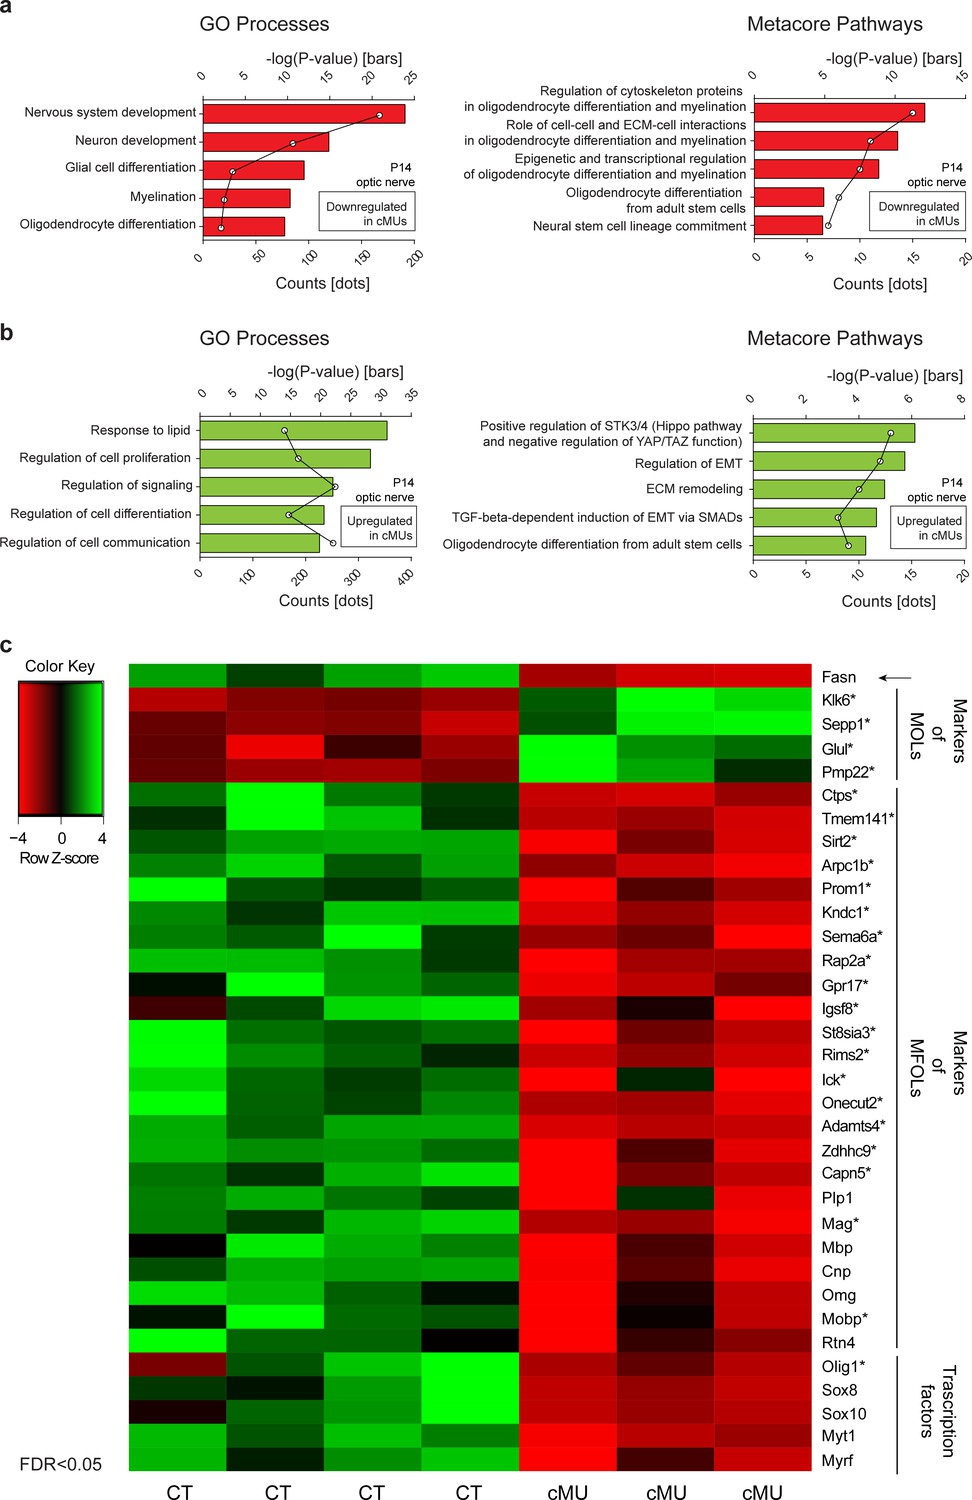
Transcriptome analysis of optic nerves of Fasn mutant mice reveal oligodendrocyte defects in late stages of maturation, including myelination.
(a, b) GeneOntology analysis depicting biological processes affected by down-regulated (a) and up-regulated (b) transcripts in P14 optic nerves of mutant (cMU) mice. Metacore Pathway analysis showing pathways affected by downregulated (a) and upregulated (b) transcripts in P14 optic nerves of cMU mice. Data points represent the count of regulated transcript for each category and pathway. (c) Heat map of RNA-seq data of CT and cMU optic nerves at P14, depicting Fasn and selected down- and up-regulated modulators of OL differentiation, maturation and myelination (FDR < 0.05). Markers identified by comparison with OLs single cell sequencing data (Marques et al., 2016) are marked with an asterisk. n = 3 mice for cMU, n = 4 mice for CT. CT = control, cMU = conditional mutant, MFOLs = myelin-forming oligodendrocytes, MOLs = mature oligodendrocytes (Marques et al., 2016).
-
Figure 5—source data 1
Expressed transcripts in optic nerves from control and cMU mice at P14.
- https://doi.org/10.7554/eLife.44702.016
Figure 5—figure supplement 1
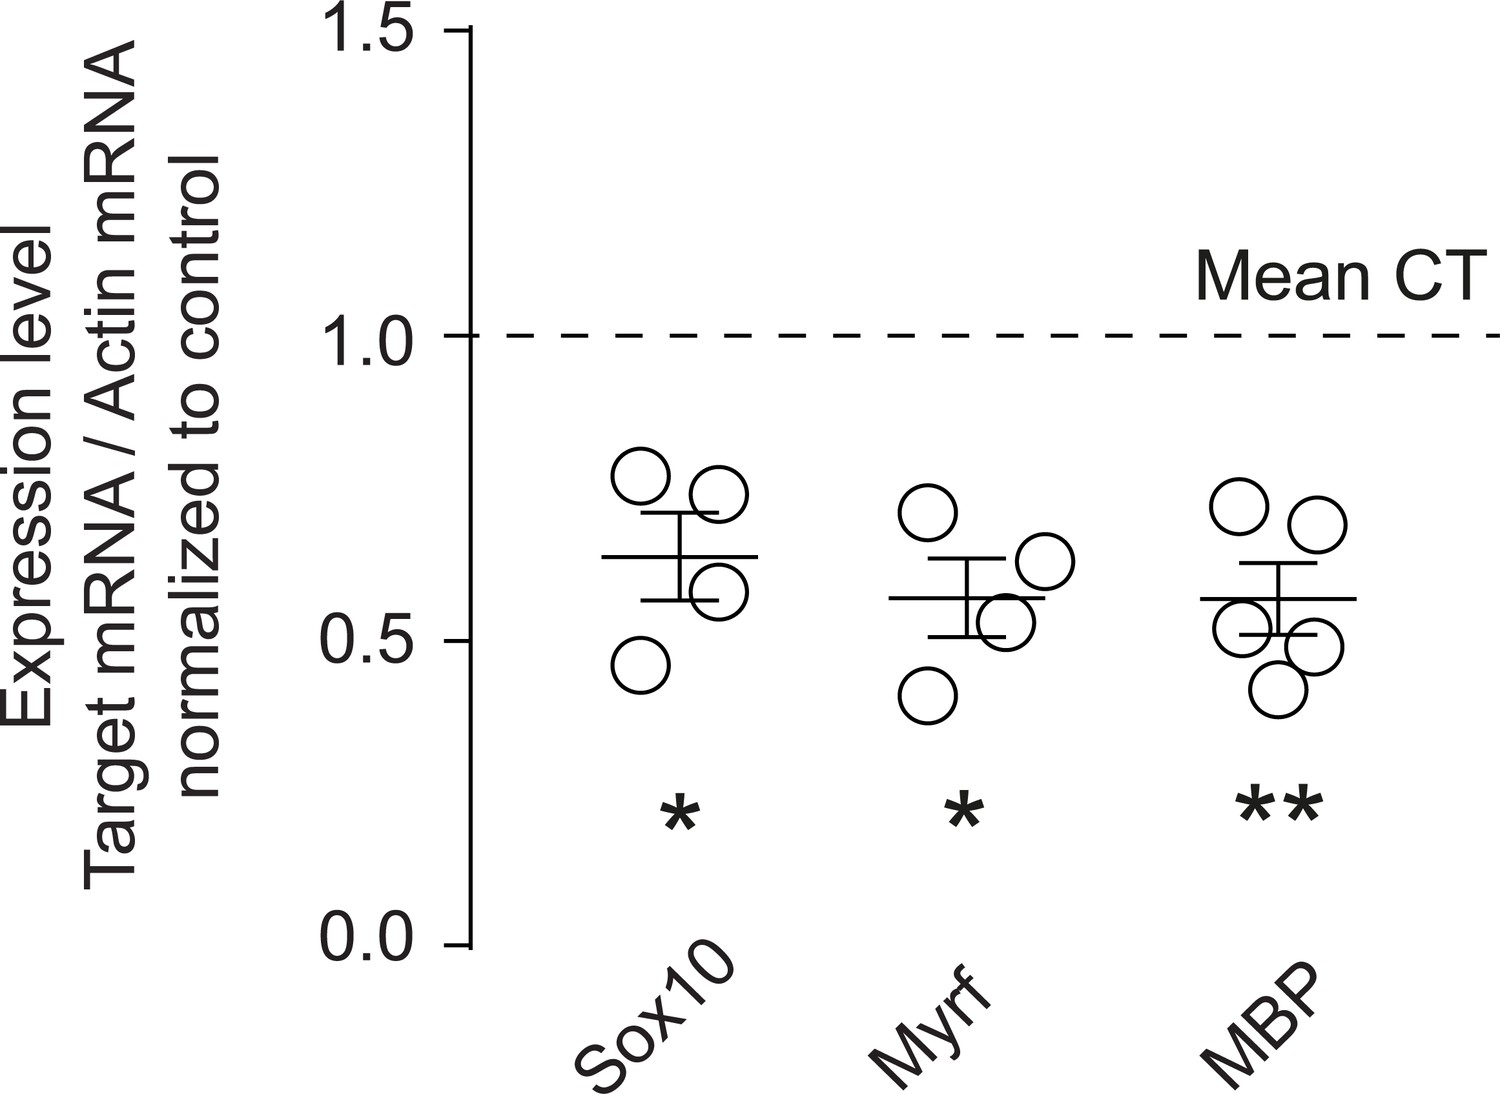
FASN deficiency is correlated with molecular signs of defective oligodendrocyte maturation.
Graph of qRT-PCR analysis of Sox10, Myrf and MBP in optic nerves of P14 CT and cMU mice. Data are normalized to β-actin and to the mean of CTs (unpaired two-tailed two sample Student’s t-test; Sox10: p=0.0385, t = 2.641, n = 4 for CT and n = 4 for cMU; Myrf: p=0.0326, t = 2.765, n = 4 for CT and n = 4 for cMU; MBP: p=0.0078, t = 3.405, n = 6 for CT and n = 5 for cMU), *p<0.05, **p<0.01. Bars represent mean ±SEM. CT = control, cMU = conditional mutant.
Figure 6
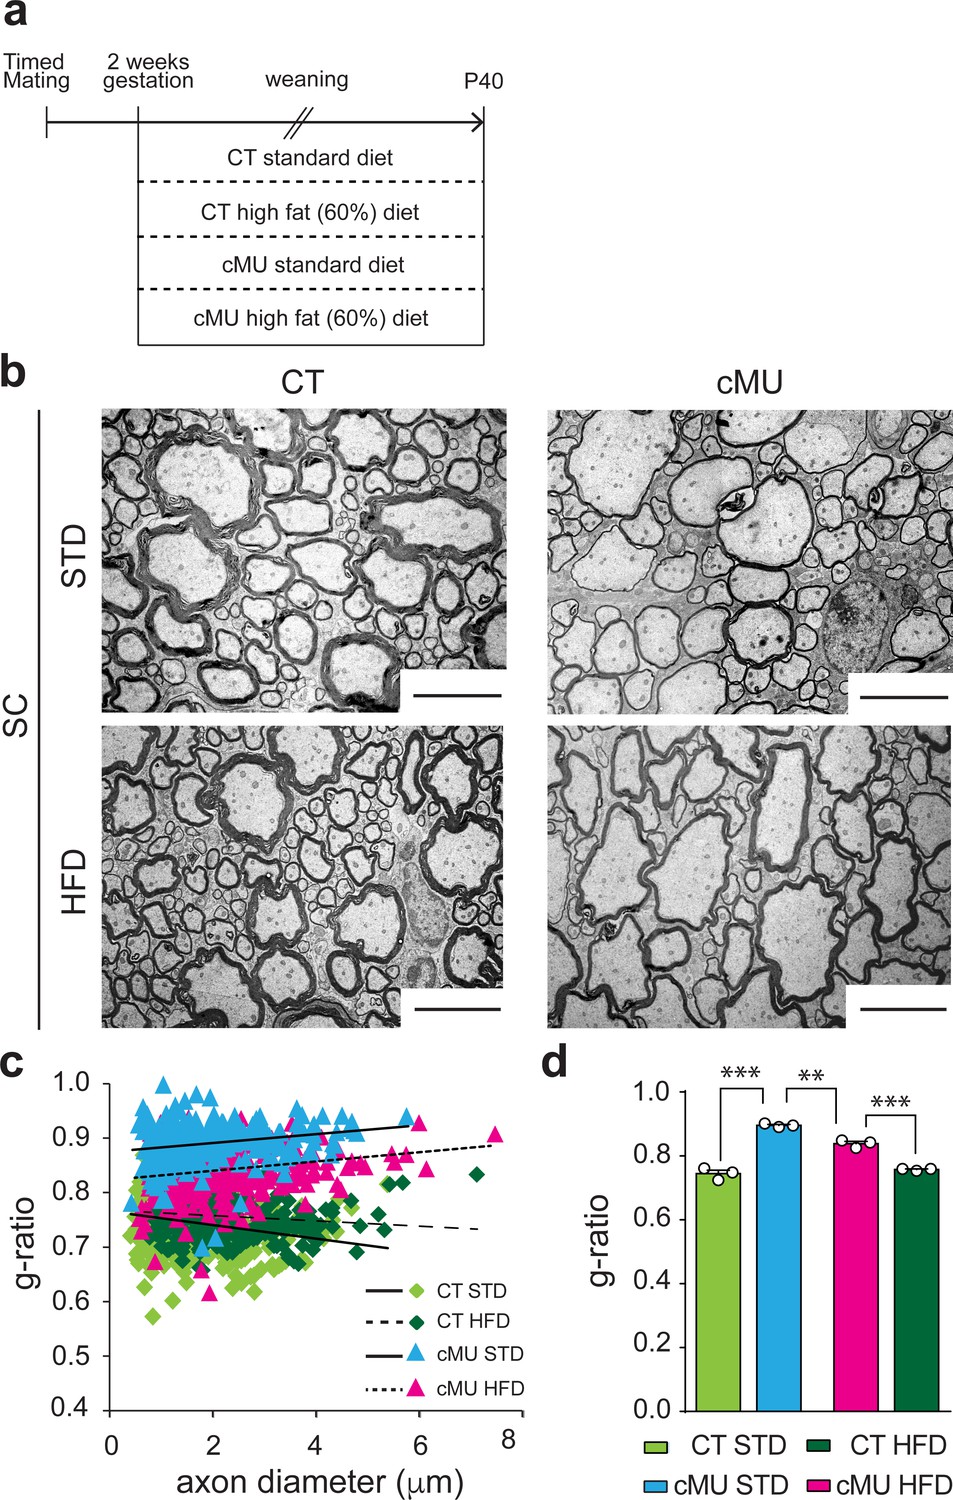
Increasing dietary lipid intake can partially compensate defects in radial myelin growth caused by lack of endogenous fatty acid synthesis in oligodendrocytes.
(a) Scheme of the experimental design. (b) Exemplary EM micrographs of the ventral funiculus of the lumbar spinal cord from mutant (cMU) and control (CT) mice that were fed a standard (STD) or a high-fat (HFD) diet. Scale bars: 5 µm. (c) Linear correlation of g-ratio versus axon diameter. At least 84 myelinated axons analyzed per mouse, in random fields selected in the same anatomical area, from n = 3 mice for each, CT and cMU, STD and HFD. (d) Overall hypomyelination in cMU compared to CT fed STD at P40, and partial recovery of radial myelination in cMU fed with HFD, as shown by g-ratio analysis. Data points represent n = 3 mice for each, CT and cMU, STD and HFD (one-way Anova; Treatment: p<0.0001, F3,8 = 113.2; with Sidak’s multiple comparisons test; cMU STD vs. CT STD: p<0.0001, t = 15.96; cMU HFD vs. CT HFD: p=0.0002, t = 8.597; CT HFD vs CT STD: p=0.7703, t = 1.339; MU HFD vs. MU STD: p=0.0019, t = 6.025), ***p<0.001, **p<0.01. Bars represent mean ±SEM. STD = standard diet, HFD = high fat diet, CT = control, cMU = conditional mutant.
Figure 7 with 1 supplement
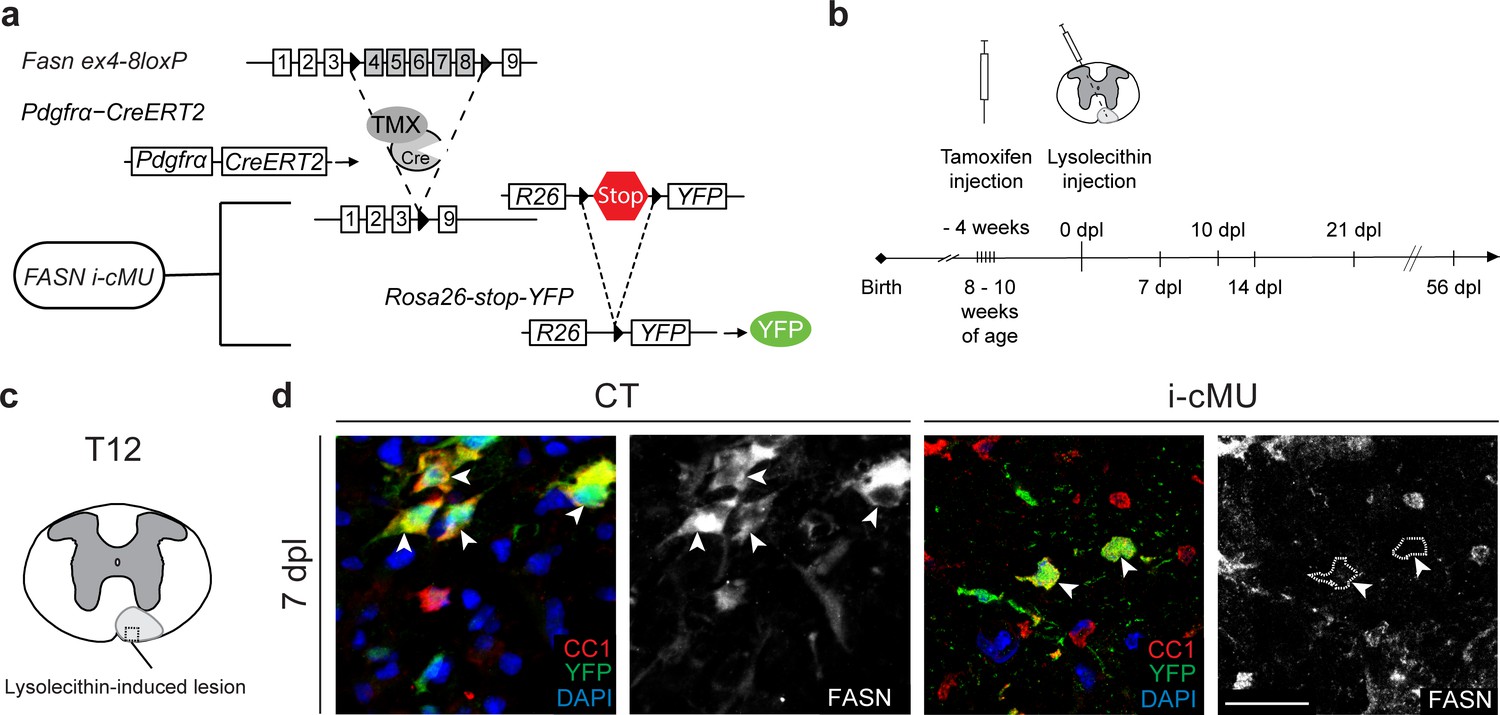
Generation of tamoxifen-inducible PdgfrαCreERT2:FASN-floxed conditionally mutant mice.
(a) Tamoxifen-mediated nuclear translocation of Pdgfrα-driven CreERT2 induces conditional Fasn allele inactivation (i-cMU) and expression of yellow fluorescent protein (YFP). (b) Timeline of de-/re-myelination experiments: Focal demyelination of the ventral spinal cord white matter was induced by injection of lysolecithin 4 weeks post-tamoxifen administration. The tissue was analysed 7, 10, 14, 21 and 56 days post-lysolecithin injection (dpl). (c) Schematic of lysolecithin-induced demyelinated focal lesion in the ventral funiculus of the thoracic spinal cord (level T12). Square insert indicates the area where immunostaining images were acquired. (d) Representative immunostainings of lesioned areas in cross-sectioned thoracic spinal cords from CT and i-cMU mice 7 dpl, n = 3 mice analyzed for each, CT and i-cMU. Note the prominent FASN expression in the cytoplasm of recombined aOPC-derived differentiated OLs (CC1+ YFP+ FASN+, examples indicated by arrowheads) in CT, but not in i-cMU (CC1+ YFP+ FASN-, examples indicated by dotted lines) lesions. Nuclear marker: DAPI. Scale bar: 20 μm, applies to entire panel. CT = control, i-cMU = inducible conditional mutant, dpl = days post-lysolecithin injection.
Figure 7—figure supplement 1
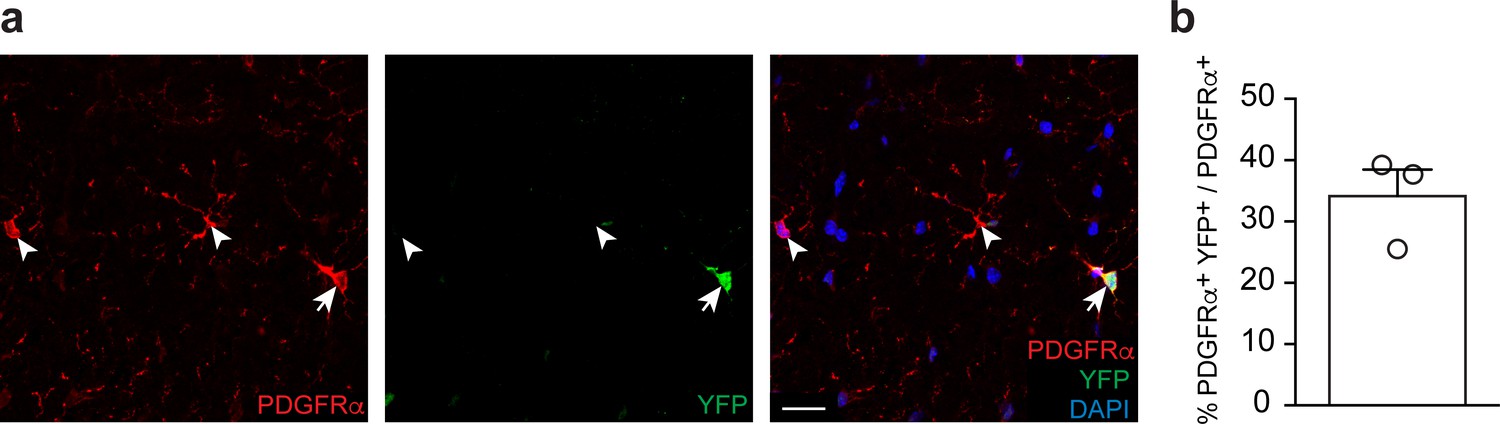
Recombination efficiency in spinal cords of PdgfrαCreERT2:Rosa26-loxPstoploxP-YFP control animals induced with tamoxifen.
(a) Exemplary immunostaining of cross-sectioned thoracic spinal cord white matter from 5 weeks post tamoxifen, n = 3 CT mice. Cre-dependent expression of the reporter Rosa26-loxPstoploxP-YFP allele is detectable in aOPCs (PDGFRα+ YFP+, example indicated by arrow), whereas other aOPCs remain unrecombined (PDGFRα+ YFP-, examples indicated by arrowheads). Nuclear marker: DAPI. Scale bar: 20 μm, applying to entire panel. (b) Corresponding graph to (a) with quantification of percentage of recombined aOPCs (PDGFRα+ YFP+) over total aOPCs (PDGFRα+). Data points represent n = 3 CT mice; 3 spinal cord sections were quantified per animal, with at least 36 PDGFRα+ YFP+ cells quantified per animal. Bar represents mean ± SEM.
Figure 8 with 3 supplements
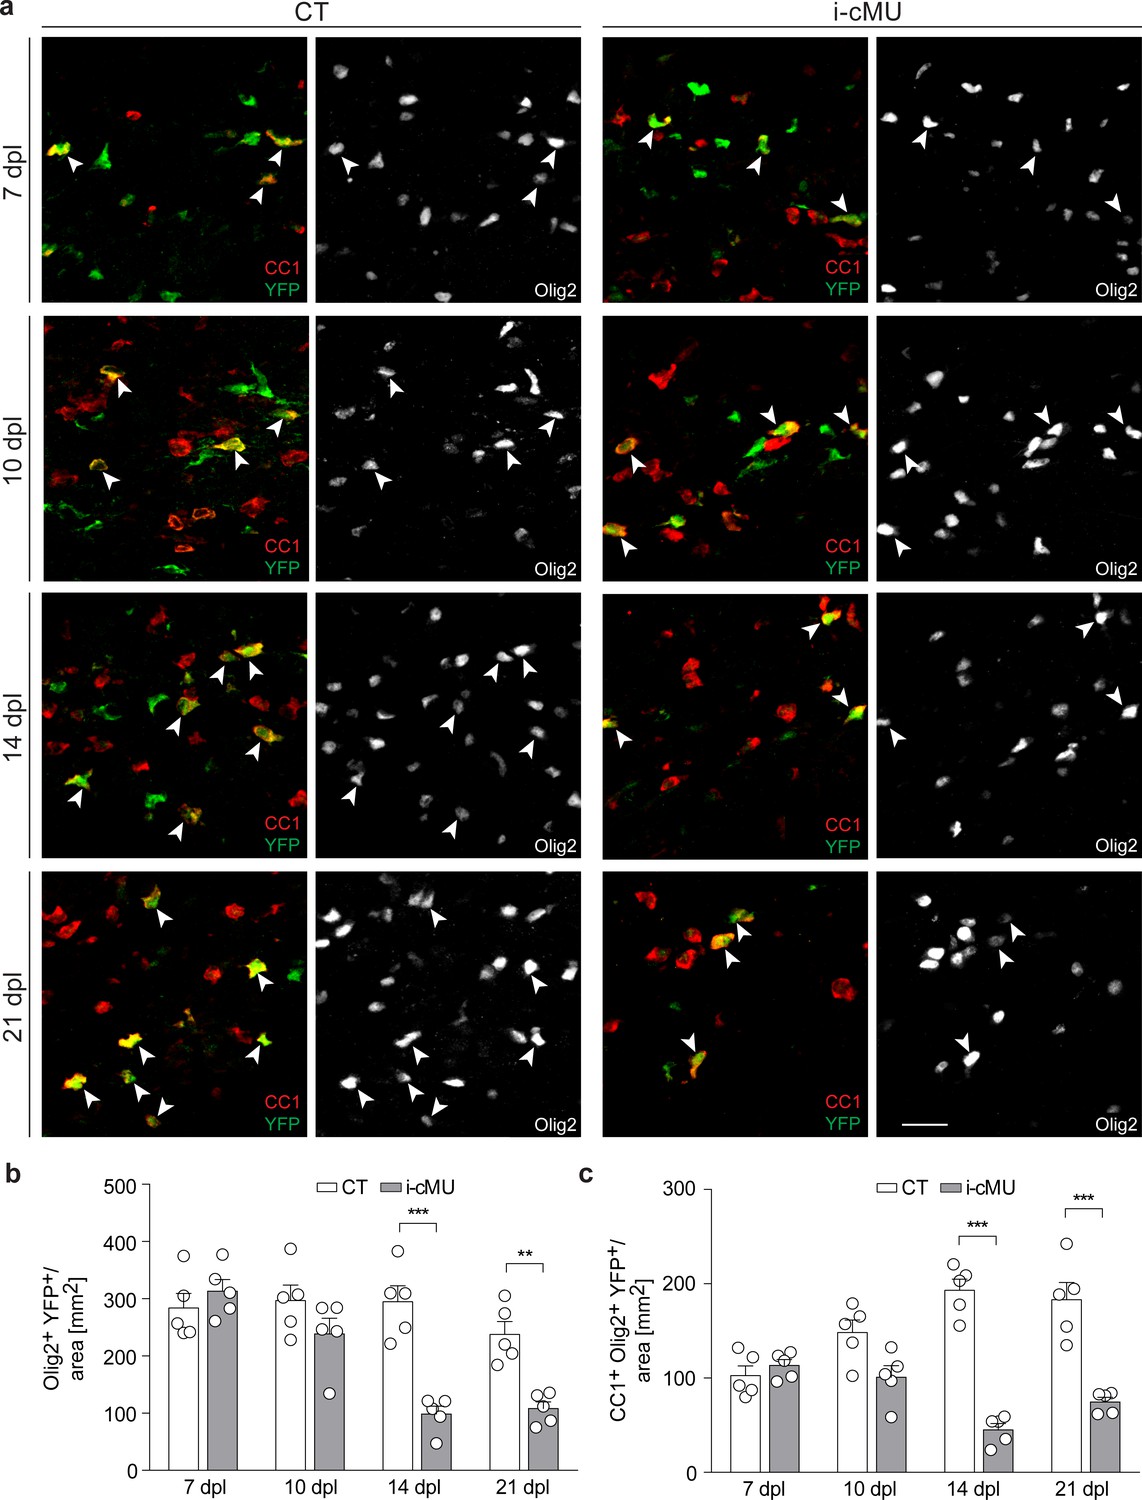
De novo fatty acid synthesis is required for maintaining the adult oligodendrocyte progenitor-derived oligodendrocyte population during remyelination.
(a) Representative immunostaining of lesions of control (CT) and inducible conditional mutant (i-cMU) mice on cross sections of ventral white matter of the spinal cord at 7, 10, 14 and 21 days post-lysolecithin injection (dpl), n = 5 mice for each, CT and i-cMU. Images depict recombined aOPC-derived differentiated OLs (CC1+ Olig2+ YFP+, examples indicated by arrowheads). Scale bar: 20 μm, applies to entire panel. (b, c) Corresponding graphs with quantification of (b) recombined OLs (Olig2+ YFP+) and (c) recombined aOPC-derived differentiated OLs (CC1+ Olig2+ YFP+) in lesion areas of ventral spinal cord white matter of CT and i-cMU mice at 7, 10, 14 and 21 dpl. Data were normalized per area. Data points represent n = 5 mice for each, CT and i-cMU. Lesion areas of at least 4 sections quantified per animal (2-way Anova; (b) Genotype: p<0.0001, F1,32= 30.28; (c) Genotype: p<0.0001, F1,32= 84.52; with Tukey’s multiple comparisons test; (b) 7 dpl: i-cMU vs. CT, p=0.9829; 10 dpl: i-cMU vs. CT, p=0.6132; 14 dpl: i-cMU vs. CT, p<0.0001; 21 dpl: i-cMU vs. CT, p=0.0071; (c) 7 dpl: i-cMU vs. CT, p=0.9971; 10 dpl: i-cMU vs. CT, p=0.0900; 14: i-cMU vs. CT, p<0.0001; 21 dpl: i-cMU vs. CT, p<0.0001), ***p<0.001, **p<0.01. Bars represent mean ± SEM. CT = control, i-cMU = inducible conditional mutant, dpl = days post-lysolecithin injection.
Figure 8—figure supplement 1
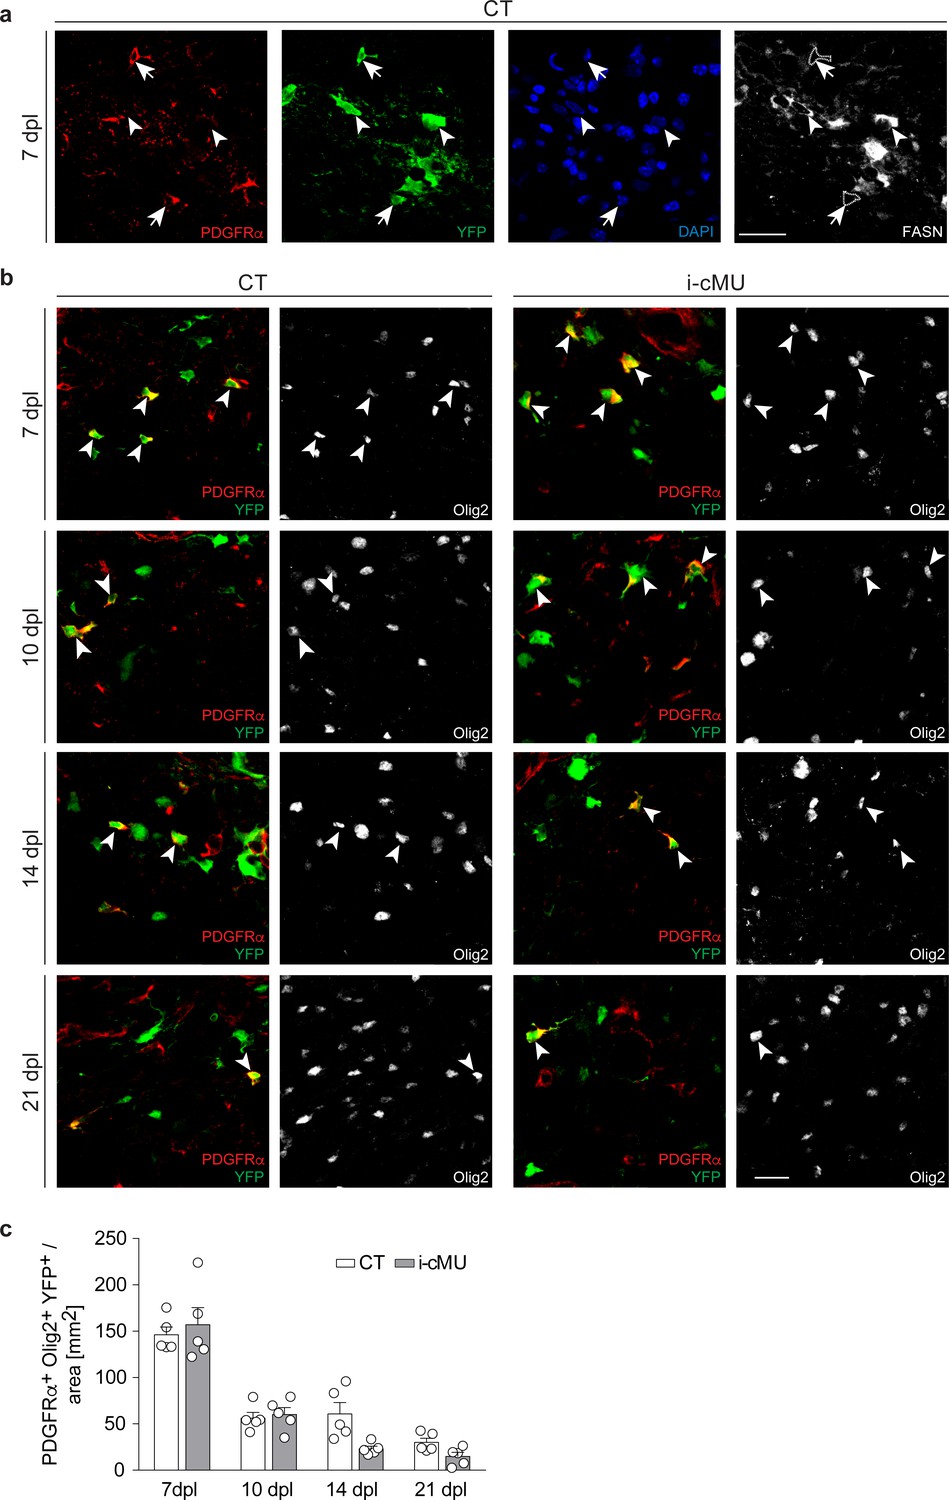
FASN expression in adult oligodendrocyte progenitors is marginal and largely dispensable for their response following demyelination.
(a) Representative immunostaining of the lesion area in cross sections of the spinal cord of induced control (CT) mice at 7 days post-lysolecithin injection (dpl). Images depict marginal expression of FASN in recombined aOPCs (PDGFRα+ YFP+, examples indicated by arrows, FASN- cells outlined) compared to differentiated aOPC-derived OLs (PDGFRα- YFP+, examples indicated by arrowheads). n = 5 analyzed CT mice. Scale bar: 20 μm. (b) Representative immunostainings of the lesion area in cross sections of the spinal cord at 7, 10, 14 and 21 dpl from CT and induced conditional mutant (i-cMU) mice, n = 5 mice for each, CT and i-cMU. Images depict recombined aOPCs (PDGFRα+ Olig2+ YFP+, examples indicated by arrowheads). Scale bar: 20 μm, applies to entire panel. (c) Corresponding graph with quantification of recombined aOPCs (PDGFRα+ Olig2+ YFP+) in the lesion area of CT and i-cMU mice at 7, 10, 14 and 21 dpl. Data were normalized per area. Data points represent n = 5 mice for each, CT and i-cMU. Lesion areas from at least 4 sections quantified per animal (2-way Anova; Genotype: p=0.1589, F1,32= 2.081; with Tukey’s multiple comparisons test; 7 dpl: i-cMU vs. CT, p=0.9907; 10 dpl: i-cMU vs. CT, p>0.9999; 14 dpl: i-cMU vs. CT, p=0.1175; 21 dpl: i-cMU vs. CT, p=0.9420). Bars represent mean ± SEM. CT = control, i-cMU = inducible conditional mutant, dpl = days post lysolecithin injection.
Figure 8—figure supplement 2
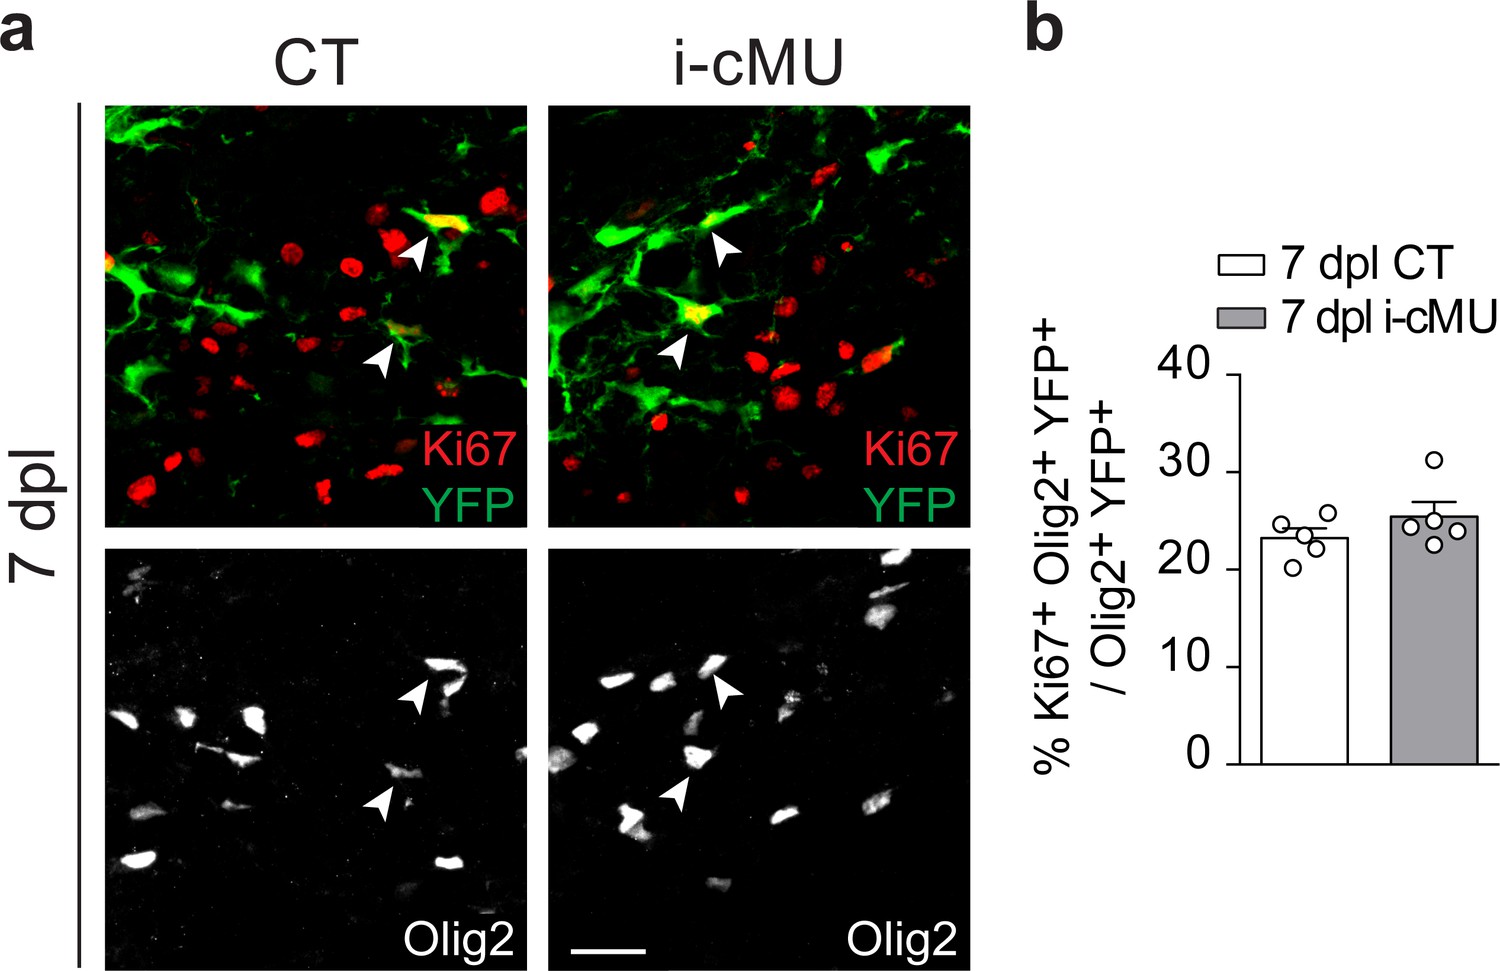
FASN expression is dispensable for the proliferation of oligodendrocytes lineage cells in remyelination.
(a) Representative immunostaining in the lesion area of cross-sectioned thoracic spinal cords of control (CT) and inducible conditional mutant (i-cMU) mice at 7 dpl. n = 5 mice for each, CT and i-cMU. Images depict proliferating recombined OL lineage cells (Ki67+ Olig2+ YFP+, examples indicated by arrowheads). Scale bar: 20 μm, applies to entire panel. (b) Corresponding graph with quantification of the percentage of proliferative recombined OL lineage cells (Ki67+ Olig2+ YFP+) over total recombined OL lineage cells (Olig2+ YFP+) in the lesion area in cross sections of thoracic spinal cords at 7 dpl, from CT and i-cMU mice. Data points represent n = 5 mice for each, CT and i-cMU. Lesion areas from at least 4 sections quantified per animal (unpaired two-tailed two sample Student’s t-test; i-cMU vs. CT: p=0.2636, t = 1.202). Bars represent mean ±SEM. CT = control, i-cMU = inducible conditional mutant, dpl = days post-lysolecithin injection.
Figure 8—figure supplement 3
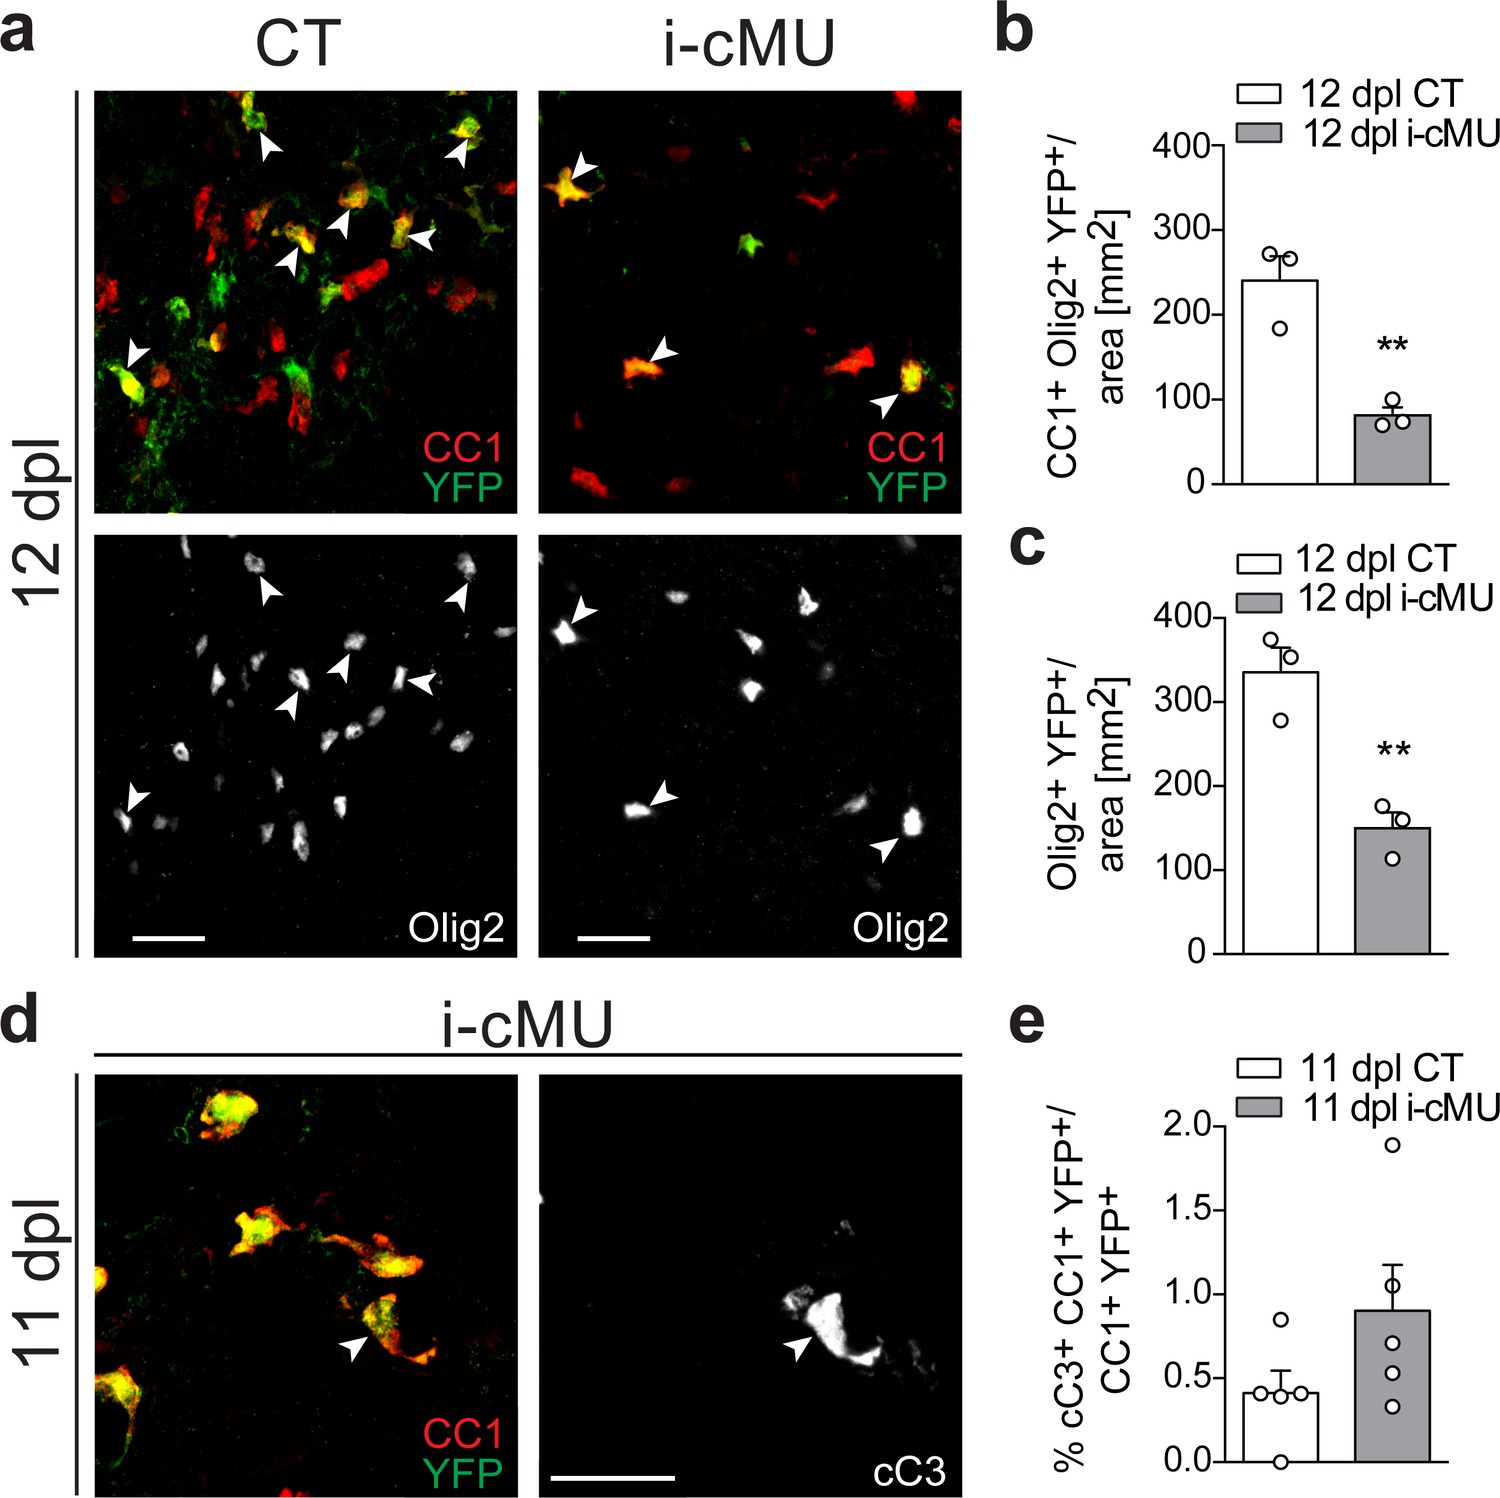
FASN is critical to sustain adult oligodendrocyte progenitor-derived oligodendrocytes during remyelination.
(a) Representative immunostaining of the lesion area in cross sections of the thoracic spinal cord at 12 days post-lysolecithin injection (dpl) from control (CT) and inducible conditional mutant (i-cMU) mice, n = 3 mice for each, CT and i-cMU. Images depict recombined aOPCs-derived differentiated OLs (CC1+ Olig2+ YFP+, examples indicated by arrowheads). Scale bar: 20 μm. (b, c) Corresponding graph with quantification of (b) recombined aOPCs-derived differentiated OLs (CC1+ Olig2+ YFP+) and (c) recombined OL lineage cells (Olig2+ YFP+) in the lesion of CT and i-cMU mice 12 dpl. Data were normalized to the area. Data points represent n = 3 mice for each, CT and i-cMU. Lesion areas of at least 4 sections quantified per animal (unpaired two-tailed two sample Student’s t-test; (b): i-cMU vs. CT, p=0.0060, t = 5.319, (c): i-cMU vs. CT, p=0.0059, t = 5.341), **p<0.01. (d) Exemplary immunostaining of the lesion area in cross sections of the thoracic spinal cord of i-cMU mice at 11 dpl. Images depict an exemplary apoptotic recombined differentiated OL, expressing cleaved caspase 3 (cC3+ CC1+ YFP+, example indicated by arrowhead). Scale bar: 20 μm. (e) Corresponding graph with quantification of the percentage of apoptotic recombined differentiated OLs (cC3+ CC1+ YFP+) over total recombined differentiated OLs (CC1+ YFP+) in the lesion area of CT and i-cMU mice, 11 dpl. Data points represent n = 5 mice for each, CT and i-cMU. At least 14 sections quantified per animal (unpaired two-tailed two sample Student’s t-test; i-cMU vs. CT: p=0.1470, t = 1.606). Bars represent mean ± SEM. CT = control, i-cMU = inducible conditional mutant, cC3 = cleaved caspase 3, dpl = days post-lysolecithin injection.
Figure 9
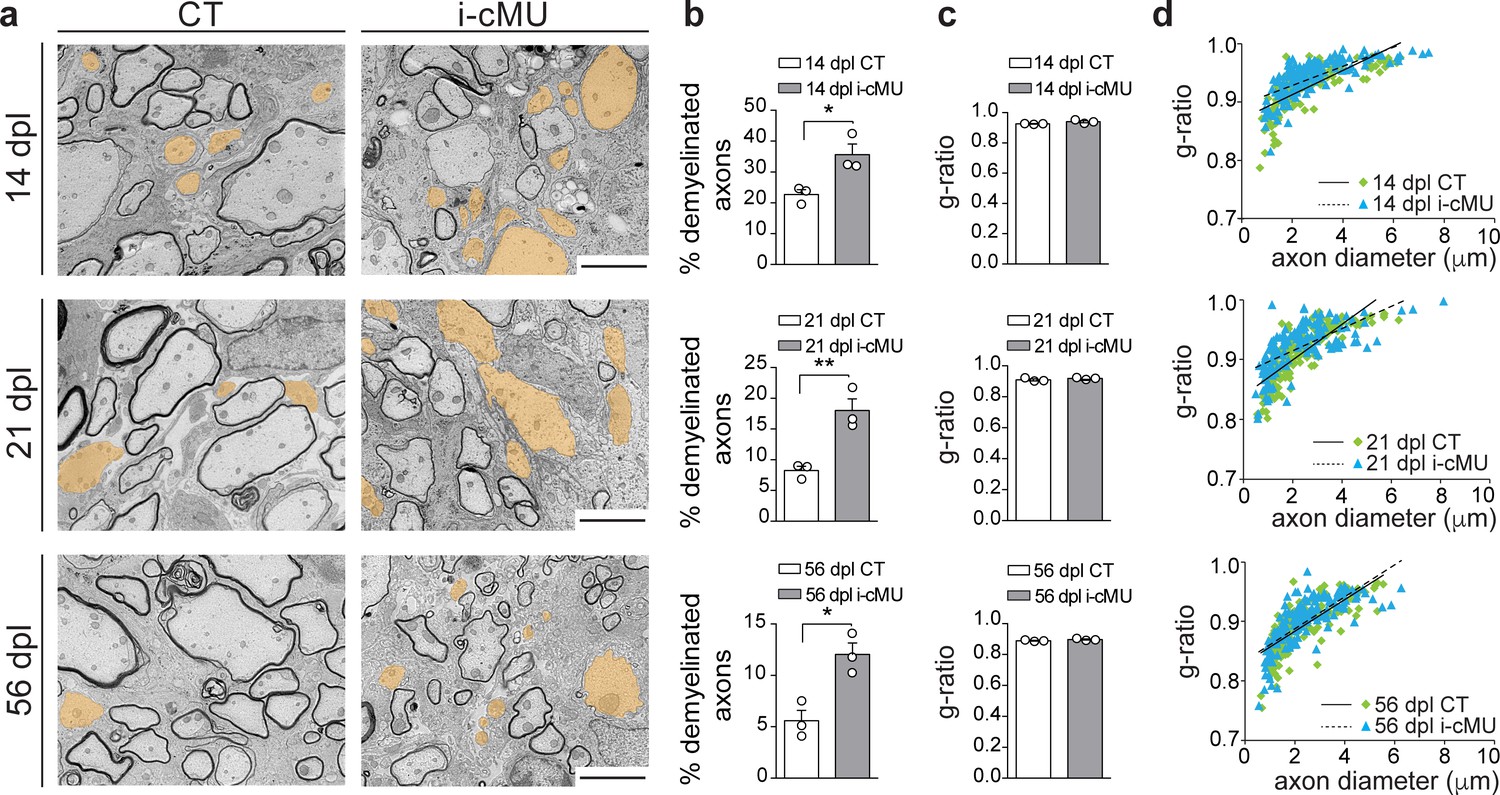
De novo fatty acid synthesis is essential to achieve efficient remyelination in the spinal cord.
(a) Representative EM images of lesions in the spinal cord of control (CT) and inducible conditional mutant (i-cMU) mice during remyelination at 14, 21 and 56 days post-lysolecithin injection (dpl). i-cMUs show persistently increased numbers of demyelinated axons (examples false colored in orange) compared to CTs up to 56 dpl. Scale bars: 3 μm. (b) Corresponding graphs with quantification of percentage of demyelinated axons within the remyelinated lesion area at 14, 21 and 56 dpl. Data points represent n = 3 mice for each, CT and i-cMU. The entire lesion area was quantified, at least 550 axons counted per animal (unpaired two-tailed two sample Student’s t-test; 14 dpl: i-cMU vs. CT, p=0.0263, t = 3.439; 21 dpl: i-cMU vs. CT, p=0.0086, t = 4.803; 56 dpl: i-cMU vs. CT, p=0.0127, t = 4.290), *p<0.05, **p<0.01. (c) g-ratio analysis of remyelinated fibers at 14, 21 and 56 dpl in i-cMU compared to CTs. Data points represent n = 3 mice for each, CT and i-cMU (unpaired two-tailed two sample Student’s t-test; 14 dpl: i-cMU vs. CT, p=0.1146, t = 2.011; 21 dpl: i-cMU vs. CT, p=0.3146, t = 1.149; 56 dpl: i-cMU vs. CT, p=0.1481, t = 1.789). (d) Linear correlation of g-ratio versus axon diameter in remyelinating lesions of i-cMU compared to CT mice, at 14, 21 and 56 dpl. At least 50 myelinated axons per mouse analyzed, n = 3 mice for each, CT and i-cMU. Bars represent mean ± SEM. CT = control, i-cMU = inducible conditional mutant, dpl = days post-lysolecithin injection.
Tables
Key resources table
| Reagent type (species) or resource | Designation | Source or reference | Identifiers | Additional information |
|---|---|---|---|---|
| Genetic reagent (M. musculus) | Fasnlox/lox | PMID:16054078 | MGI:3765070 | Dr. Clay F. Semenkovich, Washington University, St. Louis USA |
| Genetic reagent (M. musculus) | PdgfraCreERT2 | PMID:18849983 | MGI:3832569 | Dr. William D. Richardson, University College London, London UK |
| Genetic reagent (M. musculus) | Olig2Cre | Jackson Laboratory | Stock#:011103; MGI:3810299 | PMID:18691547 |
| Genetic reagent (M. musculus) | Rosa26-loxPstoploxP-YFP | Jackson Laboratory | Stock#:006148; MGI:3621481 | PMID:11299042 |
| Sequence-based reagent | Genotyping primer: Fasn forward | PMID:29434029 | 5'-GGATAGCTGTGTAGTGTAACCAT-3’ | |
| Sequence-based reagent | Genotyping primer: Fasn reverse | PMID:29434029 | 5’-GGTCACCCAGCAGGAAAGGGC- 3’ | |
| Sequence-based reagent | Genotyping primer: Cre forward | PMID: 29434029 | 5’-TTCCCGCAGAACCTGAAGATGTTCG-3’ | |
| Sequence-based reagent | Genotyping primer: Cre reverse | PMID: 29434029 | 5’-GGGTGTTATAAGCAATCCCCAGAAATG-3’ | |
| Sequence-based reagent | Genotyping primer: Rosa26-loxPstoploxP-YFP forward | PMID: 28522536 | 5’-AAAGTCGCTCTGAGTTGTTAT-3’ | |
| Sequence-based reagent | Genotyping primer: Rosa26-loxPstoploxP-YFP reverse transgenic | PMID: 28522536 | 5’-GCGAAGAGTTTGTCCTCAACC-3’ | |
| Sequence-based reagent | Genotyping primer: Rosa26-loxPstoploxP-YFP reverse wildtype | PMID: 28522536 | 5’-GGAGCGGGAGAAATGGATATG-3’ | |
| Sequence- based reagent | qRT-PCR primer: SOX10 Forward | This paper | 5’-CCGACCAGTACCCTCACCT-3’ | |
| Sequence-based reagent | qRT-PCR primer: SOX10 Reverse | This paper | 5’- TCAATGAAGGGGCGCTTGT-3’ | |
| Sequence-based reagent | qRT-PCR primer: MYRF Forward | This paper | 5’-ATGGAGGTGGTGGACGAGAC-3’ | |
| Sequence-based reagent | qRT-PCR primer:MYRF Reverse | This paper | 5’-GGCGTCCTCTTTGCCAATGT-3’ | |
| Sequence- based reagent | qRT-PCR primer: MBP Forward | This paper | 5’-ACACGAGAACTACCCATTATGGC-3’ | |
| Sequence- based reagent | qRT-PCR primer: MBP Reverse | This paper | 5’-CCAGCTAAATCTGCTGAGGGGA-3’ | |
| Sequence- based reagent | qRT-PCR primer: Actin Forward | PMID: 28880149 | 5’-GTCCACACCCGCCACC-3’ | |
| Sequence- based reagent | qRT-PCR primer: Actin Reverse | PMID: 28880149 | 5’-GGCCTCGTCACCCACATAG-3’ | |
| Antibody | Rabbit polyclonal anti-cleaved Caspase 3 | Cell signaling Technology, Danvers, MA, USA | Cat# 9661; RRID:AB_2341188 | 1:500 dilution |
| Antibody | Mouse monoclonal anti-CC1 | Merck Millipore, Billerica, MA, USA | Cat; # OP80; RRID:AB_2057371 | Development: 1:200 dilution; Remyelination 1:300 dilution |
| Antibody | rabbit polyclonal anti-FASN | Abcam, UK | Cat# Ab22759; RRID:AB_732316 | 1:200 dilution |
| Antibody | Chicken polyclonal anti-GFP | Abcam, UK | Cat# Ab13970; RRID:AB_300798 | 1:1000 dilution |
| Antibody | mouse monoclonal anti-ki67 | Dako Agilent, Santa Clara, CA, USA | Cat# m7249; clone MIB-5; RRID:AB_2250503 | 1:200 dilution |
| Antibody | rat monoclonal anti-MBP | Serotec/BioRad Laboratories, Hercules, CA, USA | Cat# MCA409S; RRID:AB_325004 | Development: 1:200 dilution; Remyelination 1:300 dilution |
| Antibody | Goat polyclonal anti-Olig2 | R and D Systems, Minneapolis, MN, USA | Cat# AF2418; RRID:AB_2157554 | 1:25 dilution |
| Antibody | mouse monoclonal anti-Olig2 | Merck Millipore, Billerica, MA, USA | Cat# MABN50; clone 211F1.1; RRID:AB_10807410 | 1:1000 dilution |
| Antibody | rabbit polyclonal anti-Olig2 | Merck Millipore, Billerica, MA, USA | Cat# AB9610; RRID:AB_570666 | Development: 1:500 dilution; Remyelination 1:400 dilution |
| Antibody | Rabbit monoclonal anti-PDGFRα | Cell signaling Technology, Danvers, MA, USA | Cat# 3174; RRID:AB_2162345 | 1:500 dilution |
| Commercial assay or kit | Click-iT EdU Assay | Thermo Fisher Scientific, Waltham, MA, USA | Cat# C10337 | |
| Commercial assay or kit | Mouse blocking reagent | Vector Laboratories, Burlingame, CA, USA | Cat# MKB-2213 | |
| Commercial assay or kit | Streptavidin/Biotin blocking Kit | Vector Laboratories, Burlingame, CA, USA | Cat# SP-2002 | |
| Commercial assay or kit | Qiagen MiniKit (RNeasy Mini Kit) | Qiagen, Hilden, Germany | Cat# 74104 | |
| Commercial assay or kit | TruSeq Stranded mRNA Sample Prep Kit | Illumina, San Diego, CA, USA | Cat# 20020594 | |
| Commercial assay or kit | Maxima RT-Kit | Thermo Fisher Scientific, Waltham, MA, USA | Cat# K1641 | |
| Chemical compound, drug | Lysolecithin | Sigma-Aldrich, Sant Louis, MO, USA | Cat# L4129 | |
| Chemical compound, drug | Tamoxifen | Sigma-Aldrich, Sant Louis, MO, USA | Cat# T5648 | |
| Chemical compound, drug | Lipid standards | Avanti Polar Lipids, Alabaster, AL, USA | ||
| Software, algorithm | Lipid Data Analyzer software | PMID: 29058722 | ||
| Software, algorithm | Photoshop CS5 or CS6 | Adobe | ||
| Software, algorithm | FIJI | ImageJ (http://imagej.nih.gov/ij/) | ||
| Software, algorithm | STAR Aligner(v2.5.1b) | PMID: 23104886 | ||
| Software, algorithm | RSEM (v1.2.22) | PMID: 21816040 | ||
| Software, algorithm | EdgeR | PMID: 19910308 | ||
| Software, algorithm | Metacore (vs6.33) | Thomson Reuters | ||
| Other | Standard diet (STD) | KLIBA NAFAG, Provimi KLIBA, Switzerland | Cat# 3437 | |
| Other | High fat diet (HFD) | KLIBA NAFAG, Provimi KLIBA, Switzerland | Cat# 2127 |
Additional files
-
Transparent reporting form
- https://doi.org/10.7554/eLife.44702.025
Download links
A two-part list of links to download the article, or parts of the article, in various formats.
Downloads (link to download the article as PDF)
Open citations (links to open the citations from this article in various online reference manager services)
Cite this article (links to download the citations from this article in formats compatible with various reference manager tools)
CNS myelination and remyelination depend on fatty acid synthesis by oligodendrocytes
eLife 8:e44702.
https://doi.org/10.7554/eLife.44702


