The transcription factor Hey and nuclear lamins specify and maintain cell identity
- Technion-Israel Institute of Technology, Israel
- Foundation for Research and Technology - Hellas (FORTH), Greece
- University of Würzburg, Germany
- Fred Hutchinson Cancer Research Center, United States
Figures
Figure 1 with 3 supplements
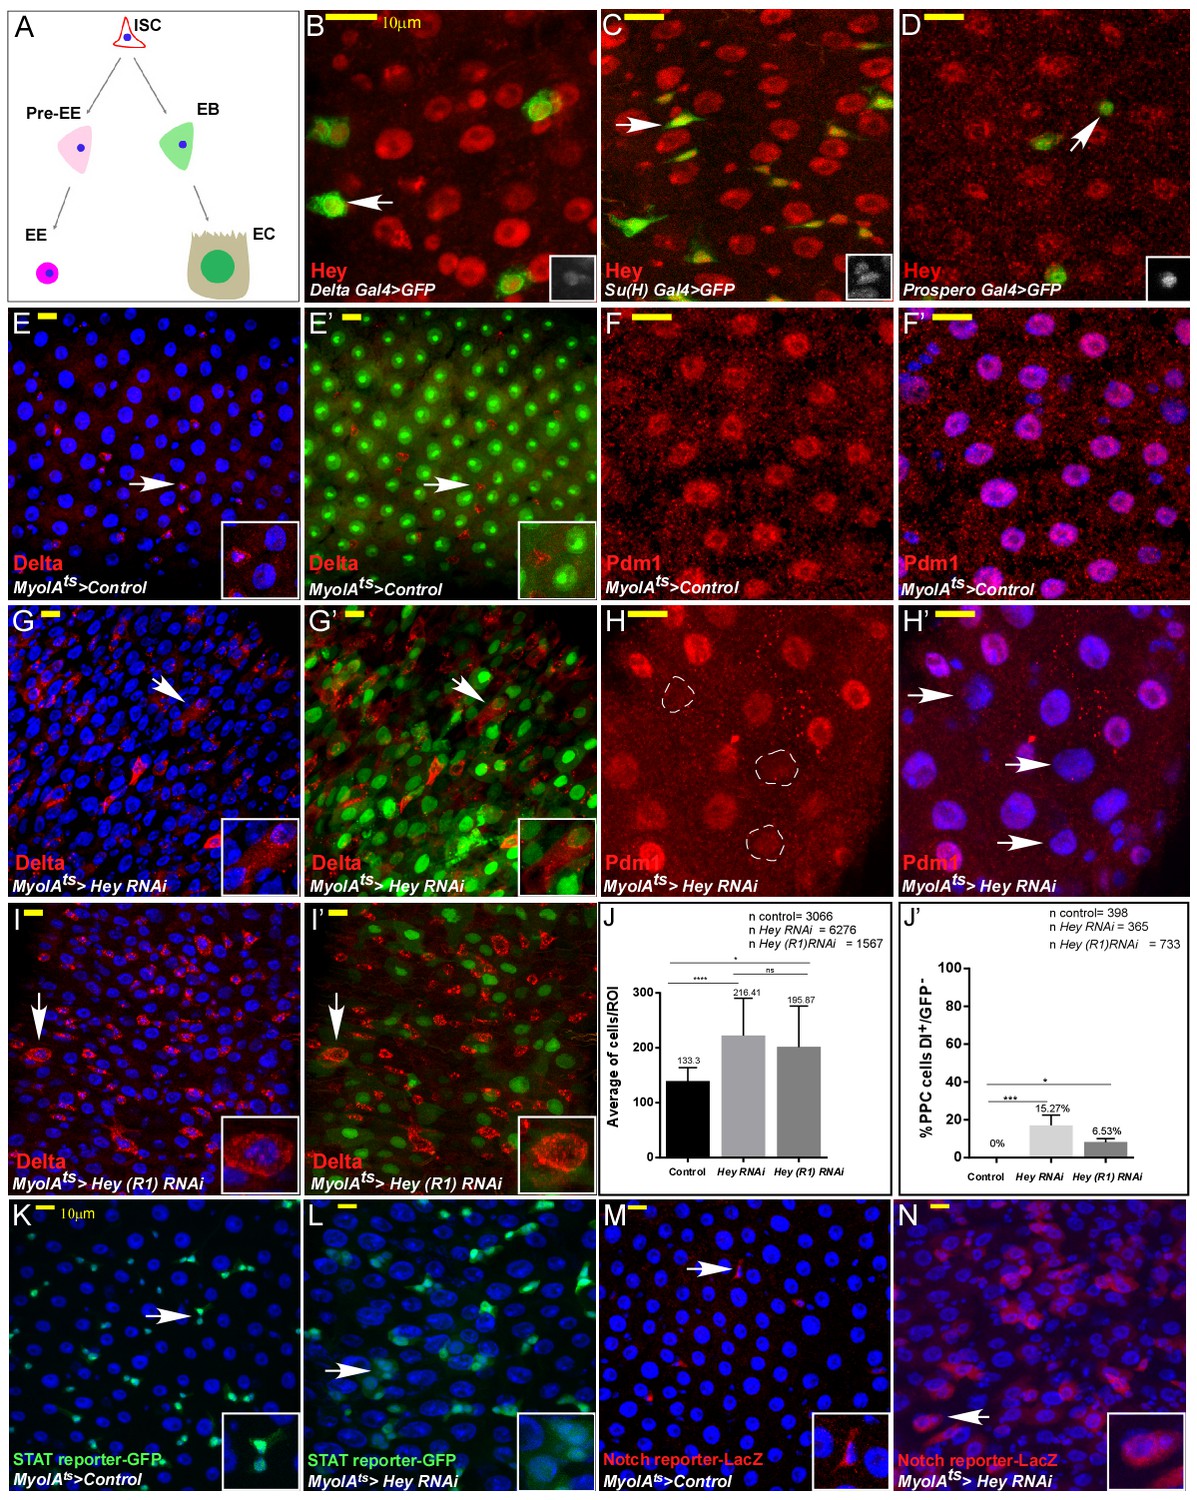
Drosophila Hey is required for maintaining EC identity.
(A) Schematic diagram of major Drosophila midgut cell types. ISC, intestinal stem cell; EB, enteroblast; EC, enterocyte; Pre-EE, enteroendocrine progenitor, EE enteroendocrine cell. (B–I’) Confocal images of adult Drosophila midgut intestinal epithelium expressing the indicated transgenes, scale bar is 10 μm. Arrows indicate cells shown in insets. (B–D) Endogenous Hey protein was identified using an α-Hey antibody (red). The expression of UAS-GFP under the control of Delta-Gal4 (B), Su(H)-Gal4 (C), and prospero-Gal4 (D) mark ISCs, EBs, and EEs, respectively. (E–I’) Confocal images of control cells (E–F’) or midguts in which Hey was targeted for 48 hr in ECs using the indicated RNAi transgenic lines (G–I’). α-Delta (red E-E’ G-G’ I-I’), MyoIAts80 >GFP (green) and anti-PDM1(red, (F, F’, H, H’) mark differentiated ECs; DAPI marks DNA (blue). White dashed circles in (H) are Pdm1-negative polyploid cells indicated in H’ by white arrows. (J, J’) Quantification of total cell number per region of interest (J), and polyploid cells that express Delta and are GFP negative in experimental setting similar to G, G’ and I, I’;(J') ****p<0.0001, ***p<0.001, *p<0.05. (K–N) Hey depletion for 48 hr in ECs results in activation of stress and regeneration pathways; ectopic activation of JAK-STAT reporter (K, L) (10XSTAT::GFP reporter, GFP) and Notch pathway reporter in polyploid cells (M, N) (ghd3::LacZ reporter; RFP). White arrows point to cells shown in the inset.
-
Figure 1—source data 1
Quantification of average number off cells in control and guts where Hey is targeted in EC data related to Figure 1.
Quantification data related to Figure 1J – Average number of cells per ROI. Quantification data related to Figure 1J' –number of PPC Dl(+)GFP(-).
- https://doi.org/10.7554/eLife.44745.007
Figure 1—figure supplement 1
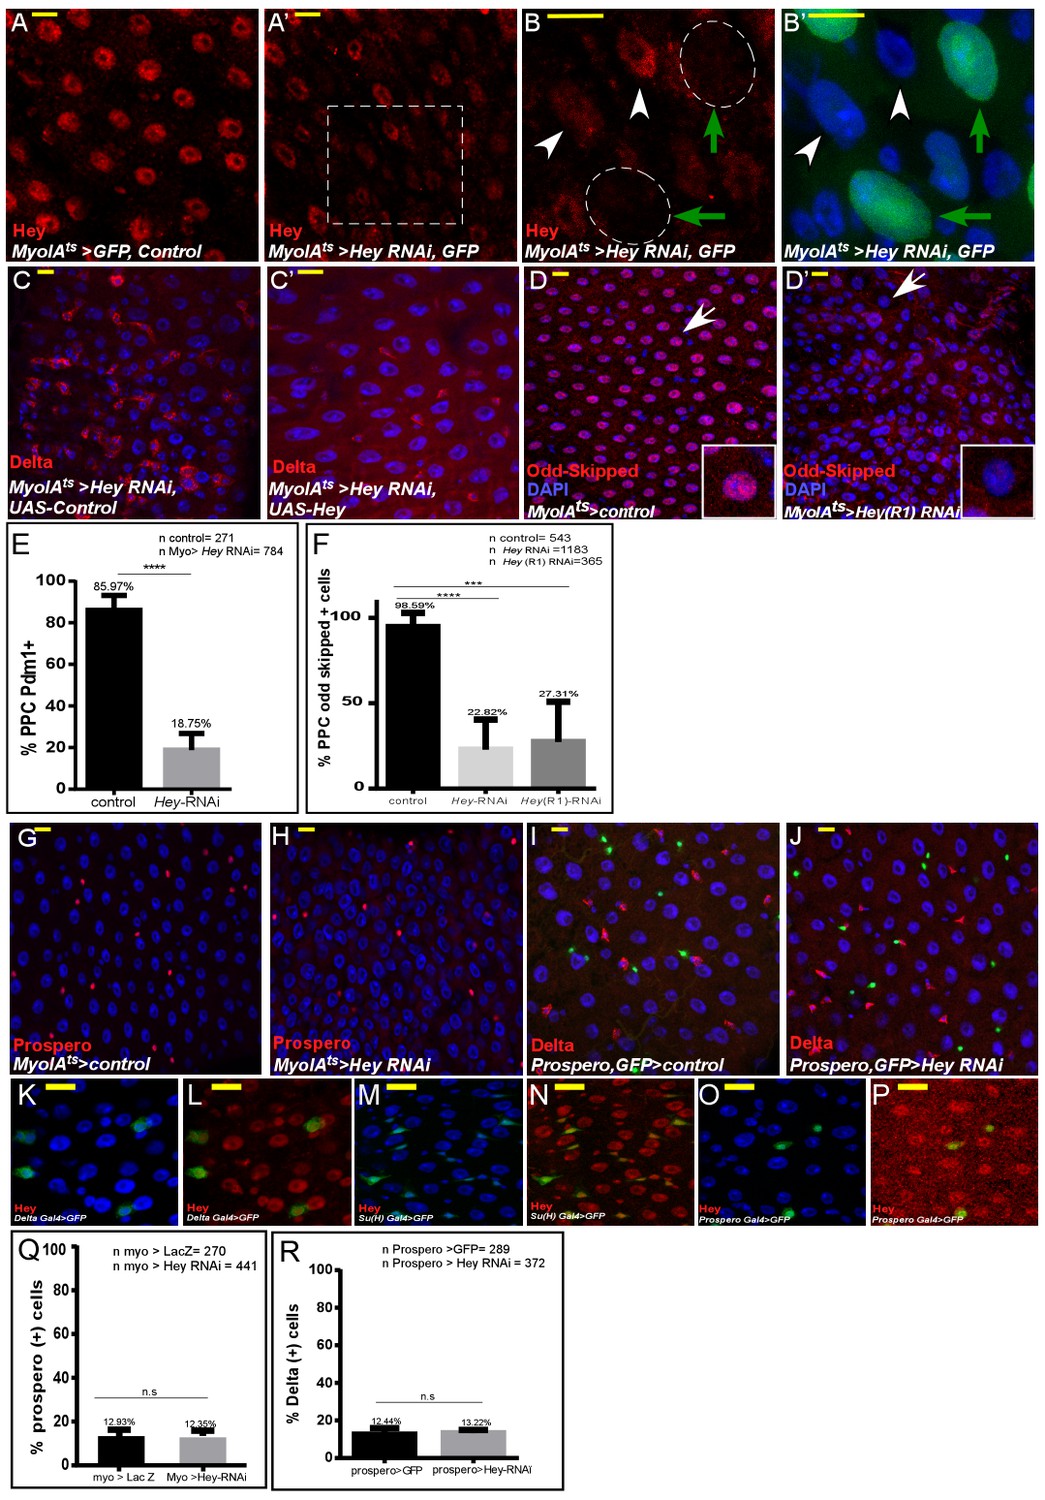
Analysis of Hey targeted ECs and EEs.
(A–E) Confocal images of the midgut intestinal epithelium of adult Drosophila using the indicated antibodies. DAPI (blue) marks DNA and scale bar is 10 μm. (A–B’) Hey protein detected by α-Hey antibody (red) in control (A) and UAS-Hey-RNAi-targeted gut (A’). The dashed square in A’ is magnified in B and B’. RNAi was activated for 48 hr (B, B’) MyoIAts-expressing cells, green; Hey, red. Green arrows indicate cells shown in B’. (C, C’) MyoIAts-derived co-expression of UAS-Hey for 48 hr (C’), but not control (C), along with UAS-Hey-RNAi suppresses the ectopic expression of Delta (red) and restores overall gut morphology. (D–D’) Targeting Hey in ECs using J11194R1 UAS-Hey RNAi line (D’), but not control (D), results in cellular hyperplasia and reduced Odd-skipped expression. (E) Quantification pf PDM protein level in PPCs upon RNAi dependent knockdown of Hey in ECs (F) Quantification of Odd protein level in PPCs upon RNAi dependent knockdown of Hey in ECs. (G–J) Targeting Hey in ECs for 48 hr (G, H) did not impact EE identity. EE cells are identified using an α-Prospero antibody. (I, J) Targeting Hey in EEs did not alter Delta expression or gut morphology; GFP marks prospero-Gal4 activity in EEs, and Delta is shown in red. (K–P) expression of endogenous Hey protein (red) relative to DAPI that marks all gut cells and cell-specific markers as indicated, complementing Figure 1.(Q, R) Quantification of the number of Prospero positive cells (indicative of EEs) in experimental setting similar to G-J respectively.
-
Figure 1—figure supplement 1—source data 1
Quantification data related to Figure 1—figure supplement 1.
Quantification data related to Figure 1—figure supplement 1E E - number of PPC Pdm1(+). Quantification data related to Figure 1—figure supplement 1E F - number of PPC Oddskiped(+). Quantification data related to Figure 1—figure supplement 1E Q - number of Prospero (+) cells. Quantification data related to Figure 1—figure supplement 1E R - number of Dl (+) cells.
- https://doi.org/10.7554/eLife.44745.004
Figure 1—figure supplement 2
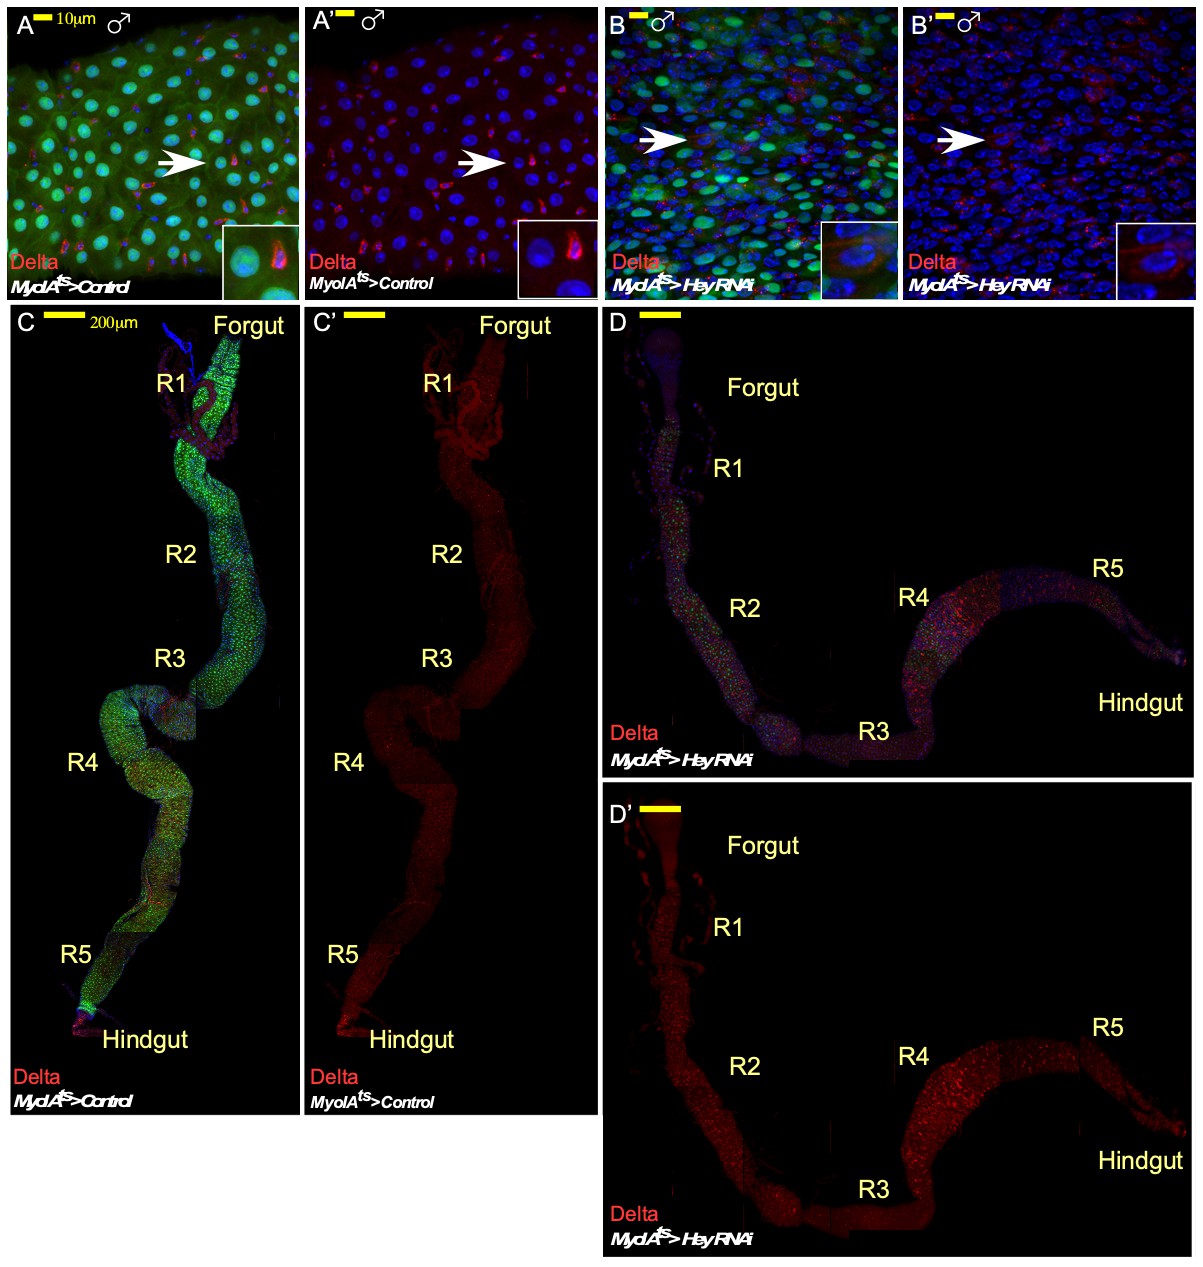
Impact of RNAi-dependent loss of Hey in males and on the entire gut in females.
Confocal images of adult Drosophila midgut intestinal epithelium expressing the indicated transgenes, Confocal images of control cells (A, A’, C, C’) or midguts in which Hey was targeted for 48 hr in ECs using the indicated RNAi transgenic lines (B, B’, D, D’). α-Delta (red, MyoIAts80 >GFP (green) DAPI (blue) marks DNA. (A–B’) Targeting experiment performed in males. (C–D’) wide view of RNAi-dependent Hey knockdown experiments in females showing the entire gut with indication of its anatomical sub-regions.
Figure 1—figure supplement 3

The effects on EC identity upon RNAi-dependent targeting of Notch, Su(H), HES transcription factors, and related cofactors.
(A–L) Confocal images of midgut intestinal epithelium of adult Drosophila derived from the indicated transgenic lines (for 48 hr) and antibodies. In all cases MyoIAts was used to drive the expression of the indicated UAS-RNAi transgene and MyoIAts > UAS GFP marks fully differentiated ECs. DRAQ5 (blue) marks DNA, the ISC marker Delta is red. Other antibodies used are indicated. Scale bar is 10 μm.
Figure 2 with 1 supplement
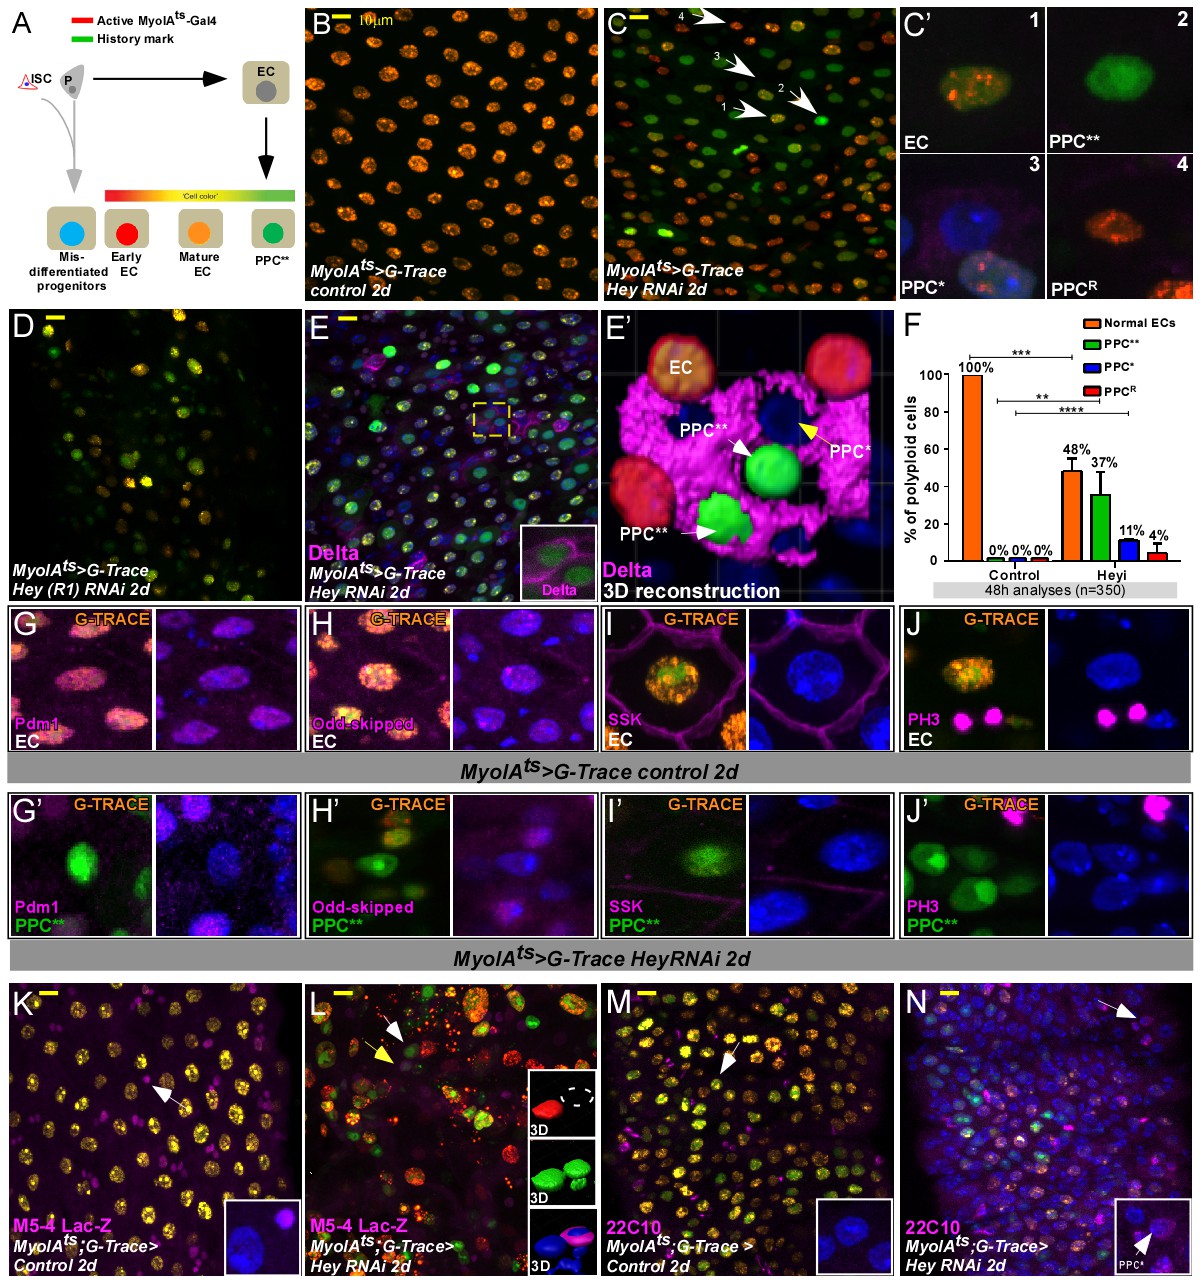
Gut analyses using G-TRACE lineage tracing of ECs.
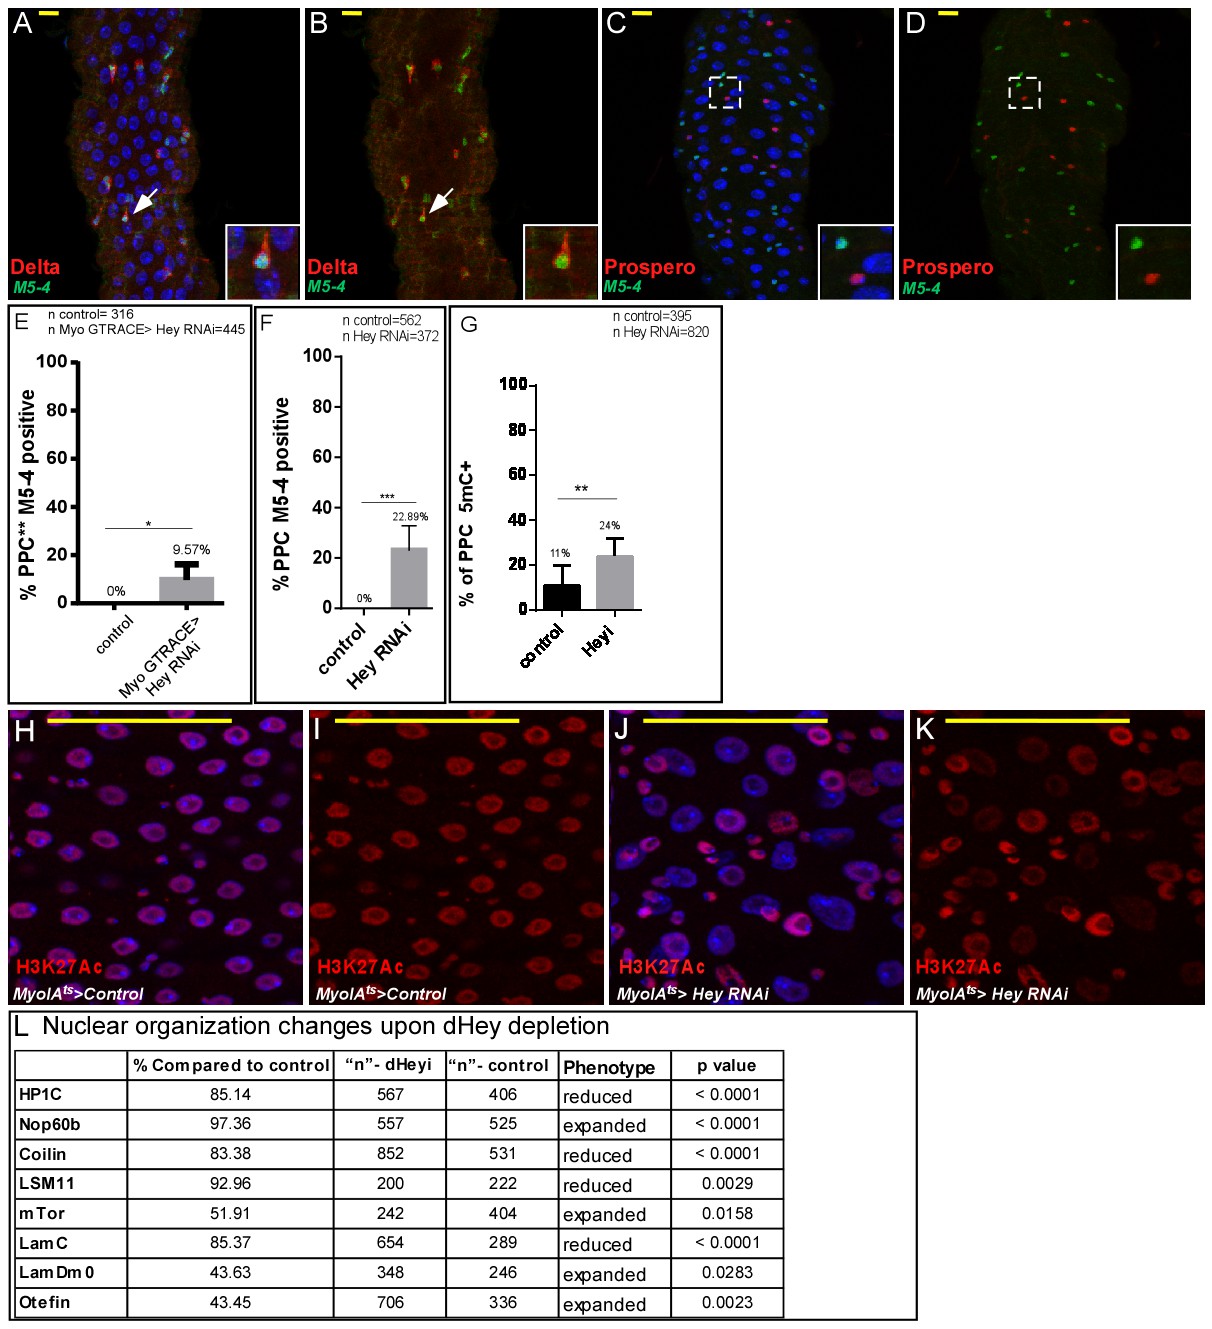
(A) Illustration of G-TRACE lineage tracing (adopted from Evans et al., 2009). (B–E’) Confocal images of G-TRACE analyses of control (B) and Hey-targeted ECs (C–E’). (B) All ECs in control guts co-express MyoIA-Gal4 >UAS RFP, and the history marker Ub::GFP, and are denoted in orange [GFP (+) RFP (+)]. (C–D) A heterogeneous population of polyploid cells is observed in midguts in which Hey is targeted in ECs for 48 hr using the indicated Hey-RNAi transgenic lines. Numbered white arrows in C point to cells shown in C’: Differentiated ECs (C’1, GFP(+), RFP(+)); PPC**, C’2, GFP(+)RFP(-)); PPC*, C’3, GFP(-) RFP(-)); Enterocytes in which GFP-activating recombination has not taken place (PPCR C’4, GFP(-)RFP(+)). DAPI marks DNA (blue). (E, E’) PPC* and PPC** ectopically express Delta. (E’) IMARIS-assisted 3D reconstruction of the area indicated in E by a yellow square. A PPC** is indicated by a white arrow in E’ and is shown in the inset of E. (F) G-TRACE-based quantification of polyploid cells after 48 hr; four independent biological repeats (n = 350, results shown are mean ± SD). (G–J’) G-TRACE-analyses of ECs (G, H, I, J) and PPC** (G’ H’ I’ J’). The indicated protein is shown in pink; (G, G’), Pdm1; (H, H’), Odd-skipped; (I, I’), SSK; (J J’) p-Histone-H3. DAPI marks DNA (blue). (K–N) Expression of the escargot progenitor enhancer reporter M5-4-LacZ (K, L) and neuronal marker 22C10 (M, N) in control or Hey-targeted ECs analyzed by G-TRACE, and see quantification Figure 4—figure supplement 3E.
-
Figure 2—source data 1
Quantification data related to Figure 2F- % of PPC (EC/PPC**/PPC*/PPCR).
- https://doi.org/10.7554/eLife.44745.011
Figure 2—figure supplement 1
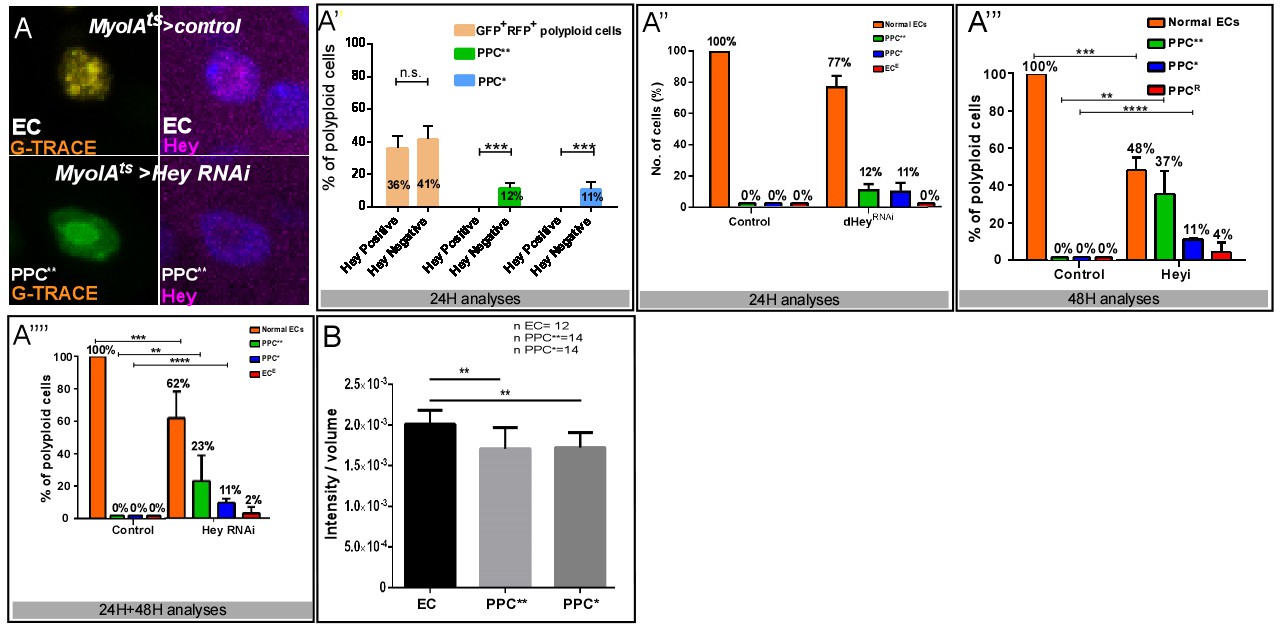
Dynamic G-TRACE and ploidy analysis: (A–A””) Analysis of endogenous Hey levels in control or Hey-targeted ECs using G-TRACE.
(A) Examples of Hey protein level in EC and PPC**. Panels show cellular state according to G-TRACE (left) and Hey protein level (magenta) (right). (A’). Imaris-based quantification of Hey protein levels in PPCs using G-TRACE 24 hr after RNAi induction (n = 120, p<0.001). Loss of identity is a dynamic process: Hey protein was not detected in any PPC** and PPC* or in 41% of PPCGFP(+), RFP(+) cells. (A”, A”’) Overall composition of PPCs using G-TRACE 24 and 48 hr after RNAi activation respectively. (A””) overall composition of PPC using G-TRACE (sum of 24 hr and 48 hr). (B) Indirect quantification of DNA ploidy in control and PPC** and PPC* using IMARIS software (**p<0.01).
-
Figure 2—figure supplement 1—source data 1
Quantification data related to Figure 2—figure supplement 1.
Quantification data related to Figure 2—figure supplement 1A' – A’”, % of PPC (EC, PPC**, PPC*, PPCR). Quantification data related to Figure 2—figure supplement 1B - Intensity/volume.
- https://doi.org/10.7554/eLife.44745.010
Figure 3 with 4 supplements
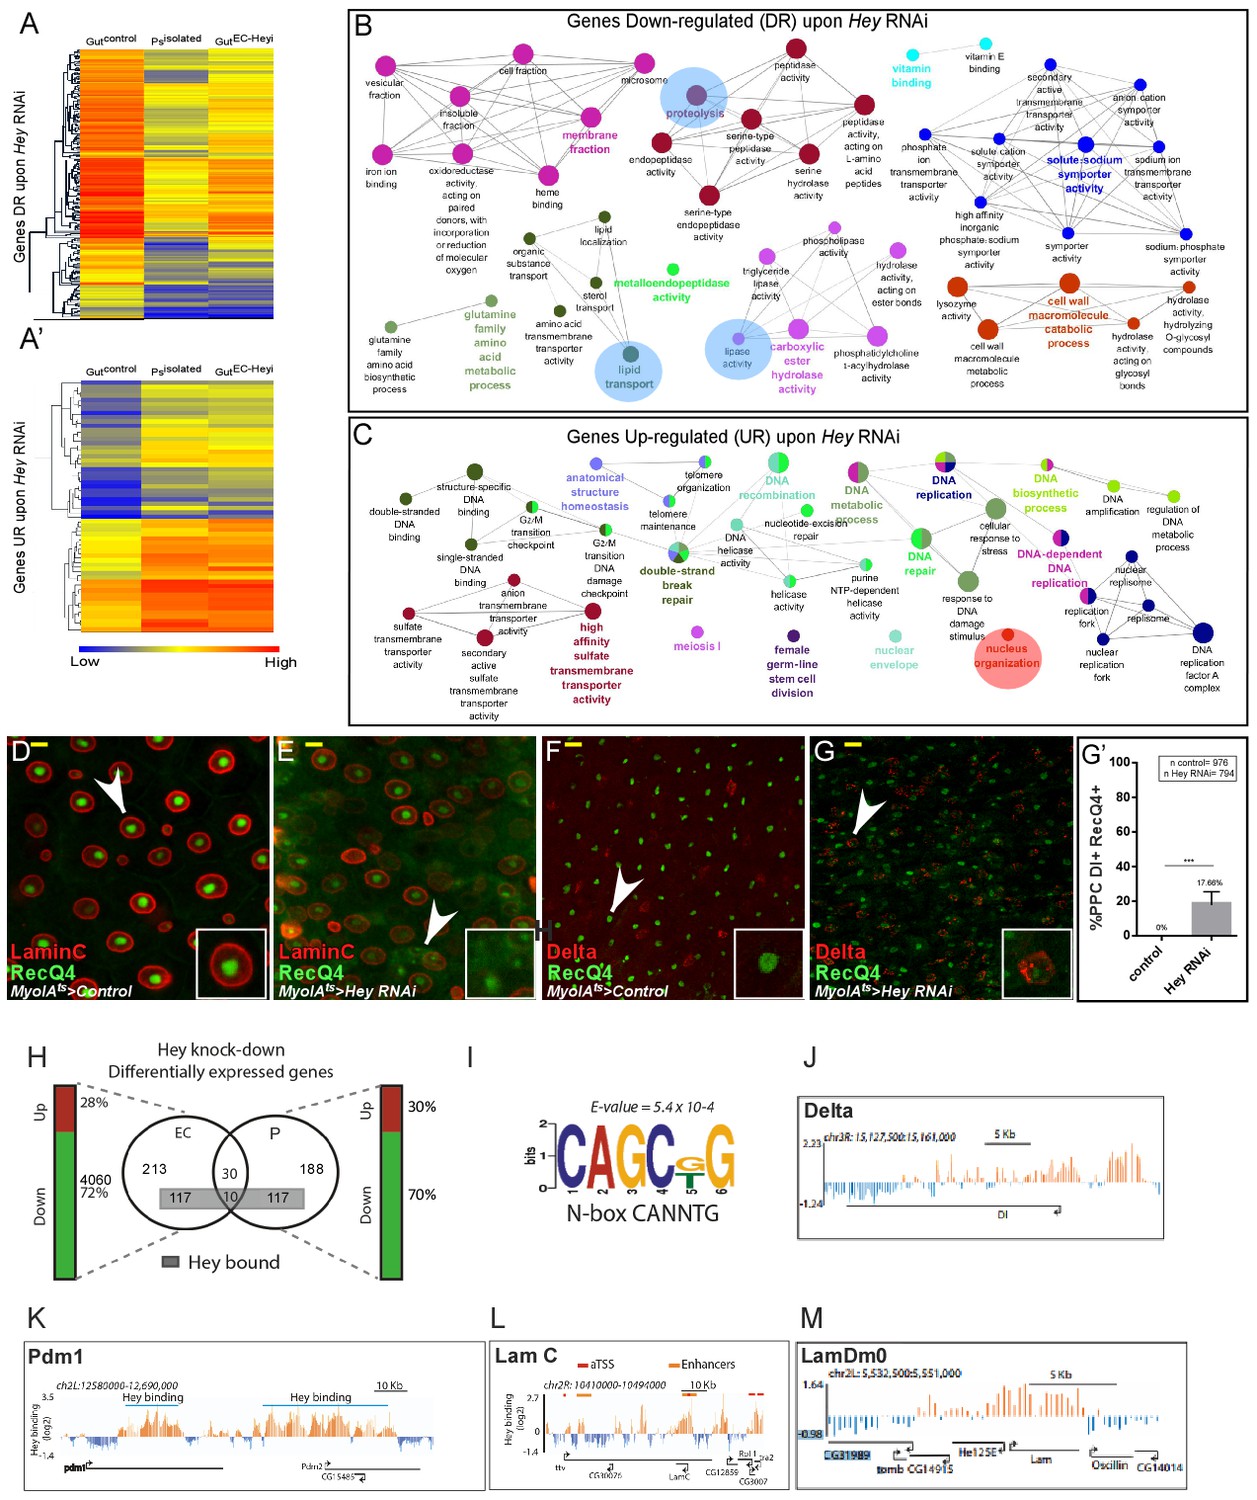
Transcriptional analysis of targeting Hey in ECs.
(A–A’) Heat map depicting changes in gene expression in control guts, enriched purified progenitors (Psisolated), and guts in which Hey is targeted in ECs for 48 hr (Gut ECHeyi). (A) Genes repressed upon Hey targeting in ECs, and (A’) genes activated upon Hey targeting in ECs. (B, C) Cytoscape-based gene-ontology analyses for genes that are downregulated or upregulated, respectively, upon Hey depletion in ECs (see Supplementary file 2). (D–G’) Targeting Hey in ECs resulted in increased expression of Hey-putative direct target RecQ4 protein in small cells that are LamC(-) Delta(+) (compare D to E, and F to G). (G’) Quantification of polyploid cells (PPCs) that co-express Delta and RecQ4 in control and midguts where Hey is targeted in ECs. Arrows indicate cells shown in insets. Scale bar is 10 μm. (H) Venn diagram comparison of genes regulated by Hey in progenitors (P) and ECs. Gene loci also bound by Hey, as identified by DamID, are indicated by a gray rectangle. Vertical bars indicate the percent of genes whose expression is repressed (green) or activated (red) upon Hey knockdown (I) A non-canonical HES binding site is enriched in Hey bound loci. (J–M) Single gene examples of genomic loci bound by Hey using DamID. Binding profile of Hey over the genomic regions encoding for delta (J), Pdm1 (K), LamC (L) LamDm0 (M). Single peaks and regions are shown in orange and blue, respectively. The mean signal was smoothed +whiskers. Predicted enhancers were identified using modENCODE are depicted as orange lines, and coding regions are shown as black arrowed lines. modencode.org/publications/integrative fly (Gerstein et al., 2010); GSE22069 (Filion et al., 2010),_(Roy et al., 2010).
-
Figure 3—source data 1
Quantification data related to Figure 3G' - number of PPC Dl(+) RecQ4(+).
- https://doi.org/10.7554/eLife.44745.018
Figure 3—figure supplement 1
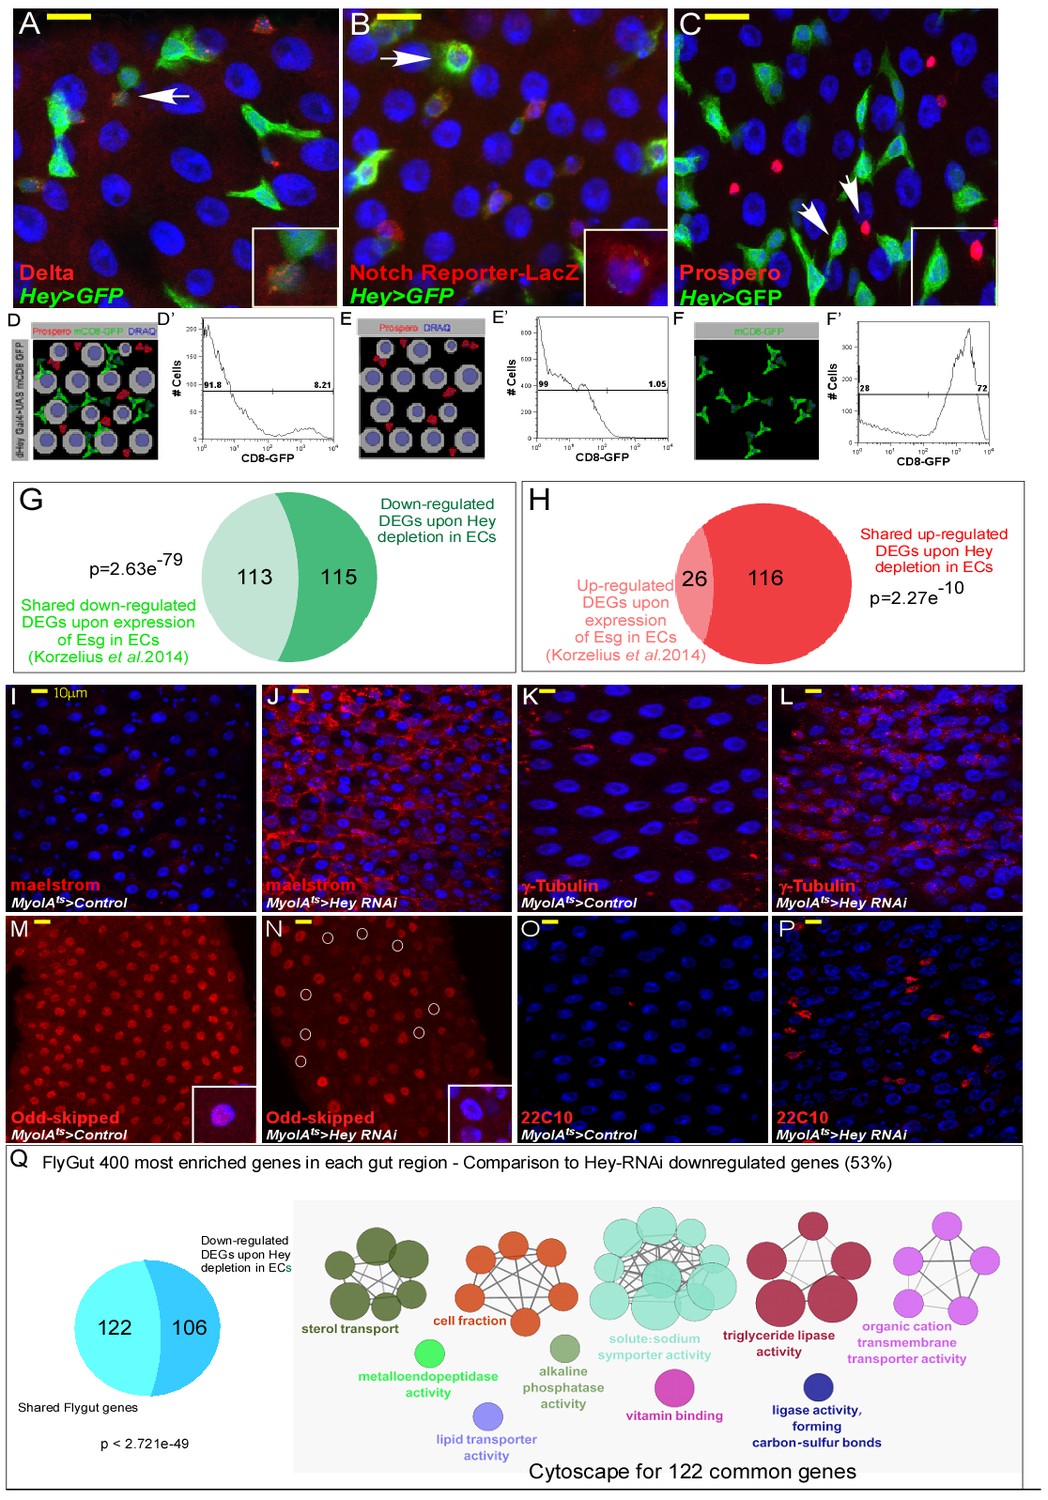
Transcriptional regulation of EC identity by Hey.
(A–C) Confocal images of the indicated transgenes. Hey 5’UTR drives Hey expression in progenitors (predominantly EBs). Expression of UAS-GFP driven by Hey5’-UTR-GAL4. ISC cells are marked with Delta (A; red), EBs express the Notch reporter Su(H)Gbe::LacZ (B; red), and all are positive for Hey-Gal4 >UAS GFP (green). Prospero-positive cells are EEs (C; red), DRAQ5 (blue) marks DNA. Arrows indicate cells shown in insets. (D–F’) Illustrations and representative FACS plots of progenitors enrichment. We used the 5’UTR of Hey to express Gal4, which drives the expression of UAS-mCD8-GFP transgenes in progenitors, enabling the purification of predominantly EBs. (D) Gut cells before sorting, (E) Flow through fraction, and (F) eluted cell fraction. (D’, E’, F’) represent FACS analysis of CD+GFP+ cells enrichment via affinity purification. Percent of CD8+GFP+ cells in purified populations were; Ex1 72%, Ex2 93%, Ex3 83%. (G–H) Comparison between Hey-regulated DEGs and genes regulated by the over-expression of UAS-esg in ECs (Korzelius et al., 2014). Shared targets are shown in light green or light red. (I–P) Confocal microscopy images of midguts expressing the indicated transgenic flies and antibodies: (I, J) maelstrom, (K, L) γ-Tubulin, (M, N) Odd-skipped, (O, P) 22C10 (red); DAPI (blue) marks DNA. - Q - Venn diagram comparison, and cytoscape analysis of shared genes between downregulated genes upon expression of UAS Hey-RNAi in EC to midgut-specific transcriptional signature obtained form: flygut https://flygut.epfl.ch/expressions.
Figure 3—figure supplement 2
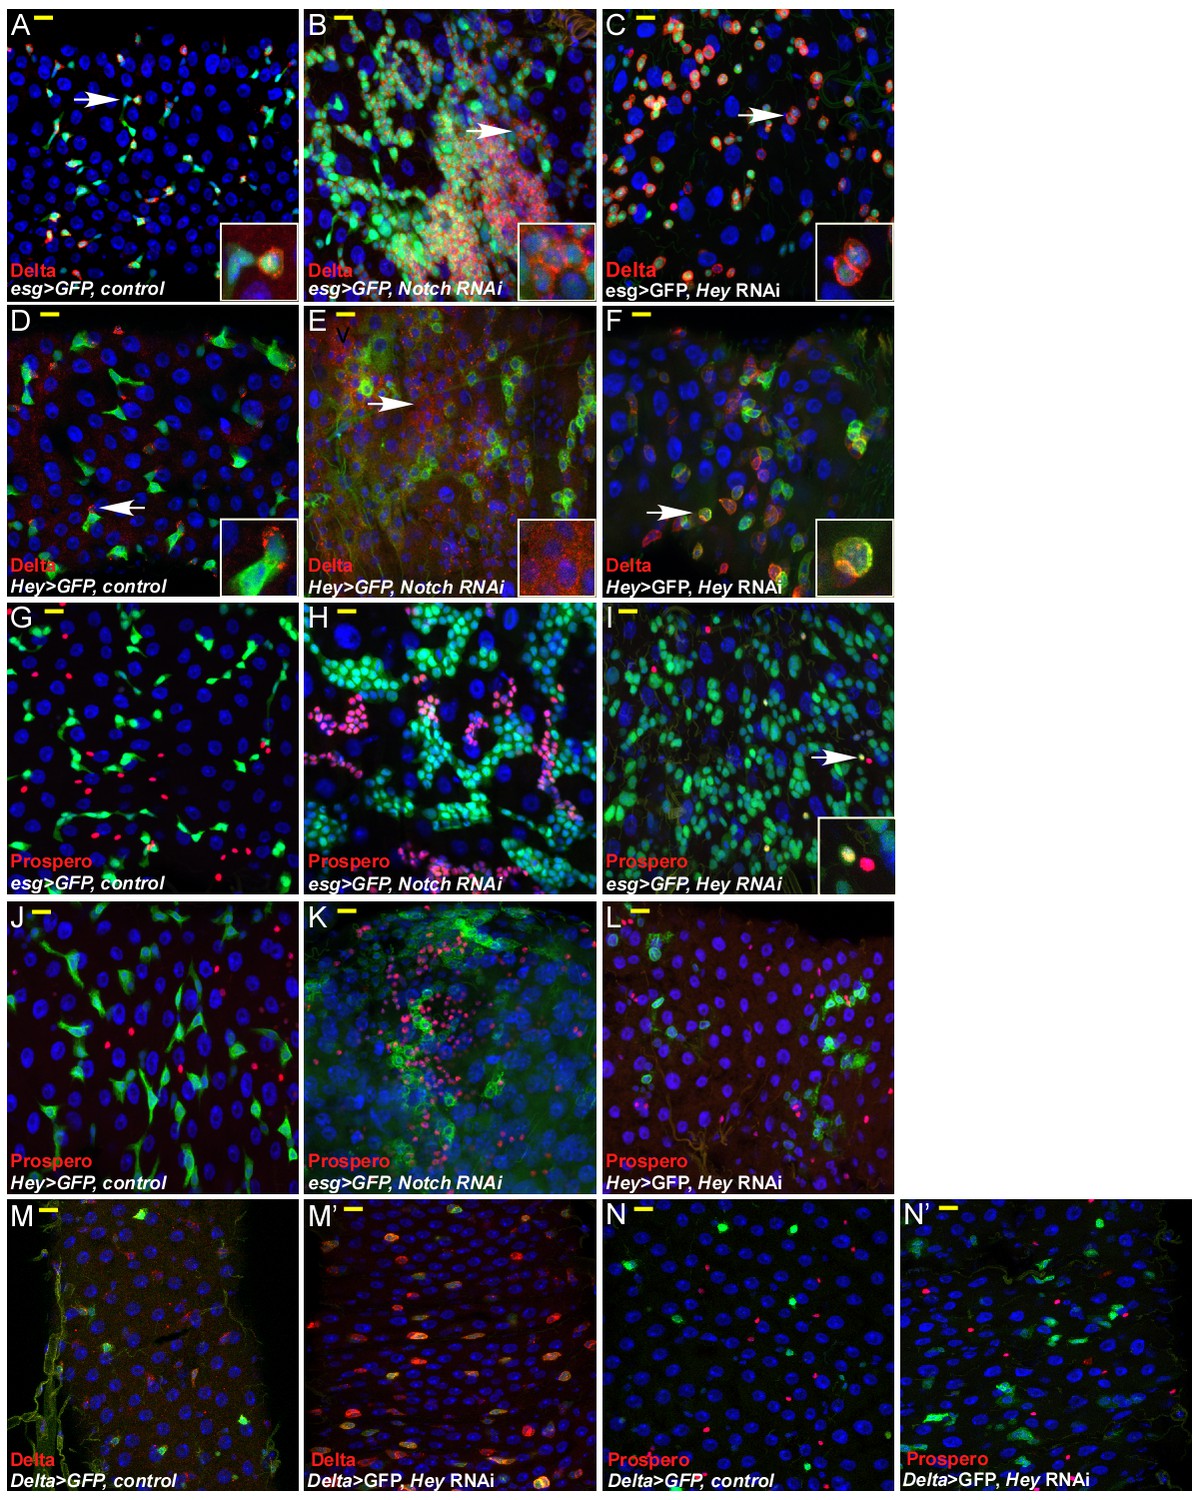
Hey is required for progenitor identity and differentiation.
Cell-specific RNAi reduction of Hey for 48 hr in either progenitor, ISC, or EBs. Confocal images of adult Drosophila midgut epithelium derived from the indicated transgenic lines and antibodies. DRAQ5 marks DNA (blue), scale bar is 10 μm. The number of ECs declined and many progenitor cells were unable to maintain proper identity. Targeted cells co-expressed EB markers such as hey-Gal4 >GFP and the Notch ligand, Delta, which is normally not expressed in EBs. (A–F) Expression of control (A, D), UAS-Notch-RNAi (B, E), or UAS-Hey-RNAi (C, F) in progenitor cells. Delta expression is shown in red and concomitant expression of UAS-GFP indicates the activity of either esg-Gal4 (A–C) or Hey-Gal4 (D–F). (G–L) Expression of control (G, J), UAS-Notch-RNAi (H, K), or UAS-Hey-RNAi (I, L) in progenitor cells and expression of EE marker Prospero (red). Concomitant expression of UAS-GFP indicates the activity of either esg-Gal4 (G–I) or Hey-Gal4 (J–L). White arrows in (I) indicate cells that co-express Prospero and are also positive for esg promoter activity. (M–N’) Expression of control (M, N) or UAS-Hey-RNAi (M’, N’) in ISC using Dl-Gal4 and indicated antibodies (M, M’ Delta, red; N, N’ Prospero, red).
Figure 3—figure supplement 3
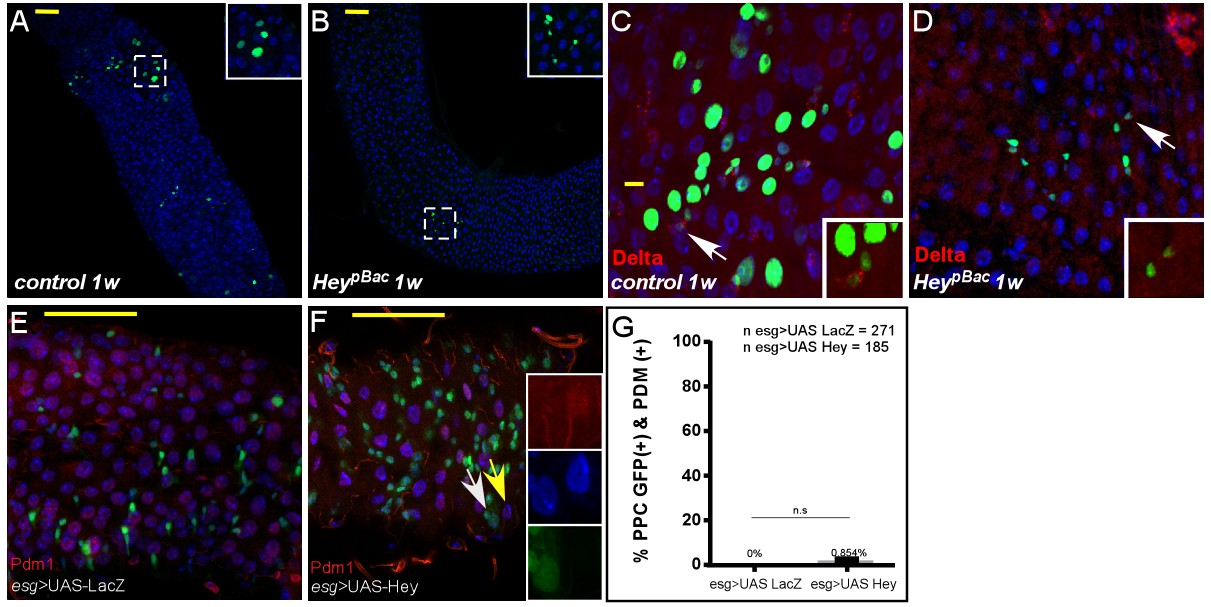
MARCAM analysis of Hey mutant clones Confocal images of adult Drosophila midgut epithelium derived from the indicated transgenes, DAPI marks DNA, and scale bar is 50 μm.
(A–D) MARCM analysis of control (C, E) and Heyp mutant clones (D, F) one week (1W) after clone induction. hey-deficient clones generated by MARCM did not survive and were likely rapidly outcompeted. The few surviving clones were small and failed to differentiate to large polyploid cells or ECs. Control and Heyp clones are GFP-positive (see details under Materials and methods). (E, F) Expression of Hey (F), but not control (E), in progenitor cells using esg::GAL4 did not result in ectopic expression of Pdm1 protein. Yellow and white arrows point to cells shown in insets. (G) Quantification of PPC that are positive for both GFP and PDM in experimental setting similar to (E and F).
-
Figure 3—figure supplement 3—source data 1
Raw data for Quantification of PPC that are positive for both GFP and PDM in experimental setting similar to (E and F).
- https://doi.org/10.7554/eLife.44745.016
Figure 3—figure supplement 4
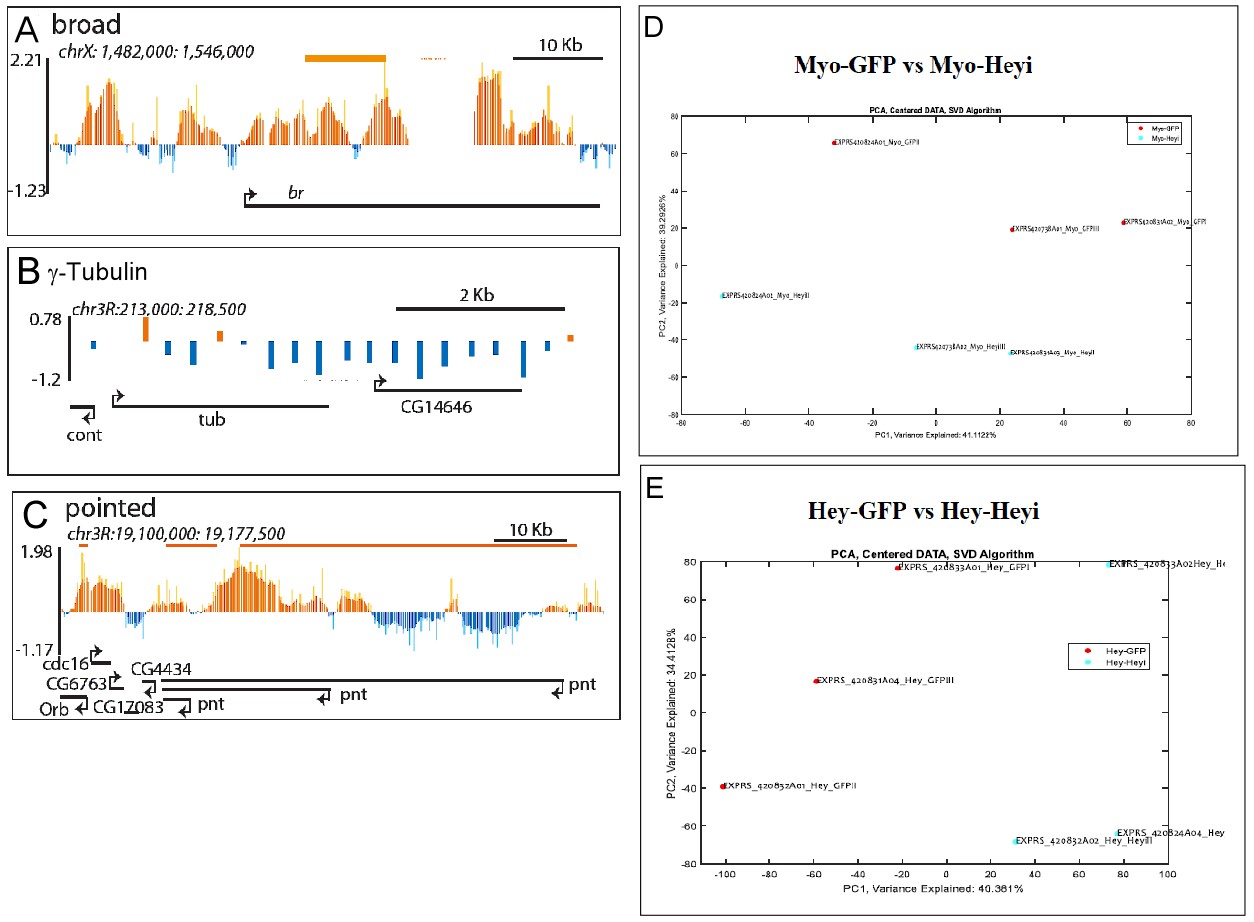
Single gene examples of genomic loci bound by Hey, and PCA analysis of Hey- dependent gene expression experiments.
(A–C) Binding profile of Hey over the genomic regions encoding for broad (A), γ-tubulin (B) and pointed (C). Single peaks and regions are shown in orange and blue, respectively. The mean signal was smoothed +whiskers. Predicted enhancers as determined by modENCODE are depicted as orange lines, coding regions are shown as black arrowed lines. (D) PCA analysis of expression arrays of the impact of reducing Hey in ECs on the gut transcriptome. (E) PCA analysis of expression arrays of the impact of reducing Hey in affinity purified progenitor.
Figure 4 with 3 supplements
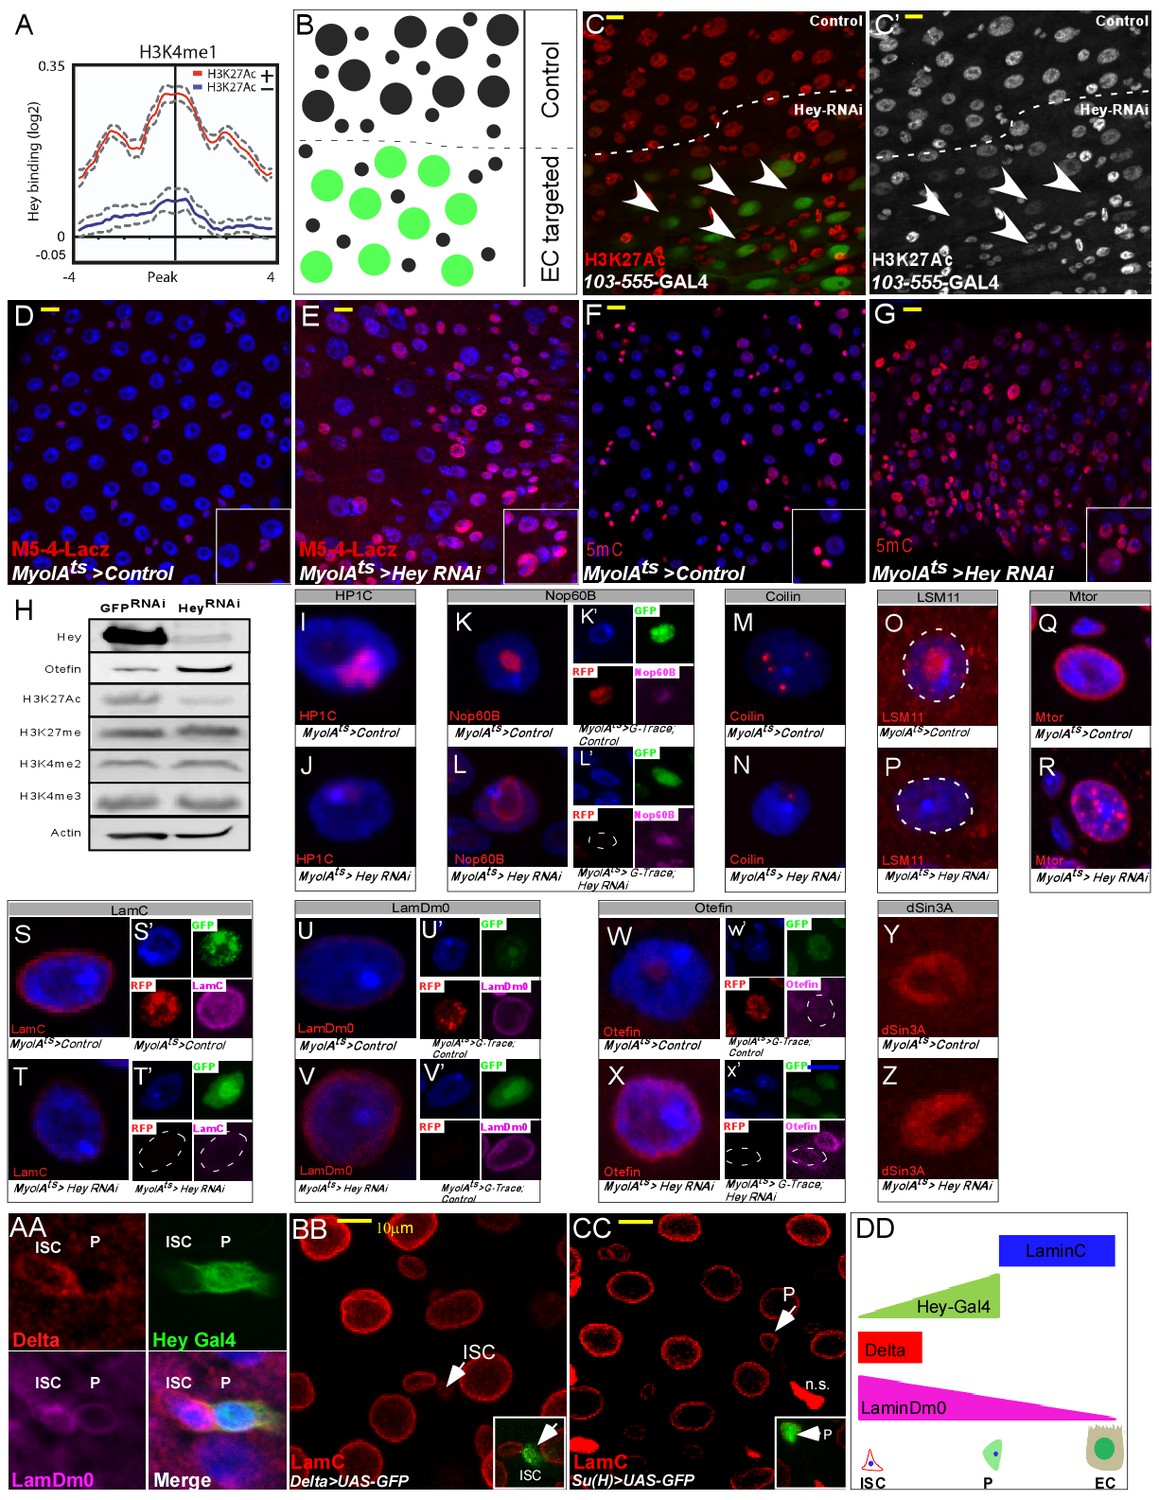
Hey regulates chromatin and large-scale nuclear organization.
(A) End analysis of Hey DamID signal to H3K4me1-enriched regions containing H3K27Ac (red). (B) Schematic diagram of regional EC-targeting system. GFP marks ECs where RNAi is active (targeted region). (C, C’) Confocal images of regional targeting of Hey in ECs. H3K27Ac is shown in red, targeted ECs are GFP-positive, and the targeted region is below the dashed white line. (D–G) RNAi-mediated targeting of Hey using Myo1A-GAL4ts for 48 hr resulted in increased and ectopic expression of the esg gene stem cell enhancer (M5-4::LacZ) (D, E), and in an increase in chromatin accessibility (F, G) as measured by M-SSL-I assay, 5mC is shown in red (see text for details). DAPI (blue) marks DNA, and scale bar is 10 μm. (H) Western blot analyses of the indicated proteins in extract derived from S2R + cells that were transfected with GFP RNAi or Hey RNAi. Actin serves as loading control. (I–Z). Single cell images of RNAi-mediated reduction of Hey, but not control, in ECs resulted in changes in the expression and distribution of the indicated proteins associated with intranuclear organelles and chromatin/nuclear domains; Representative images of G-TRACE analysis are shown in (K’, L’, S’ T’, U’ V’, W’, X’). DAPI marks DNA. (AA-DD) expression of nuclear lamins in midgut cells (AA) ISCs are Delta positive (red) and express LamDm0 (purple). EBs are marked by Hey-Gal4 >GFP (green). (BB, CC) Immunostaining of LamC (red) and the indicated cell-specific transgenes (green), arrows indicate cells in insets: (BB) ISCs are marked by Delta-GAL4 >UAS GFP; (CC) EBs are marked by Su(H)-GAL4 > UAS GFP. (DD) Distribution of lamins during ISC differentiation to ECs.
Figure 4—figure supplement 1
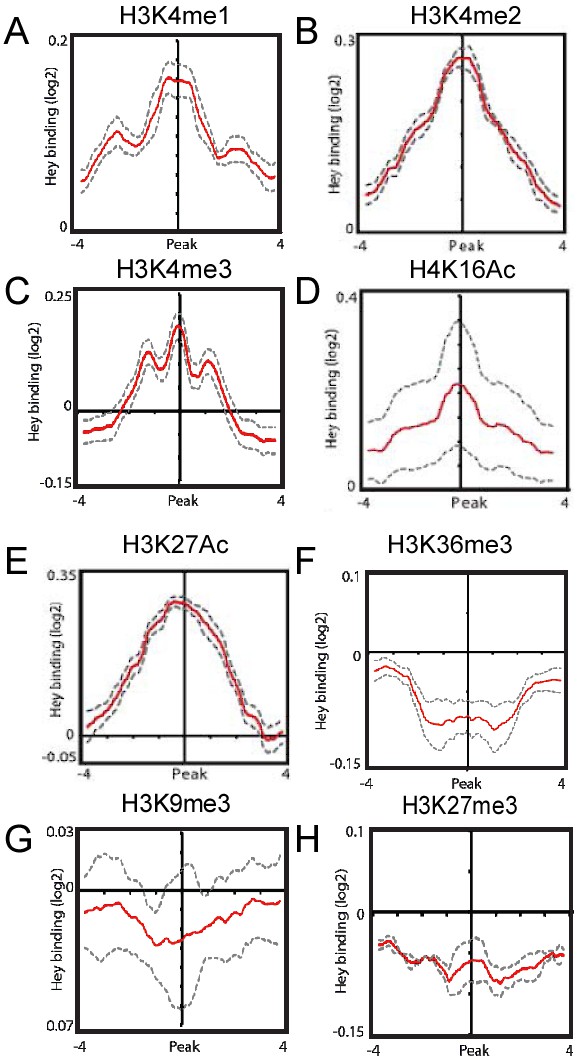
Correlations between Hey-DamID-bound loci and histone tail modifications.
(A–H) Meta-analysis testing for Hey binding enrichment on genomic regions containing the indicated histone tail modifications.
Figure 4—figure supplement 2
Characterization of regional targeting system (A–E) Regional EC targeting line.
(A) Overview of regional line, GFP marks targeted ECs. (B, C) regional elimination of Hey. (D, E) Regional elimination of UAS-LacZ that serves as control. Delta expression is shown in red, targeted region is below the dashed line and DNA is marked by DAPI.
Figure 4—figure supplement 3
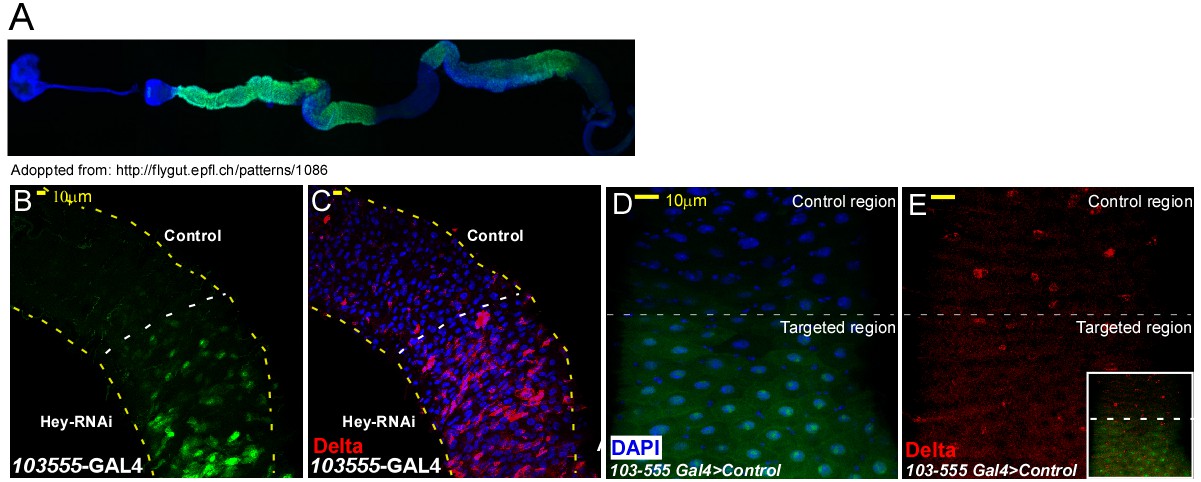
Characterization of the esg-M5-4 lacZ enhancer expression in midgut cells, and quantification of the effect of loss of Hey on large scale chromatin and nuclear organization (A–D) Confocal images of adult Drosophila midgut epithelium derived from the indicated transgenes, DAPI marks DNA, and scale bar is 50 μm.
Where indicated RNAi was activated for 48 hr. Expression pattern of M5-4::lacZ in midgut cells. (A, B) M5-4::lacZ is shown in green, ISC are marked by Delta (red). (C, D’) M5-4::lacZ is shown in green, EE are marked by Prospero (red). DAPI (blue) marks DNA. (E–F) Percent of PPC ** expressing the progenitor M5-4 esg enhancer as shown in Figure 2K,L. using G-TRACE analysis (E) and overall PPCs (F). (G) Percent of 5mC positive cells in PPCs in control and Hey targeted ECs, n = 395 control and n = 820 Hey RNAi; **=p < 0.01. (H–K) Loss of Hey using MyoIA-Gal4/Gal80ts and UAS-Hey RNAi (J, K) but not control (H, I) in ECs results in decrease in H3K27Ac protein level in PPCs (red). DNA is marked using DAPI (Blue). (L) quantification of changes in the indicated proteins upon knockdown of Hey in ECs compare to control in similar setting to Figure 4I–X.
-
Figure 4—figure supplement 3—source data 1
Quantification data related to Figure 4—figure supplement 3.
Quantification data related to Figure 4—figure supplement 3E -number of PPC** M5-4 positive. Quantification data related to Figure 4—figure supplement 3F - number PPC M5-4 (+). Quantification data related to Figure 4—figure supplement 3G -number of PPC 5mC(+). Quantification data related to Figure 4—figure supplement 3L - quantification of changes in the indicated proteins upon knockdown of Hey in ECs compare to control in similar setting to Figure 4I–X.
- https://doi.org/10.7554/eLife.44745.023
Figure 5 with 4 supplements
Hey regulates the expression of nuclear lamins, which determine cell identity.
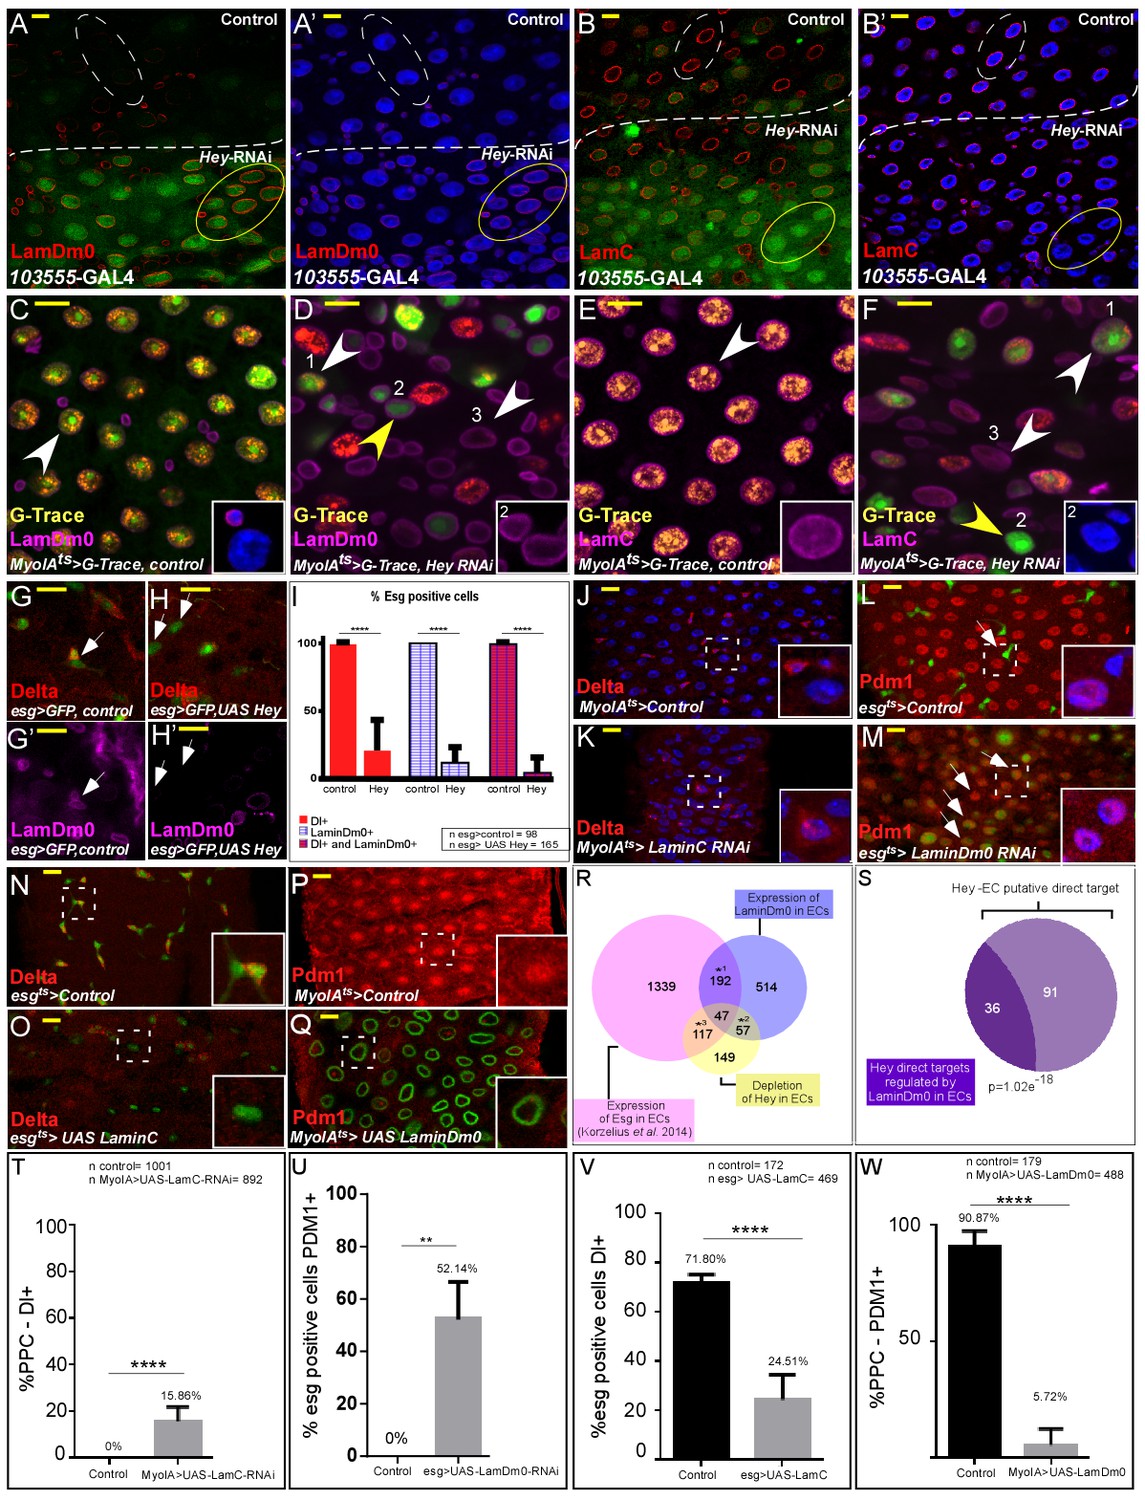
(A–B’) Effects of regional Hey targeting in ECs on the expression of LamDm0 and LamC. Hey RNAi is expressed in ECs that co-express GFP and are below the dashed line. RNAi activation was for 48 hr. (C–F) G-TRACE analyses of LamDm0 (C, D) and LamC (E, F) in control and Hey-targeted ECs. Lamin proteins are shown in purple. Numbers in each figure indicate: (1) EC; (2) PPC**; (3). PPC*. Yellow arrows indicate PPC** shown in insets. (G–H’) Expression of Hey (H, H’), but not control (G, G’), in progenitors cells reduces the expression of LamDm0 and Delta. (I) Quantification of a large midgut area in similar setting to G-H’ (****=P < 0.0001). (J–Q) Confocal images from guts derived from the indicated transgenes and antibodies. (J, K) RNAi-dependent knockdown of LamC in ECs using MyoIA-Gal4/Gal80ts results in ectopic expression of Delta (red). (L, M) RNAi-mediated targeting of LamDm0 in progenitor cells using esg-Gal4/Gal80ts (along with UAS-GFP) results in ectopic Pdm1 expression in these cells (GFP+, red). (N, O) Ectopic expression of LamC in progenitor cells results in reduced Delta expression (red). White dashed squares indicate cells shown in insets. (P, Q) Ectopic expression in ECs of LamDm0-GFP (Q, green), but not of control, (P) resulted in reduced Pdm1 expression (red). (R) Venn diagram comparison of the indicated differentially expressed genes (DEG). *1, p=4.03e−72; *2, p=3.61e−79; *3, p=1.35e−85 (S) Comparison between Hey-putative direct targets in ECs and genes regulated by ectopic expression of LamDm0-GFP in ECs. (T–W) Quantification biological repeat similar to the ones shown in J-Q. (T) PPCs expressing Delta. (U) Cells that are esg::GFP positive and that are positive for Pdm1. (V) Cells that are esg::GFP positive and are positive for Delta. (W) PPC positive for Pdm1 in experiments similar to the ones shown in J-Q respectively. ****=p < 0.0001.
-
Figure 5—source data 1
Quantification data related to Figure 5.
Quantification data related to Figure 5I number of esg-GFP positive cells Dl(+), LamDm0(+). Quantification data related to Figure 5T - number of PPC Dl(+). Quantification data related to Figure 5U - esg-GFP positive cells Pdm1(+). Quantification data related to Figure 5V - number of esg-GFP positive cells Dl(+). Quantification data related to Figure 5W - number of PPC Pdm1(+).
- https://doi.org/10.7554/eLife.44745.030
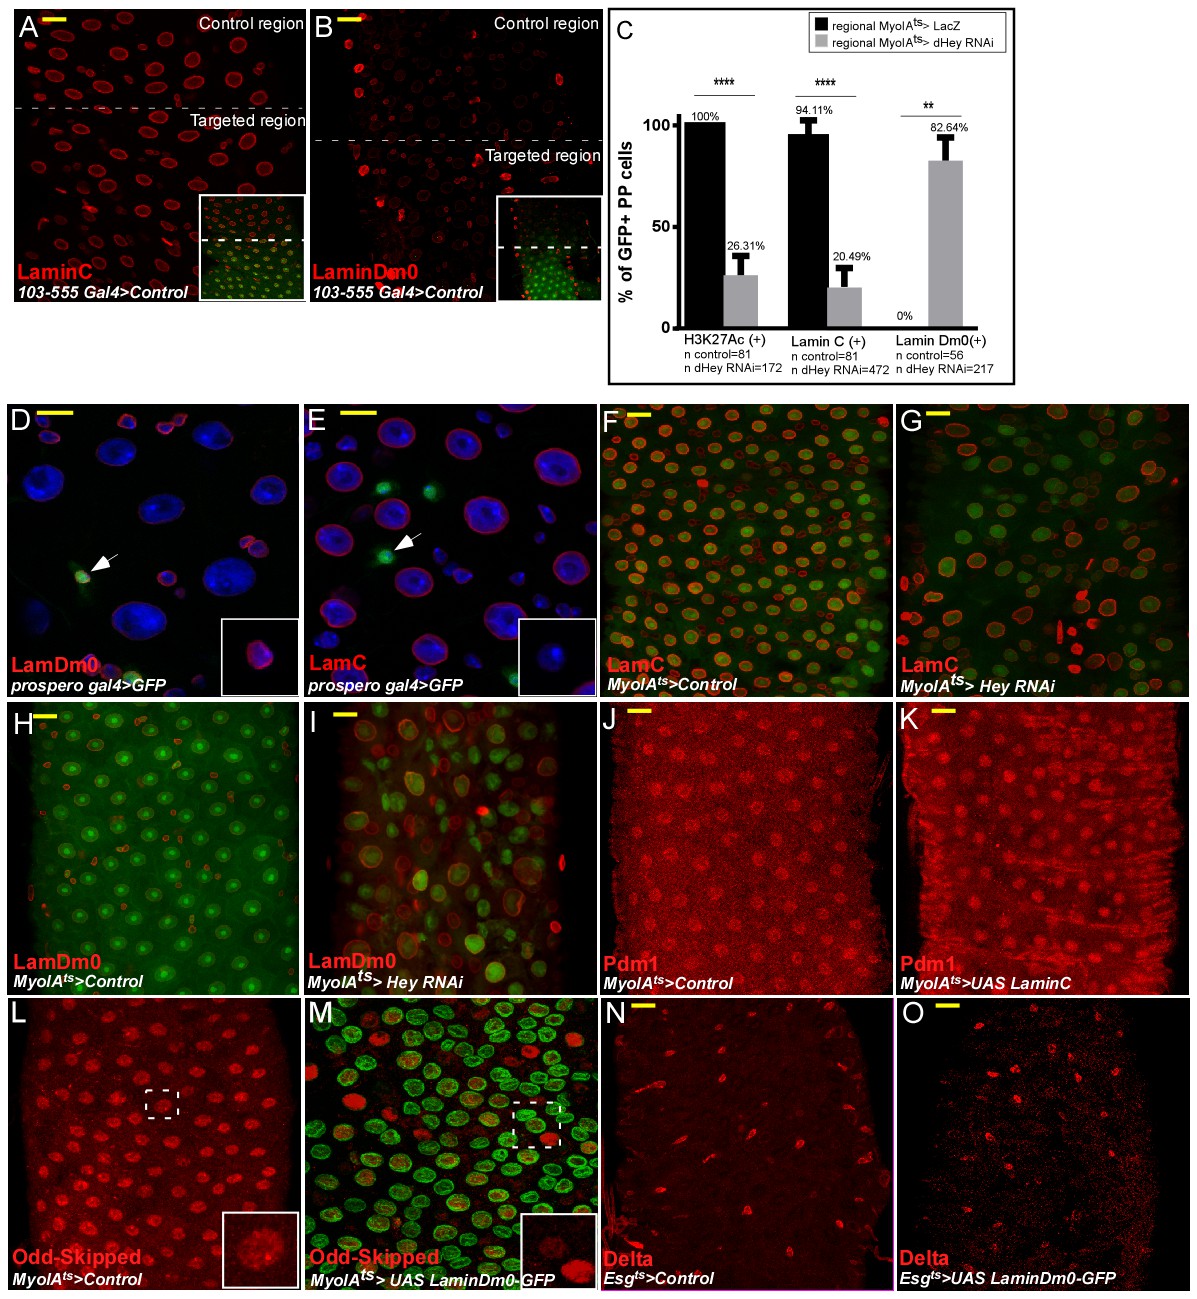
Figure 5—figure supplement 1
Hey and nuclear lamins regulate cell identity.
Confocal images of adult Drosophila midgut epithelium derived from the indicated transgenic lines and antibodies. DAPI marks DNA (blue), scale bar is 10 μm. Activation of UAS-transgenic lines was for 48 hr. (A, B) Characterization of LamC and LamDm0 in the 103–555 Gal4 regional line expressing control (UAS-lacZ).. Low magnification images are shown in insets and targeted ECs are GFP positive. (C) Quantification of the effect of regional targeting of UAS-Hey-RNAi in comparison to that of expression of UAS-LacZ on the expression of H3K27Ac, LamC, and LamDm0, in PPCsGFP+ (polyploid cells in the targeted region where the UAS-RNAi or UAS-LacZ is expressed. (D, E) Confocal images of LamDm0 (D) or UAS-LamC (E) in guts expressing UAS-GFP in EEs using prospero-Gal4. (F–I) Hey regulates lamin expression. Control midguts (F, H) or midguts in which Hey was targeted in ECs using MyoIAts80 >UAS GFP and UAS-Hey RNAi (G, I), immunostained with the indicated antibodies. (J, K) Expression of LamC in ECs does not affect Pdm1 expression. (L, M) Odd-skipped protein levels (red) in ECs expressing control (M) or UAS-LamDm0-GFP in ECs (N). (N, O) Expression of LamDm0 in progenitor cells does not affect Delta expression.
-
Figure 5—figure supplement 1—source data 1
Quantification data number of PPC GFP(+) cells.
- https://doi.org/10.7554/eLife.44745.026
Figure 5—figure supplement 2
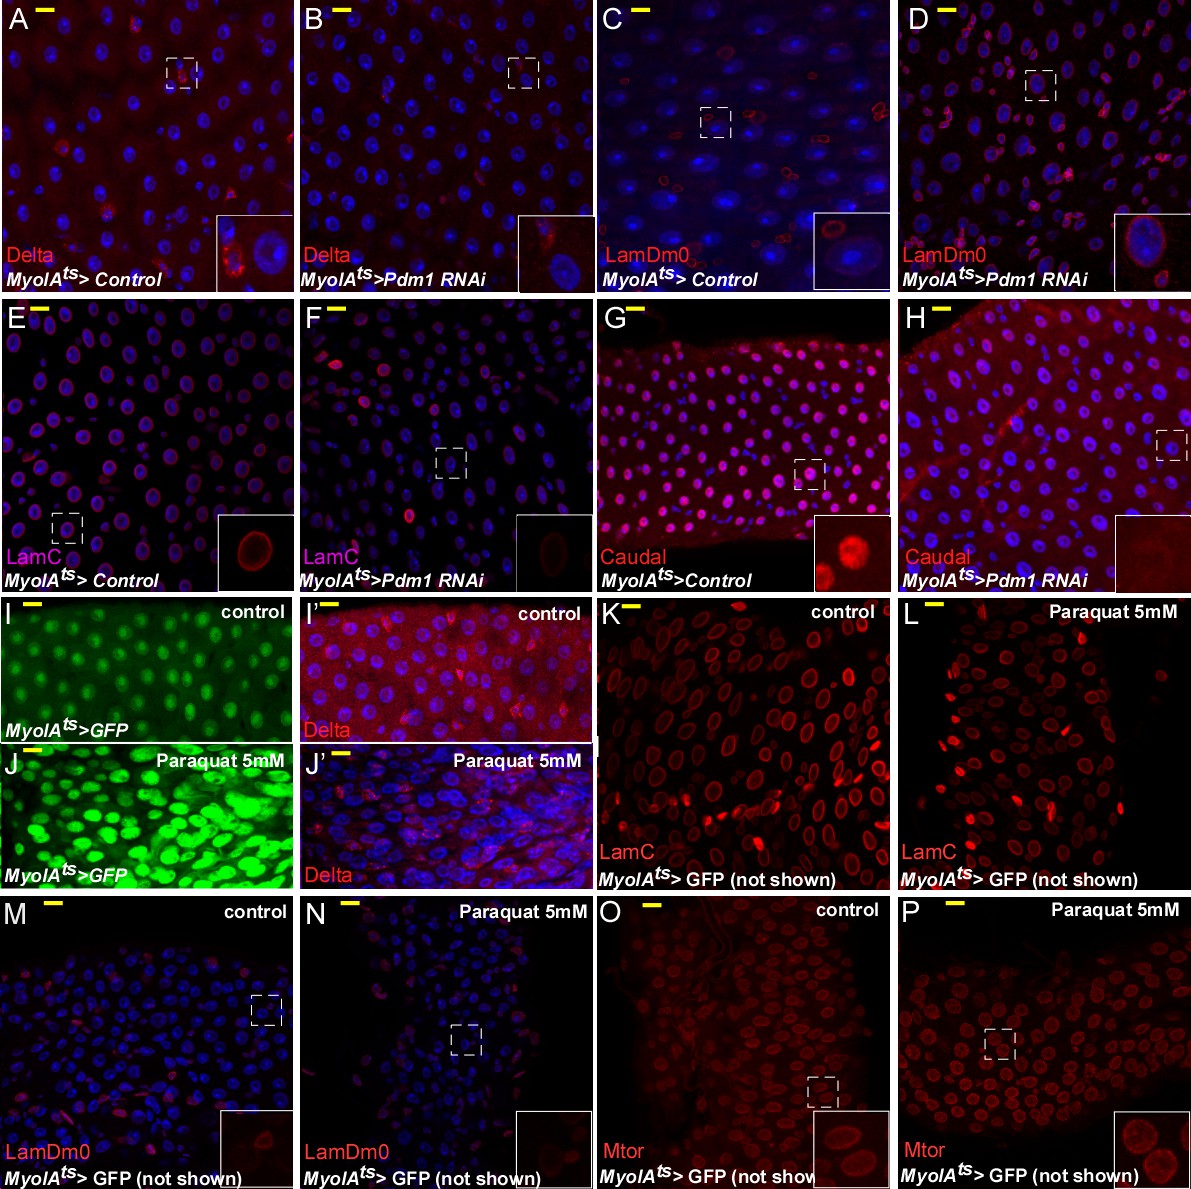
The effects on EC identity upon RNAi-dependent targeting of Pdm1, or Paraquat treatment.
Confocal images of midgut intestinal epithelium of adult Drosophila derived from the indicated transgenic lines and antibodies. In all cases MyoIAts was used to drive the expression of the either control of Pdm1 UAS-RNAi transgene (A–H) or 5 mM Paraquat treatment (I–P) for 48 hr, and MyoIAts > UAS GFP marks fully differentiated ECs. Exposure to 5 mM paraquat that induces rapid progenitor proliferation did not affect LamC, and LamDm0 expression, or localization of Mtor. DAPI (blue) marks DNA.
Figure 5—figure supplement 3
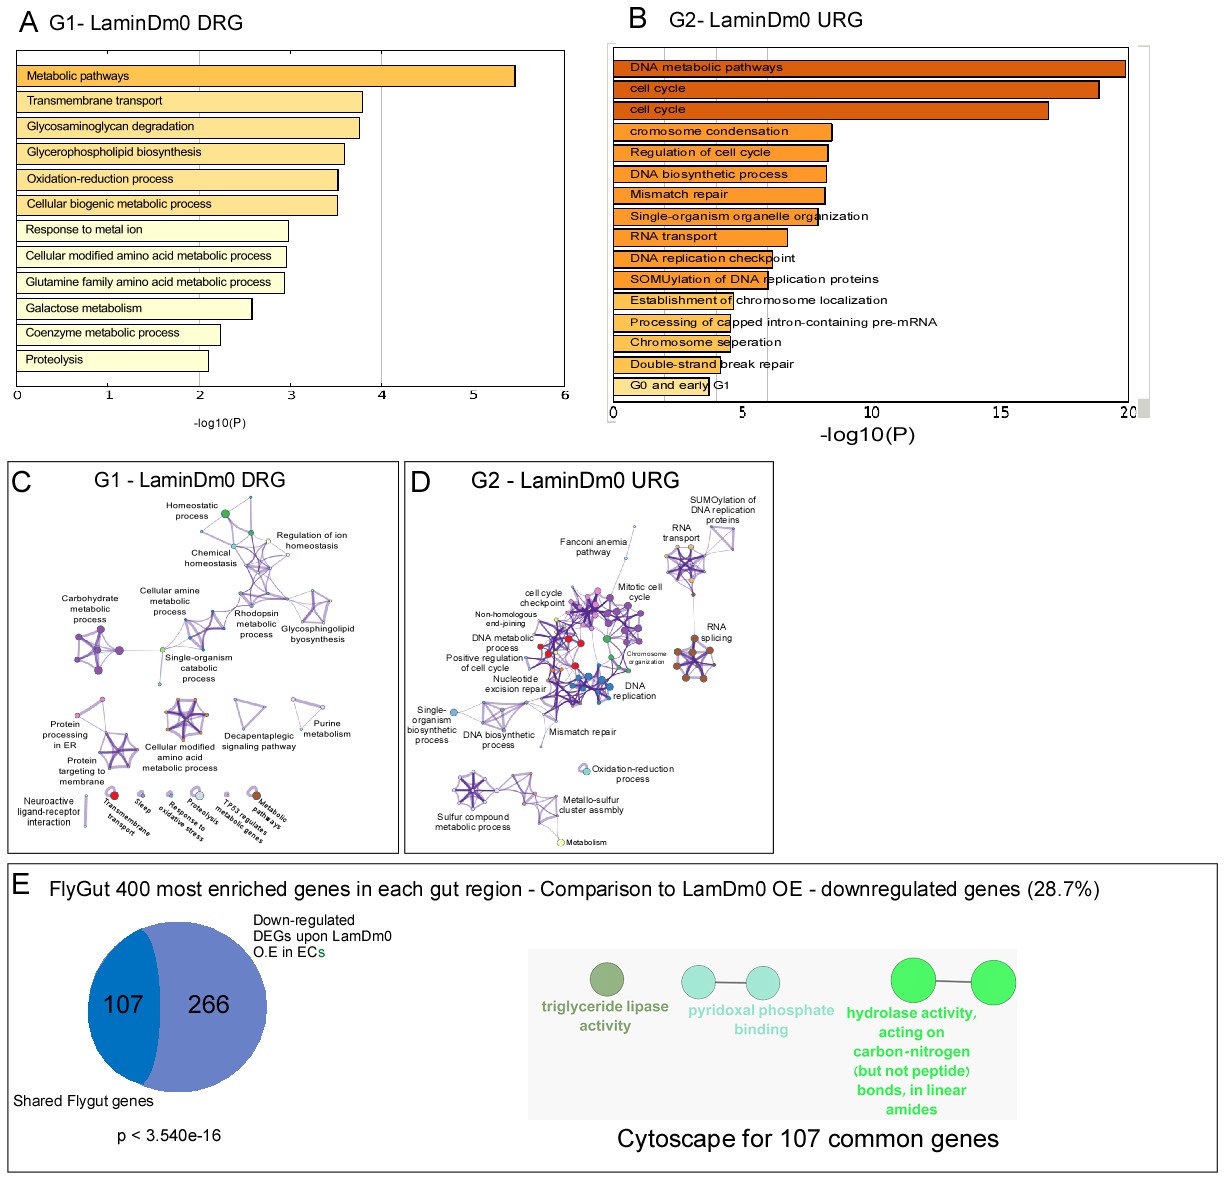
Transcriptional analysis of regulation of cell identity by LamDm0.
(A, B) Gene ontology (GO) categories for downregulated (A) or upregulated (B) DEGs upon expression of LamDm0 in ECs. (C, D) Metascape-based GO analysis of downregulated (C) or upregulated (D) DEGs upon expression of LamDm0 in ECs. (E, <strike>E’</strike>) Venn diagram comparison, and cytoscape analysis of shared genes between downregulated genes upon expression of UAS-LamDm0 in EC to midgut-specific transcriptional signature obtained form flygut https://flygut.epfl.ch/expressions.
Figure 5—figure supplement 4
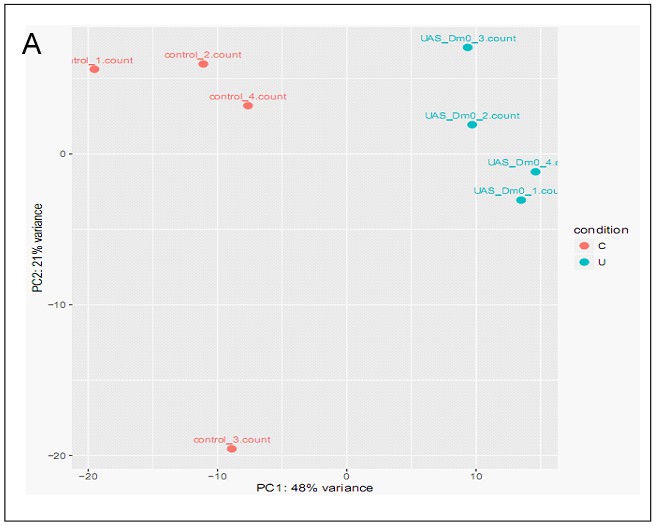
PCA analysis of LamDm0-dependent gene expression experiments.
(A) PCA analysis of RNA-seq of the impact of over-expression of LamDm0-UAS-GFP expression in ECs on the gut transcriptome.
Figure 6 with 1 supplement
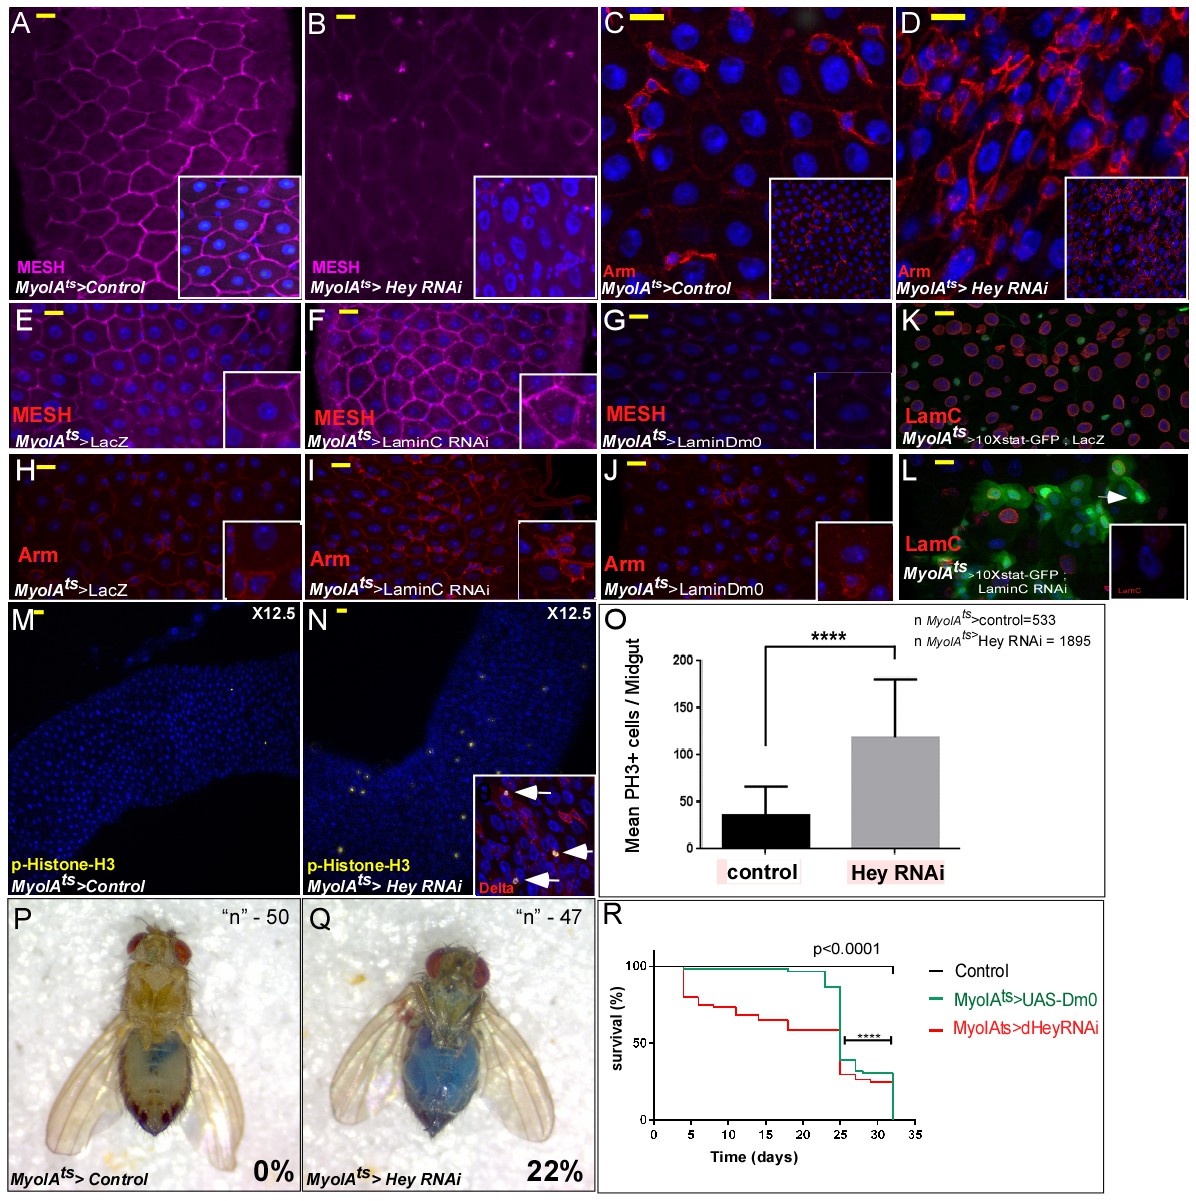
Perturbation in the expression of identity supervisors impairs gut homeostasis and gut integrity and reduces survival.
(A–N) Confocal images of adult Drosophila midgut epithelium derived from the indicated transgenes. Activation of UAS-transgenic lines was for 48 hr. DAPI marks DNA, and scale bar is 10 μm. (A–D) Loss of Hey in ECs results in reduced expression of the tight junction protein MESH at cell boundaries (A, B), and ectopic Armadillo protein levels (Arm, red) on the surface of large polyploid cells (C, D). Insets in A-D are smaller magnifications of the epithelial tissue. (E–J) Expression of MESH (E–G) or Arm (H–J) in midguts derived from the indicated transgenic lines expressed in ECs under the control of MyoIA-Gal4/Gal80ts. (K–L). Expression of STAT reporter transgenic lines in control (K), or UAS-LamC-RNAi (L), expressed in ECs using MyoIA-Gal4/Gal80ts. (M–O) Targeting Hey results in an increased number of small cells that are positive for both pH3 and Delta. (O) Quantification of the number of phospho-H3 cell positive in 31 midguts (15 control and 16 of Hey-i) in similar experimental setting to the ones shown in M and N. (P, Q) Targeting Hey in ECs results in leakage of blue-colored food into the abdomen, where 22% of Hey-RNAi flies show loss of gut integrity versus 0% in control flies (n = 94, p<0.001). (R) Survival analyses of flies expressing the indicated transgenes in ECs under the control of MyoIA-Gal4/Gal80ts (n = 180, ****p<0.0001).
-
Figure 6—source data 1
Quantification data related to Figure 6O - total number of phospho H3(+) cells per ROI.
- https://doi.org/10.7554/eLife.44745.033
Figure 6—figure supplement 1
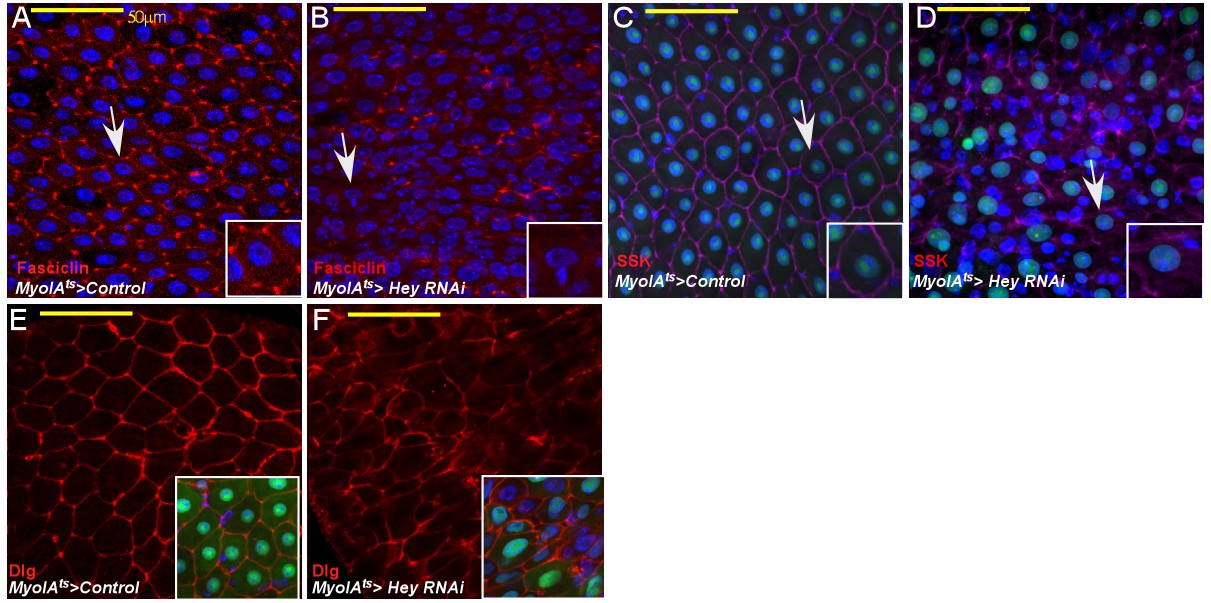
Loss of Hey impairs gut homeostasis and gut integrity.
Confocal images of adult Drosophila midgut epithelium derived from the indicated transgenes. Activation of UAS-transgenic lines was for 48 hr. DAPI marks DNA, and scale bar is 50 μm. (A–F) Loss of Hey results in aberrant expression and localization of Fascicllin (A, B) Snake-skin (SSK) (C, D), Disc Large (Dlg, (E, F) at cell boundaries. Arrows point to cells shown in insets. Insets in E and F are smaller magnifications of the epithelial tissue. and DAPI marks DNA. Arrows point to cells shown in insets.
Figure 7
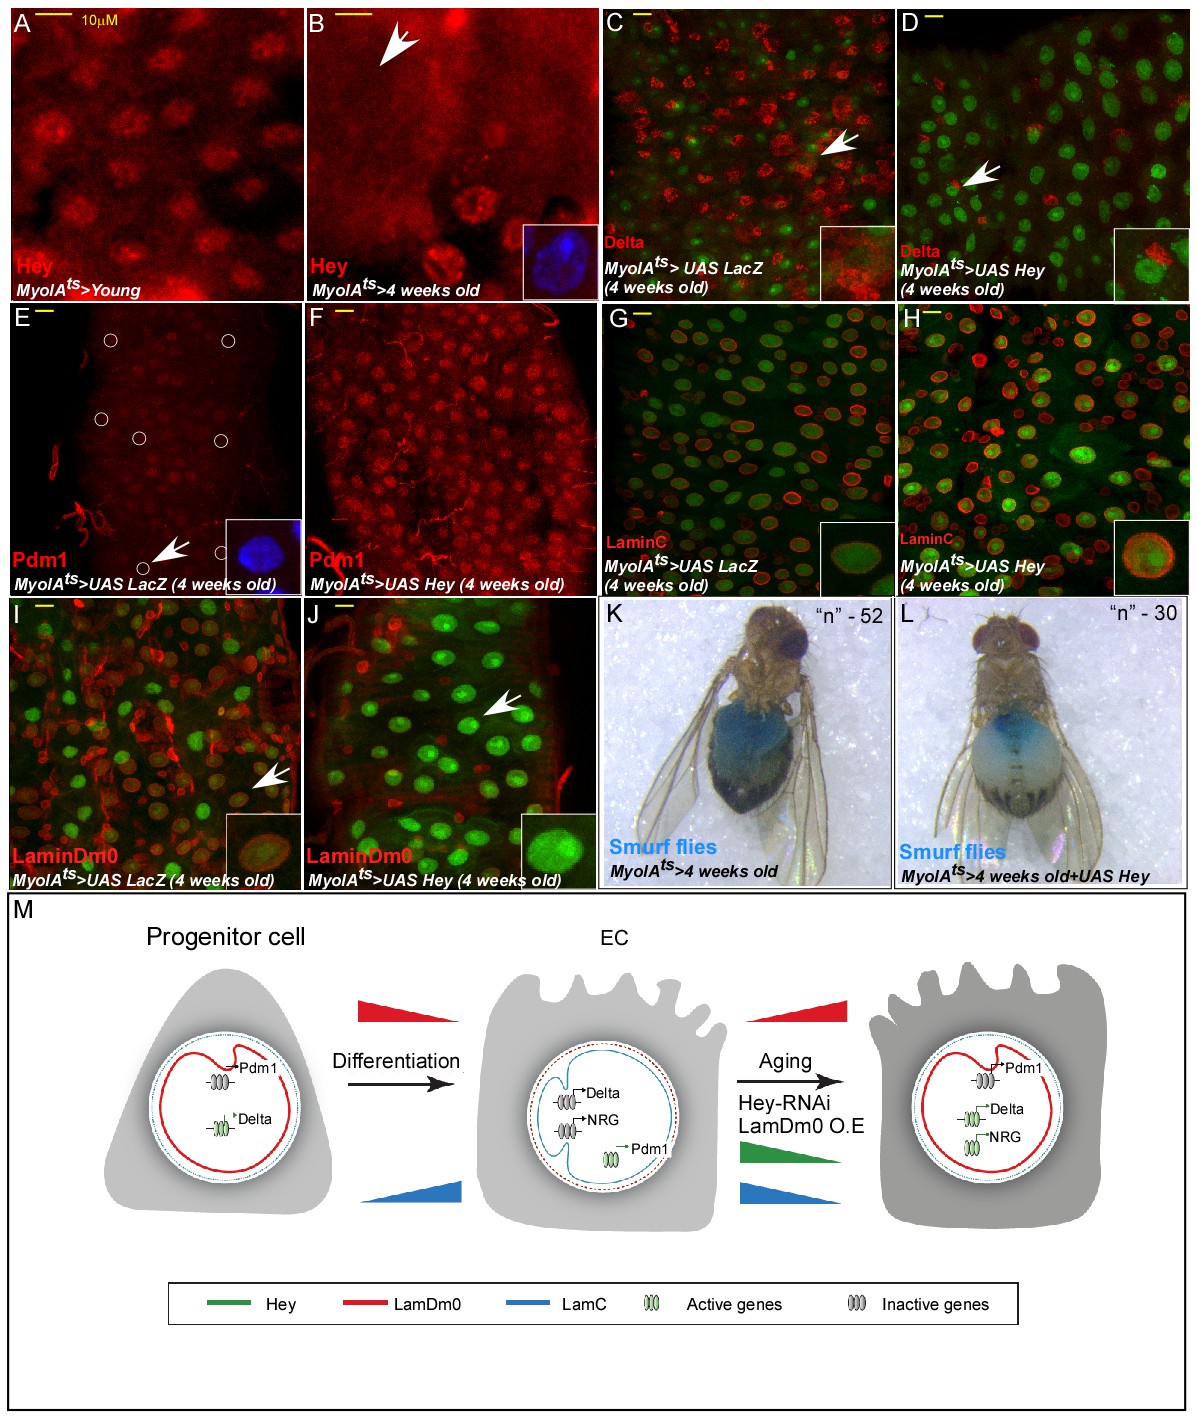
Hey protein level declines in aged ECs and its over-expression suppresses aging phenotypes.
(A, B) Confocal images of Hey protein (red) in young (A) and aged (B) adult midgut epithelium. DAPI marks DNA, and scale bar is 10 μm. (C–J) Confocal images with the indicated antibodies of ECs expressing either UAS-LacZ (control, (C, E, G, I), or UAS-Hey (D, F, H, J) transgenes using the MyoIAts-Gal4. White arrow indicates cells shown in insets. (K, L) Aged ECs exhibit leakage of blue-colored food into the abdomen, which is prevented by expression of UAS-Hey (L), but not control (K) where only 7% of aged flies expressing Hey show loss of gut integrity versus 28% in control aged flies (n = 52, and 30 respectively, p<0.05). (M) A model for regulation of cell identity by Hey and nuclear lamins; NRG, non-relevant genes (see text for details).
Tables
Key resources table
| Reagent type (species) Or resource | Designation | Source or reference | Identifiers | Additional information |
|---|---|---|---|---|
| Genetic reagent (D. melanogaster) | w-, Hey-Gal4, UAS-CD8-GFP/FM7;+;+ | Orian lab | ||
| Genetic reagent (D. melanogaster) | pBac{WH}Heyf06656 | Bloomington | #18997 | |
| Genetic reagent (D. melanogaster) | P{neoFRT}42D pwn1 P{Car20y}44B/CyO | Bloomington | #5260 | |
| Genetic reagent (D. melanogaster) | yw, hs-flp122, Tub-Gal4,Uas- GFP, FRT42D Tub-Gal80/Cyo | Edgar Bruce lab | ||
| Genetic reagent (D. melanogaster) | y, w-, hs-flp122, Tub-Gal4, UAS GFP/+; FRT42D Tub-Gal80/FRT42D Heyf06656 | Orian lab | ||
| Genetic reagent (D. melanogaster) | y, w-, hs-Flp122, Tub-Gal4, UAS GFP/+; FRT42D | Orian lab | ||
| Genetic reagent (D. melanogaster) | w; MyoIA-Gal4; tub-Gal80ts, UAS-GFP | Edgar Bruce lab | ||
| Genetic reagent (D. melanogaster) | w; esg-Gal4, tub-Gal80ts UAS-GFP | Edgar Bruce lab | ||
| Genetic reagent (D. melanogaster) | w; Prospero-Gal4 | Edgar Bruce lab | ||
| Genetic reagent (D. melanogaster) | w; Dl-Gal4/TM6, Tb | Sarah Bray lab | ||
| Genetic reagent (D. melanogaster) | Su(H)-Gal4 | Sarah Bray lab | ||
| Genetic reagent (D. melanogaster) | Notch-reporter 3.37-gh-LacZ | Sarah Bray lab | ||
| Genetic reagent (D. melanogaster) | 10X-STAT::GFP | Lilach Gilboa lab | ||
| Genetic reagent (D. melanogaster) | M5-4::LacZ | Erika Matunis lab | ||
| Genetic reagent (D. melanogaster) | UAS-LamC | Lori Walworth lab | ||
| Genetic reagent (D. melanogaster) | y* w*; P{w + mW.hs=GawB}NP0203/CyO,P{w-=UAS lacZ.UW14}UW14 | DGRC | #103555 | |
| Genetic reagent (D. melanogaster) | UAS-Hey-RNAi | VDRC | #30562GD | |
| Genetic reagent (D. melanogaster) | UAS-Hey-RNAi | VDRC | #103570KK | |
| Genetic reagent (D. melanogaster) | UAS-Hey-RNAi | Bloomington | #31898 | |
| Genetic reagent (D. melanogaster) | UAS-Hey-RNAi | Bloomington | #41650 | |
| Genetic reagent (D. melanogaster) | UAS-Hey-RNAi | NIG-FLY | 11194 R-1 | |
| Genetic reagent (D. melanogaster) | UAS-Hey-RNAi | NIG-FLY | 11194 R-3 | |
| Genetic reagent (D. melanogaster) | UAS-LacZ | Bloomington | #1776 | |
| Genetic reagent (D. melanogaster) | UAS-Hairy RNAi | Bloomington | #27738 | |
| Genetic reagent (D. melanogaster) | UAS-Her RNAi | Bloomington | #27654 | |
| Genetic reagent (D. melanogaster) | UAS-HLHm7 RNAi | Bloomington | #35703, #29327 | |
| Genetic reagent (D. melanogaster) | UAS-HLHm5 RNAi | Bloomington | # 26201 | |
| Genetic reagent (D. melanogaster) | UAS-CtBP RNAi | Bloomington | #32889 | |
| Genetic reagent (D. melanogaster) | UAS-Sir2 RNAi | Bloomington | #32481 | |
| Genetic reagent (D. melanogaster) | UAS-LamDm0 RNAi | Bloomington | #31605 | |
| Genetic reagent (D. melanogaster) | UAS-LamC RNAi | Bloomington | #31621 | |
| Genetic reagent (D. melanogaster) | UAS-LamDm0-GFP | Bloomington | #7376 | |
| Genetic reagent (D. melanogaster) | UAS-Pdm1-RNAi | Bloomington | #55305 | |
| Genetic reagent (D. melanogaster) | UAS-Notch RNAi | VDRC | #27229GD #100002KK | |
| Genetic reagent (D. melanogaster) | UAS-Su(H) RNAi | VDRC | #103597KK | |
| Genetic reagent (D. melanogaster) | UAS-Dicer RNAi | VDRC | #24667GD | |
| Genetic reagent (D. melanogaster) | UAS-Gro RNAi | VDRC | #6316GD | |
| Genetic reagent (D. melanogaster) | ‘G-TRACE’ (w*; P{UAS-RedStinger}6, P{UAS-FLP.Exel}3, P{Ubi-p63E(FRT.STOP)Stinger}15F2.) | Bloomington | #28281 | |
| Transfected construct (D. melanogaster - S2 cells) | pChs-Gal4 vector | Hey > Gal4 | ||
| Transfected construct (D. melanogaster - S2 cells) | pUASp vector | UASp-His-Hey | ||
| Antibody | Mouse monoclonal IgG1 α-Prospero | DHSB | Prospero (MR1A) | 1:100 |
| Antibody | Mouse monoclonal α-Armadillo | DHSB | N2 7A1 Armadillo | 1:50 |
| Antibody | Mouse monoclonal α-Delta | DHSB | C594.9B | 1:50 |
| Antibody | Mouse monoclonal α 4F3 anti-discs large (Dlg) | DHSB | 4F3 anti-discs | 1:50 |
| Antibody | Mouse monoclonal α−22C10 | DHSB | 22C10 | 1:20 |
| Antibody | Rabbit polyclonal α-HP1 | Susan Purkhurst lab | 1:1000 | |
| Antibody | Mouse monoclonal α-mTor | DHSB | 12F10-5F11 | 1:100 |
| Antibody | Rabbit polyclonal α-βGal | MP Biomedicals | 55976 | 1:500 |
| Antibody | Mouse monoclonal α-Actin | MP Biomedicals | 691001 | (WB) 1:4000 |
| Antibody | Guinea pig α-Hey | Monastirioti et al. (2010) | 1:300 | |
| Antibody | Rabbit α-Pdm1 | Díaz-Benjumea lab | 1:50 | |
| Antibody | Rabbit α-Fasciclin | Mikio Furuse lab | 1:100 | |
| Antibody | Rabbit α-MESH | Mikio Furuse lab | 1:100 | |
| Antibody | Rabbit α-SSK | Mikio Furuse lab | 1:100 | |
| Antibody | Guinea Pig α-caudal | Jeff Reinitz lab | 1:200 | |
| Antibody | Rar/Guinea Pig α-odd-skipped | Jeff Reinitz lab | 1:100 | |
| Antibody | Rabbit polyclonal α-p-histone H3 | Abcam | ab5176 | 1:100 |
| Antibody | Mouse α-Maelstrom | G. Hanon Lab | 1:50 | |
| Antibody | Mouse monoclonalα-γ-Tubulin | Sigma | T5326-200UL | (WB) 1:100 |
| Antibody | Mouse α Lamin C | Yossef Gruenbaum lab | 1:500 | |
| Antibody | Mouse α Otefin | Yossef Gruenbaum lab | 1:10 | |
| Antibody | Rabbit αLamin Dm0 | Yossef Gruenbaum lab | 1:100 | |
| Antibody | Rabbit α RecQ4 | Tao-shih Hsieh lab | 1:100 | |
| Antibody | Rabbit α-H3K4me1 | Ali Shilatifard lab | 1:100 | |
| Antibody | Rabbit α H3K4me2 | Ali Shilatifard lab | 1:100 | |
| Antibody | Rabbit α-H3K4me3 | Ali Shilatifard lab | 1:100 | |
| Antibody | Rabbit α-H3K27me3 | Ali Shilatifard lab | 1:100 | |
| Antibody | Rabbit polyclonal αH3K27Ac | Abcam | ab4729 | 1:100 |
| Antibody | Rabbit polyclonal α-H3K9me3 | Abcam | ab8898 | 1:100 |
| Antibody | Rabbit αNop60B | Steven Pole lab | 1:100 | |
| Antibody | Rabbit α-LSM11 | Joseph Gall lab | 1:2000 | |
| Antibody | Guinee pig α-Coilin | Joseph Gall lab | 1:2000 | |
| Antibody | Alexa Fluor 568 goat anti-mouse IgG1(γ1 | invitrogen | A21124 | 1:1000 |
| Antibody | Alexa Fluor 568 goat anti-mouse IgG (H + L) | invitrogen | A11031 | 1:1000 |
| Antibody | Alexa Fluor 568 goat anti-rabbit IgG (H + L) | invitrogen | A11036 | 1:1000 |
| Antibody | Alexa Fluor 633 goat anti-rabbit IgG (H + L) | invitrogen | A-21070 | 1:1000 |
| Antibody | Alexa Fluor 633 goat anti-mouse IgG1 (γ1) | invitrogen | A-21126 | 1:1000 |
| Antibody | Alexa Fluor 568 goat anti-guinea pig | invitrogen | A11075 | 1:1000 |
| Antibody | Alexa Fluor 633 goat anti-guinea pig | invitrogen | A21105 | 1:1000 |
| Antibody | Alexa Fluor 633 goat anti-rat | invitrogen | A21094 | 1:1000 |
| Antibody | Alexa Fluor 568 goat anti-rat | invitrogen | A11077 | 1:1000 |
| Chemical compound | Diamidino-2-phenylindole*dihydrochl [DAPI] 1 mg | Sigma | D9542-1MG | 1:1000 |
| Chemical compound | Draq-5 | Biostatus | BOS-889–001 R200 | 1:5000 |
Additional files
-
Source code 1
Script code for comparing DamID binding to genomic data.
- https://doi.org/10.7554/eLife.44745.035
-
Supplementary file 1
Gene expression analyses 1.
Progenitor cells differentiation to ECs 2. Hey-regulated genes in whole guts 3. Hey-regulated genes in purified progenitors. 4. RNA-seq of genes regulated by LamDm0 expression in ECs
- https://doi.org/10.7554/eLife.44745.036
-
Supplementary file 2
Go analysis of DEG in Hey RNAi and LaminDm0 O .E (by DAVID and Cytoscape).
GO analyses GO analysis of Hey RNAi in whole gut and purified progenitors by DAVID GO analysis of Hey RNAi in whole gut and purified progenitors by cytoscape GO analysis of genes regulated by LamDm0 expression in ECs
- https://doi.org/10.7554/eLife.44745.037
-
Supplementary file 3
Genomic regions bound by Hey-DamID.
- https://doi.org/10.7554/eLife.44745.038
-
Supplementary file 4
Shared putative-Hey direct targets in progenitors and ECs.
- https://doi.org/10.7554/eLife.44745.039
-
Supplementary file 5
GO analysis for shared regulated DEGs between Hey-RNAi to ectopic expression of Esg in ECs.
- https://doi.org/10.7554/eLife.44745.040
-
Supplementary file 6
Hey-regulated putative digestive enzymes.
- https://doi.org/10.7554/eLife.44745.041
-
Transparent reporting form
- https://doi.org/10.7554/eLife.44745.042
Download links
A two-part list of links to download the article, or parts of the article, in various formats.
Downloads (link to download the article as PDF)
Open citations (links to open the citations from this article in various online reference manager services)
Cite this article (links to download the citations from this article in formats compatible with various reference manager tools)
The transcription factor Hey and nuclear lamins specify and maintain cell identity
eLife 8:e44745.
https://doi.org/10.7554/eLife.44745


