Disentangling strictly self-serving mutations from win-win mutations in a mutualistic microbial community
- Fred Hutchinson Cancer Research Center, United States
Figures
Figure 1 with 1 supplement
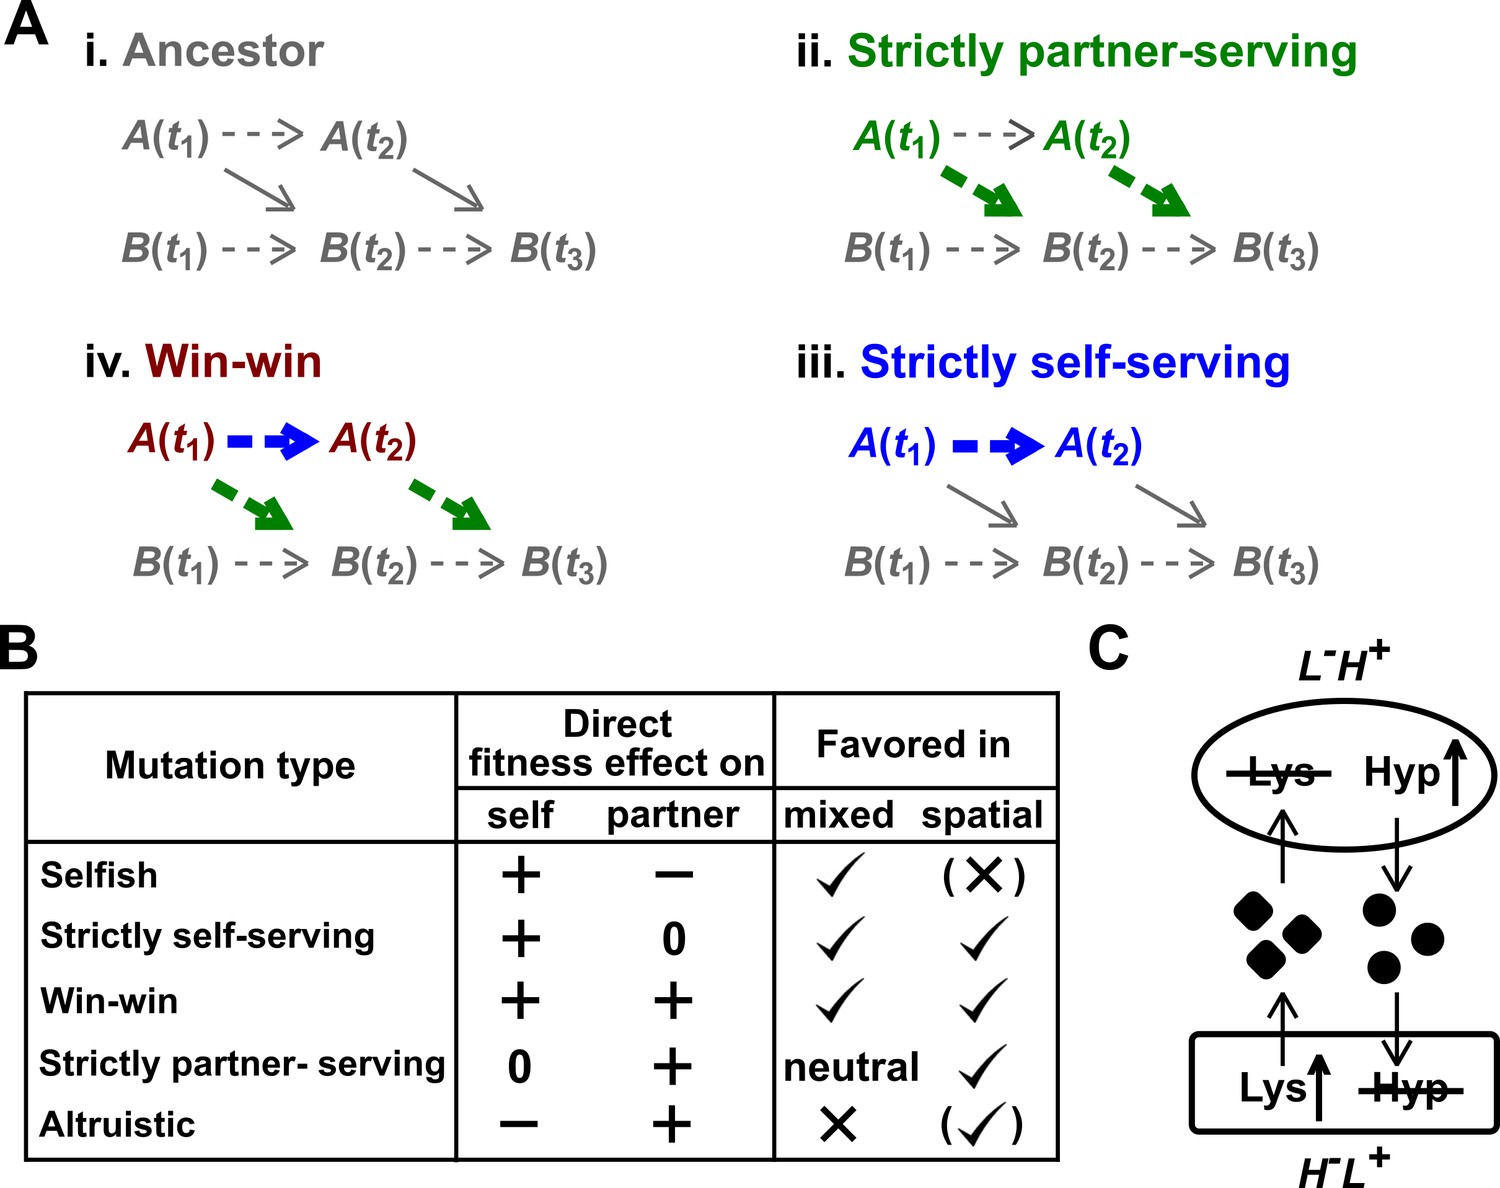
Mutation types predicted to be favored during the evolution of a mutualistic community.
(A) Direct fitness effects. To define direct effects, we use a framework similar to Chapter 10 of Peters et al. (2017). For simplicity, consider a commensal community where population A benefits population B. (i) Populations A and B grow over time t1, t2, etc. Basal growth rates of monoculture populations are marked by dashed arrows. A also releases a metabolite which promotes the growth of B (solid diagonal arrow). Thus, B(t2) will depend on both B(t1) and A(t1). (ii) Suppose that at time t1, A acquires a mutation (green) which does not alter basal growth rate, but increases benefit supply to partner (thick green arrow). This will increase B(t2) even if we had held the dynamics of mutant A to that of the ancestral A. We define such a mutation as “strictly partner-serving”. (iii) At time t1, A acquires a mutation (blue) that increases A’s basal growth rate (thicker blue arrow), but not benefit supply rate. This mutation will promote B(t3) via increasing A(t2), but will not promote B(t3) if we had held the dynamics of mutant A to that of the ancestral A. Because increased B(t3) is indirect (mediated by increased A(t2)), we define this mutation as “strictly self-serving”. (iv) A win-win mutation (brown). (B) Mutation types in a mutualistic community and their evolutionary fates. Mutations that exert a positive direct effect on self (selfish, strictly self-serving, and win-win) are favored in a well-mixed environment. In a spatially-structured environment, effects on self and on partner are both important. For example, a spatially-structured environment may favor an altruistic mutation that confers a large benefit on partner at a small cost to self. Parentheses indicate that selection outcome (favored or disfavored) depends on quantitative details of the fitness effects on self and partner (see Momeni et al., 2013b for an example). Note that a mutation that is strictly partner-serving or altruistic could still rise in frequency in a well-mixed environment by “hitchhiking” with other self-serving mutations (Morgan et al., 2012; Waite and Shou, 2012). (C) CoSMO. CoSMO is an engineered mutualistic community consisting of two non-mating S. cerevisiae strains (Hart et al., 2019a; Shou et al., 2007). Thus, the two strains may be regarded as two species. The mCherry-expressing L-H+ strain is unable to synthesize lysine (L) and overproduces the adenine precursor hypoxanthine (H). The complementary GFP-expressing H-L+ strain requires hypoxanthine and overproduces lysine. Both overproduction mutations render the first enzyme of the corresponding biosynthesis pathway insensitive to end-product feedback inhibition control (Armitt and Woods, 1970; Feller et al., 1999). In minimal medium lacking exogenously supplied L and H, the two strains form a mutualistic community where live cells from both strains release overproduced metabolites (Hart et al., 2019a) and support each other’s growth.
Figure 1—figure supplement 1
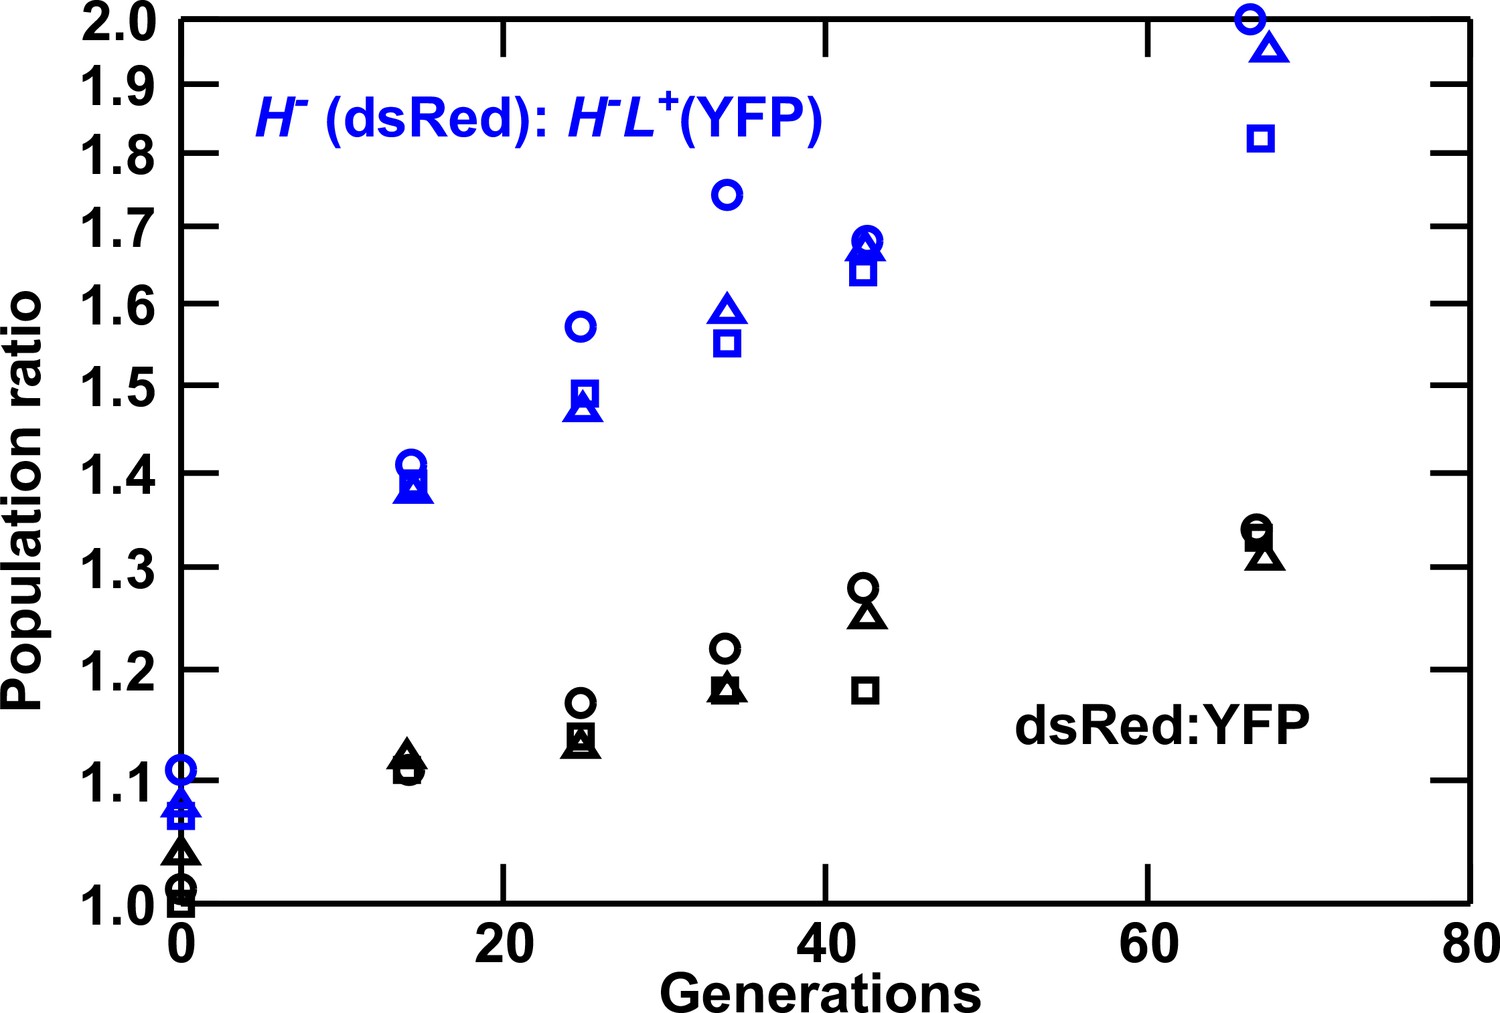
Lysine overproduction incurs a fitness cost.
Exponentially-growing isogenic strain pairs were competed in triplicate cocultures (circle, square, and triangle) at 30°C in minimal SD medium with adenine supplemented in excess (108.6 μM) when necessary. Cocultures were diluted twice daily to avoid depletion of nutrients. Population ratios were monitored using flow cytometry. In blue curves, dsRed-marked H- not overproducing lysine (WY944) has a fitness advantage of 1.2 ± 0.2% over YFP-marked H-L+ overproducing lysine (WY954). In black curves, dsRed-marked WY926 has a fitness advantage of 0.6 ± 0.1% over YFP-marked WY923. Thus, lysine overproduction imposes a fitness cost of ~0.6%. Data can be found in Figure 1—figure supplement 1—source data 1.
-
Figure 1—figure supplement 1—source data 1
Data plotted in Figure 1—figure supplement 1.
- https://doi.org/10.7554/eLife.44812.005
Figure 2 with 2 supplements
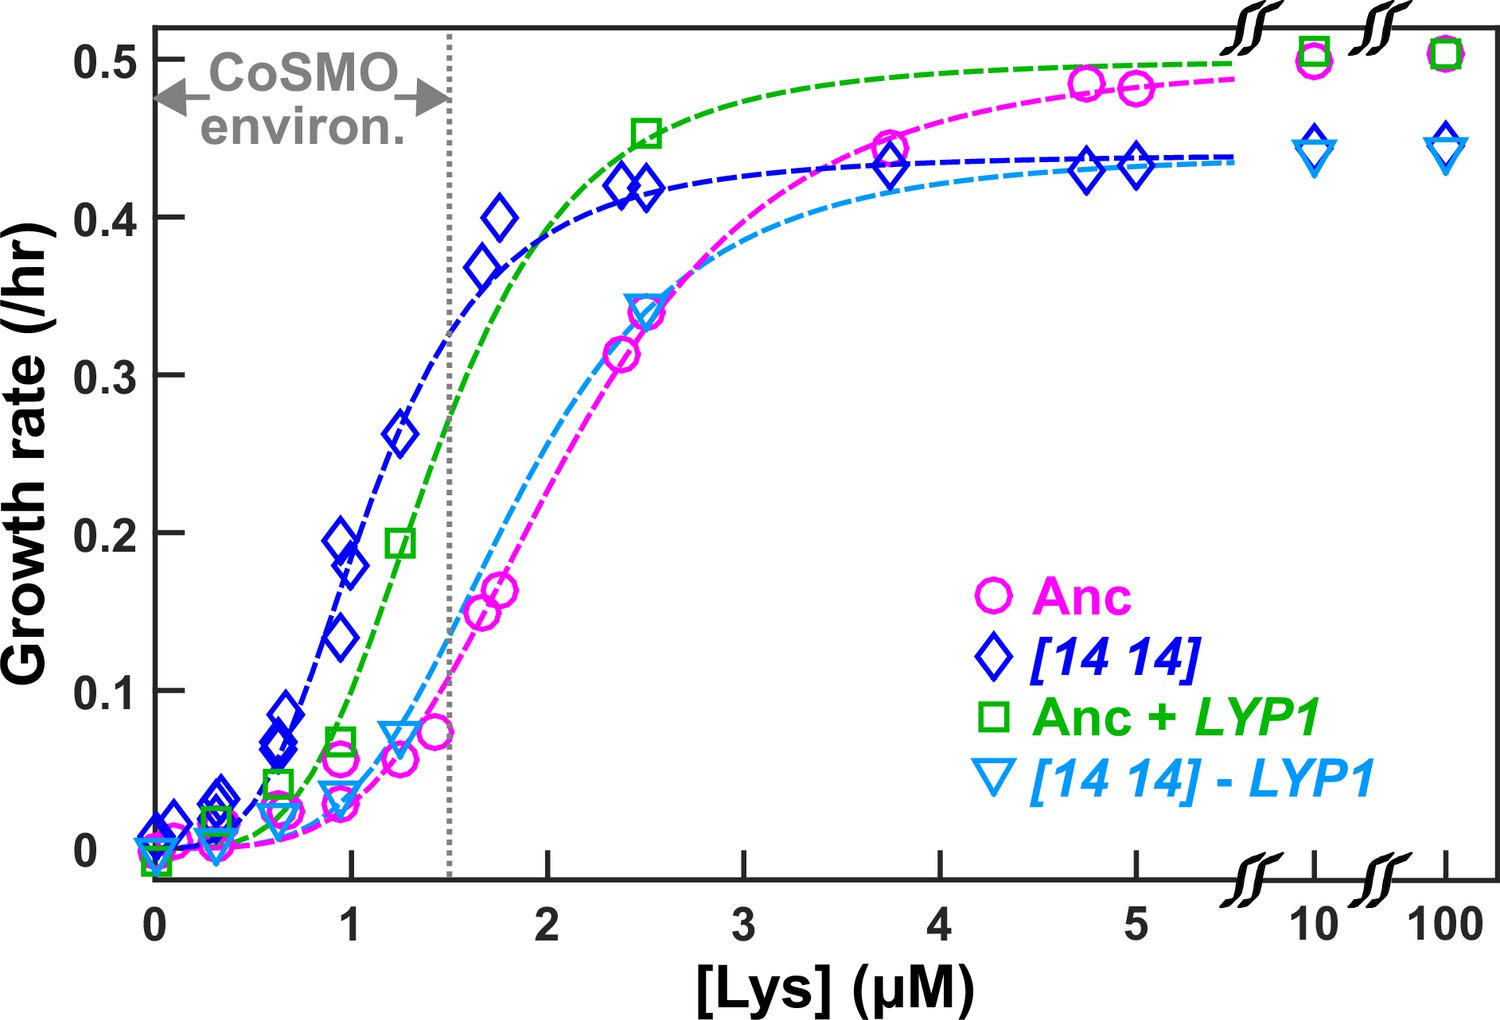
DISOMY14 improves L-H+ growth rate under lysine limitation via duplication of the high-affinity lysine permease LYP1.
Exponentially-growing cells were washed free of lysine, starved in minimal medium SD for 3~5 hrs to deplete vacuolar lysine storage, and incubated in microtiter wells containing SD supplemented with various concentrations of lysine. Cells were imaged using a fluorescence microscope, and total fluorescence was tracked over time (Materials and methods; “Microscopy growth assay”) (Hart et al., 2019b). The maximal growth rate (the steepest positive slope of ln[fluorescence] against time) was quantified and plotted against lysine concentration. The grey dotted line demarcating “CoSMO environ.” corresponds to the lysine level supporting a growth rate of ≤ 0.1/hr as observed in ancestral CoSMO. DISOMY14 (“[14 14]”, blue diamond; WY2261) grew faster than the ancestral L-H+ (magenta circle; WY1335) in low lysine. This self-serving phenotype of DISOMY14 was abolished when the duplicated LYP1 gene was deleted form DISOMY14 (cyan triangle; WY2262, WY2263). Conversely, introducing an extra copy of LYP1 into the ancestor improved grow rate in limited lysine (green square; WY2254, WY2255). Each data point is the average of multiple (~4) experiments. Dashed fitting curves: Moser growth equation where is growth rate of L-H+, L is lysine concentration, is the maximal growth rate in excess lysine, K is the lysine concentration supporting , and n is the “growth cooperativity” constant describing the sigmoidal shape of the curve. The maximal growth rate of DISOMY14 is lower than that of the ancestor, which could be due to the fitness cost associated with aneuploidy (Oromendia et al., 2012). Data can be found in Figure 2—source data 1.
-
Figure 2—source data 1
Data plotted in Figure 2.
- https://doi.org/10.7554/eLife.44812.009
Figure 2—figure supplement 1
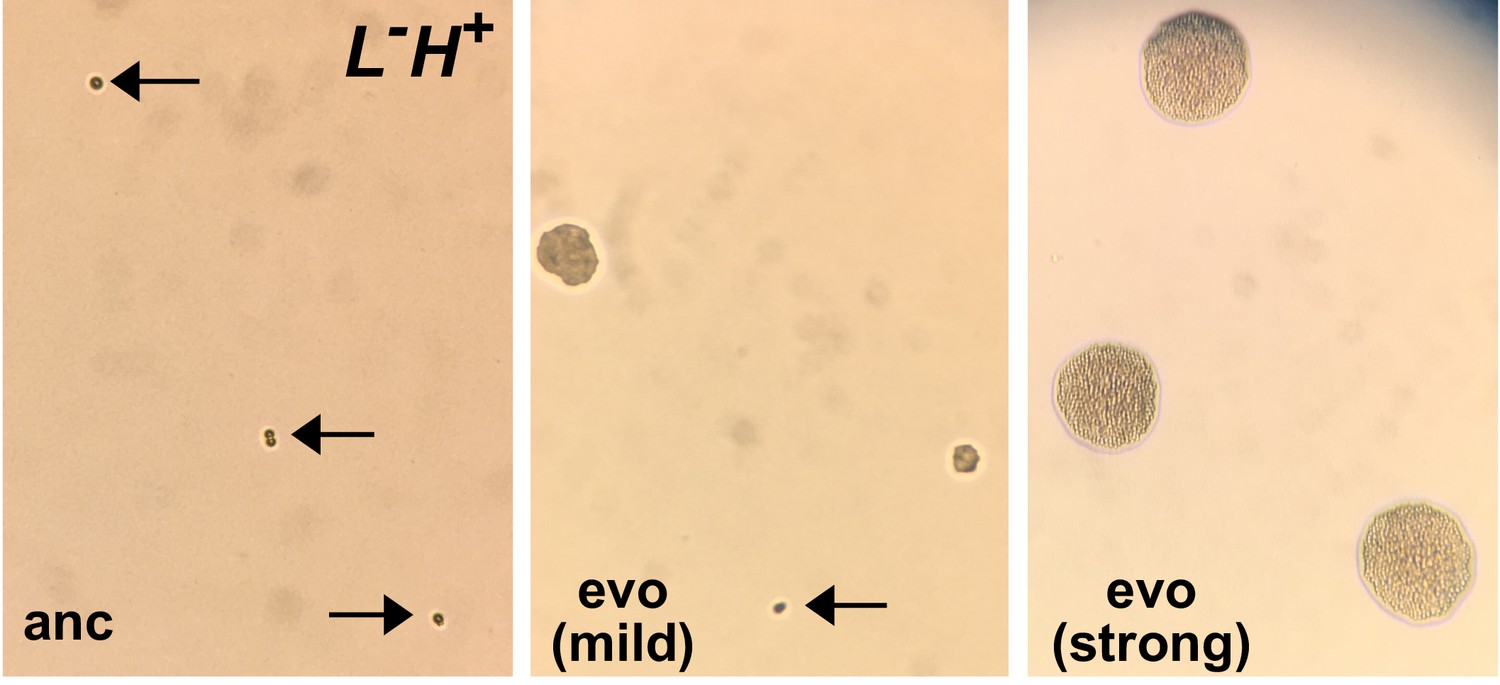
Micro-colony assay distinguishes ancestral from evolved L-H+ clones.
An ancestral clone (left) and two evolved L-H+ clones (center and right) were plated on SD plates supplemented with 1.5 µM lysine. Ancestral cells (WY1335, left) failed to divide (arrows). Cells from a mildly-adapted evolved clone (harboring duplication of Chromosome 14, center) showed heterogeneous phenotypes: some cells remained undivided (arrow, perhaps resulting from reversion to euploidy during pre-growth), while other cells formed microcolonies of various sizes. Cells from a strongly-adapted evolved clone (harboring an ecm21 mutation, right) formed microcolonies of a uniform and large size. These images were taken using a cell phone camera and thus do not have a scale bar. For reference, an average yeast cell has a diameter of ~5 µm. This figure and figure legend are adapted from Hart et al. (2019a) (original figure published under a CC-BY 4.0 license, https://creativecommons.org/licenses/by/4.0/).
Figure 2—figure supplement 2

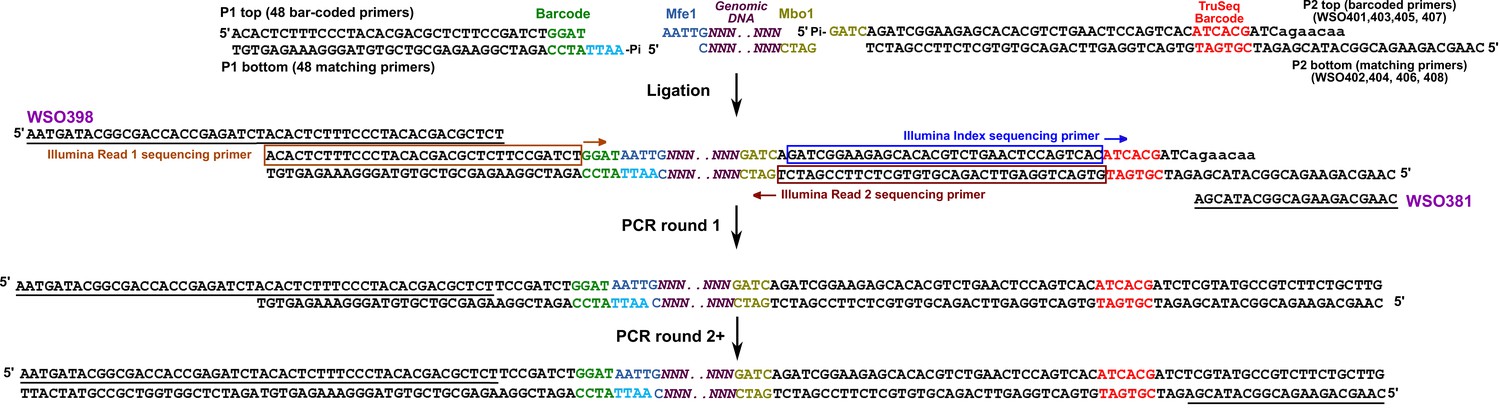
Whole genome sequencing Nextera V2.
Schematic for whole genome sequencing using Nextera V2. Sequences for primers can be found in Supplementary file 4. The cyan and orange regions right next to gDNA are added by the transposase during DNA fragmentation (tagmentation).
Figure 3 with 5 supplements
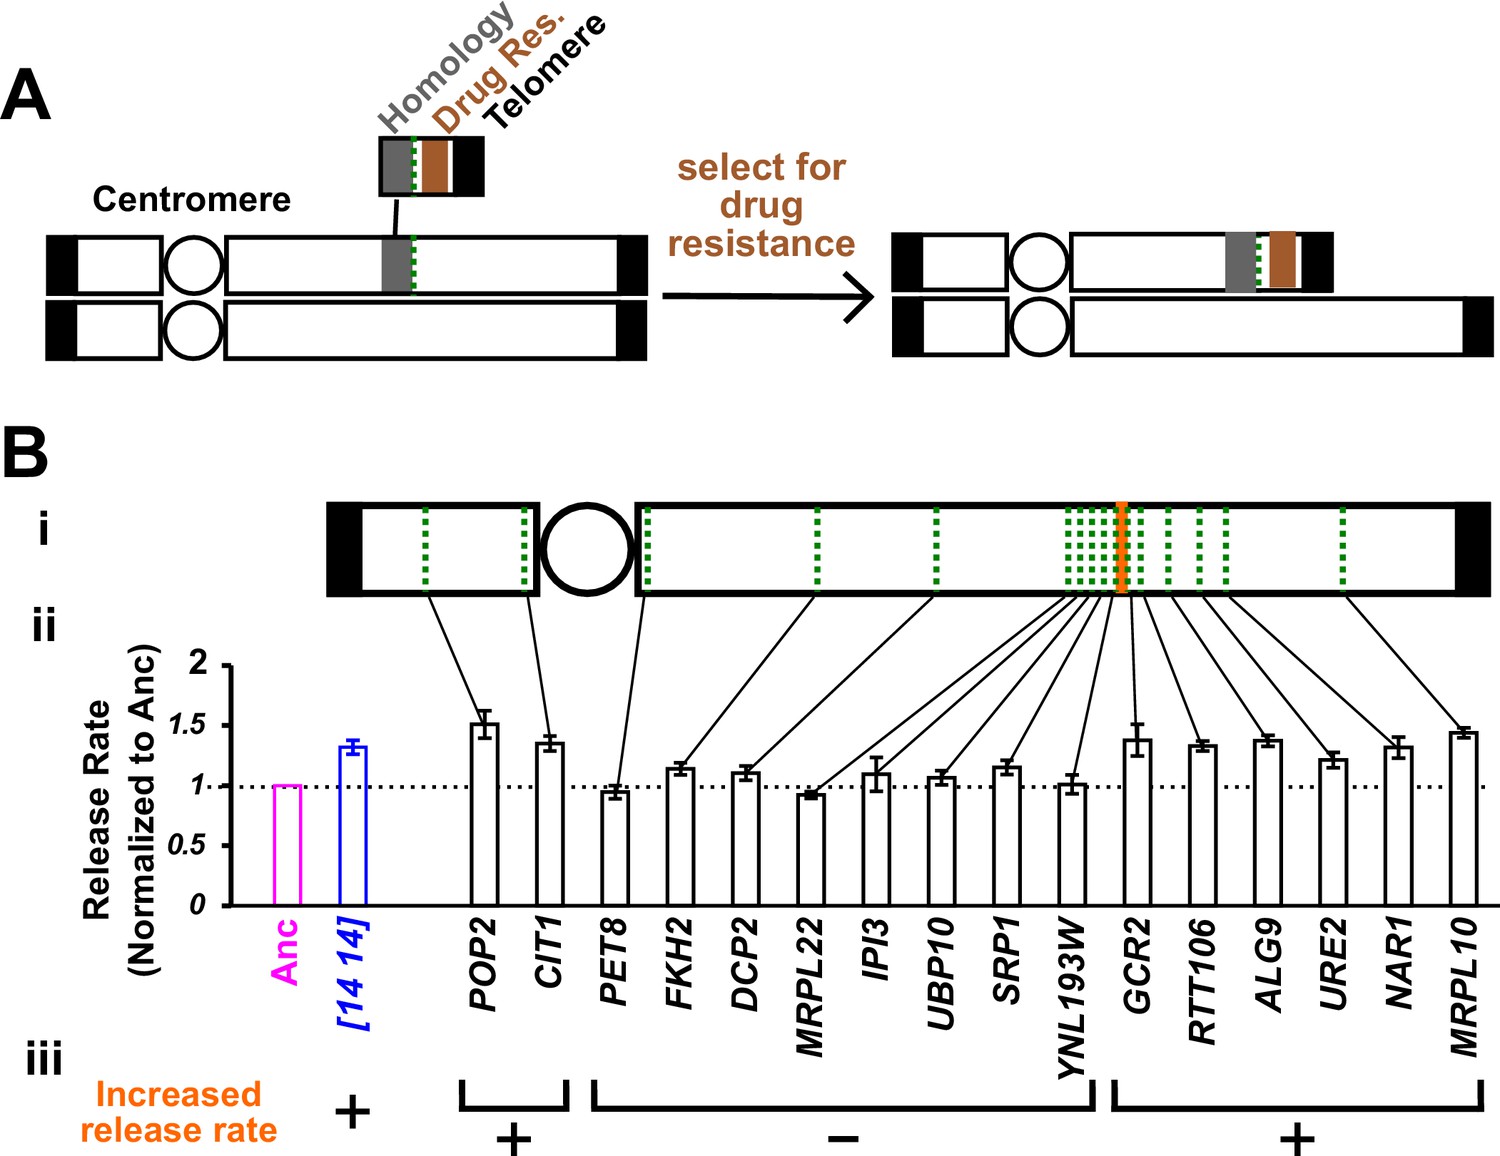
Chromosome truncation reveals the genomic region responsible for increased hypoxanthine release rate.
(A) Chromosome truncation scheme. Recombination occurs between a chromosome and a truncation cassette containing a homology region, a drug resistance marker, and a telomere (Materials and methods, ‘Chromosome truncation’). Single integration leads to the truncation of one of the duplicated chromosomes, with the centromere (circle)-containing region being retained by the cell. Integration into both chromosomes would lead to an inviable cell due to loss of the segment immediately distal to the insertion site from both chromosomes (not drawn). The copy number of chromosomal regions in transformants was verified by RADseq (Materials and methods, ‘RADseq’; Figure 3—figure supplement 4). (B) The genomic region between YNL193W and GCR2 is responsible for increased hypoxanthine release rate. We systematically truncated chromosome 14 in DISOMY14 cells (WY2261). We chose truncation sites (green dotted lines) that were spread across chromosome 14, and in later rounds of truncation, spread across the region of interest (i). We quantified hypoxanthine release rates of transformants in starvation batch cultures (Materials and methods, ‘Release assay’; Figure 3—figure supplement 1), normalized them against the release rate of the ancestral strain measured in the same experiment, and plotted the mean value and two standard errors of mean (ii). Duplication of the region between YNL193W and GCR2 (orange; containing six genes including YNL193W and excluding GCR2) is responsible for the increased hypoxanthine release rate (iii). Data can be found in Figure 3—source data 1.
-
Figure 3—source data 1
Data plotted in Figure 3.
- https://doi.org/10.7554/eLife.44812.018
Figure 3—figure supplement 1

Starvation batch culture release assay.
This figure is adapted from Figure 5 of Hart et al. (2019a) (original figure published under a CC-BY 4.0 license, https://creativecommons.org/licenses/by/4.0/). (A) Hypoxanthine release during lysine starvation. Exponential L-H+ cells were washed free of lysine, and diluted into minimal medium SD without lysine. Live and dead population densities and supernatant hypoxanthine concentrations were measured over time (Materials and methods, ‘Flow cytometry’; ‘Bioassay’). (B) (Left) If hypoxanthine was released by live cells at a constant rate, then hypoxanthine concentration should scale linearly against live cell density integrated over time (similar to using 'man*hour' for measuring total work load). (Right) If hypoxanthine was released upon cell death, then hypoxanthine concentration should scale linearly against dead cell density. Live release model has better linearity than dead release model, and therefore hypoxanthine is likely released by live cells. Live cell release was corroborated by metabolite extraction experiments (Hart et al., 2019a). Data used to generate these plots can be found in Hart et al. (2019a).
Figure 3—figure supplement 2
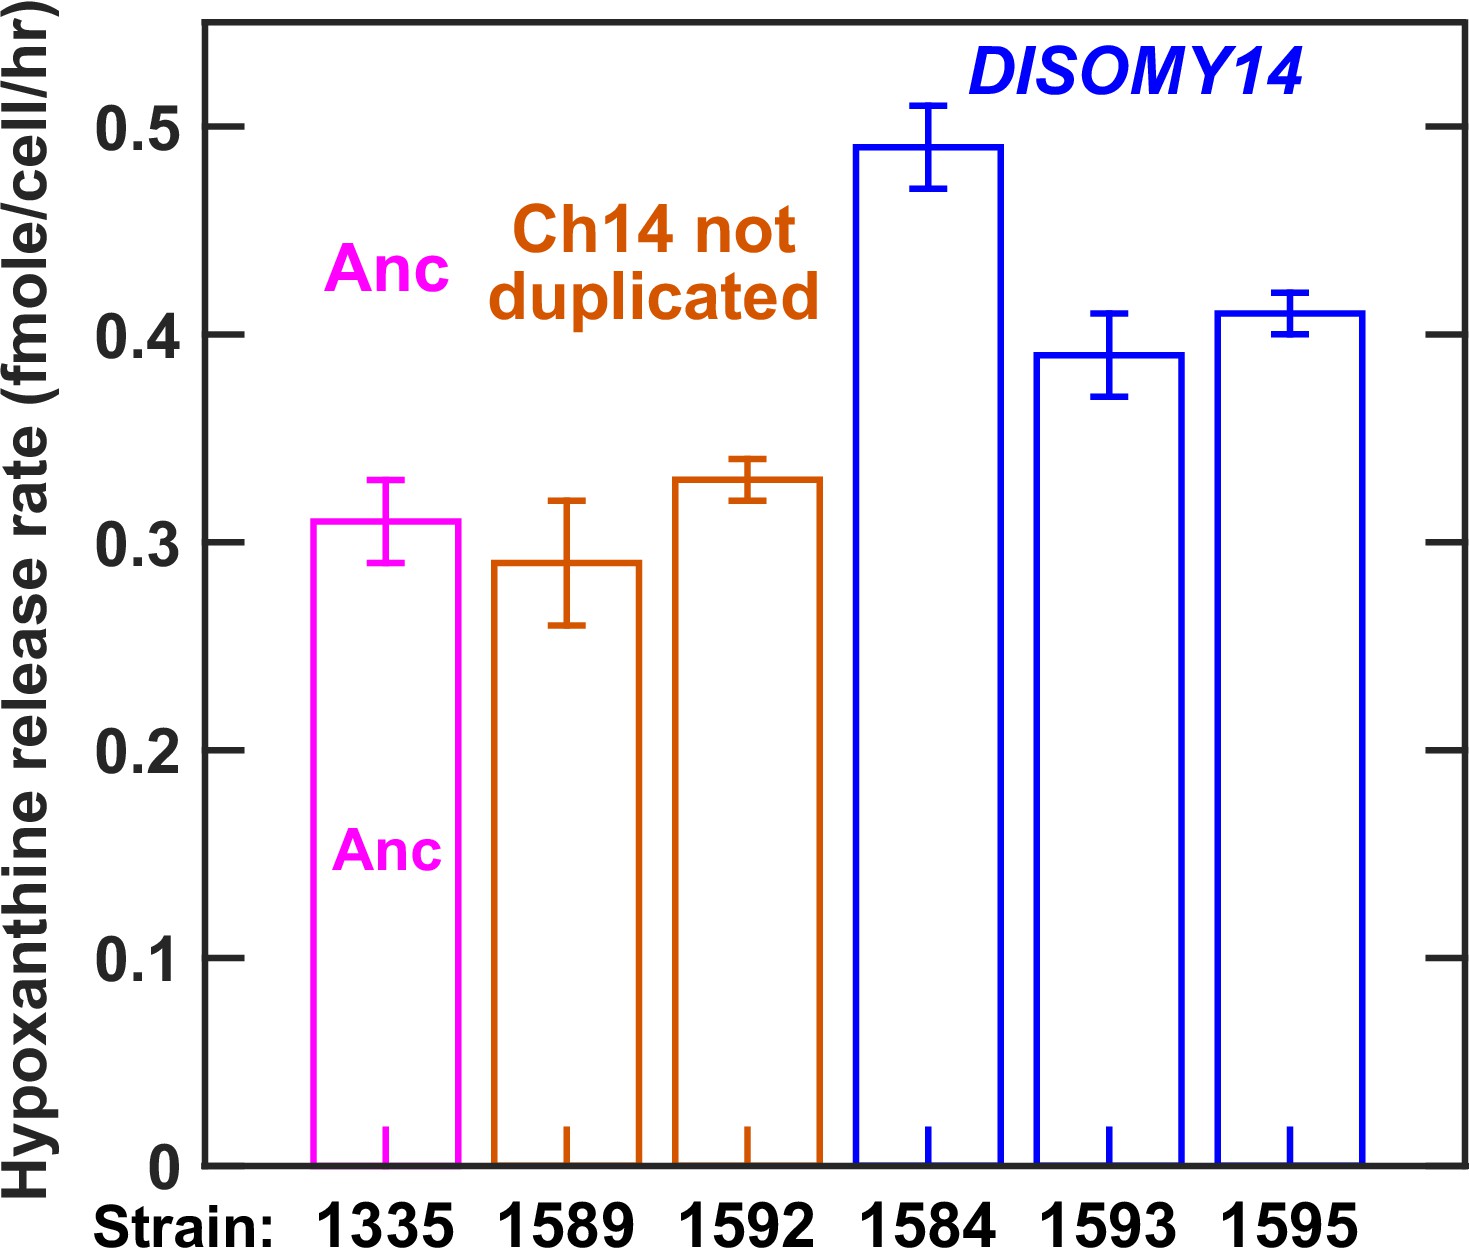
Evolved L-H+ clones with improved hypoxanthine release rates harbored Chromosome 14 duplication.
Our previous work has established that hypoxanthine is released by live L-H+ cells (Hart et al., 2019a), and that hypoxanthine release rate is relatively constant regardless of whether cells are starved of lysine or grown in lysine-limited chemostats mimicking the community environment (Hart et al., 2019a). Since starvation release is easier to measure, we quantified hypoxanthine release rates of L-H+ clones in starvation batch cultures (Materials and methods, ‘Release assay’). As shown later, we obtained similar results in lysine-limited chemostats mimicking the CoSMO environment. Specifically in this experiment, we grew ancestral and evolved L-H+ clones to exponential phase in SD supplemented with excess lysine, and washed the cultures free of lysine with SD. We then starved each culture for 24 hr at 30 ˚C during which we sampled approximately every 6 hr to measure live cell density (Materials and methods, ‘Flow cytometry’) and supernatant hypoxanthine concentration (Materials and methods, ‘Bioassay’). From these dynamics, we calculated hypoxanthine release rate (Materials and methods, ‘Release assay’; Figure 3—figure supplement 1). Release rates are plotted here with error bars indicating two standard errors of mean (SEM) of at least four measurements. Evolved clones harboring chromosome 14 duplication (blue) exhibited increased hypoxanthine release rate per cell in comparison to the ancestor (magenta), while evolved clones without chromosome 14 duplication (orange) exhibited the ancestral release rate. Data can be found in Figure 3—figure supplement 2—source data 1.
-
Figure 3—figure supplement 2—source data 1
Data plotted in Figure 3—figure supplement 2.
- https://doi.org/10.7554/eLife.44812.013
Figure 3—figure supplement 3
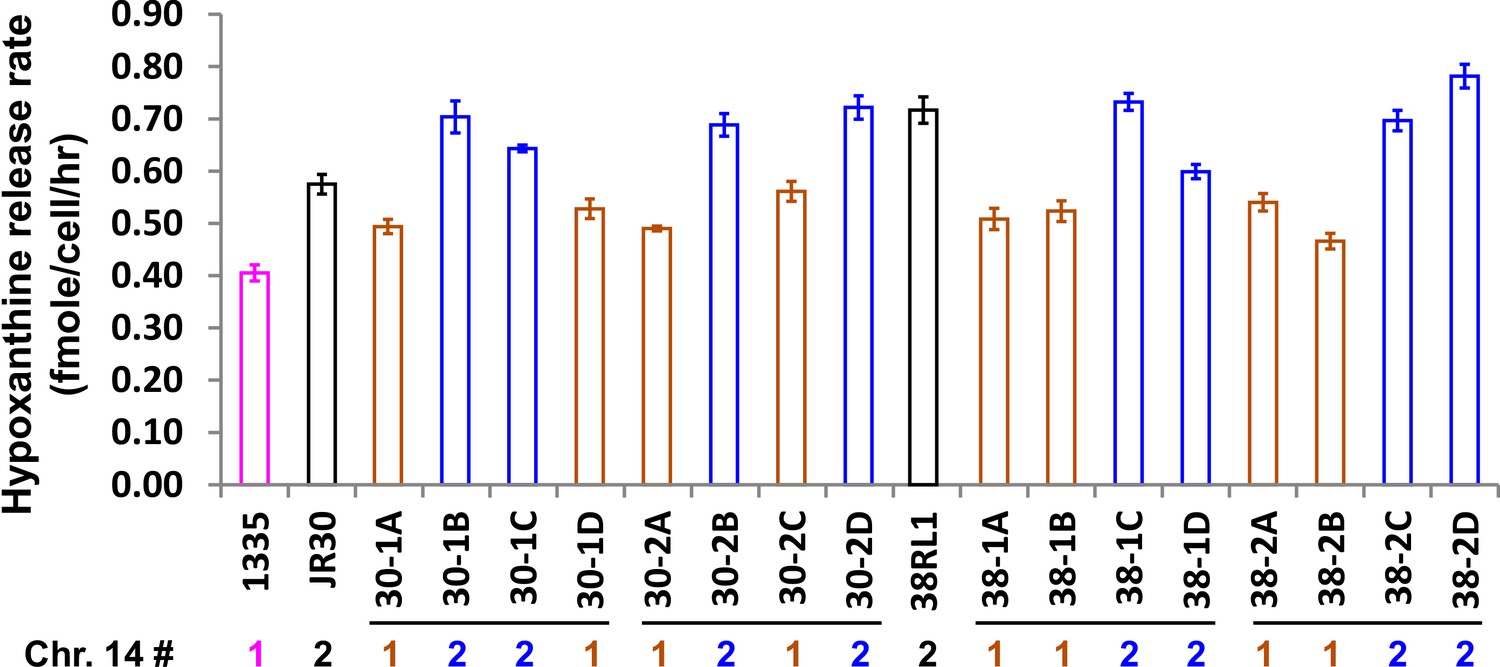
Increased hypoxanthine release rate segregates with DISOMY14.
We crossed evolved clones JR30 (WY1593; black) and 38RL1 (WY1584; black) containing DISOMY14 with an ancestral strain containing one copy of chromosome 14. When we dissected tetrads (four spores/tetrad as marked by horizontal lines), the hypoxanthine over-release phenotype (blue, measured in starvation batch cultures) segregated with DISOMY14 (Materials and methods, ‘RADseq’). The release rate of the ancestral strain (WY1335, magenta) is plotted as a comparison. Data can be found in Figure 3—figure supplement 3—source data 2, Sheet ‘Plots’.
-
Figure 3—figure supplement 3—source data 2
Data plotted in Figure 3—figure supplement 3.
- https://doi.org/10.7554/eLife.44812.015
Figure 3—figure supplement 4
RADseq.
Schematic for RADseq using TruSeq. For detailed information, see Materials and methods ‘RADseq’. Sequences for primers can be found in Supplementary file 5.
Figure 3—figure supplement 5
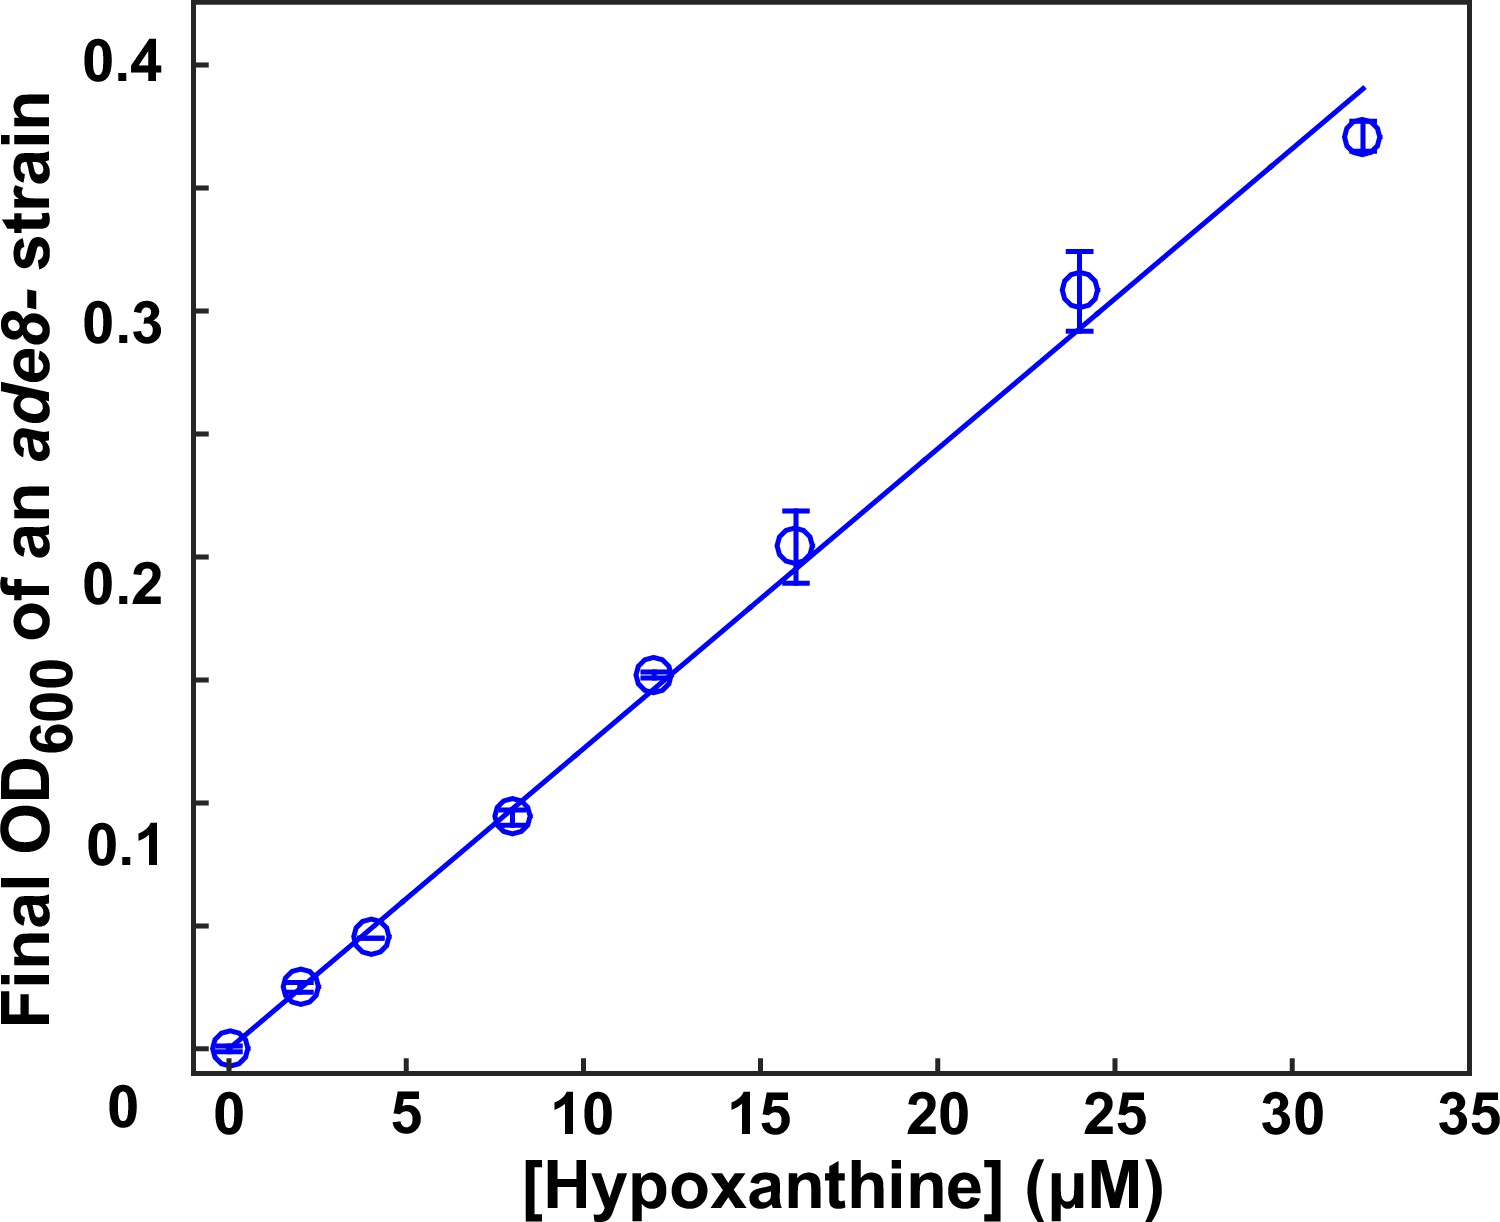
Bioassay.
This figure is adapted from S3 Fig of Hart et al. (2019a) (original figure published under a CC-BY 4.0 license, https://creativecommons.org/licenses/by/4.0/). The final turbidity of an ade8- (WY1340) tester strain increases with increasing concentrations of hypoxanthine in a linear fashion (within the tested concentration range). Data can be found in Hart et al. (2019a).
Figure 4 with 3 supplements
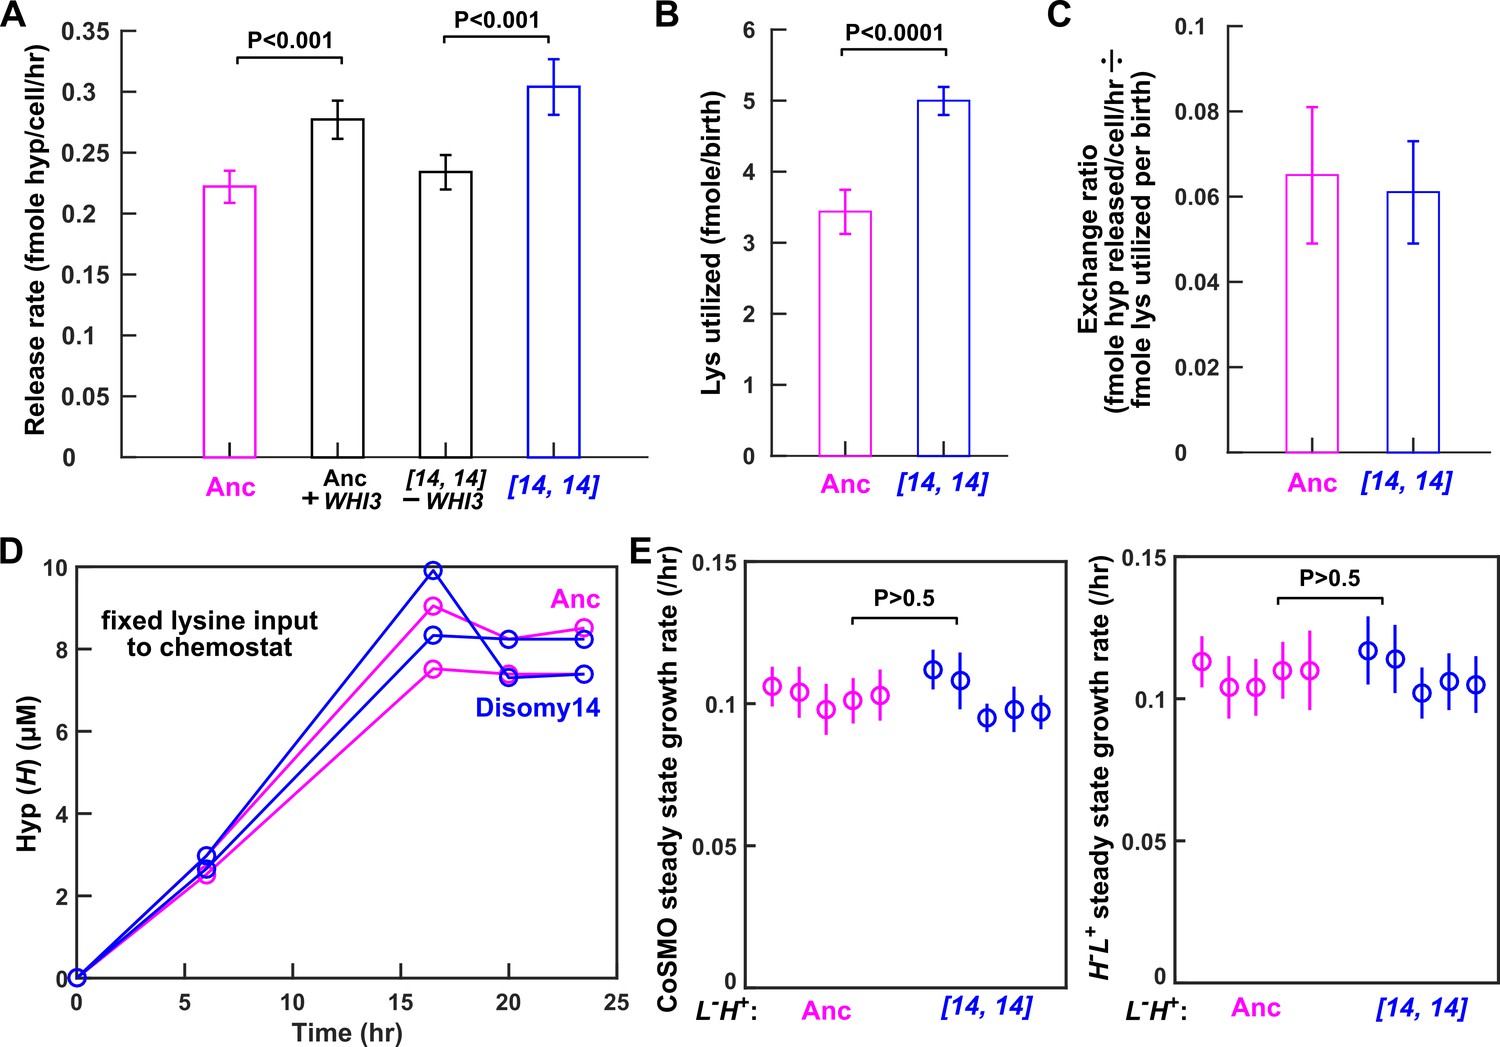
Despite increased release rate per cell, DISOMY14 is not partner-serving.
(A) WHI3 duplication is responsible for increased hypoxanthine release rate per cell. Introducing an extra copy of WHI3 into the ancestral background (WY2357 ~2359) increased hypoxanthine release rate per cell. Deleting the duplicated WHI3 from DISOMY14 (WY2350 ~2352) decreased release rate (Materials and methods, 'Release rate'; starvation batch culture). (B) DISOMY14 utilizes more lysine per birth than the ancestor (Materials and methods, 'Metabolite utilization in batch culture'). For A and B, mean and two SEM are plotted. (C) Indistinguishable exchange ratio between ancestor and DISOMY14. Hypoxanthine release rate per L-H+ cell (A) is divided by lysine utilization per L-H+ birth (B). Error bars are calculated via error propagation (Materials and methods, 'Calculating uncertainty of ratio'). (A–C) were measured in starvation batch cultures. (D) In chemostats fed with a fixed lysine supply rate, DISOMY14 and ancestor release the same total hypoxanthine. Ancestor (WY1335, magenta) or DISOMY14 (WY2349, blue) L-H+ cells were grown in lysine-limited chemostats with a doubling time of 6 hr (Materials and methods, ‘Chemostat’). Supernatant hypoxanthine concentrations were quantified using a yield-based bioassay (Materials and methods, ‘Bioassay’; Figure 3—figure supplement 5). For complete data and statistical comparison, see Figure 4—figure supplement 2. (E) DISOMY14 and ancestral L-H+ led to identical growth rate of community and of partner. To prevent rapid evolution in L-H+ (Hart et al., 2019a), we grew CoSMO in a spatially-structured environment on agarose pads (Materials and methods, ‘Community growth rate’), and periodically measured the absolute abundance of the two strains (differentiable by their fluorescence; Materials and methods, ‘Flow cytometry’). We then quantified the steady state growth rate of community and of partner H-L+ by regressing ln(cell density) against time after the initial lag phase up to <108 cells (Hart et al., 2019a; see Figure 4—figure supplement 3 for examples of detailed dynamics). We plotted the slope (i.e. growth rate), with error bars indicating 2x standard error of estimating the slope. In A, B, and E, we performed statistical comparisons first using the F-test to test for equal variance, and then using unpaired two-tailed t-test with equal variance. We plotted the corresponding P-values of the t-test (the probability of observing a test statistic as extreme as, or more extreme than, the observed value under the null hypothesis of two groups belonging to the same distribution). Comparisons in A and B show significant difference, while those in E are not significantly different. All data can be found in Figure 4—source data 1.
-
Figure 4—source data 1
Data plotted in Figure 4.
- https://doi.org/10.7554/eLife.44812.023
Figure 4—figure supplement 1

WHI3 duplication increases cell size and lysine utilization per birth.
Introducing an extra copy of WHI3 into the ancestral background (WY2357 ~2359) increased cell size and lysine utilization per birth. Deleting the duplicated WHI3 from DISOMY14 (WY2350 ~2352) decreased cell size and lysine utilization per birth (Materials and methods, 'Cell size measurements' and 'Metabolite utilization in batch culture'). Duplicating or deleting WHI3 did not always result in a full phenotype switch to or from DISOMY14 phenotype, but always resulted in a significant change in phenotype from the parent strain. For example, duplicating WHI3 in the ancestor resulted in a significant increase in lysine required per new cell, but not to the level of DISOMY14. This could be due to the integrated WHI3 copy not being expressed to the same extent as the duplicated WHI3 copy in DISOMY14, or due to duplication of other genes in DISOMY14, or due to mutations in other chromosomes of the DISOMY14 strain. Mean and two SEM are plotted. P-values are from two-tailed t-test assuming equal variance (equal variance being tested via the F-test). Data can be found in Figure 4—source data 1, ‘CellSize’ sheet and ‘Consumption’ sheet, respectively.
Figure 4—figure supplement 2

In chemostats, DISOMY14 and ancestor share identical exchange ratio.
(A) Chemostat population dynamics. Ancestor (WY1335, magenta) or DISOMY14 (WY2349, blue) L-H+ cells were grown in separate, lysine-limited chemostats (Materials and methods, ‘Chemostat’). Live and dead population densities were tracked using flow cytometry (Materials and methods, ‘Flow cytometry’). Supernatant hypoxanthine concentrations are plotted in Figure 4D. (B) DISOMY14 is not partner-serving. We quantified hypoxanthine release rate (Materials and methods, ‘Chemostat’ Equation S6), lysine utilization per new cell (Materials and methods, ‘Chemostat’ Equation S5), and exchange ratio (Materials and methods, ‘Chemostat’ Equation S7) for ancestor and DISOMY14, using the steady state data from 15 ~ 24 hr. Compared to the ancestor, DISOMY14 displayed higher hypoxanthine release rate per cell and higher lysine utilization per birth, regardless of whether we treated 6 hr doubling time chemostat data (circles) and 8 hr doubling time chemostat data (diamonds) as separate groups or as a single group. P values were calculated from two-tailed t-test assuming equal variance (equal variance being tested by the F-test). Ancestor and DISOMY14 have significantly different hypoxanthine release rate per cell and lysine utilization per birth, but their exchange ratios are similar. Data can be found in Figure 4—source data 1, 'Chemostat'.
Figure 4—figure supplement 3
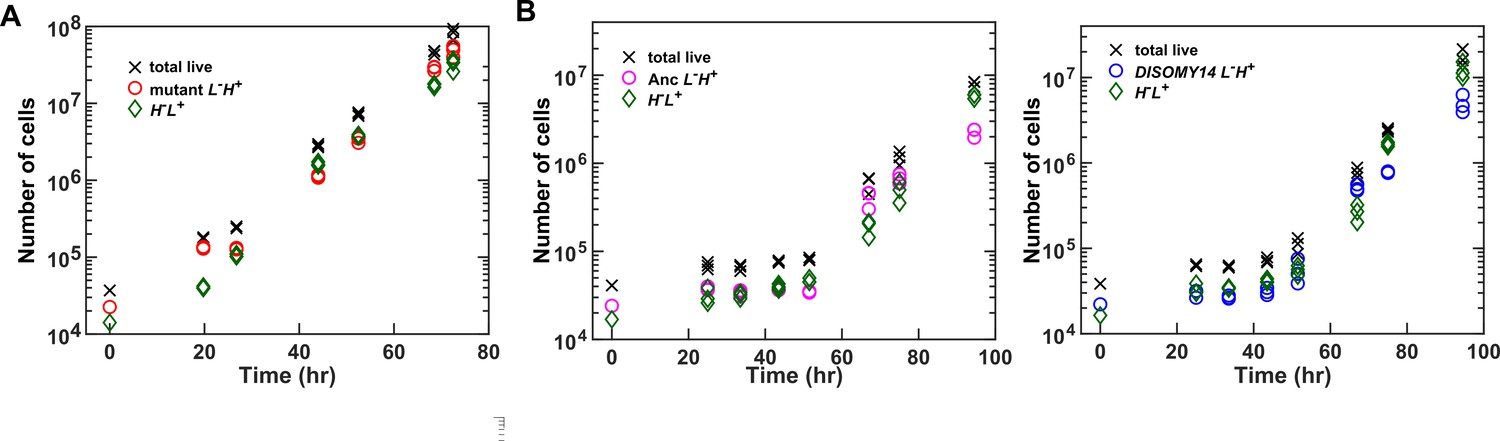
CoSMO growth dynamics.
(A) Exponential community growth lasting to 108 total cells. (B) Examples of CoSMO dynamics consisting of ancestral or DISOMY14 L-H+. The duration of the lag phase can vary with the area of the inoculation spot (and thus the initial surface cell density). Data can be found in Figure 4—source data 1, ‘GrowthDynamics’.
Figure 5
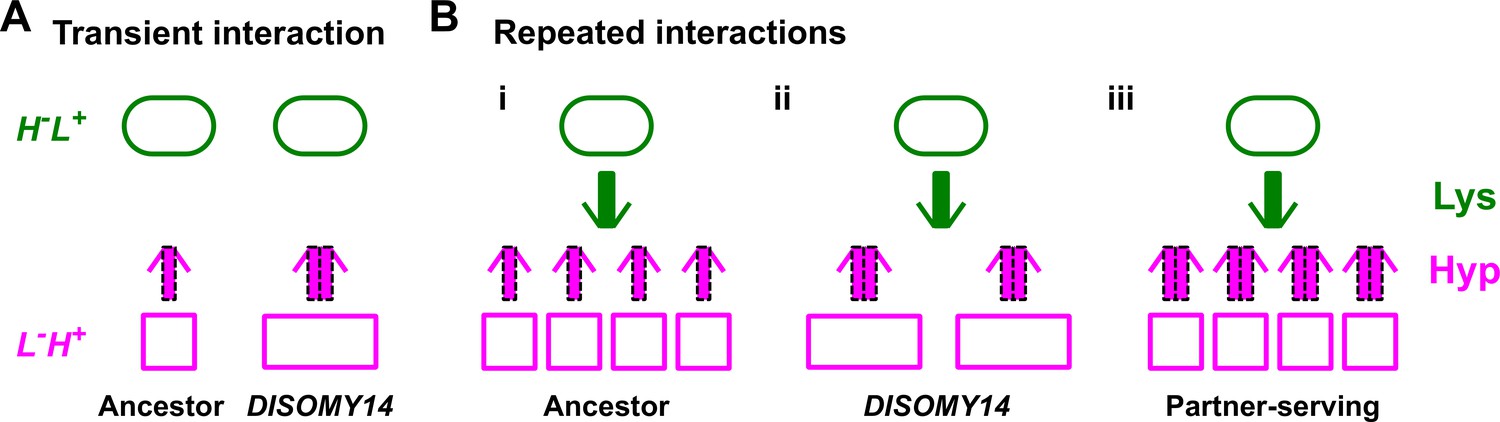
Schematic illustration of partner-serving mutations.
(A) Transient interaction. At the initial stage of an interaction, DISOMY14 with an increased release rate per cell (2x thick purple arrow) is more partner-serving than the ancestor (1x thick purple arrow). (B) Long-term repeated interactions. Over multiple generations, DISOMY14 is not partner-serving. Even though each DISOMY14 cell releases more hypoxanthine than each ancestral cell, a fixed amount of lysine (green arrow) is turned into more ancestral cells than DISOMY14 cells (compare i and ii). A true partner-serving mutation should increase exchange ratio (iii), which is expressed as total benefit supply rate per intake benefit, or (benefit supply rate per cell)/(benefit amount utilized to make the cell).
Additional files
-
Supplementary file 1
Foresight, hindsight, insight, and the blur in-between.
- https://doi.org/10.7554/eLife.44812.025
-
Supplementary file 2
Strain table.
- https://doi.org/10.7554/eLife.44812.026
-
Supplementary file 3
Mutations in evolved L-H+.
- https://doi.org/10.7554/eLife.44812.027
-
Supplementary file 4
Whole genome sequencing primer sequences.
- https://doi.org/10.7554/eLife.44812.028
-
Supplementary file 5
RADseq primer sequences.
- https://doi.org/10.7554/eLife.44812.029
-
Transparent reporting form
- https://doi.org/10.7554/eLife.44812.030
Download links
A two-part list of links to download the article, or parts of the article, in various formats.
Downloads (link to download the article as PDF)
Open citations (links to open the citations from this article in various online reference manager services)
Cite this article (links to download the citations from this article in formats compatible with various reference manager tools)
Disentangling strictly self-serving mutations from win-win mutations in a mutualistic microbial community
eLife 8:e44812.
https://doi.org/10.7554/eLife.44812


