Hemodynamic-mediated endocardial signaling controls in vivo myocardial reprogramming
- University of California, San Diego, United States
- Fudan University, China
- Massachusetts General Hospital and Harvard Medical School, United States
- Centre National de la Recherche Scientifique, UMR7104, INSERM U964, Université de Strasbourg, France
Figures
Figure 1 with 4 supplements
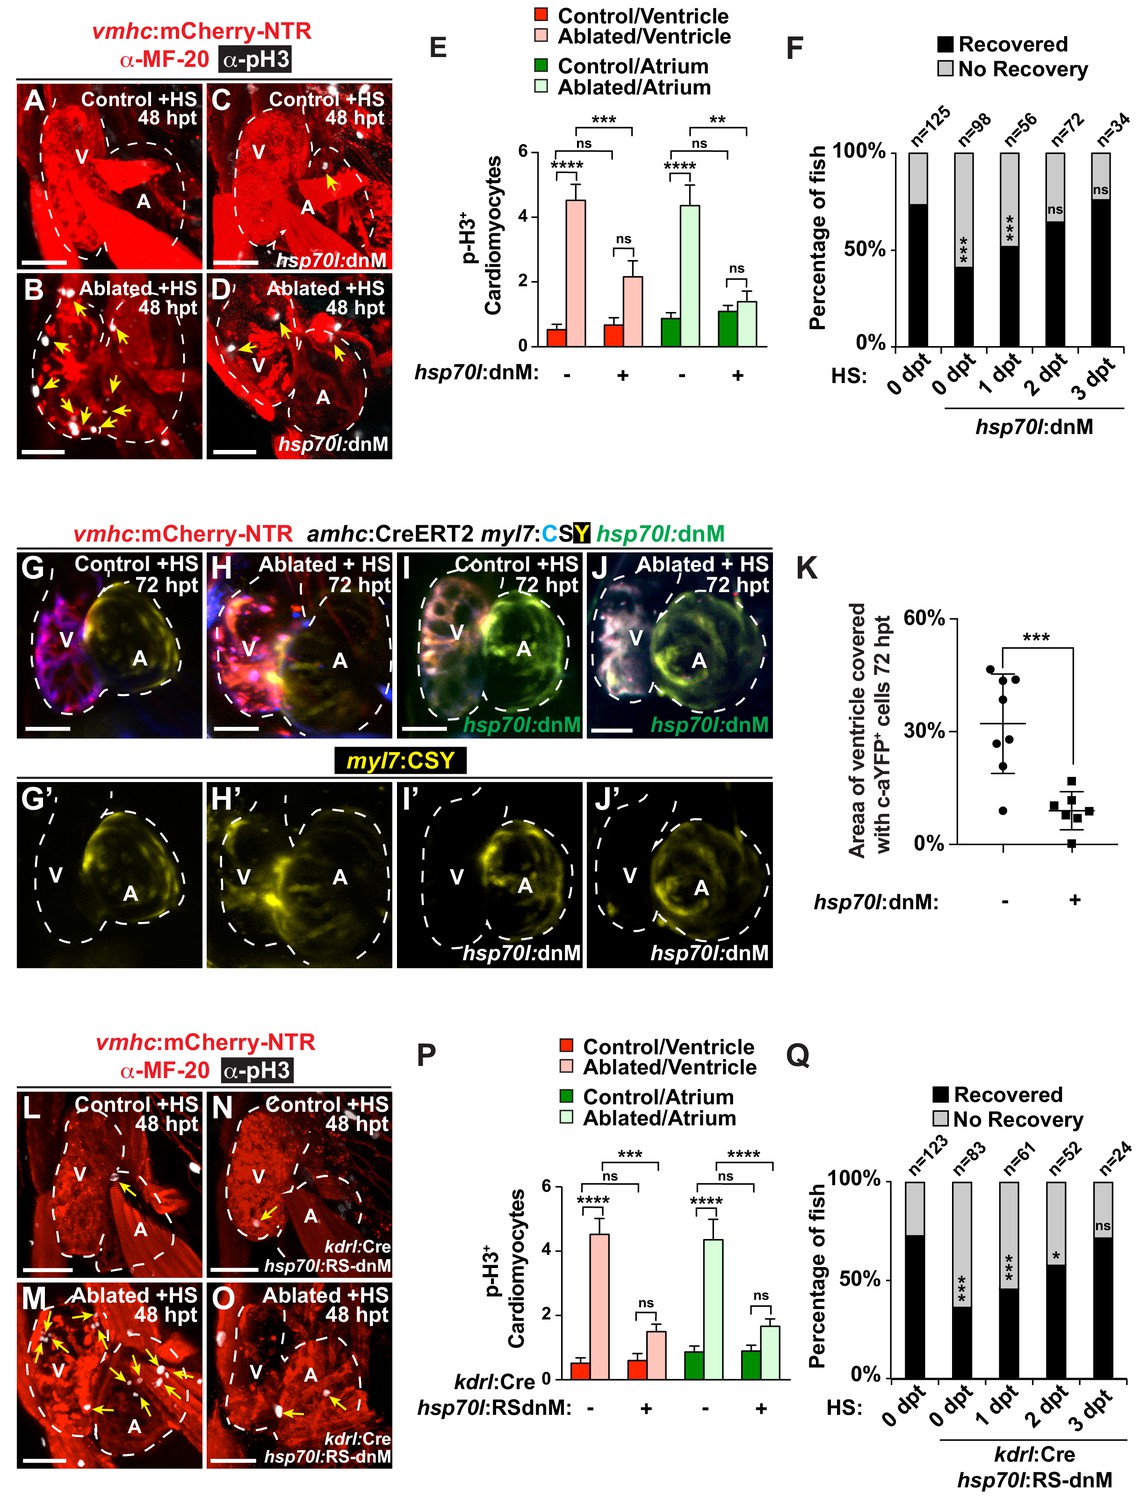
Endocardial Notch signaling controls myocardial reprogramming and cardiac regeneration.
(A–D, L–O) Confocal microscopy imaging of heat-shocked/HS (A, B, L, M) vmhc:mCherry-NTR, (C, D) vmhc:mCherry-NTR; hsp70l:dnM and (N, O) vmhc:mCherry-NTR; kdrl:Cre; hsp70l:RS-dnM hearts reveals that (D) global or (O) endocardial-specific dnMAML (dnM) Notch inhibition inhibits CM proliferation in ventricle-ablated hearts at 48 hpt (7 dpf) when compared to (B, M) CM proliferation in control ventricle-ablated (no dnMAML) hearts. White – anti-phospho-histone H3 immunostaining; red – anti-MF-20 immunostaining. Arrows point to proliferating CMs. (E, P) Quantitation of anti-phospho-histone H3+ CMs in these hearts confirms that (E) global or (P) endocardial-specific dnM Notch inhibition prevents CMs from proliferating in injured hearts (n = 23, control dnM-; 31, MTZ dnM-; 10, control dnM+; 18, MTZ dnM+; 16, control RSdnM-; 16, MTZ RSdnM-; 15, Control RSdnM+; 15, MTZ RSdnM-). Red bars – ventricle; green bars – atrium; dark bars – control sham-ablated hearts; light bars – ventricle-ablated hearts. (F, Q) Quantitation of the percentage of heat-shocked vmhc:mCherry-NTR, vmhc:mCherry-NTR; hsp70l:dnM and vmhc:mCherry-NTR; kdrl:Cre; hsp70l:RS-dnM ventricle-ablated hearts that display recovered ventricular tissue and contractility (black bars) at 96 hpt (nine dpf) shows that (F) global or (Q) endocardial-specific Notch inhibition between 0 and 1 dpt leads to the greatest inhibitory effect on overall recovery from ventricle injury. The number of fish analyzed for each condition is indicated above each column. (G–K) To examine the effects of Notch signaling on cardiac reprogramming, (G, H) vmhc:mCherry-NTR; amhc:CreERT2; myl7:CSY and (I, J) vmhc:mCherry-NTR; amhc:CreERT2; myl7:CSY; hsp70l: dnMAML (dnM) hearts were exposed to tamoxifen at 5 dpf to genetically label atrial CMs with YFP (c-aYFP), then (G, I) sham-ablated (control) or (H, J) ventricle-ablated, and finally heat-shocked to (I, J) induce dnM expression. Confocal microscopy imaging at 72 hpt (8 dpf) reveals that (J) heat-shock induction of dnM inhibited the ability of genetically labeled c-aYFP+ atrial CMs to contribute to the regeneration of ventricle-ablated hearts when compared to (H) heat-shock control ventricle-ablated hearts. Yellow channel – (G’–J’) genetically labeled c-aYFP+ atrial CMs. (K) Quantitation of the percentage of ventricular area covered with c-aYFP+ CMs supports that dnMAML Notch inhibition prevents atrial CMs from regenerating the injured ventricle (n = 8 hsp70:dnM-, seven hsp70l:dnM+). All confocal images shown are maximum intensity projections. V, ventricle; A, atrium; dpf, days post-fertilization; hpt, hours post MTZ/DMSO treatment. Dashed lines outline the heart. Bar: 50 μm. (E, P) Mean + s.e.m. ANOVA; (K) Mean + s.d. Student’s t-test; (F, Q) Total numbers, Binomial test (versus 0 dpt); ns: p>0.05; *: p<0.05; **: p<0.01; ***: p<0.001; ****: p<0.0001. The following figure supplements are available for Figure 1.
-
Figure 1—source data 1
Source data for Figure 1 and Figure 1—figure supplements 1–3.
- https://doi.org/10.7554/eLife.44816.007
Figure 1—figure supplement 1
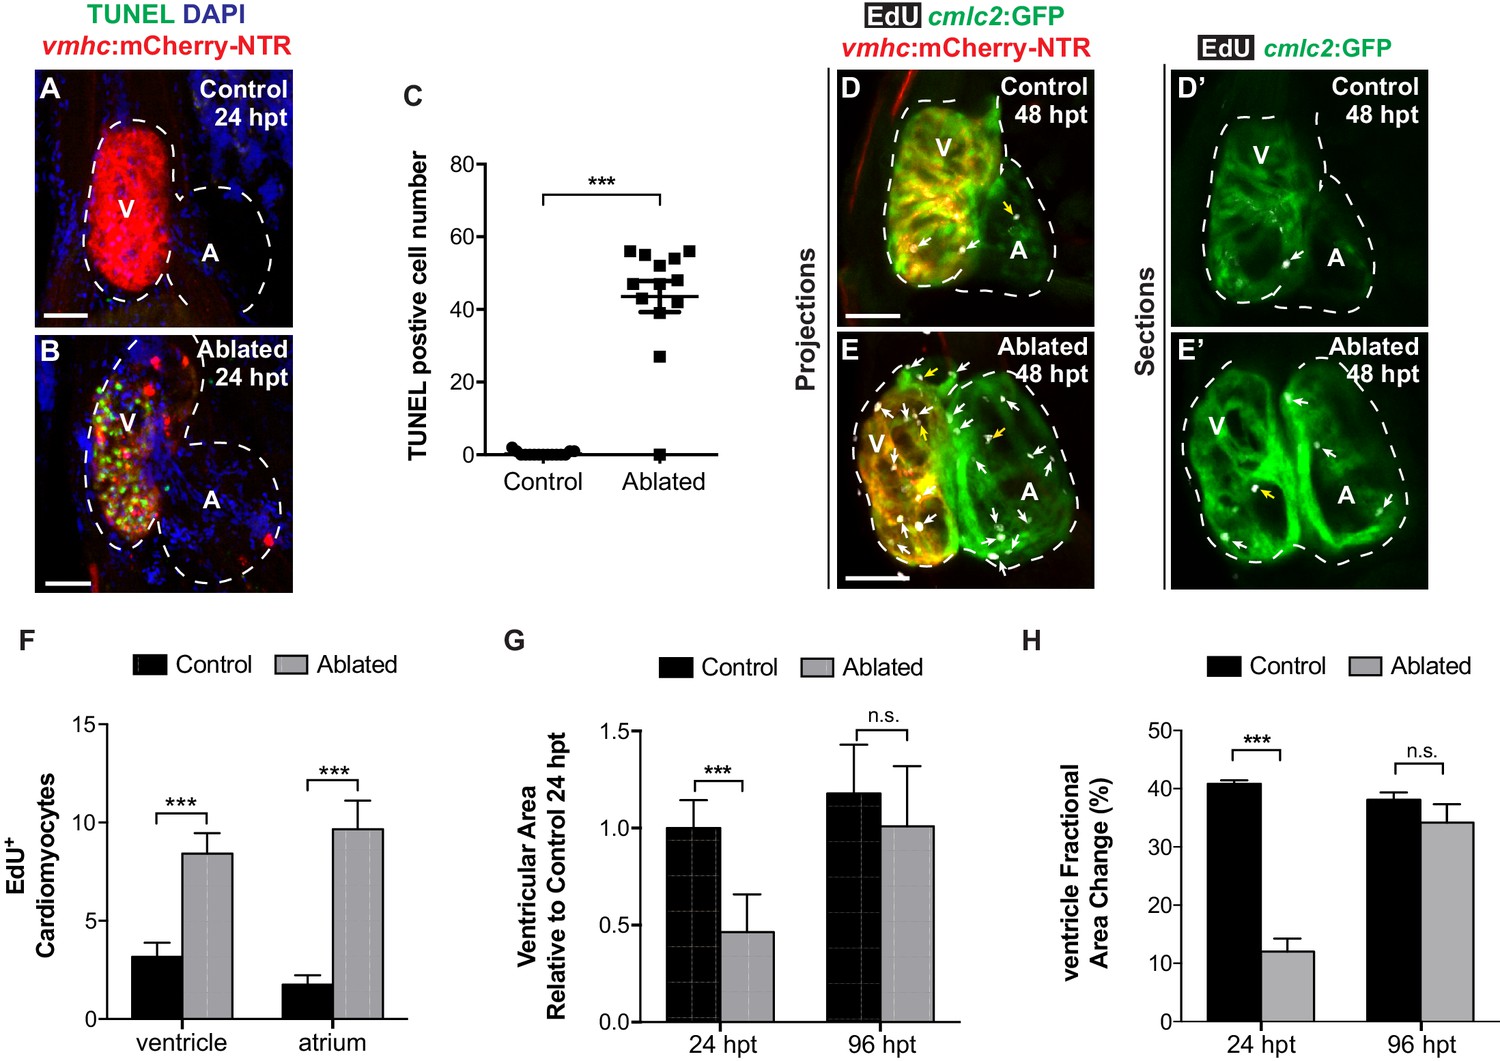
Metronidazole-ablated vmhc:mCherry-NTR ventricles display initial cardiomyocyte death, loss of ventricular tissue and impairment of contractile function but later exhibit cardiomyocyte proliferation and recovery of ventricular tissue and contractile function.
Following ventricular ablation, ventricular and atrial cardiomyocyte proliferation leads to cardiac recovery at 96 hpt. (A, B) Confocal maximum intensity projections of Tg(vmhc:mCherry-NTR) fish show extensive cell death as detected by TUNEL staining in the ventricles of (B) MTZ-treated fish when compared with (A) DMSO-treated controls at 24 hpt. (C) Quantitation of TUNEL-positive CMs in the ventricle of control (n = 15) and ablated (n = 13) fish hearts at 24 hpt confirms cell death is induced by MTZ treatment. (D, E) Confocal maximum intensity projections of Tg(cmlc2:GFP; vmhc:mCherry-NTR) fish show increased proliferation of CMs as detected by EdU+/cmlc2:GFP+ double positive staining (white arrows) in the ventricles and atria of (E) MTZ-treated fish when compared with (D) DMSO-treated controls at 48 hpt. Yellow arrows point to EdU+ proliferating non-cardiomyocytes. (D’, E’) Single confocal sections show EdU+ proliferating cells. (F) Quantitation of EdU+/cmlc2:GFP+ double positive CMs in the ventricle or atrium of control (n = 12) and ablated (n = 12) fish hearts at 48 hpt confirms increased proliferation in ventricle-ablated hearts. (G) Quantitation of ventricular area shows loss of myocardial ventricular tissue in Tg(vmhc:mCherry-NTR) MTZ-treated fish at 24 hpt (n = 12) when compared to control non-ablated fish (n = 7). At 96 hpt, Tg(vmhc:mCherry-NTR) MTZ-ablated hearts show recovery of ventricular area (n = 8, control; n = 9, ablated). (H) Quantitation of ventricular fractional area change (FAC) reveals decreased ventricular function in Tg(vmhc:mCherry-NTR) MTZ-treated fish at 24 hpt (n = 9) when compared to control non-ablated fish (n = 6). At 96 hpt, Tg(vmhc:mCherry-NTR) MTZ-ablated hearts (n = 5) dispaly comparable ventricular function to that of control hearts (n = 6). V, ventricle; A, atrium; dpf, days post-fertilization. Dashed lines outline the heart. Bars: 50 μm. (C) Mean + s.d. (F–H) Mean + s.e.m. Student’s t-test, ***, p<0.001; ns, p>0.05.
Figure 1—figure supplement 2
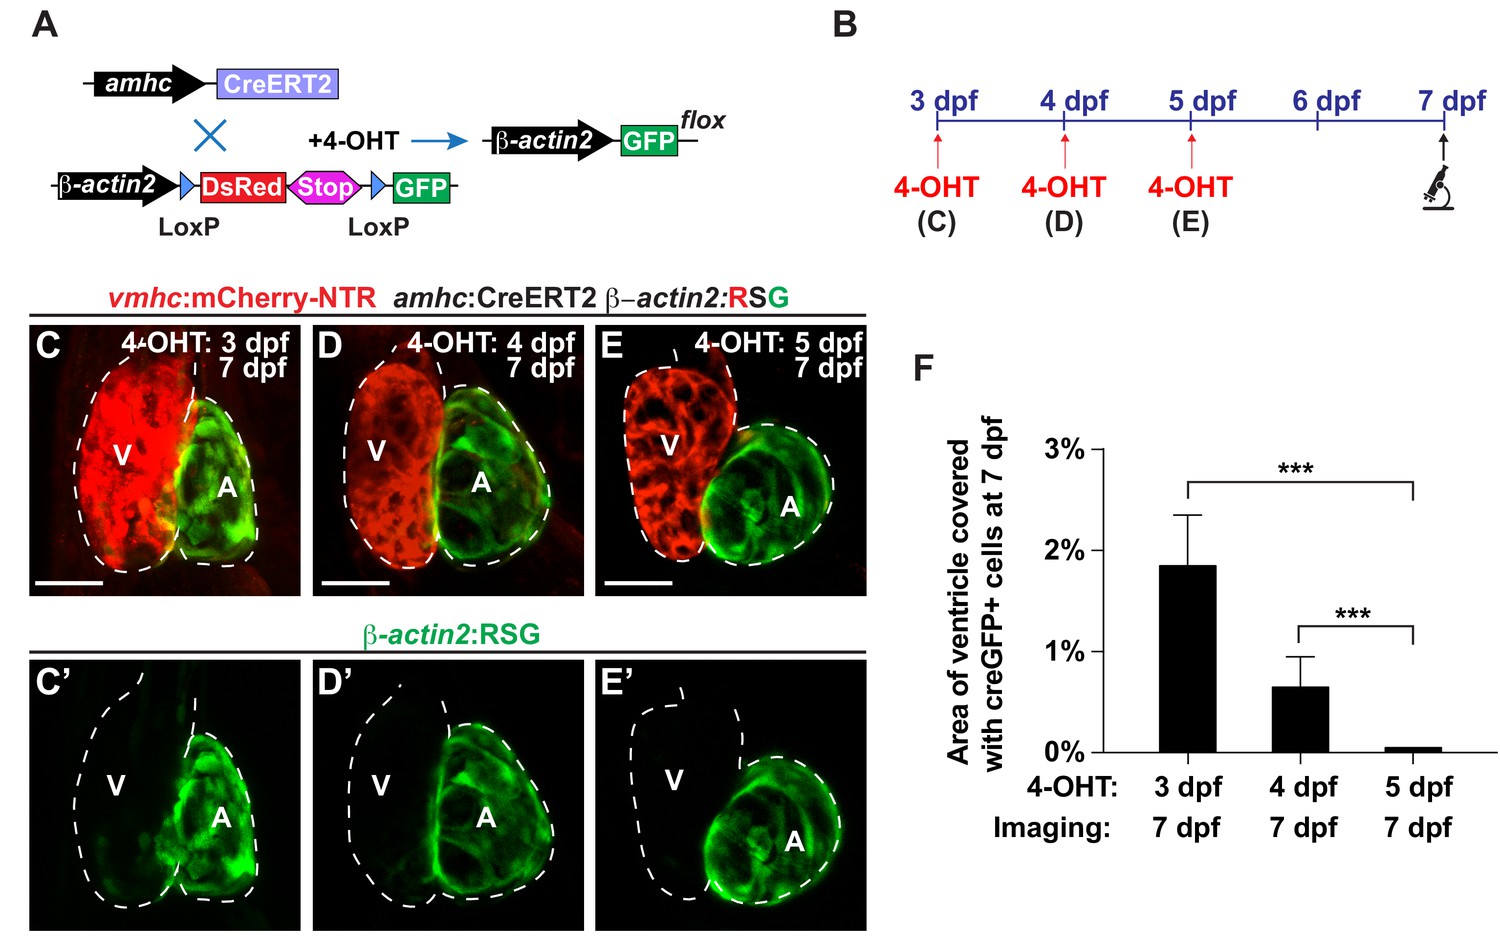
Reprogramming of atrial cardiomyocytes into ventricular cardiomyocytes during development.
(A) Schematic representation of the transgenic lines utilized in lineage tracing experiments. Treatment with 4-hydroxytamoxifen (4-OHT) activates the amhc:CreERT2 protein, which causes the recombination of β-actin2:RSG into β-actin2:GFP, thus permanently labeling amhc expressing cells in green. (B) vmhc:mCherry-NTR; amhc:CreERT2; β-actin2:RSG hearts were exposed to tamoxifen at (C) 3, (D) 4 or (E) 5 dpf in order to genetically label atrial CMs with GFP (c-aGFP), and then confocal imaged at 7 dpf. These hearts that were genetically labeled at (C) 3 (n = 21), (D) 4 (n = 14) or (E) 5 (n = 22) dpf show varying contributions of c-aGFP+ CMs to the ventricles. Green channel – (C’–E’) genetically labeled c-aGFP+ atrial CMs. (F) Quantitation of the percentage of ventricular area covered with c-aGFP+ CMs reveals that although uninjured hearts genetically labeled at 3 and 4 dpf exhibit a small contribution of c-aGFP+ CMs to the ventricle, uninjured hearts labeled at 5 dpf do not. All confocal images shown are maximum intensity projections. V, ventricle; A, atrium; dpf, days post-fertilization. Dashed lines outline the heart. Bars: 50 μm. Mean + s.d. ANOVA test, ***, p<0.001.
Figure 1—figure supplement 3
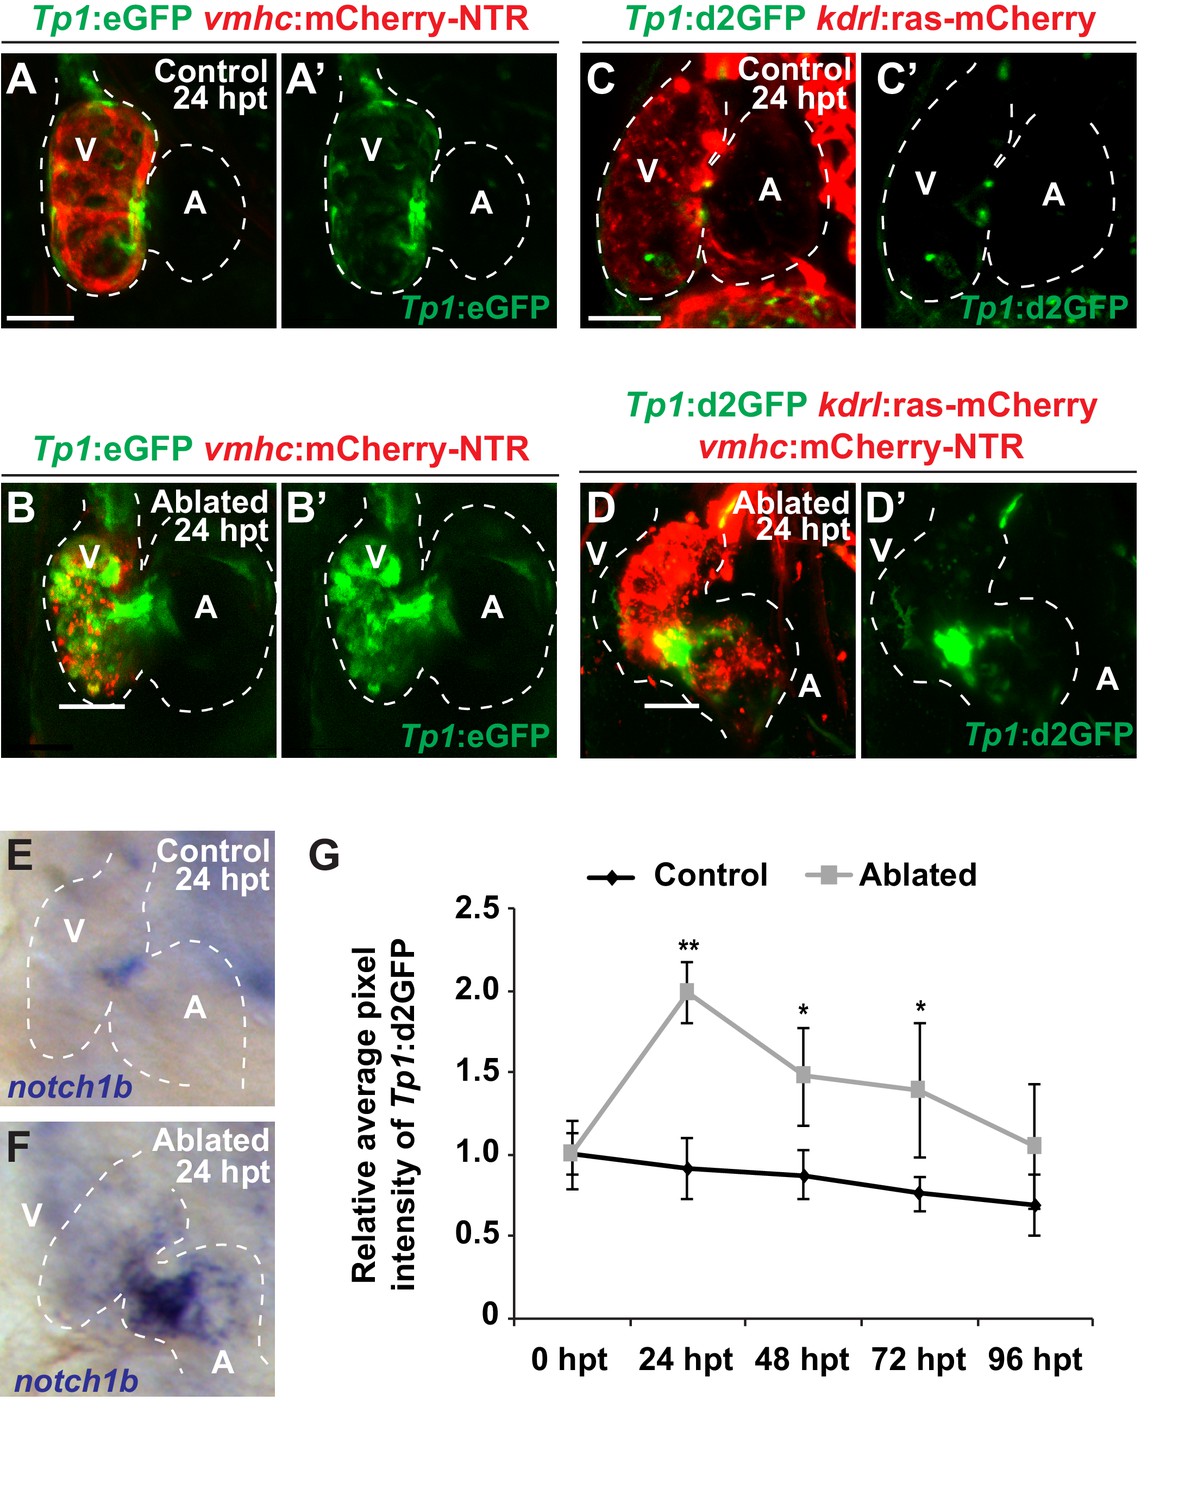
Endocardial Notch signaling is transiently activated after myocardial injury.
Confocal microscopy imaging was performed on (A) Tp1:eGFP; vmhc:mCherry-NTR control or (B) ventricle-ablated hearts at 24 hr post-treatment/hpt (6 dpf). Green channel – (A’, B’) Tp1:eGFP. (C, D) Confocal microscopy imaging was performed on (C) Tp1:d2GFP; kdrl:ras-mCherry control or (D) Tp1:d2GFP; kdrl:ras-mCherry; vmhc:mCherry-NTR ventricle-ablated hearts at 24 hr post-treatment/hpt (6 dpf). Green channel – (C’, D’) Tp1:d2GFP. (E, F) Whole-mount in situ hybridizations show that notch1b expression is increased in (F) Tp1:d2GFP; vmhc:mCherry-NTR ventricle-ablated hearts (n = 16/18) at 24 hpt (6 dpf) compared to (E) control hearts (n = 0/20). (G) Quantitation of the average fluorescence intensity of the Tp1:d2GFP signal analyzed in control (black lines) or ventricle-ablated (gray lines) Tp1:d2GFP; vmhc:mCherry-NTR hearts shows that Tp1:d2GFP expression peaks at 24 hpt and gradually decreases as the ventricle regenerates (n = 10 control 0–96 hpt; 12 MTZ 0–96 hpt). All confocal images shown are maximum intensity projections. V, ventricle; A, atrium; dpf, days post-fertilization; hpt, hours post-MTZ/DMSO treatment; dpt, days post-MTZ treatment. Dashed lines outline the heart. Bars: 50 μm. Mean + s.e.m. Student’s t test,*, **, p<0.05 and p<0.01.
Figure 1—figure supplement 4
Genetic inhibition of endocardial Notch signaling impairs myocardial reprogramming and regeneration.
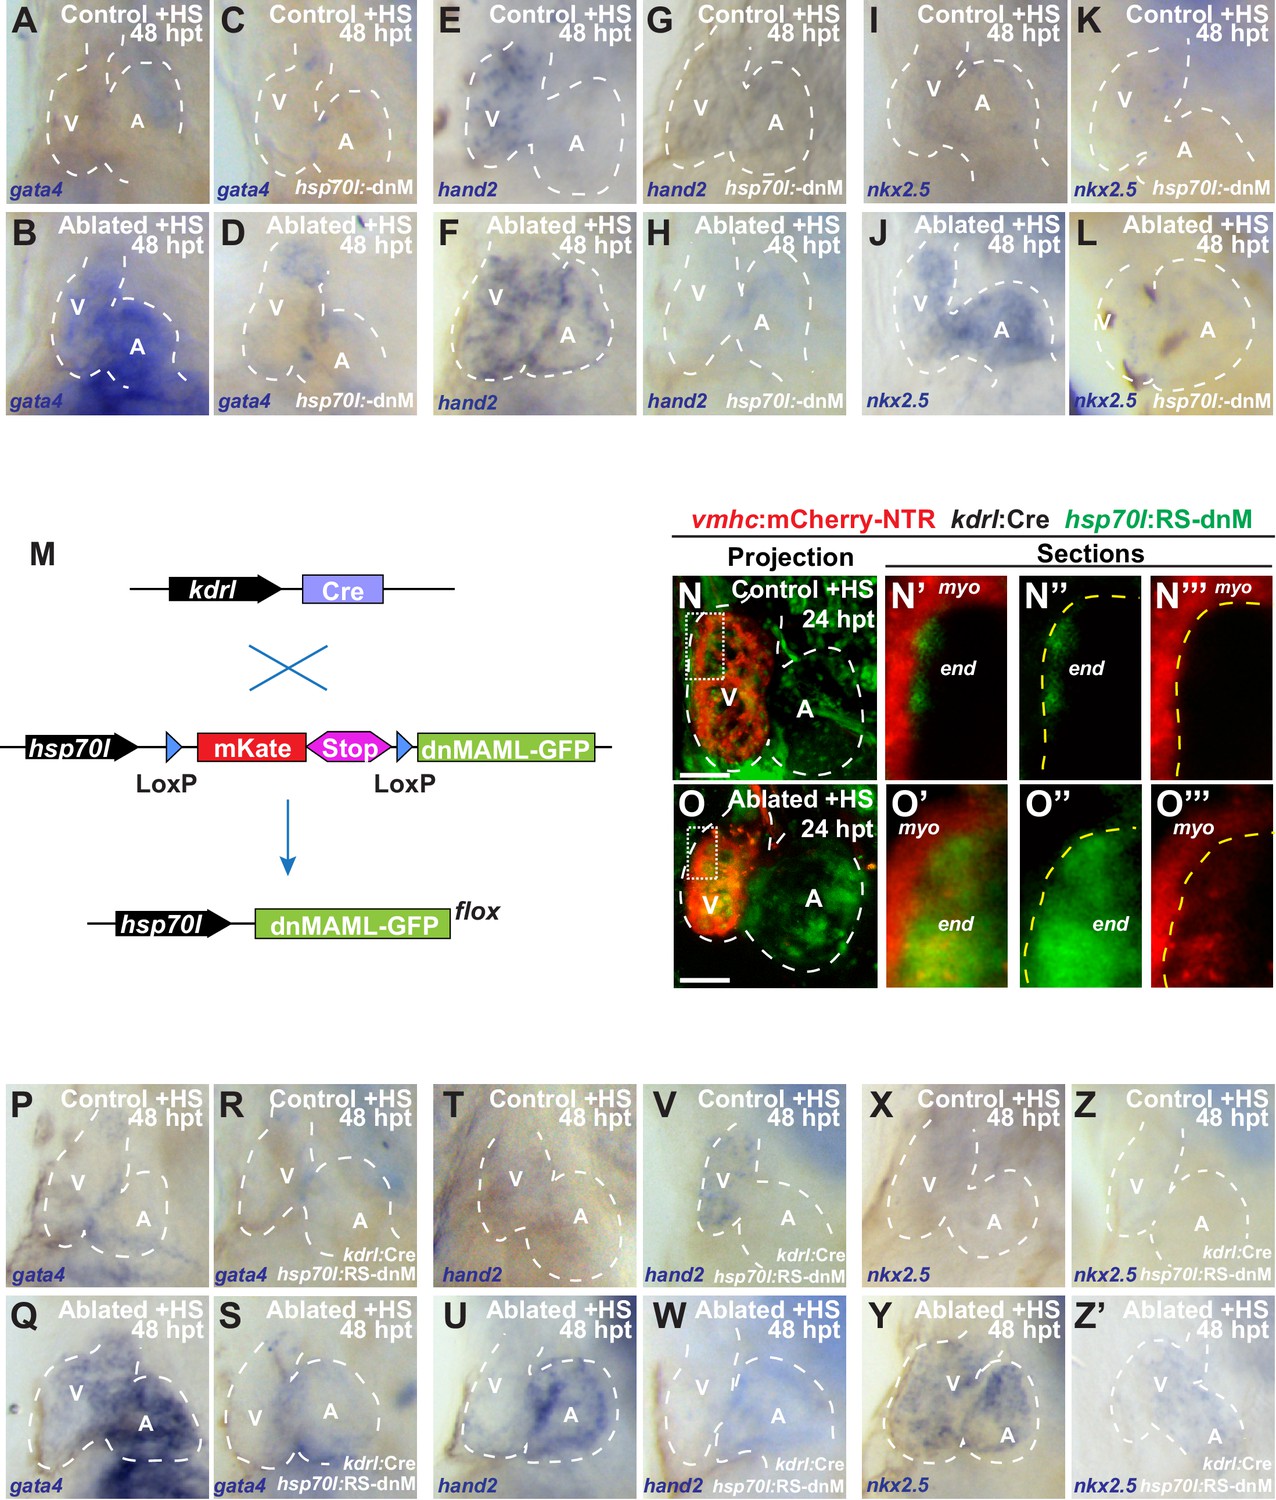
(A–L) Whole-mount in situ hybridizations of heat-shocked (A, B, E, F, I, J) vmhc:mCherry-NTR or (C, D, G, H, K, L) vmhc:mCherry-NTR; hsp70l:dnM hearts show that dnMAML (dnM) Notch inhibition decreases (D) gata4 (n = 3/15), (H) hand2 (n = 1/6) and (L) nkx2.5 (n = 2/8) reactivation in ventricle-ablated hearts at 48 hpt (seven dpf) when compared to (B, F, J) control ventricle-ablated (no dnM) hearts (n = 12/12, gata4; n = 5/5, hand2; n = 7/7, nkx2.5). (M) Schematic representation of the transgenic lines utilized in endocardial Notch inhibition studies for Figure 1L–Q and Figure 1—figure supplement 4N–Z´). Heat-shock induction of kdrl:Cre; hsp70l:RS-dnM allows for conditional expression of dnM specifically in endothelial/endocardial cells. (N–O) vmhc:mCherry-NTR; kdrl:Cre; hsp70l:RS-dnM were heat-shocked at 5 dpf and sham-ablated (control) or MTZ-ablated at 5.5 dpf. Confocal imaging was performed on vmhc:mCherry-NTR; kdrl:Cre; hsp70l:RS-dnM (N) control and (O) ventricle-ablated hearts at 24 hpt (6.5 dpf). (N’–N’’’, O’– O’’’) Insets are magnification of boxes in (N and O) and highlight endocardial expression of dnMAML-GFP in the ventricle. Yellow dashed lines indicate boundary between myocardium (myo) and endocardium (end). Green channel – (N’’, O’’) kdrl:Cre recombined hsp70l:RS-dnM; Red channel – (N’’’, O’’’) vmhc:mCherry-NTR; Merge – (N, N’, O, O’). (P–Z’) Whole-mount in situ hybridizations of heat-shocked (P, Q, T, U, X, Y) vmhc:mCherry-NTR or (R, S, V, W, Z, Z’) vmhc:mCherry-NTR; kdrl:Cre; hsp70l:RS-dnM hearts show that endocardial expression of dnM decreases (S) gata4 (n = 2/16), (W) hand2 (n = 0/5) and (Z’) nkx2.5 (n = 1/7) reactivation in ventricle-ablated hearts at 48 hpt (7 dpf) when compared to (Q, U, Y) control ventricle-ablated (no dnM) hearts (n = 16/18, gata4; n = 8/8, hand2; n = 10/10, nkx2.5). All confocal images shown are maximum intensity projections. V, ventricle; A, atrium; dpf, days post-fertilization; hpt, hours post-MTZ/DMSO treatment; dpt, days post-MTZ treatment. White dashed lines outline the heart. Bars: 50 μm.
Figure 2 with 6 supplements
Ventricle-ablated hearts display altered oscillatory blood flow and Klf2a activation.
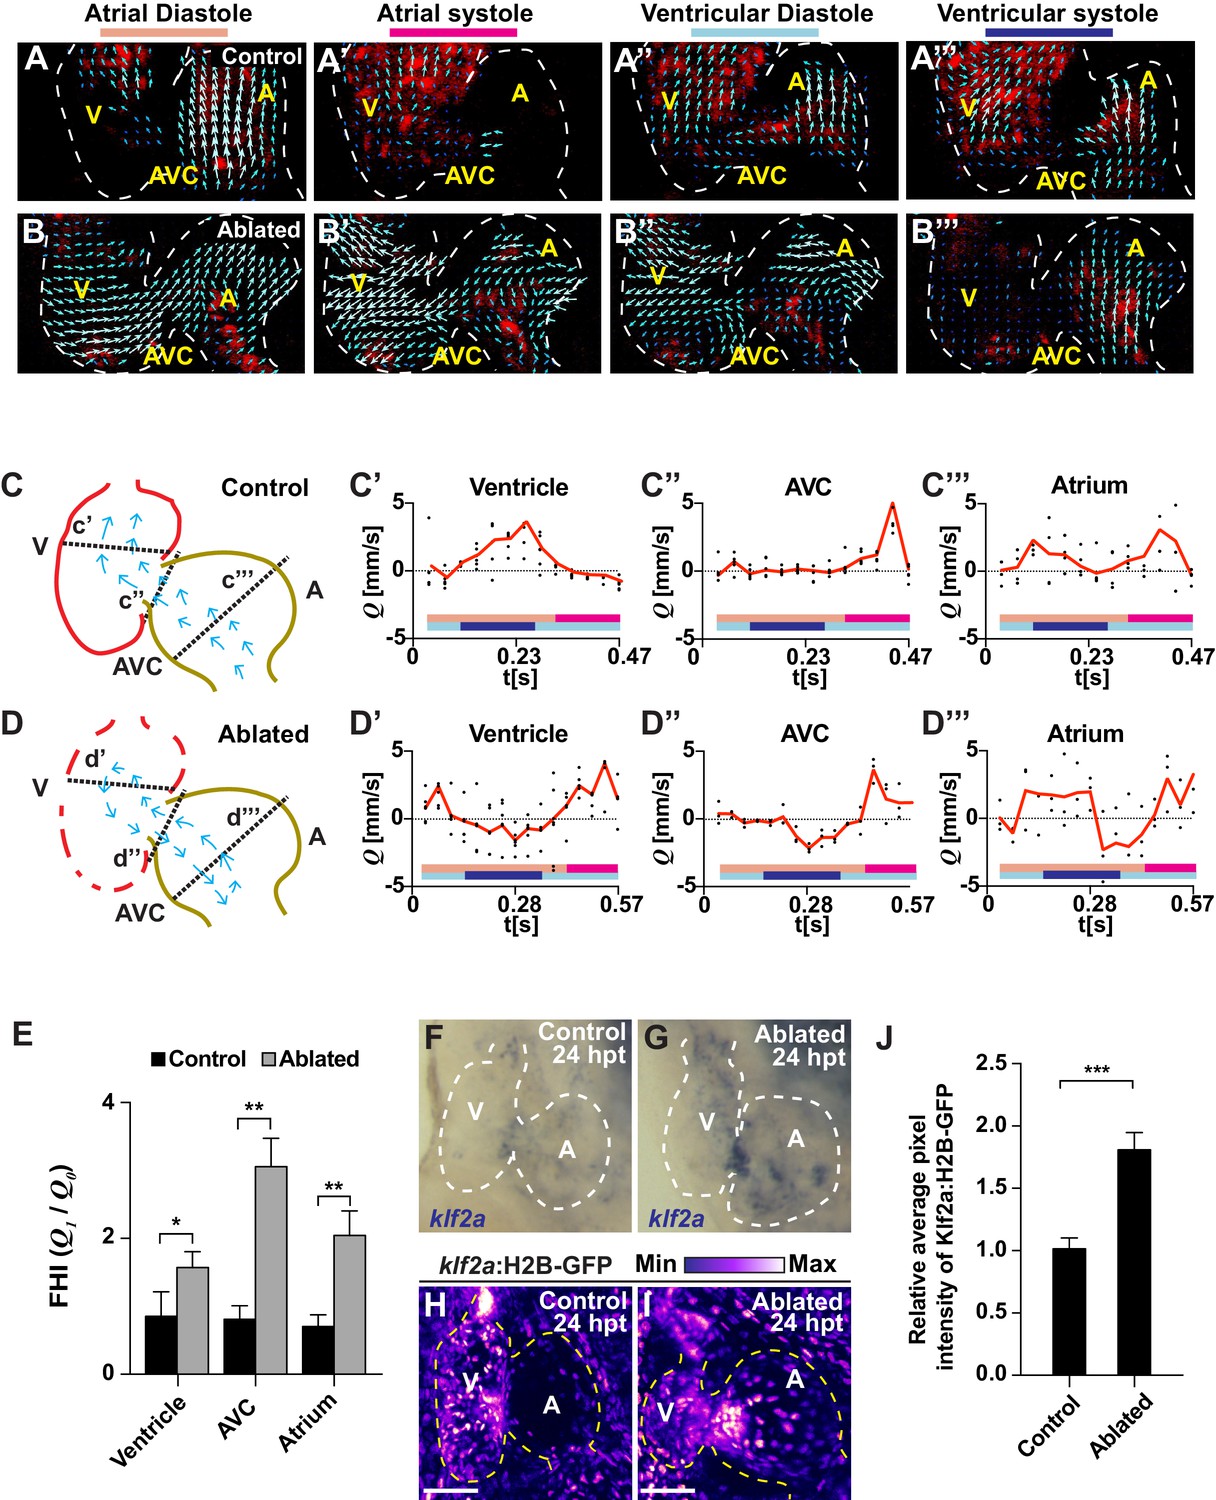
(A, B) High-speed confocal imaging was performed on (A) gata1:DsRed control hearts and (B) vmhc:mCherry-NTR; gata1:DsRed ventricle-ablated hearts at 24 hpt (six dpf). Arrows represent particle image velocimetry (PIV) generated vectors from blood flow at different stages of the heart cycle: (A, B) atrial diastole, (A’, B’) atrial systole, (A’’, B’’) ventricular diastole, (A’’’, B’’’) ventricular systole. (C, D) Schematic representation indicates where flow rate (Q) was calculated in (C’– C’’’) control and (D’– D’’’) ventricle-ablated hearts (dotted lines). Graphs show the calculated flow rate (mm/s) in the (C’, D’) ventricle, (C’’, D’’) atrio-ventricular canal (AVC) and (C’’’, D’’’) atrium over time (t[s]). Black dots – flow rate (Q) in each experimental replicate. Red lines – average blood flow rate (Q). Experimental replicates = 5 control ventricle; 4 control AVC; 4 control atrium; 5 ablated ventricle; 3 ablated AVC; 3 ablated atrium. Colored horizontal bars on the bottom of each graph represent the cardiac cycle period: pink – atrial diastole; magenta – atrial systole; light blue – ventricular diastole; dark blue – ventricular systole. (E) Fundamental harmonic index (FHI = Q1/Q0) of the flow rate (Q) in the ventricle, AVC and atrium of control and ventricle-ablated hearts at 24 hpt (6 dpf). n = 3 hearts each condition. (F, G) Whole-mount in situ hybridizations show that klf2a expression is increased in (G) vmhc:mCherry-NTR ventricle-ablated hearts (n = 12/12) compared to (F) control hearts at 24 hpt (n = 0/16) (6 dpf). (H, I) Confocal imaging was performed on klf2a:H2B-GFP; vmhc:mCherry-NTR (H) control and (I) ventricle-ablated hearts at 24 hpt (6 dpf) (n = 20 each condition). (J) Quantitation of the relative average fluorescence intensity of klf2a:H2B-GFP in klf2a:H2B-GFP; vmhc:mCherry-NTR hearts at 24 hpt (6 dpf) confirms that klf2a:H2B-GFP is increased in ventricle-ablated hearts (n = 20 each condition). All confocal images shown are maximum intensity projections. V, ventricle; A, atrium; AVC, atrio-ventricular canal; dpf, days post-fertilization; hpt, hours post-MTZ/DMSO treatment. Dashed lines outline the heart. Bars: 50 μm. (E, J) Mean + s.e.m. Student’s t-test, *, **, ***, p<0.05, p<0.01, p<0.001. The following figure supplements are available for Figure 2.
-
Figure 2—source data 1
Source data for Figure 2 and Figure 2—figure supplement 2.
- https://doi.org/10.7554/eLife.44816.011
Figure 2—figure supplement 1

Klf2a and Notch are activated in areas of the heart that exhibit increased oscillatory flow.
(A, B) Schematic spatial representation of the relative average fluorescence intensity of (A) Klf2a:H2B-GFP and (B) Tp1:d2GFP reveals that both signals are increased in the areas of the endocardium subjected to higher hemodynamic forces in ventricle-ablated hearts at 24 hpt (6 dpf) compared to control hearts (n = 20 each condition).
Figure 2—figure supplement 2
Post-injury Notch signaling is activated in Klf2a-positive endocardial cells.
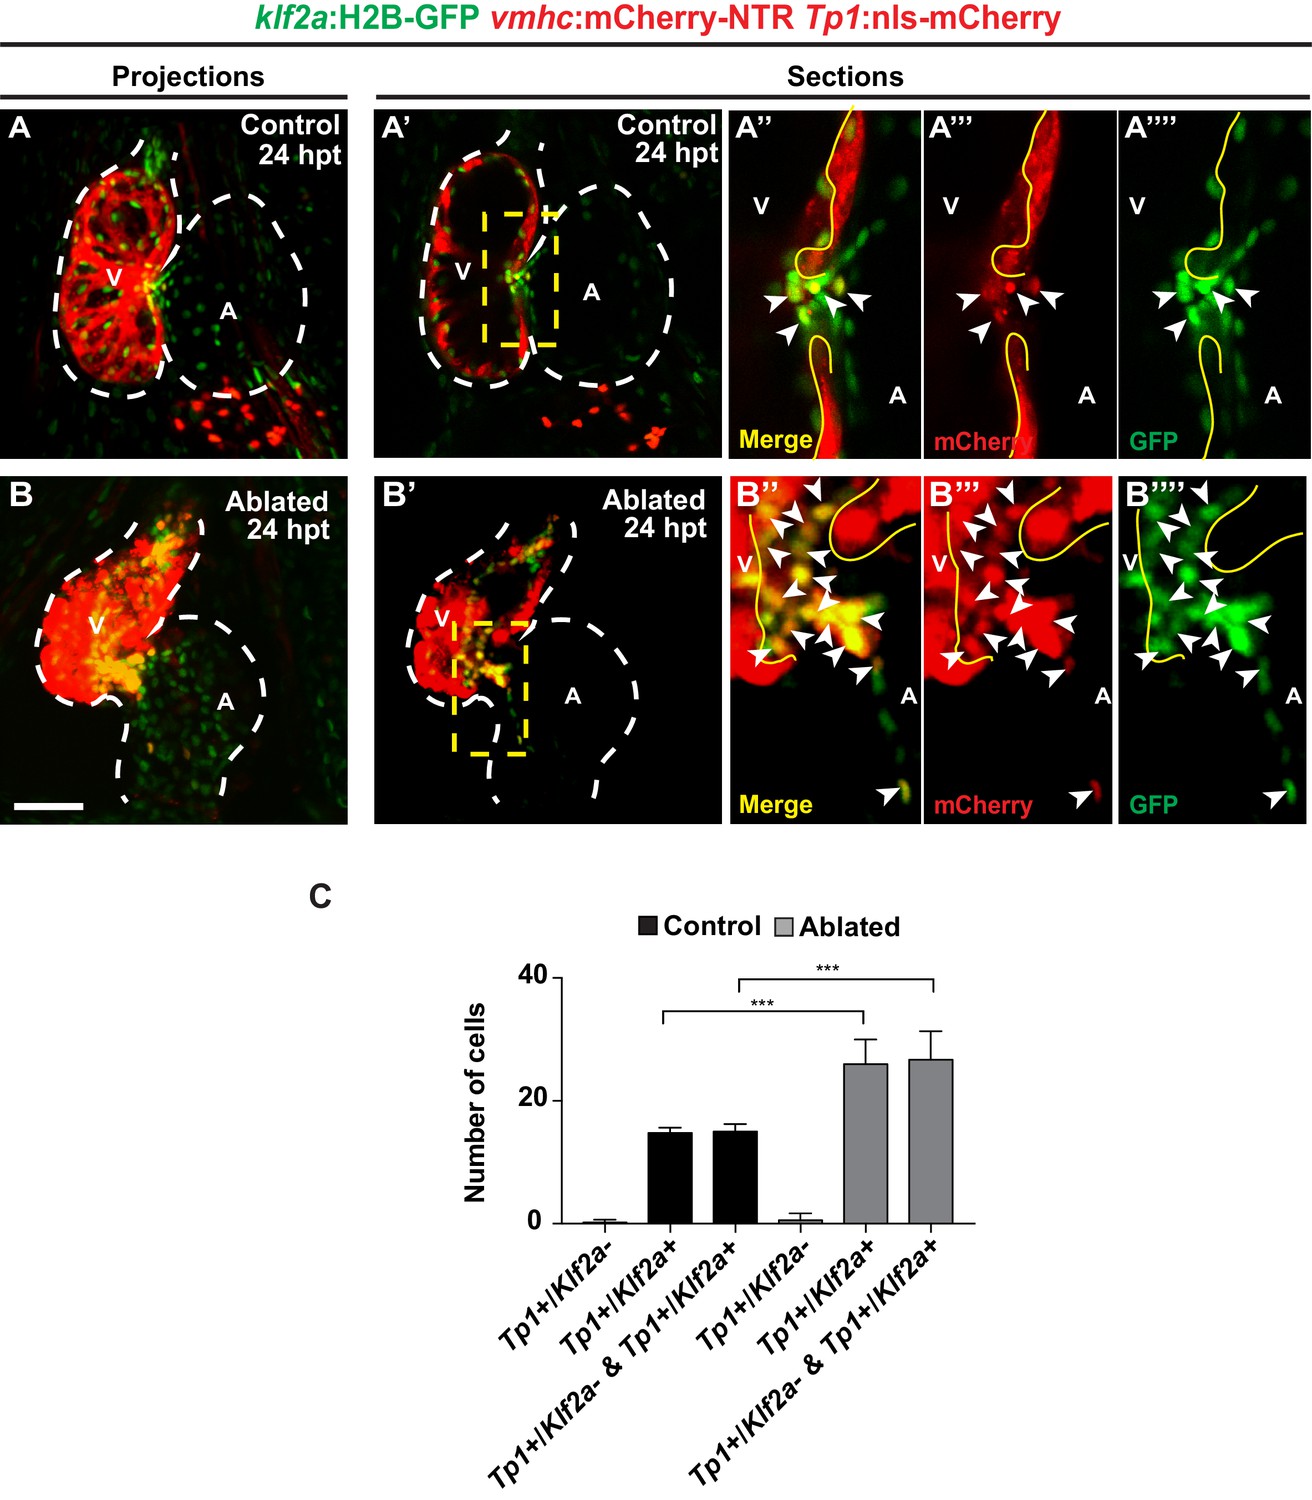
(A, B) Confocal imaging performed on (A) control and (B) ventricle-ablated klf2a:H2B-GFP; vmhc:mCherry-NTR; Tp1:nls-mCherry hearts at 24 hpt (6 dpf) shows co-expression of Tp1:nls-mCherry (red) in klf2a:H2B-GFP (green) activated cells (maximum intensity projections showed). (A’–A’’’’, B’–B’’’’) Single stacks of the projections in (A, B) show (A’’–B’’) co-expression of Tp1:nls-mCherry and klf2a:H2B-GFP (merged). (A’’-A’’’’-B’’, B’’’’) are magnifications of the area in the yellow dashed box in (A’, B’). (A’’, B’’) merge; (A’’’, B’’’) mCherry – Red or (A’’’’, B’’’’) GFP – Green. (C) Quantitation of the number of cells that display Tp1:nls-mCherry only (Tp1+/Klf2a-), Tp1:nls-mCherry and klf2a:H2B-GFP (Tp1+/Klf2a+) or total Tp1:nls-mCherry (Tp1+/Klf2a- and Tp1+/Klf2a+) in A, B) reveals that ventricle-ablated hearts have significantly more Tp1:nls-mCherry/klf2a:H2B-GFP-positive cells than control sham-ablated hearts at 24 hpt (6 dpf) (n = 10 each condition). V, ventricle; A, atrium; dpf, days post-fertilization; hpt, hours post-MTZ/DMSO treatment; dpt, days post-MTZ treatment. White dashed lines outline the heart. Bars: 50 μm. Mean + s.e.m. Student’s t test, **, p<0.01.
Figure 2—video 1
Control hearts display anterograde intracardiac blood flow.
High-speed confocal imaging was performed on gata1:DsRed control hearts at 6 dpf. Video shows maximal projection reconstruction of 10 stacks at 24 fps (frames per second).
Figure 2—video 2
Ablated hearts exhibit retrograde intracardiac blood flow.
High-speed confocal imaging was performed on vmhc:mCherry-NTR; gata1:DsRed MTZ ventricle-ablated hearts at 24 hpt (6 dpf). Video shows maximal projection reconstruction of 10 stacks at 24 fps.
Figure 2—video 2
Particle image velocimetry (PIV) generated vectors confirm anterograde intracardiac blood flow in control hearts.
High-speed confocal imaging was performed on gata1:DsRed control hearts at 6 dpf. Video shows single planes at 24 fps. Vectors represent local estimations of flow velocity as measured by PIV.
Figure 2—video 4
Particle image velocimetry (PIV) generated vectors confirm retrograde intracardiac blood flow in ventricle-ablated hearts.
High-speed confocal imaging was performed on vmhc:mCherry-NTR; gata1:DsRed MTZ ventricle-ablated hearts at 24 hpt (6 dpf). Video shows single planes at 24 fps. Vectors represent local estimations of flow velocity as measured by PIV.
Figure 3 with 1 supplement
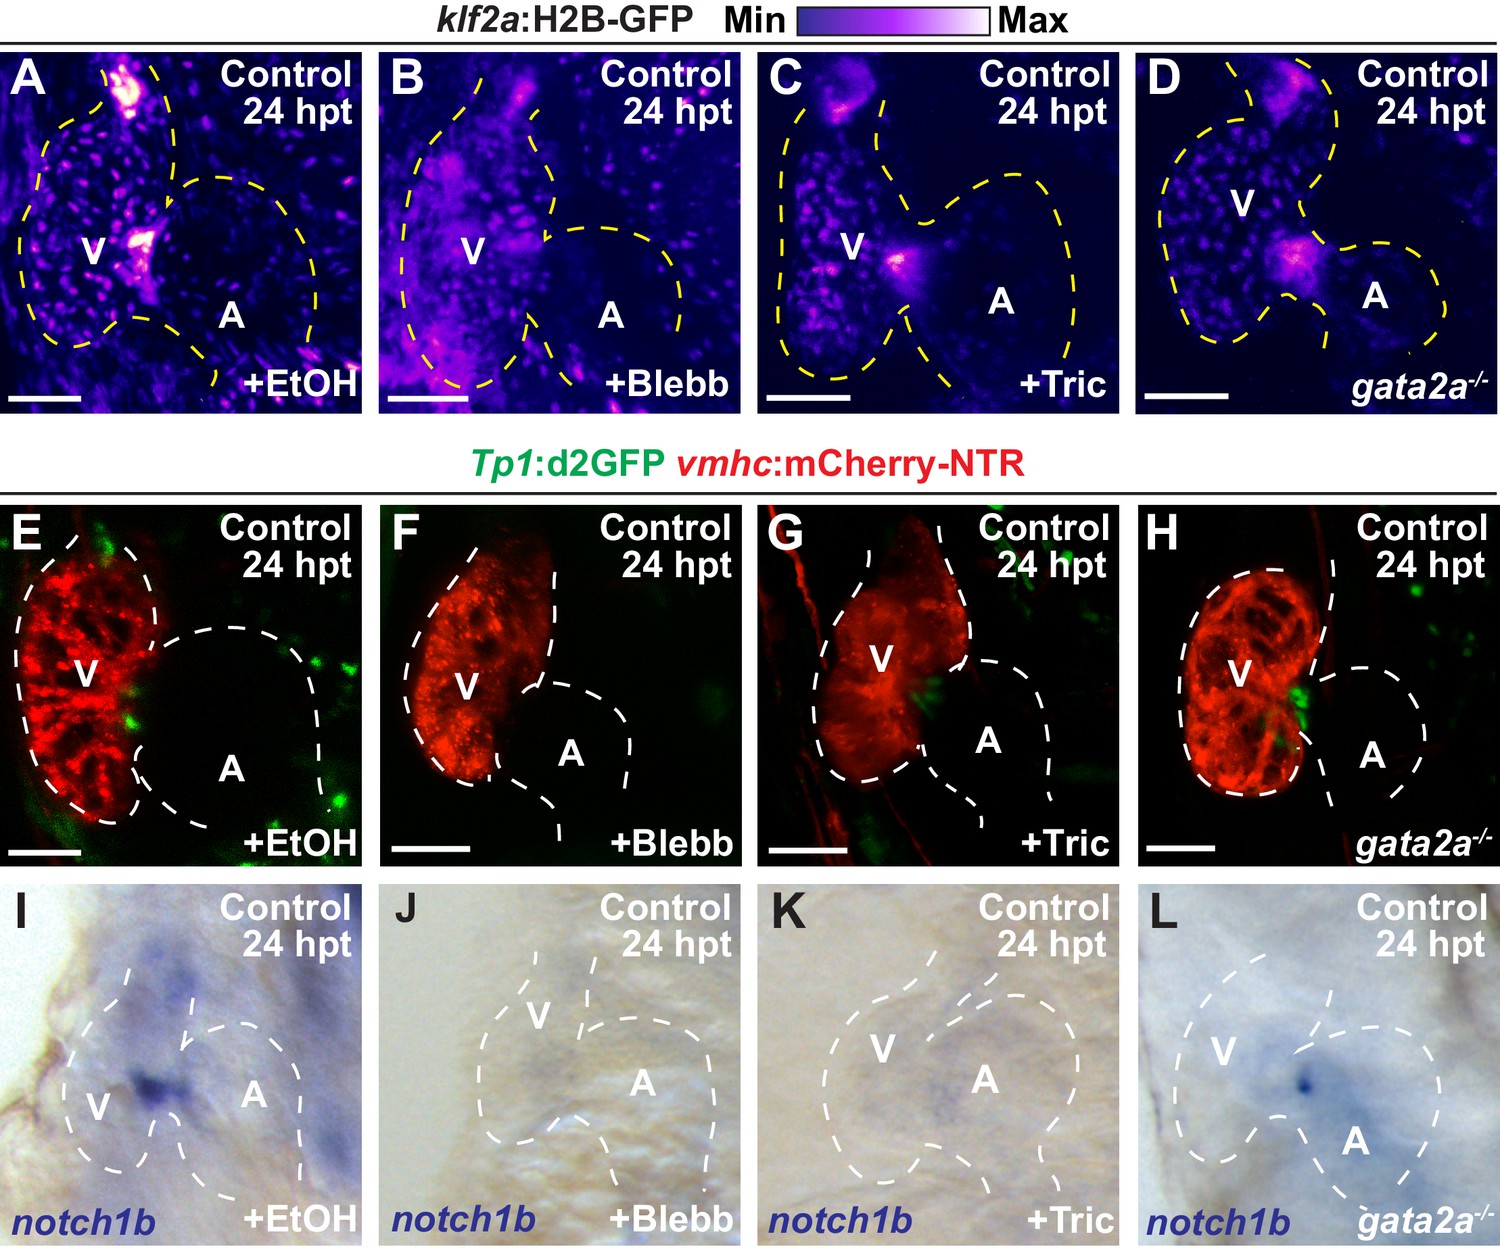
Reduced hemodynamic forces affect endocardial Notch and Klf2a post-injury activation.
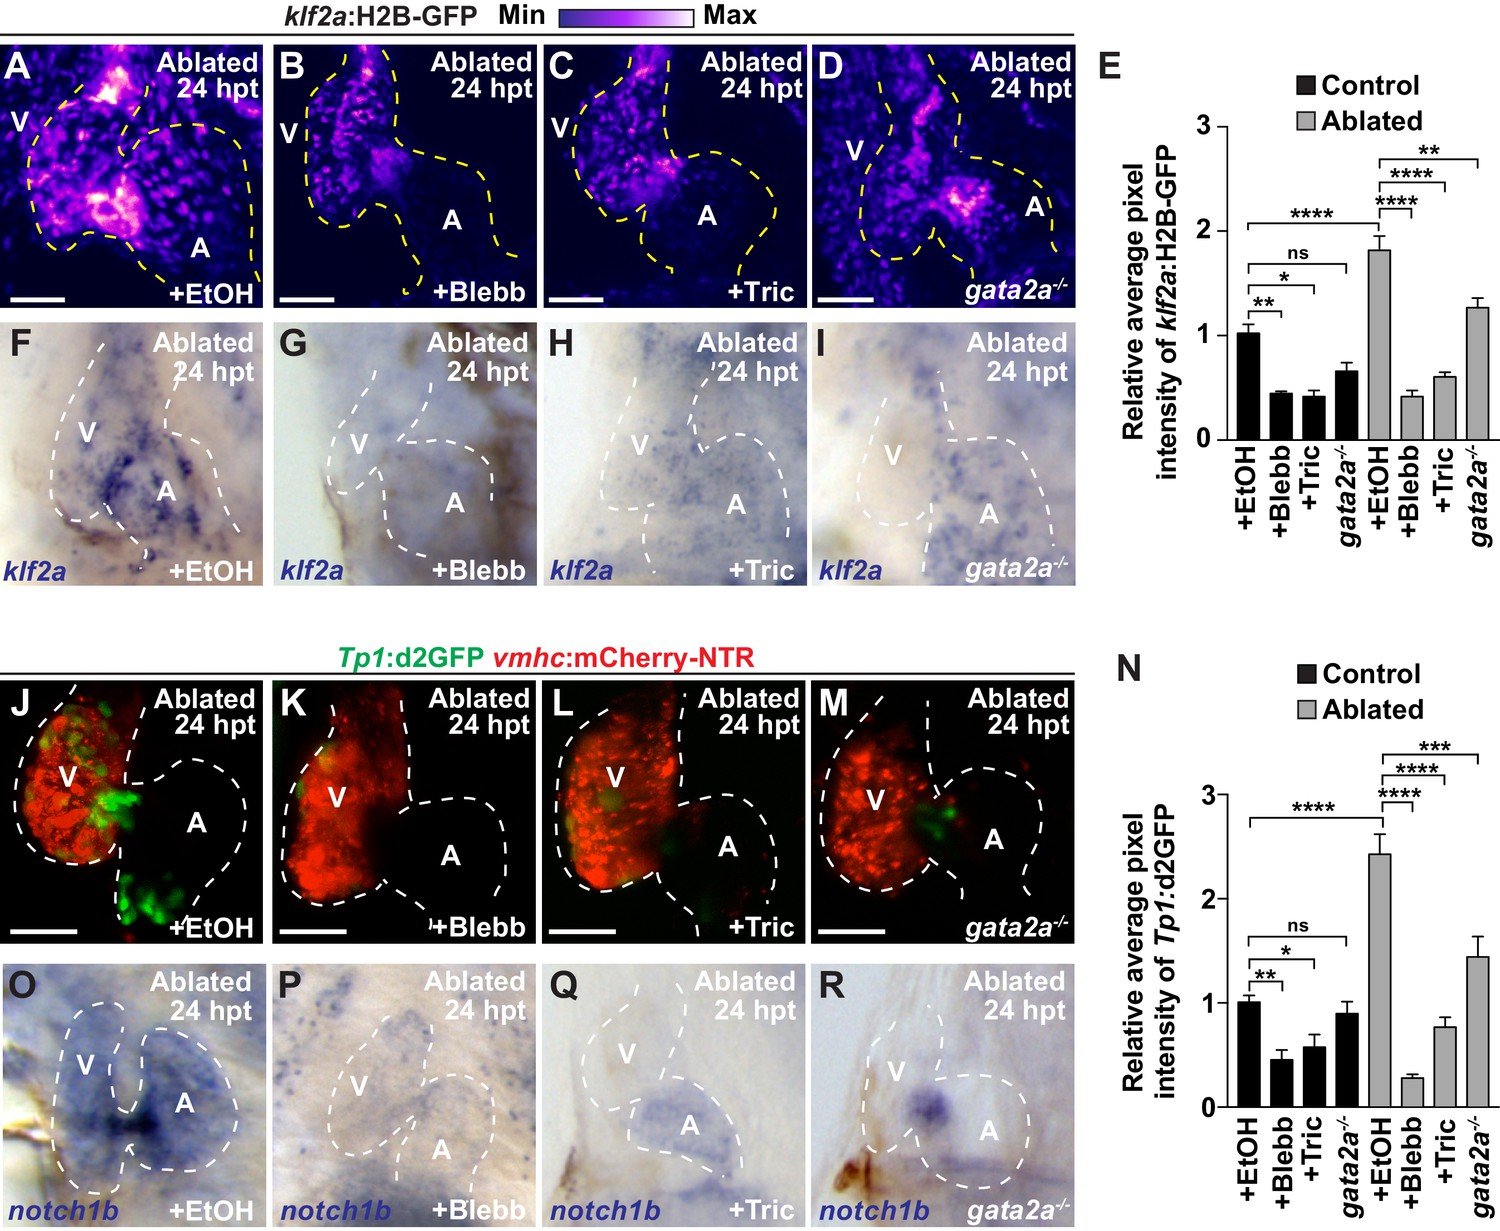
Confocal imaging performed on (A–D) klf2a:H2B-GFP; vmhc:mCherry-NTR or (J–M) Tp1:d2GFP; vmhc:mCherry-NTR ventricle-ablated hearts at 24 hpt (6 dpf) reveals that (D, M) gata2a-/- mutant hearts as well as wild-type hearts treated with (B, K) blebbistatin (Blebb) or (C, L) tricaine (Tric) exhibit reduced klf2a:H2B-GFP or Tp1:d2GFP expression when compared to (A, J) ethanol (EtOH) sham-treated hearts. Quantitation of the relative average fluorescence intensity in control (black bars) and ventricle-ablated (gray bars) hearts confirms reduced (E) klf2a:H2B-GFP or (N) Tp1:d2GFP expression in gata2a-/- mutant hearts as well as wild-type hearts treated with blebbistatin or tricaine (klf2a:H2B-GFP n = 12 control EtOh; 5 control Blebb; 7 control Tric; 9 control gata2a-/-; 11 MTZ EtOH; 6 MTZ Blebb; 6 MTZ Tric; 9 MTZ gata2a-/-. Tp1:d2GFP n = 12 control EtOh; 6 control Blebb; 7 control Tric; 9 control gata2a-/-; 11 MTZ EtOH; 6 MTZ Blebb; 6 MTZ Tric; 9 MTZ gata2a-/-). Whole-mount in situ hybridizations at 24 hpt (6 dpf) show that (F–I) klf2a and (O–R) notch1b expression is decreased in vmhc:mCherry-NTR ventricle-ablated hearts treated with (G, P) blebbistatin (n = 0/8 klf2a; n = 2/12 notch1b) or (H, Q) tricaine (n = 0/7 klf2a; n = 0/10 notch1b) as well as in (I, R) gata2a-/- ventricle-ablated hearts (n = 3/9 klf2a; n = 5/12 notch1b) when compared to (F, O) hearts sham-treated with ethanol (n = 7/7 klf2a; n = 10/10 notch1b). All confocal images shown are maximum intensity projections. V, ventricle; A, atrium; dpf, days post-fertilization; hpt, hours post-MTZ treatment. Dashed lines outline the heart. Bars: 50 μm. (E, N) Mean + s.e.m. ANOVA, ns: p>0.05; *: p<0.05; **: p<0.01; ***: p<0.001; ****: p<0.0001. The following figure supplements are available for Figure 3.
-
Figure 3—source data 1
Source data for Figure 3.
- https://doi.org/10.7554/eLife.44816.018
Figure 3—figure supplement 1
Inhibiting hemodynamic flow leads to reduced cardiac Klf2a and Notch signaling.
(A–D) Confocal imaging performed on klf2a:H2B-GFP; vmhc:mCherry-NTR uninjured hearts at 24 hpt (6 dpf) reveals decreased klf2a:H2B-GFP expression in (B) blebbistatin (Blebb) and (C) tricaine (Tric) treated hearts as well as in (D) gata2a-/- mutant hearts when compared to (A) ethanol (EtOH)-treated control hearts (n = 12 control EtOh; 6 control Blebb; 7 control Tric; 9 control gata2a-/-). (E–H) Confocal imaging performed on Tp1:d2GFP; vmhc:mCherry-NTR uninjured hearts at 24 hpt (6 dpf) shows decreased Tp1:d2GFP Notch reporter expression in hearts treated with (F) blebbistatin or (G) tricaine when compared to (E) ethanol-treated control hearts; however, (H) gata2a-/- hearts do not display significant changes as quantitatively assessed in Figure 3N (n = 12 control EtOh; 5 control Blebb; 7 control Tric; 9 control gata2a-/-). (I–L) Whole-mount in situ hybridizations reveal decreased notch1b expression in hearts treated with (J) blebbistatin (n = 0/9) or (K) tricaine (n = 0/5) and in (L) gata2a-/- hearts (n = 4/12) when compared to (I) ethanol-treated control hearts (n = 10/10) at 24 hpt (6 dpf). All confocal images shown are maximum intensity projections. V, ventricle; A, atrium; dpf, days post-fertilization; hpt, hours post-DMSO treatment. Dashed lines outline the heart. Bars: 50 μm.
Figure 4 with 1 supplement

Hemodynamic forces control regeneration and myocardial reprogramming.
(A–D) Confocal microscopy imaging performed on vmhc:mCherry-NTR ventricle-ablated hearts reveals that (B) blebbistatin or (C) tricaine treatment as well as (D) the gata2a-/- mutant allele inhibit CM proliferation at 48 hpt (7 dpf) when compared to CM proliferation of (A) ethanol-treated control hearts. White – anti-phospho-histone H3 immunostaining; red – anti-MF-20 immunostaining. Arrows point to proliferating CMs. (E) Quantitation of anti-phospho-histone H3+ CMs in these hearts confirms that blebbistatin or tricaine treatment, and gata2a-/- defects block CM proliferation in injured hearts (n = 23, control EtOH; 21 MTZ EtOH; 9 control Blebb; 9 MTZ Blebb; 10 control Tric; 10 MTZ Tric; 9 control gata2a-/-; 16 MTZ gata2a-/-). Red bars – ventricle; green bars – atrium; dark bars – control sham-ablated hearts; light bars – ventricle-ablated hearts. (F) Quantitation of the percentage of vmhc:mCherry-NTR ventricle-ablated hearts that display recovered ventricular tissue and contractility (black bars) at 96 hpt (9 dpf) shows that inhibiting contractility by blebbistatin or tricaine treatment as well as decreasing blood viscosity using gata2a-/- mutants impair heart regeneration. The number of fish analyzed for each condition is indicated above each column. (G–J) Confocal microscopy imaging of vmhc:mCherry-NTR; amhc:CreERT2; β-actin2:RSG hearts at 60 hpt (7.5 dpf) reveals that (H) blebbistatin-treated, (I) tricaine-treated, or (J) gata2a-/- ventricle-ablated hearts exhibit reduced ability of genetically labeled atrial CMs (c-aGFP+) to contribute to the regenerating injured ventricle when compared to (G) ethanol sham-treated hearts. (G’–J’) Green channel – genetically-labeled c-aGFP+ atrial CMs. (K) Quantitation of the percentage of ventricular area covered with c-aGFP+ CMs confirms the reduced atrial CM contribution to the regenerating injured ventricle in gata2a-/- mutant hearts as well as wild-type hearts treated with blebbistatin or tricaine (n = 12 ethanol; 7 blebbistatin; 7 tricaine; 9 gata2a-/-). All confocal images shown are maximum intensity projections. V, ventricle; A, atrium; dpf, days post-fertilization; hpt, hours post-MTZ/DMSO treatment. Dashed lines outline the heart. Bars: 50 μm. (E) Mean + s.e.m. ANOVA; (K) Mean + s.d. ANOVA; (F) Total numbers, Binomial test (versus EtOH); ns: p>0.05; *: p<0.05; **: p<0.01; ***: p<0.001; ****: p<0.0001. The following figure supplements are available for Figure 4.
-
Figure 4—source data 1
Source data for Figure 4.
- https://doi.org/10.7554/eLife.44816.021
Figure 4—figure supplement 1
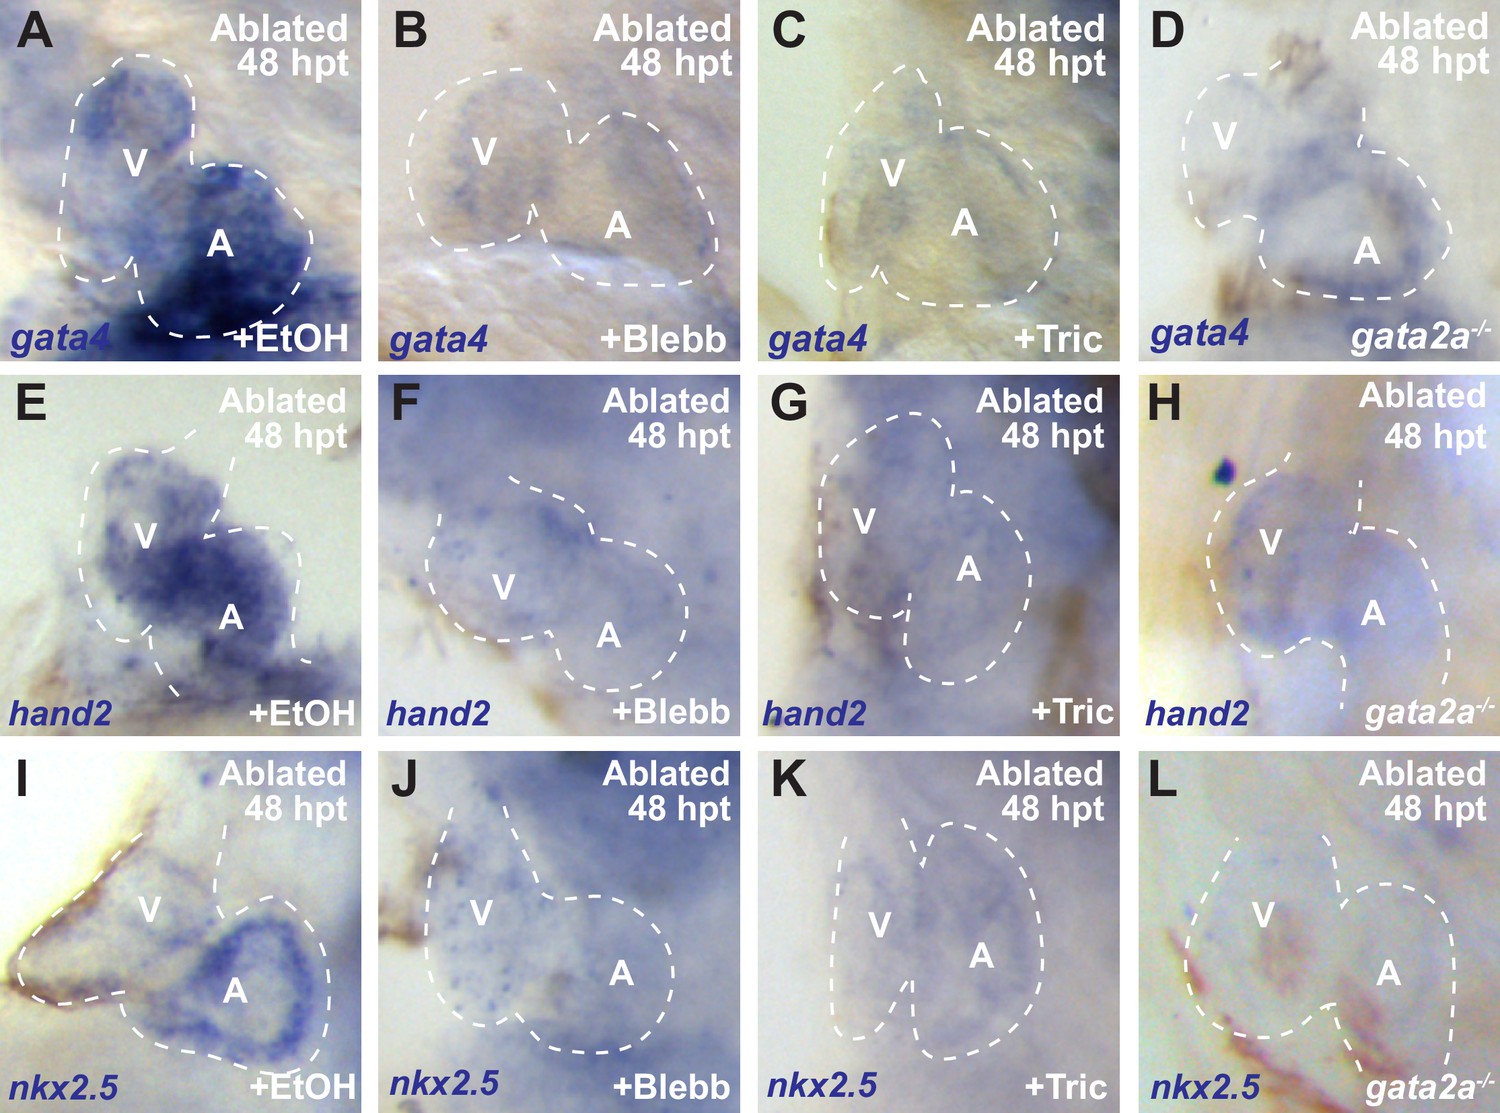
Inhibiting hemodynamic flow perturbs post-injury re-activation of cardiac factors.
Whole-mount in situ hybridizations show increased (A) gata4 (n = 9/11), (E) hand2 (n = 10/10) and (I) nkx2.5 (n = 7/8) expression in vmhc:mCherry-NTR ventricle-ablated (ethanol/EtOH-treated) control hearts at 48 hpt (7 dpf). However, these cardiogenesis factors fail to increase after ventricle-ablation in (B, F, J) blebbistatin (Blebb) (n = 0/13 gata4; n = 1/10 hand2; n = 0/10 nkx2.5) or (C, G, K) tricaine (Tric) (n = 0/14 gata4; n = 2/10 hand2; n = 0/6 nkx2.5) treated hearts as well as in (D, H, L) gata2a-/- hearts (n = 5/17 gata4; n = 4/11 hand2; n = 2/7 nkx2.5). V, ventricle; A, atrium; dpf, days post-fertilization; hpt, hours post-DMSO treatment. Dashed lines outline the heart. Bars: 50 μm.
Figure 5 with 4 supplements
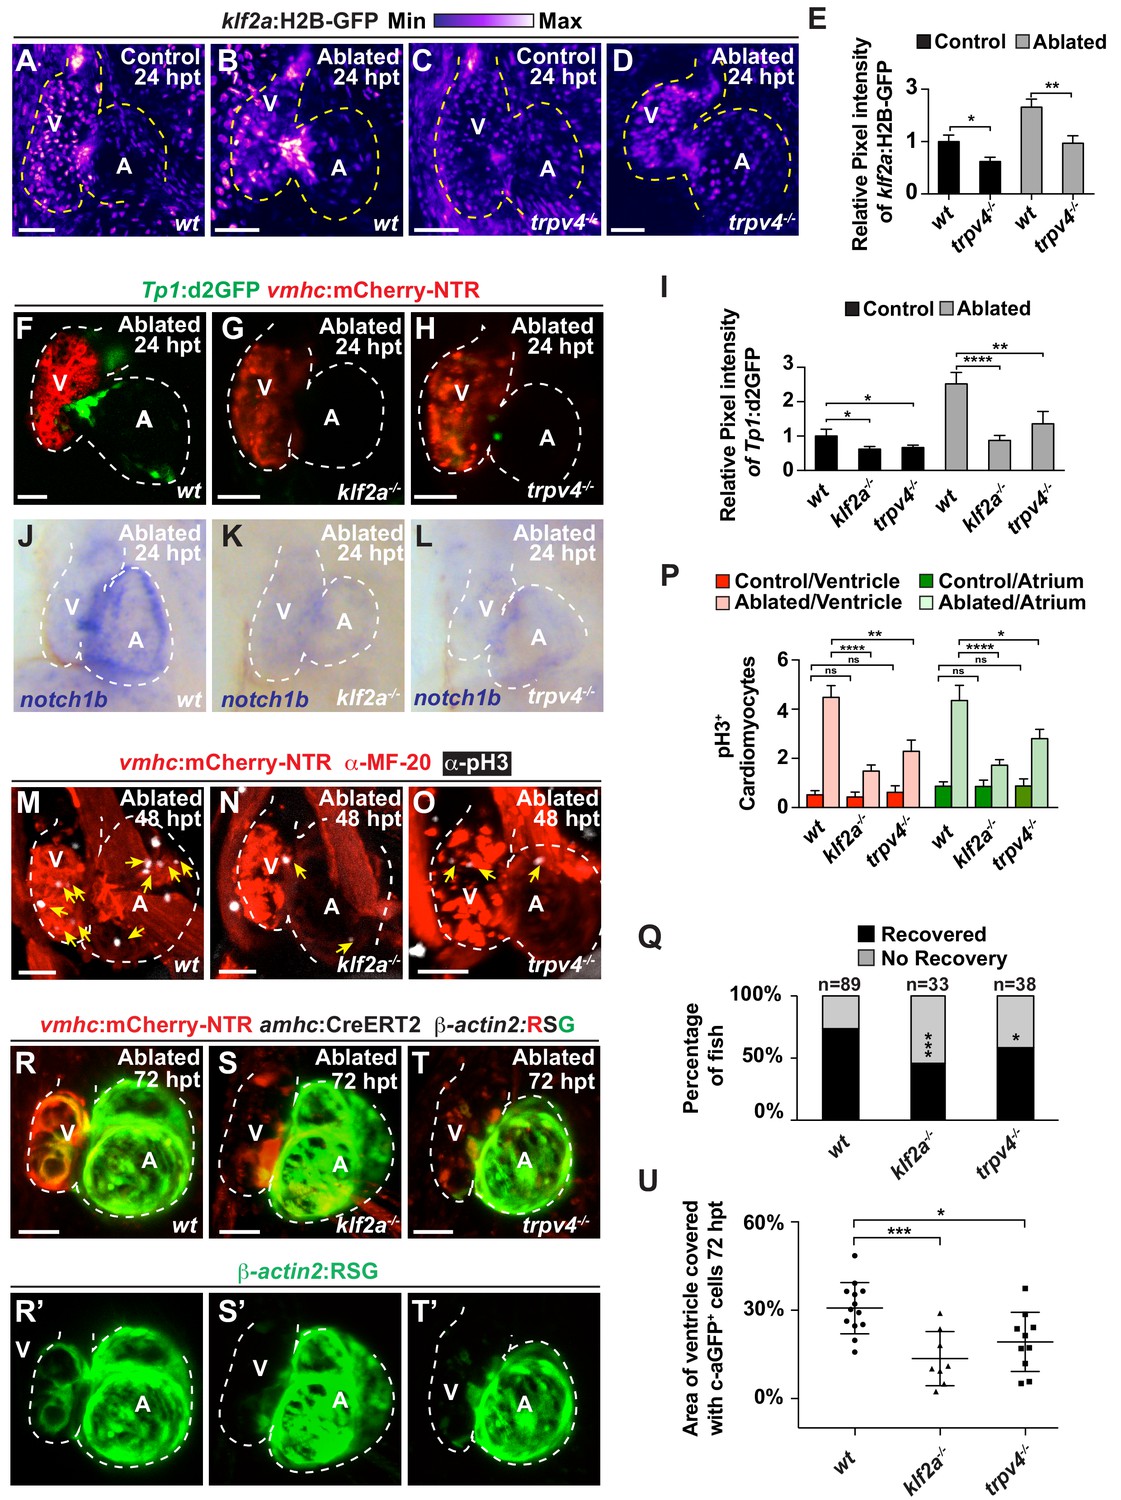
The mechanosensitive channel Trpv4 regulates endocardial Notch activation and myocardial regeneration through Klf2a.
(A–D) Confocal imaging of vmhc:mCherry-NTR; klf2a:H2B-GFP hearts shows that klf2a:H2B-GFP expression is activated in (B) wild-type (wt) ventricle-ablated hearts at 24 hpt (6 dpf) compared to (A) control hearts; however, this activation is reduced in (D) trpv4-/- ventricle-ablated hearts. (F–H) Confocal imaging of vmhc:mCherry-NTR; Tp1:d2GFP hearts further reveals that Tp1:d2GFP is decreased in (G) klf2a-/- and (H) trpv4-/- ventricle-ablated hearts at 24 hpt (6 dpf) when compared to (F) wild-type (wt) hearts. (E, I) Quantitation of the relative average fluorescence intensity confirms reduced injury-induced (E) klf2a:H2B-GFP activation in trpv4-/- ventricle-ablated hearts, and (I) Tp1:d2GFP activation in trpv4-/- and klf2a-/- ventricle-ablated hearts when compared to wild-type ventricle-ablated hearts (klf2a:H2B-GFP n = 9 control wt; 7 control trpv4-/-; 9 MTZ wt; 10 MTZ trpv4-/-. Tp1:d2GFP n = 15 control wt; 18 control trpv4-/-; 20 control klf2a-/-; 22 MTZ wt; 21 MTZ trpv4-/-; 18 MTZ klf2a-/). (J–L) Whole-mount in situ hybridizations show that notch1b is decreased in ventricle-ablated (K) klf2a-/- (n = 2/11) and (L) trpv4-/- hearts (n = 6/15) at 24 hpt (6 dpf) when compared to (J) wild-type hearts (n = 16/18). (M–O) Confocal microscopy performed on vmhc:mCherry-NTR ventricle-ablated hearts reveals that (N) klf2a-/- and (O) trpv4-/- ventricle-ablated hearts display reduced CM proliferative response when compared to (M) wild-type (wt) ventricle-ablated hearts at 48 hpt (7 dpf). White – anti-phospho-histone H3 immunostaining; red – anti-MF-20 immunostaining. Arrows point to proliferating CMs. (P) Quantitation of anti-phospho-histone H3+ CMs in these hearts confirms that klf2a-/- and trpv4-/- hearts fail to increase CM proliferation after ventricle-injury (n = 15 each condition). Red bars – ventricle; green bars – atrium; dark bars – control sham-ablated hearts; light bars – ventricle-ablated hearts. (Q) Quantitation of the percentage of vmhc:mCherry-NTR ventricle-ablated hearts that display recovered ventricular tissue and contractility (black bars) at 96 hpt (9 dpf) supports that klf2a-/- and trpv4-/- mutants exhibit impaired heart regeneration. The number of fish analyzed for each condition is indicated above each column. (R–T) Confocal microscopy imaging of vmhc:mCherry-NTR; amhc:CreERT2; β-actin2:RSG hearts at 72 hpt (8 dpf) shows that (S) klf2a-/-and (T) trpv4-/- ventricle-ablated hearts exhibit reduced contribution of genetically labeled atrial CMs (c-aGFP+) to the regenerating injured ventricle when compared to (R) wild-type ventricle-ablated hearts. Green channel – (R’–T’) genetically labeled c-aGFP+ atrial CMs. (U) Quantitation of the percentage of ventricular area covered with c-aGFP+ CMs confirms that klf2a-/- or trpv4-/- hearts display reduced capacity to undergo injury-induced atrial-to-ventricular trans-differentiation during injury and regeneration (n = 13 wt; 8 klf2a-/-; 10 trpv4-/-). All confocal images shown are maximum intensity projections. V, ventricle; A, atrium; dpf, days post-fertilization; hpt, hours post-MTZ/DMSO treatment. Dashed lines outline the heart. Bars: 50 μm. (E, I, P) Mean + s.e.m. ANOVA; (Q) Total numbers, Binomial test (versus wild-type); (U) Mean + s.d. ANOVA; ns: p>0.05; *: p<0.05; **: p<0.01; ***: p<0.001; ****: p<0.0001. The following figure supplements are available for Figure 5.
-
Figure 5—source data 1
Source data for Figure 5.
- https://doi.org/10.7554/eLife.44816.025
Figure 5—figure supplement 1
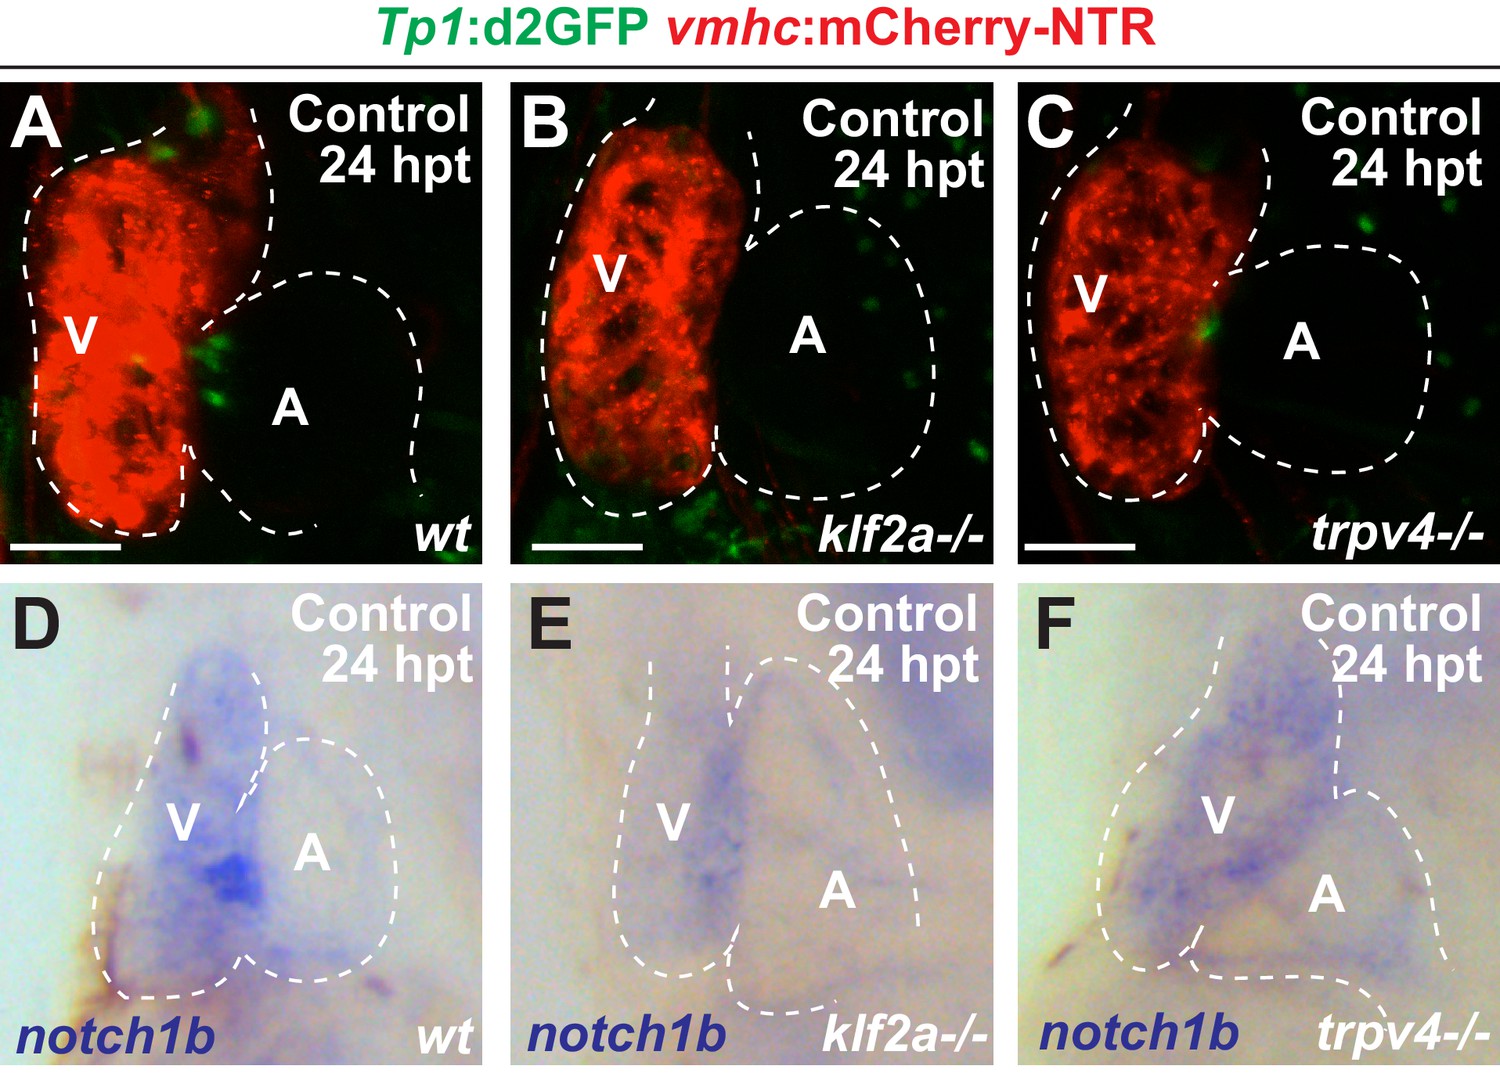
klf2a and trpv4 mutants display reduced endocardial Notch signaling.
(A–C) Confocal microscopy imaging performed on vmhc:mCherry-NTR, Tp1:d2GFP control hearts reveals reduced Tp1:d2GFP activation in (B) klf2a-/- and (C) trpv4-/- hearts at 24 hpt (6 dpf) when compared to (A) wild-type (wt) hearts (n = 15 control wt; 18 control trpv4-/-; 20 control klf2a-/-; 22 MTZ wt; 21 MTZ trpv4-/-; 18 MTZ klf2a-/-). (D–F) Whole-mount in situ hybridizations reveal reduced gene expression of notch1b in (E) klf2a-/- (n = 4/19) and (F) trpv4-/- (n = 14/29) vmhc:mCherry-NTR control hearts at 24 hpt (6 dpf) when compared to (D) wild-type (wt) hearts (n = 22/25). All confocal images shown are maximum intensity projections. V, ventricle; A, atrium; dpf, days post-fertilization; hpt, hours post-MTZ/DMSO treatment. Dashed lines outline the heart. Bars: 50 μm.
Figure 5—figure supplement 2
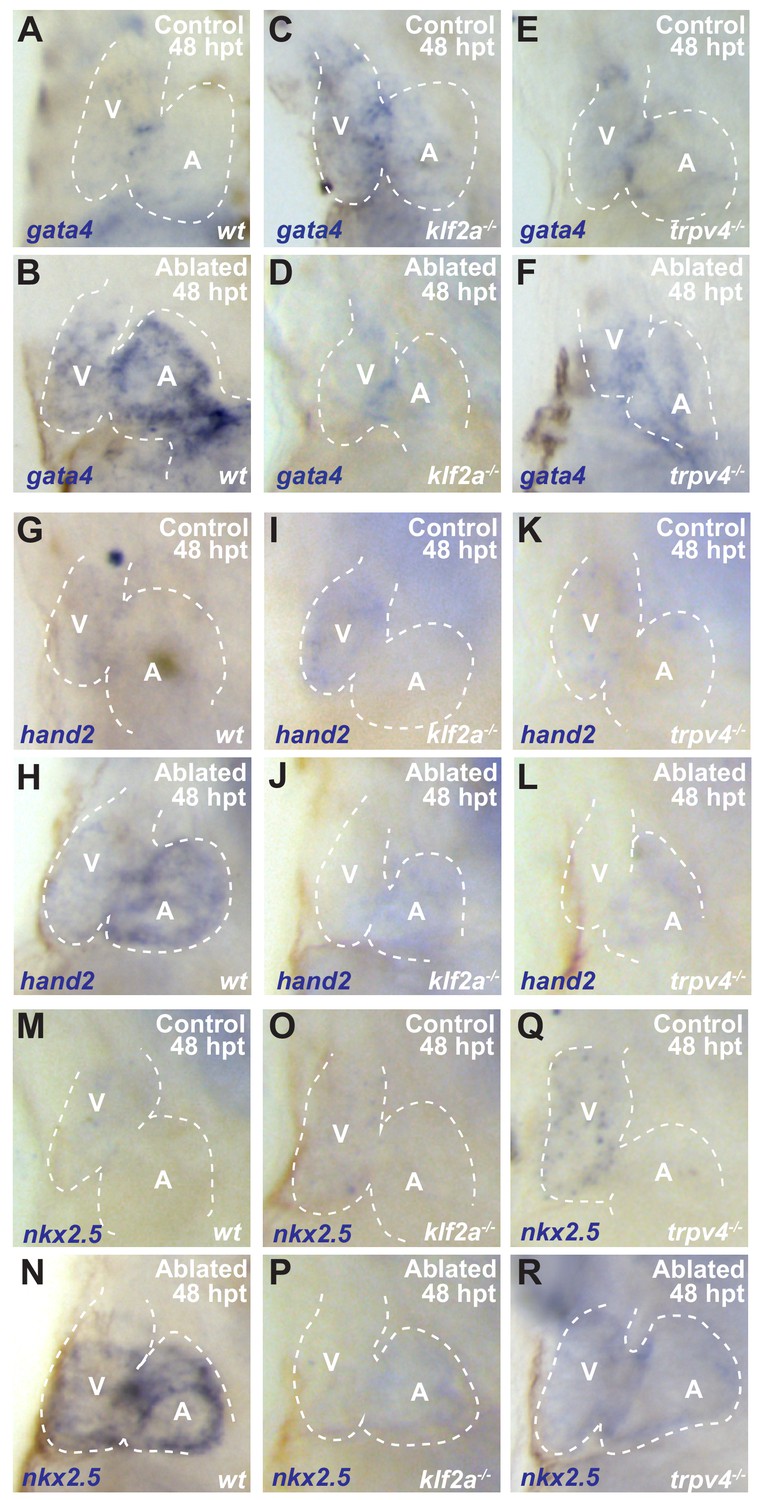
klf2a and trpv4 mutants show impaired post-injury re-activation of cardiogenesis transcription factors.
(A–R) Whole-mount in situ hybridizations show increased (B) gata4 (n = 21/24), (H) hand2 (n = 13/15) and (N) nkx2.5 (n = 12/13) expression in vmhc:mCherry-NTR ventricle-ablated wild-type (wt) hearts at 48 hpt (7 dpf) when compared to (A, G, M) sham-ablated control hearts. However, these cardiogenesis transcription factors fail to increase in (D, J, P) klf2a-/- (n = 7/21 gata4; n = 4/9 hand2; n = 5/14 nkx2.5) and (F, L, R) trpv4-/- (n = 7/17 gata4; n = 5/11 hand2; n = 5/12 nkx2.5) ventricle-ablated hearts. V, ventricle; A, atrium; dpf, days post-fertilization; hpt, hours post-MTZ/DMSO treatment. Dashed lines outline the heart. Bars: 50 μm.
Figure 5—video 1
High-speed bright-field imaging performed on wild-type control heart at 2 dpf shows normal blood flow.
https://doi.org/10.7554/eLife.44816.026
Figure 5—video 2
High speed bright-field imaging performed on trpv4 -/- mutant heart at 2 dpf shows normal blood flow.
https://doi.org/10.7554/eLife.44816.027
Figure 6 with 1 supplement
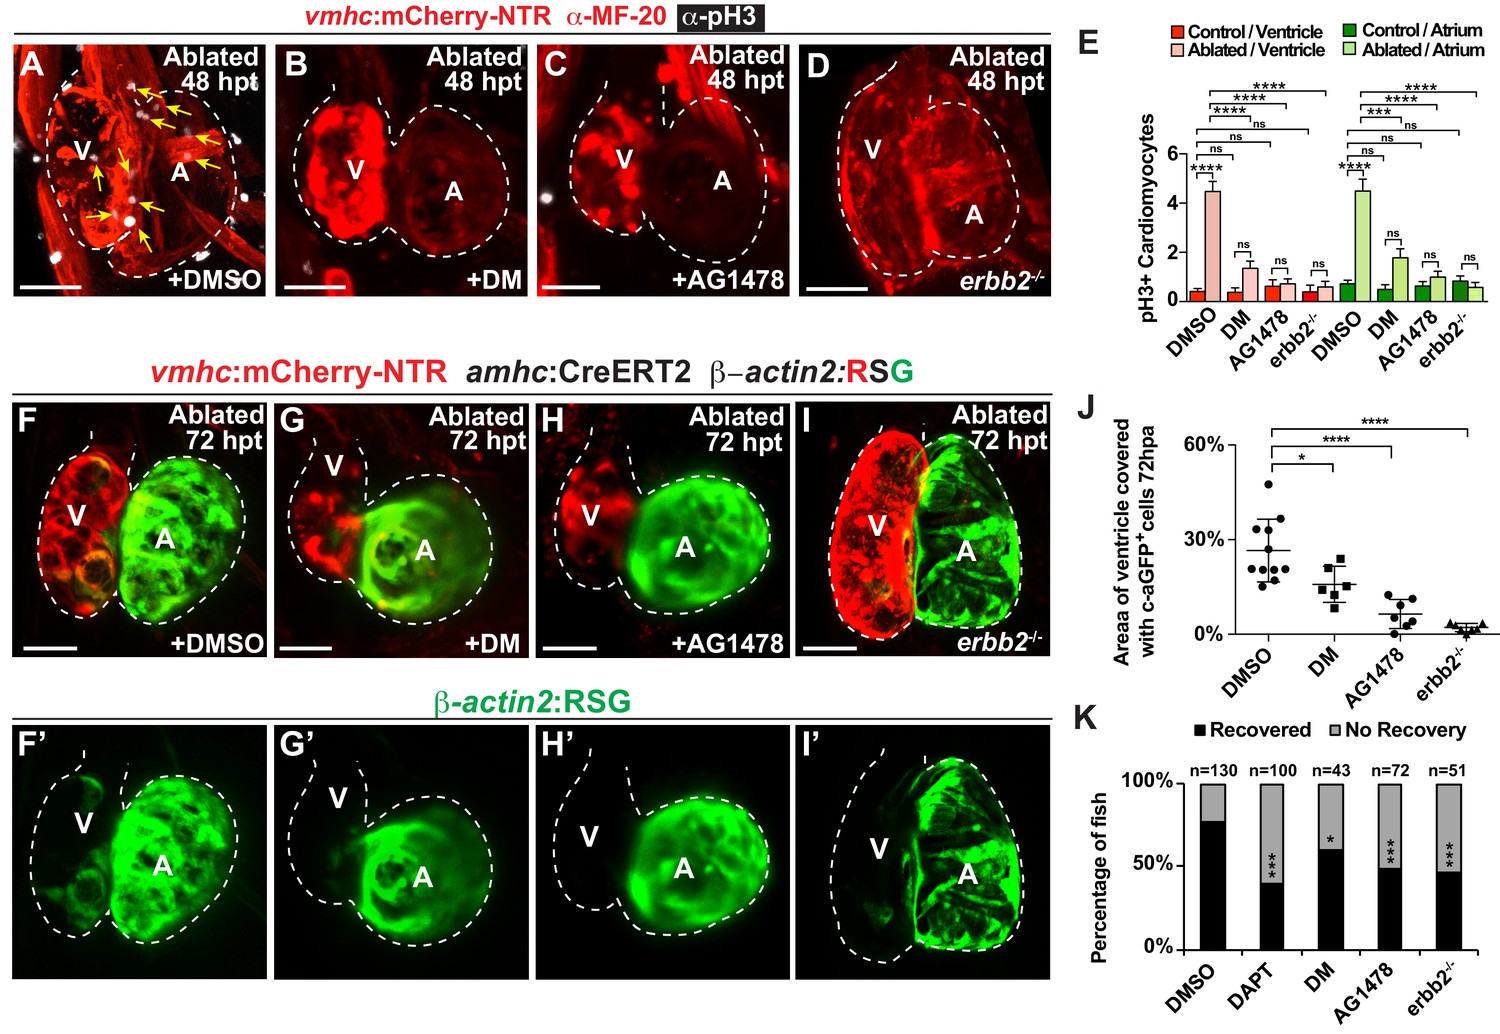
Erbb2 and BMP signaling regulate cardiac regeneration and atrial-to-ventricular trans-differentiation.
(A–D) Confocal microscopy performed on vmhc:mCherry-NTR ventricle-ablated hearts reveals that (B) dorsomorphin (DM) and (C) AG1478-treated as well as (D) erbb2 loss-of-function mutation (erbb2-/-) ventricle-ablated hearts exhibit reduced CM proliferative response when compared to (A) DMSO-treated ventricle-ablated hearts (control) at 48 hpt (7 dpf). White – anti-phospho-histone H3 immunostaining; red – anti-MF-20 immunostaining. Arrows point to proliferating CMs. (E) Quantitation of anti-phospho-histone H3+ CMs in these hearts confirms that dorsomorphin and AG1478 treatments as well as loss of erbb2 function (erbb2-/-) prevent CMs from proliferating in injured hearts (n = 15 each condition). Red bars – ventricle; green bars – atrium; dark bars – control sham-ablated hearts; light bars – ventricle-ablated hearts. (F–I) Confocal imaging of vmhc:mCherry-NTR; amhc:CreERT2; β-actin2:RSG ventricle-ablated hearts shows that (G) dorsomorphin (DM) or (H) AG1478 treatment as well as (I) erbb2-/- blocks the contribution of genetically-labeled atrial CMs (c-aGFP+) to the regenerating ventricle-ablated hearts when compared to (F) ventricle-ablated DMSO-treated control hearts at 72 hpt (8 dpf). Green channel – (F’–I’) genetically labeled c-aGFP+ atrial CMs. (J) Quantitation of the percentage of ventricular area covered with c-aGFP+ atrial CMs confirms that dorsomorphin or AG1478 treatments as well as loss of erbb2 function (erbb2-/-) prevent atrial CMs from regenerating the injured ventricle (n = 11 DMSO; 6 dorsomorphin; 7 AG1478; 7 erbb2 -/-). (K) Quantitation of the percentage of vmhc:mCherry-NTR ventricle-ablated hearts that display recovered ventricular tissue and contractility (black bars) at 96 hpt (9 dpf) confirms that inhibiting BMP signaling with dorsomorphin or Erbb2 signaling with AG1478 impairs heart regeneration. The number of fish analyzed for each condition is indicated above each column. All confocal images shown are maximum intensity projections. V, ventricle; A, atrium; dpf, days post-fertilization; hpt, hours post-MTZ/DMSO treatment. Dashed lines outline the heart. Bars: 50 μm. (E) Mean + s.e.m. ANOVA; (J) Mean + s.d. ANOVA; (K) Total numbers, Binomial test (versus DMSO); ns: p>0.05; *: p<0.05; **: p<0.01; ***: p<0.001; ****: p<0.0001. The following figure supplements are available for Figure 6.
-
Figure 6—source data 1
Source data for Figure 6.
- https://doi.org/10.7554/eLife.44816.030
Figure 6—figure supplement 1
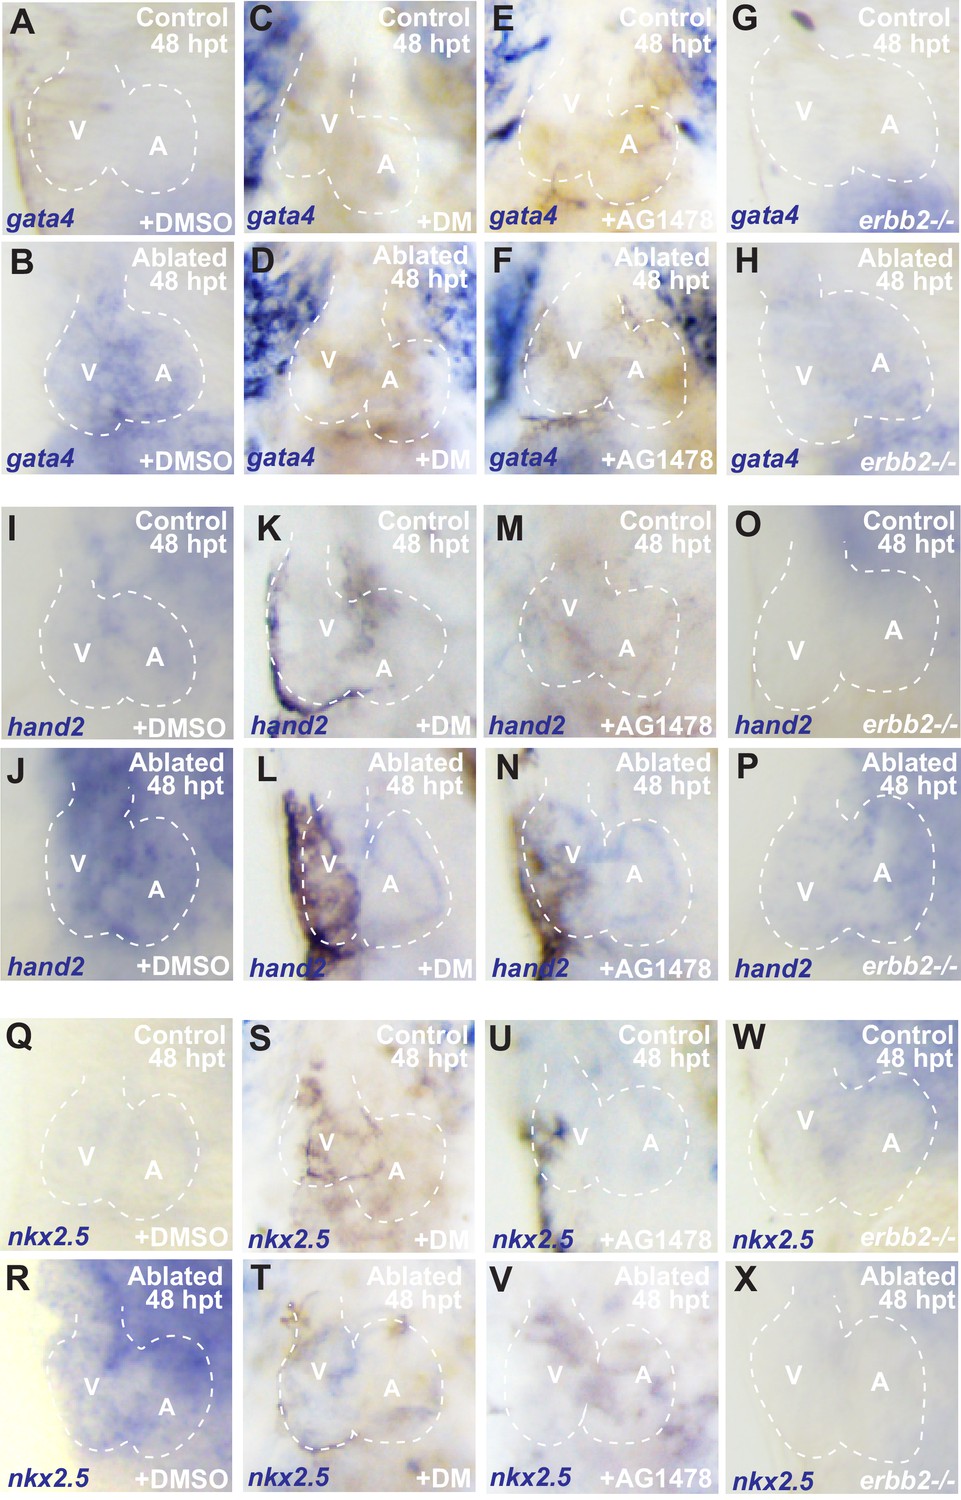
Inhibiting BMP or Erbb2 signaling impairs reactivation of early cardiogenesis transcription factors.
Whole-mount in situ hybridizations show increased (B) gata4 (n = 19/25), (J) hand2 (n = 10/12) and (R) nkx2.5 (n = 12/13) expression in vmhc:mCherry-NTR ventricle-ablated hearts at 48 hpt (7 dpf) when compared to (A, I, Q) sham-ablated control hearts. However, these cardiogenesis transcription factors fail to increase in (D, L, T) dorsomorphin (DM) (n = 4/21 gata4; n = 3/12 hand2; n = 4/16 nkx2.5) and (F, N, V) AG1478-treated ventricle-ablated hearts (n = 5/20 gata4; n = 1/8 hand2; n = 3/10 nkx2.5) as well as in (H, P, X) erbb2 loss-of-function mutation (erbb2-/-) (n = 4/18 gata4; n = 5/24 hand2; n = 3/15 nkx2.5). V, ventricle; A, atrium; dpf, days post-fertilization; hpt, hours post-MTZ/DMSO treatment. Dashed lines outline the heart.
Figure 7 with 2 supplements
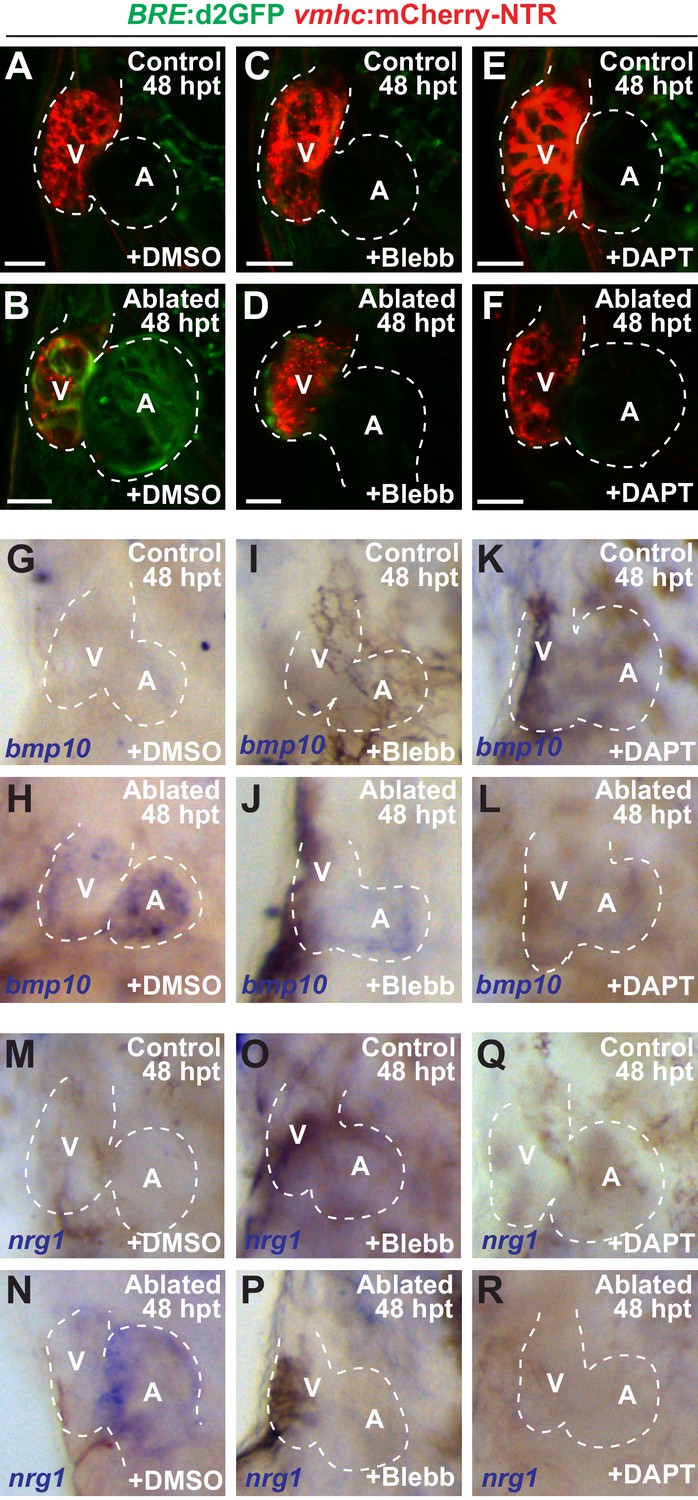
Blood flow regulates myocardial Erbb2 and BMP signaling through endocardial Notch.
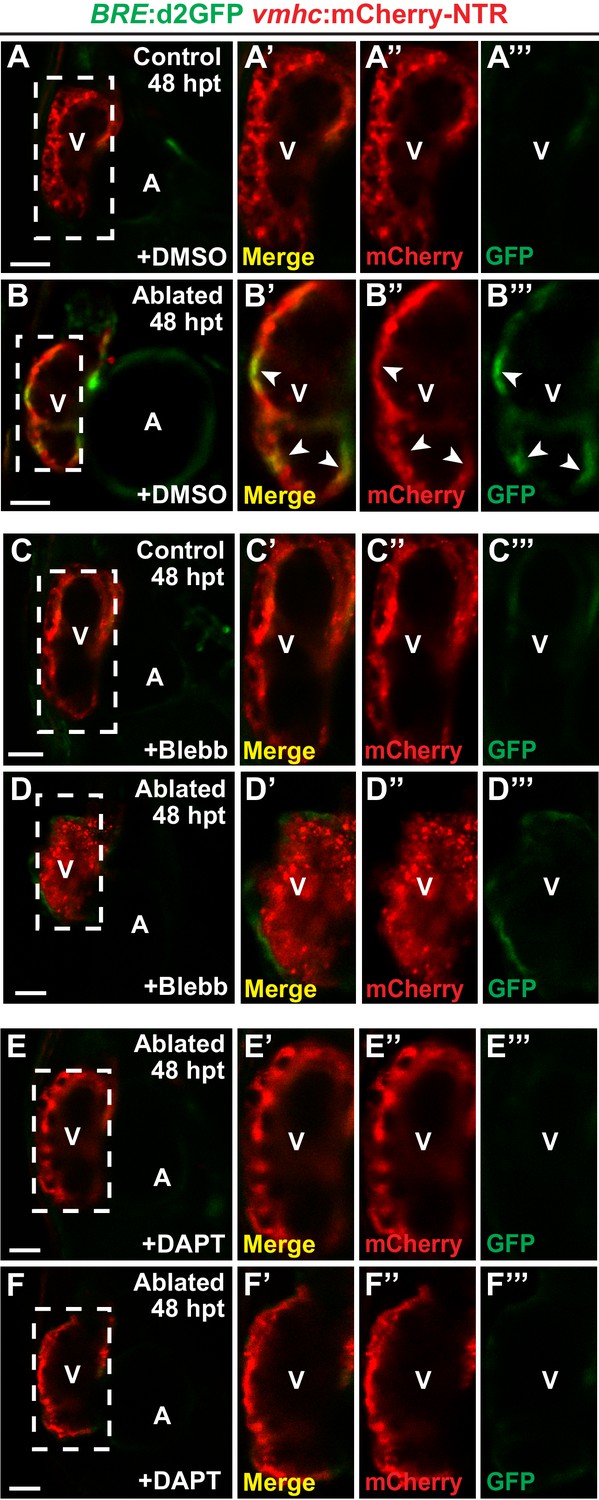
(A–F) Confocal imaging of BRE:d2GFP; vmhc:mCherry-NTR hearts at 48 hpt (7 dpf) shows that (B) BRE:d2GFP is activated after ventricular ablation (n = 21/21) when compared to (A) uninjured control hearts (n = 0/29); however, (D) blebbistatin (Blebb) (n = 0/11) or (F) DAPT (n = 0/14) treatment inhibits this BRE:d2GFP injury-induced activation. (G–R) Whole-mount in situ hybridizations reveal that bmp10 and nrg1 expression are increased in vmhc:mCherry–NTR (H, N) ventricle-ablated hearts (n = 13/14 bmp10; 7/8 nrg1) at 48 hpt (7 dpf) when compared to (G, M) control uninjured hearts (n = 0/18 bmp10; 0/13 nrg1), while treatment with (J, P) blebbistatin (n = 2/13 bmp10; 0/6 nrg1) or (L, R) DAPT (n = 4/16 bmp10; 0/7 nrg1) inhibits the injury-induced activation of bmp10 and nrg1. All confocal images shown are maximum intensity projections. V, ventricle; A, atrium; dpf, days post fertilization; hpt hours post-MTZ/DMSO treatment. Dashed lines outline the heart. Bars: 50 μm. The following figure supplements are available for Figure 7.
Figure 7—figure supplement 1
Myocardial specific activation of BMP signaling.
(A–F) Confocal single-stacks corresponding to the projections shown in Figure 7A–F show (B–B’’’) BRE:d2GFP is activated in the myocardium of ablated hearts at 48 hpt (seven dpf) (n = 21/21), in contrast to (A–A’’’) uninjured controls (n = 0/29). (B’–B’’’) Magnifications of the boxed area in (B) show (B’) co-localization (arrowheads) of BRE:d2GFP and vmhc:mCherry-NTR. However, (D–D’’’) blebbistatin (Blebb) (n = 0/11) or (F–F’’’) DAPT (n = 0/14) treatment inhibits this myocardial BRE:d2GFP injury-induced activation. (A’–F’) merge; (A’’–F’’) Red channel - vmhc:mCherry-NTR; (A’’’–F’’’) Green channel-BRE:d2GFP. V, ventricle; A, atrium. hpt, hours post-MTZ/DMSO treatment.
Figure 7—figure supplement 2
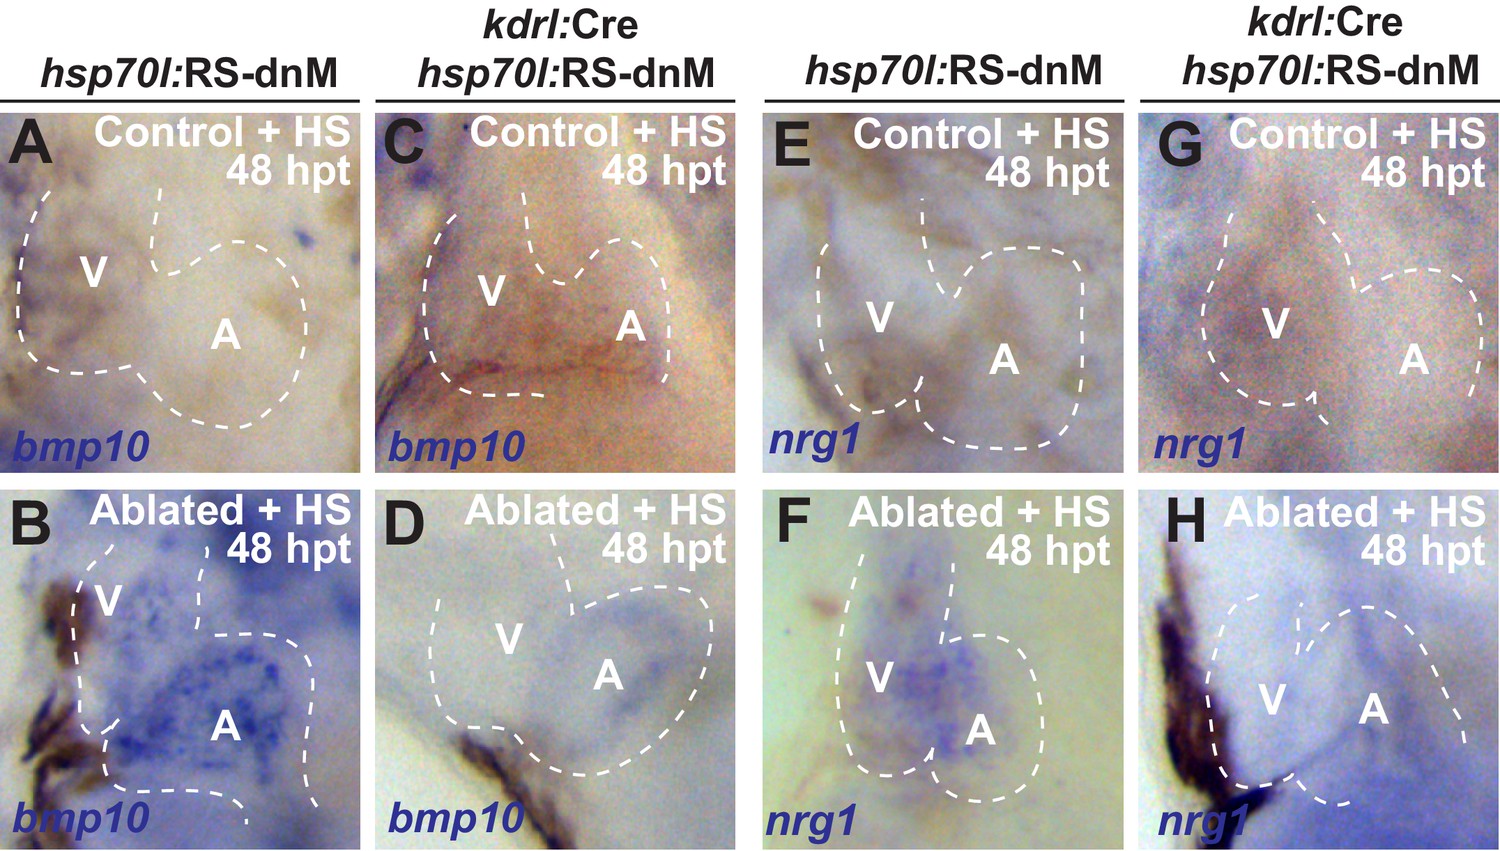
Endocardial specific inhibition of Notch signaling blocks post-injury activation of bmp10 and nrg1.
Whole-mount in situ hybridizations of heat-shocked (HS) (A, B, E, F) vmhc:mCherry-NTR; hsp70l:RS-dnM or (C, D, G, H) vmhc:mCherry-NTR; kdrl:Cre; hsp70l:RS-dnM hearts show that dnMAML endocardial expression can block (D, H) bmp10 and nrg1 (n = 3/19 bmp10; 0/8 nrg1) activation after ventricle-injury at 48 hpt (7 dpf) when compared to (B, F) ventricle-ablated control hearts (n = 21/21 bmp10; n = 18/19 nrg1). V, ventricle; A, atrium; dpf, days post-fertilization; hpt, hours post-MTZ/DMSO treatment. Dashed lines outline the heart.
Author response image 1
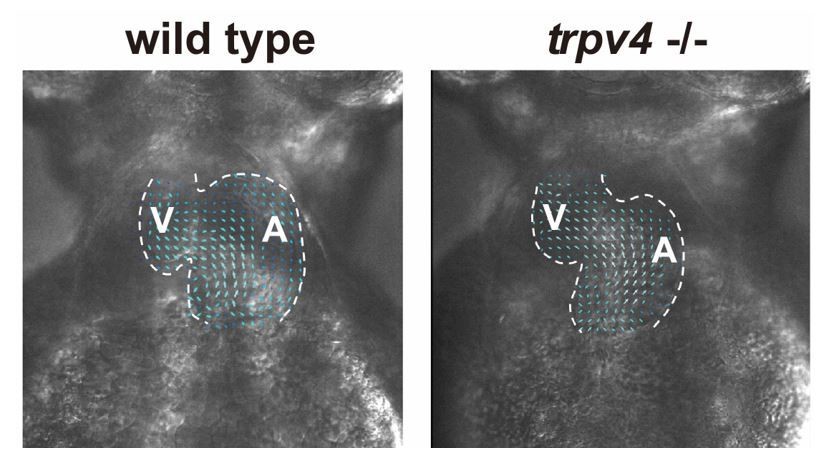
Wild-type control and trpv4 -/- mutant hearts display similar blood flow patterns.
High speed imaging was performed on wild-type control and trpv4 -/- mutant hearts at 2-3 dpf. Arrows represent particle image velocimetry (PIV) generated vectors from blood flow.
Videos
Author response video 1
trpv4 mutant video.
https://doi.org/10.7554/eLife.44816.037
Author response video 2
Wild type video.
https://doi.org/10.7554/eLife.44816.038Additional files
-
Transparent reporting form
- https://doi.org/10.7554/eLife.44816.034
Download links
A two-part list of links to download the article, or parts of the article, in various formats.
Downloads (link to download the article as PDF)
Open citations (links to open the citations from this article in various online reference manager services)
Cite this article (links to download the citations from this article in formats compatible with various reference manager tools)
Hemodynamic-mediated endocardial signaling controls in vivo myocardial reprogramming
eLife 8:e44816.
https://doi.org/10.7554/eLife.44816


