Natural Tr1-like cells do not confer long-term tolerogenic memory
- Stanford University School of Medicine, United States
- University of Oxford, United Kingdom
- University of Calgary, Canada
- Massachusetts General Hospital, Harvard Medical School, United States
- The University of Alabama at Birmingham, United States
- Stanford University, United States
Figures
Figure 1
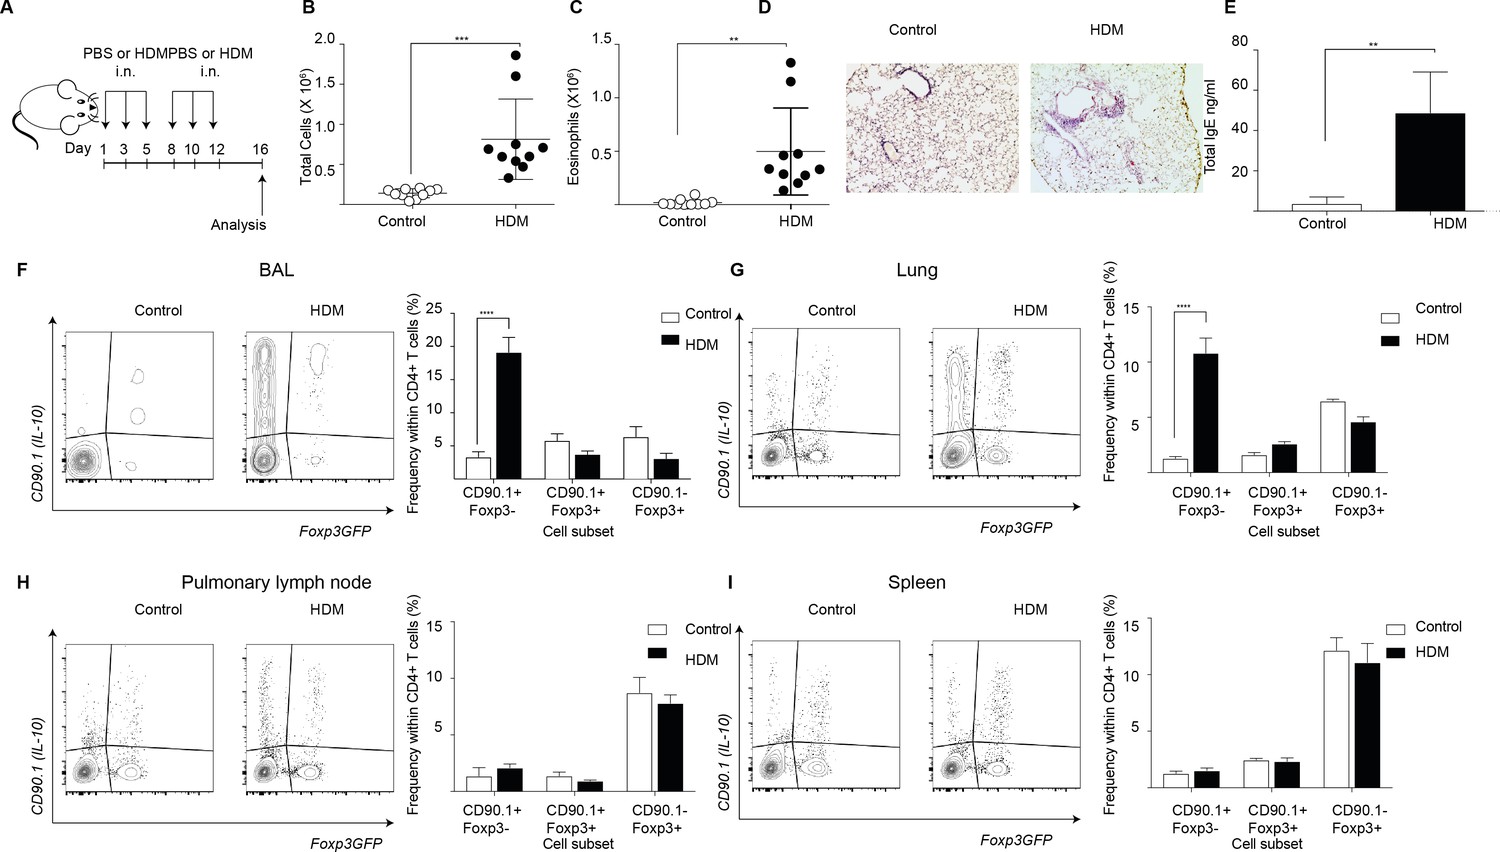
IL-10-producing T cells accumulate at site of allergen sensitization.
C57Bl/6 mice were administered either PBS as control or crude HDM containing 20μg total protein in 50μl intranasally (i.n.) Six times over 2 weeks as shown. Terminal analysis was performed 4 days after last challenge. (B) The total number of cells and (C) total number of eosinophils in the BAL were determined. Data are pooled from two experiments. Each symbol represents a single animal. Error bars represent standard error of mean. n=10 for control group, n=10 for HDM group. (D) Representative haematoxylin and eosin stained lung sections showing perivascular and peribronchiolar inflammation in PBS control and HDM-sensitized animals. (E) The level of IgE in BAL supernatant was determined by ELISA. n=5 for control group, n=5 for HDM group. Error bars represent standard deviation of mean. Statistical significance was determined using an unpaired two tailed students t-test. Representative flow cytometry plots showing different T cell subsets as identified by surface expression of CD90.1 and Foxp3eGFP in the (F) BAL, (G) lungs, (H) pulmonary lymph nodes, and (I) spleens of control or HDM-treated mice 4 days after final challenge. The frequency of IL-10-producing Foxp3- (CD90.1+Foxp3-), IL-10-producing Foxp3+ (CD90.1+Foxp3+) and Foxp3+ cells which do not produce IL-10 (CD90.1-Foxp3+) within all CD4+ T cells in the four sites are plotted. Data are pooled from two experiments. Error bars represent standard error of mean. n=10 for control group, n=10 for HDM group. Data are representative of 4 independent experiments. Statistical significance was determined using 2-way ANOVA (post hoc test: Sidaks). *P0.05, **P0.01, ***P0.001 ****P0.0001. PBS=Phosphate buffered saline, HDM=house dust mite, i.n=intranasally, BAL=bronchoalveolar lavage.
-
Figure 1—source data 1
IL-10-producing T cells accumulate at site of allergen sensitization.
- https://doi.org/10.7554/eLife.44821.003
Figure 2

IL-10-producing cells are located in the lung parenchyma at peak of inflammation.
Intravascular (IV) labeling of cells was performed by retro orbital injection of CD45 antibody and animals were euthanized 2 minutes after injection. Analysis was carried at peak of inflammation day 16-post first house dust mite challenge. (A) Efficacy of labeling of cells was assessed in blood and in the lungs. (B) The proportion of cells in blood and lung, which were labeled with antibody IV, was quantified. Error bars are standard deviation. Statistical significance was determined using a paired two tailed students t-test. n.d = not detected (C) Gating scheme showing the different subsets: CD90.1+ (IL-10+) Foxp3-, CD90.1+ (IL-10+) Foxp3+, CD90.1- (IL-10-) Foxp3+ and CD90.1- (IL-10-) Foxp3- within the CD4 T cells in the lungs. The proportion of circulating CD45+IV labeled cells or tissue-resident (CD45-) within the CD90.1+ (IL-10+) Foxp3-, CD90.1- (IL-10-) Foxp3+ and CD90.1- (IL-10-) Foxp3- is also shown. (D) Proportion of cells, which are circulating or resident within the CD90.1+ (IL-10+) Foxp3-, (E) within CD90.1- (IL-10-) Foxp3+ and (F) within CD90.1- (IL-10-) Foxp3- was quantified. Data are representative of 2 independent experiments**P0.01.
-
Figure 2—source data 1
IL-10-producing cells are located in the lung parenchyma at peak of inflammation.
- https://doi.org/10.7554/eLife.44821.005
Figure 3 with 1 supplement
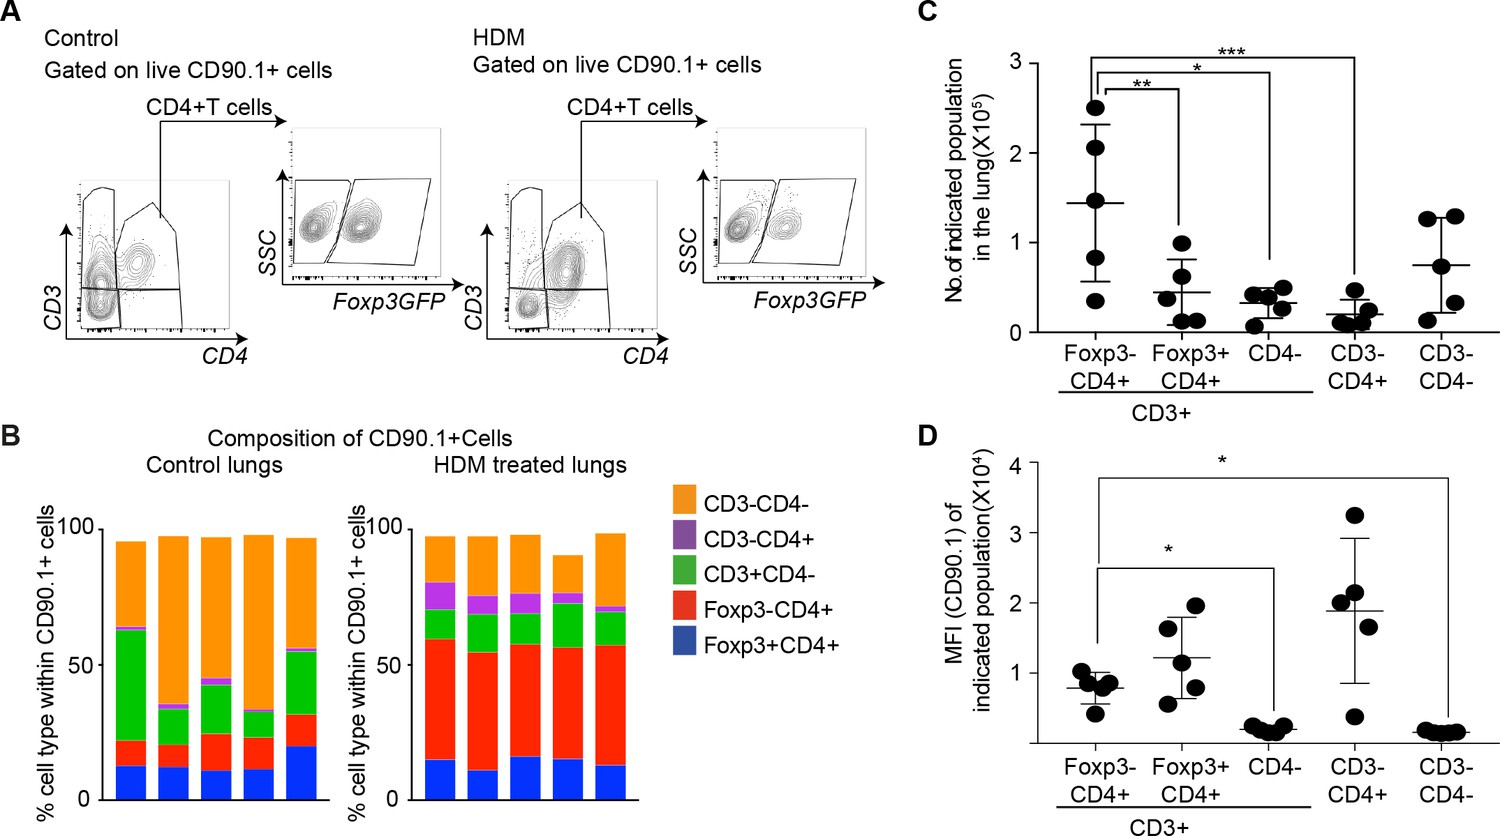
CD4+Foxp3- T cells are the prominent IL-10 competent cells at the peak of inflammatory response.
(A) Gating scheme to identify the composition of IL-10-producing cells in the lungs of control or HDM- treated mice. (B) Composition of IL-10-producing cells is shown by plotting the frequency of indicated cell types within all IL-10-producing (CD90.1+) cells in control or HDM-treated lungs. Each column is one animal. n=5 for control group, n=5 for HDM group. (C) Total number of indicated subsets in the lungs of HDM-treated animals at peak of inflammation. (D) Median fluorescence intensity of CD90.1 in indicated subsets. Statistical significance was determined using one-way ANOVA (post hoc test: Tukey). Data representative of three independent experiments. *P0.05, **P0.01, ***P0.001.
-
Figure 3—source data 1
CD4+Foxp3- T cells are the prominent IL-10 competent cells at the peak of inflammatory response.
- https://doi.org/10.7554/eLife.44821.009
Figure 3—figure supplement 1

Frequency and composition of splenic IL-10-producing cells is comparable in control and HDM-treated mice.
(A) The frequency of IL-10-producing cells in all live cells in the spleens of control or HDM-treated mice, 4 days after the final challenge is plotted. Data are pooled from two experiments. Each symbol represents a single animal. Error bars represent standard error of mean. n = 10 for control group, n = 10 for HDM group. (B) Composition of IL-10-producing cells in spleens is shown by plotting the frequency of indicated cell types within all IL-10-producing (CD90.1+) cells. Data are pooled from two experiments. Error bars represent standard error of mean. n = 10 for control group, n = 10 for HDM group. (F) Pie charts represent the composition of IL-10-producing cells by based on mean values derived from 10 controls or 10 HDM- treated mice. Data representative of three independent experiments.
-
Figure 3—figure supplement 1—source data 1
Frequency and composition of splenic IL-10-producing cells is comparable in control and HDM-treated mice.
- https://doi.org/10.7554/eLife.44821.008
Figure 4 with 1 supplement
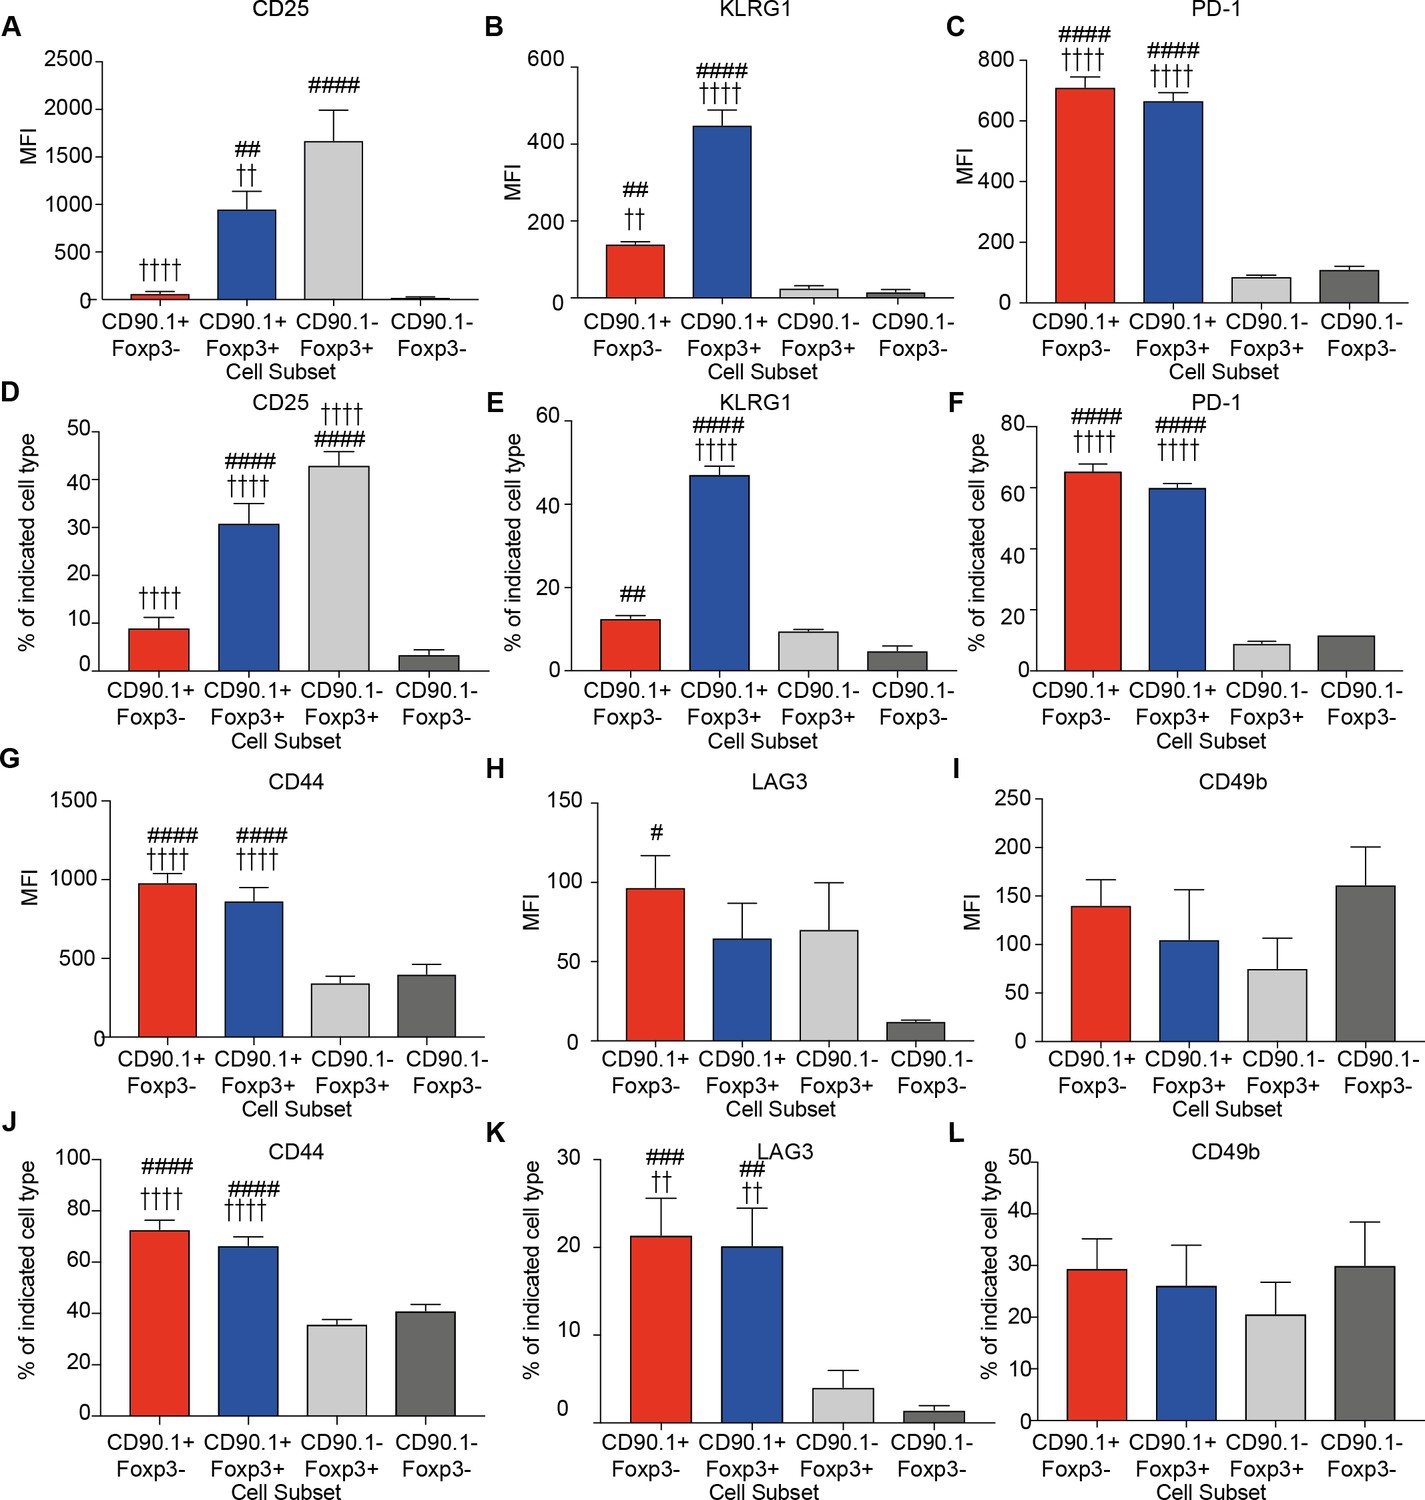
Phenotype of lung CD4 T cell subsets at the peak of inflammation.
The median fluorescence intensity of (A) CD25, (B) KLRG1, (C) PD-1, and percentage of (D) CD25, (E) KLRG1, (F) PD-1 and MFI of (G) CD44, (H) LAG3, (I) CD49b and percentage of (J) CD44, (K) LAG3 and (L) CD49b in indicated CD4+ T cell subsets in the lungs of HDM-treated mice 4 days after last challenge. Data are pooled from 2 experiments. Error bars represent standard error of mean. n=9-10 for control group, n=9-10 for HDM group for CD44, LAG3, CD49b and CD25. n=5 for control group, n=5 for HDM group for KLRG-1 and PD-1. Statistical significance was determined using 2-way ANOVA (post hoc test: Bonferroni). Data are representative of three independent experiments. # represents significant difference from CD90.1-Foxp3- cells and represents significant difference from CD90.1-Foxp3+ cells. #P0.05, ## P0.01, P0.01, ####P0.001 P0.001.
-
Figure 4—source data 1
Phenotype of lung CD4 T cell subsets at the peak of inflammation.
- https://doi.org/10.7554/eLife.44821.013
Figure 4—figure supplement 1
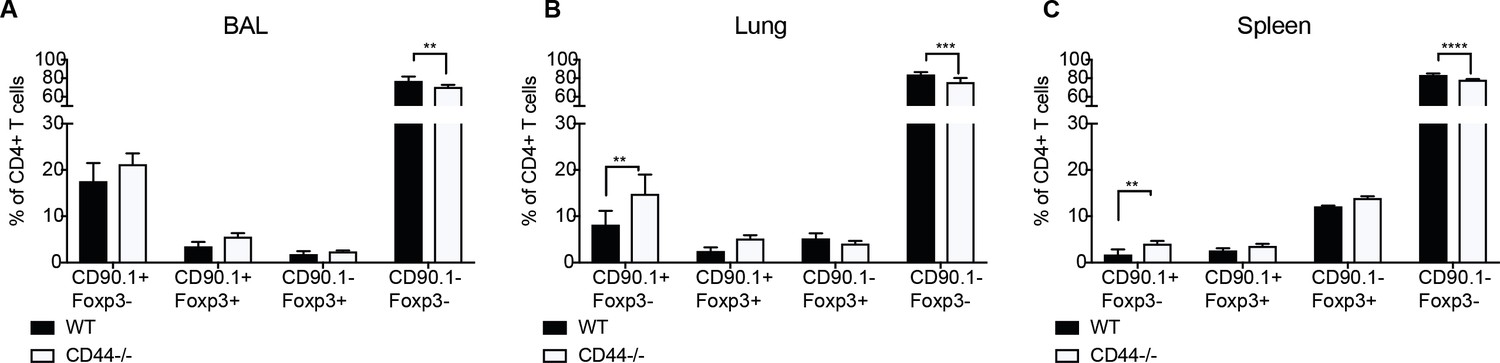
IL-10-producing CD4+ T cells do not require CD44.
10BiT reporter mice on a Wildtype C57Bl/6 or CD44-/- background were administered HDM six times over 2 weeks and terminal analysis was performed 4 days after last challenge. The frequency of IL-10-producing Foxp3- (CD90.1+Foxp3-), IL-10-producing Foxp3+ (CD90.1+Foxp3+) and Foxp3+ cells which do not produce IL-10 (CD90.1-Foxp3+) within all CD4+ T cells in the (A) BAL, (B) lungs and (C) spleen are plotted. Error bars represent standard deviation of mean. n=5 for wildtype group, n=4 for CD44-/- group. Statistical significance was determined using 2-way ANOVA (post hoc test: Sidaks). **P0.01, ***P0.001, ****P0.0001.
-
Figure 4—figure supplement 1—source data 1
IL-10-producing CD4+ T cells do not require CD44.
- https://doi.org/10.7554/eLife.44821.012
Figure 5 with 1 supplement
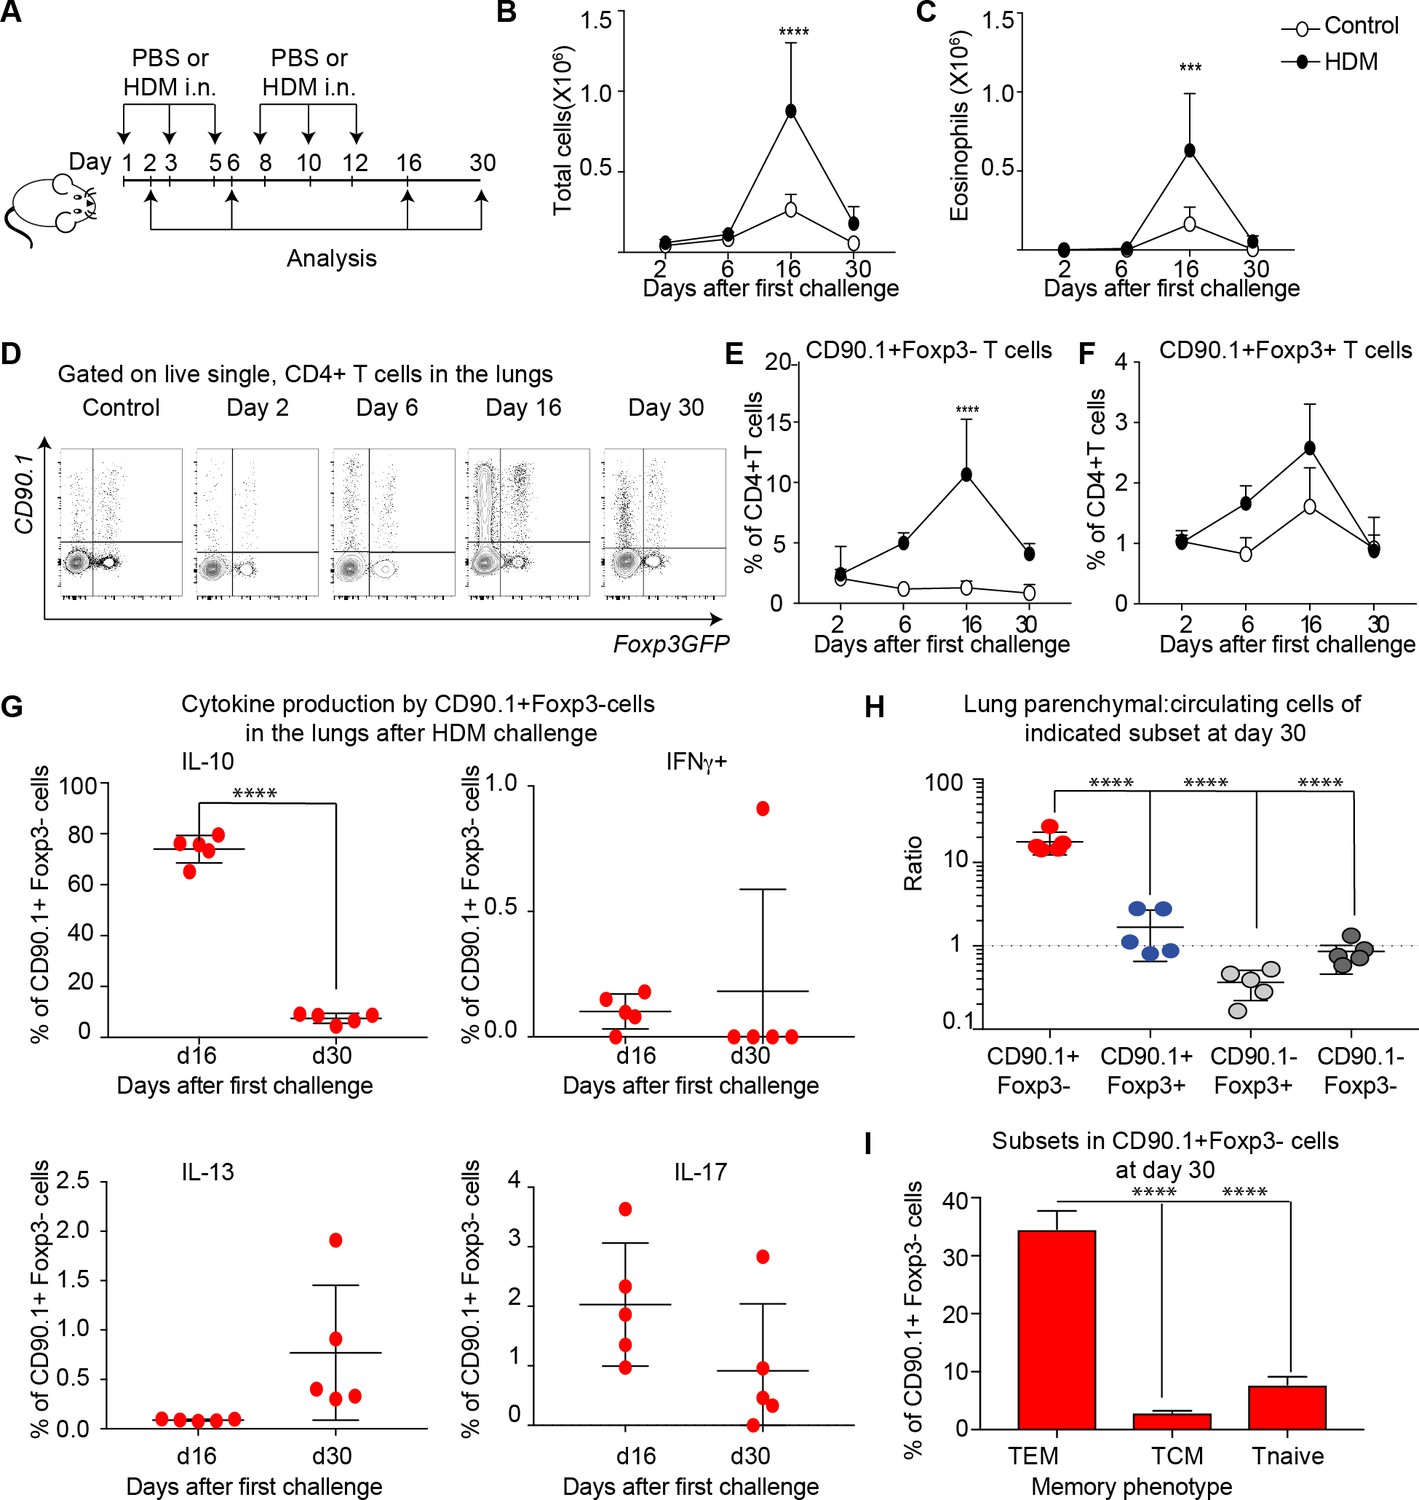
IL-10 production by Tr1-like cells is transient and wanes after peak of inflammation.
(A) 10BiT reporter mice on a C57Bl/6 background were administered PBS as control or HDM and analysis was performed on groups of mice at the indicated times shown. (B) The total number of cells and (C) total number of eosinophils in the BAL were determined. n=3-5 animals per group per time point. Error bars represent standard deviation of the mean. (D) Representative flow cytometry plots showing the kinetics of IL-10-producing T cell subsets as identified by surface expression of CD90.1 and Foxp3+ regulatory T cell subsets as identified by GFP expression. The frequency of (E) IL-10-producing Foxp3- (CD90.1+Foxp3-), (F) IL-10-producing Foxp3+ (CD90.1+Foxp3+) within all CD4+ T cells is plotted at indicated analysis days. n=3-5 animals per group per time point. Error bars represent standard deviation of the mean. Statistical significance was determined using 2-way ANOVA (post hoc test: Sidaks). (G) Cells from lungs of HDM- treated mice obtained after Day 26 and day 30 were stimulated with PMA, Ionomycin and Brefeldin and surface stained, fixed and permeabilized for detection of cytokines. The frequency of CD90.1+Foxp3- T cells producing IL-10, IFNγ, IL-13 and IL-17 is shown for indicated time points. (H) To identify lung resident T cells, intravascular (IV) labeling of cells was performed by retroorbital injection of CD45 antibody and mice were euthanized 2 minutes after injection. The ratio of resident to circulating cells within indicated CD4+ T cells from lungs of HDM-treated mice obtained at day 30 post first challenge is plotted. (I) The frequency of effector (TEM) (CD62l-CD44+), central (TCM) (CD62l+CD44+), and naïve subsets(CD62L+CD44-) within CD90.1+Foxp3- cells in lungs at day 30 post first allergen challenge is plotted. Data representative of three independent experiments ***P0.001, ****P0.0001 GFP= green fluorescent protein. PMA= phorbol myristate acetate, IFNγ= Interferon gamma.
-
Figure 5—source data 1
IL-10 production by Tr1-like cells is transient and wanes after peak of inflammation.
- https://doi.org/10.7554/eLife.44821.017
Figure 5—figure supplement 1
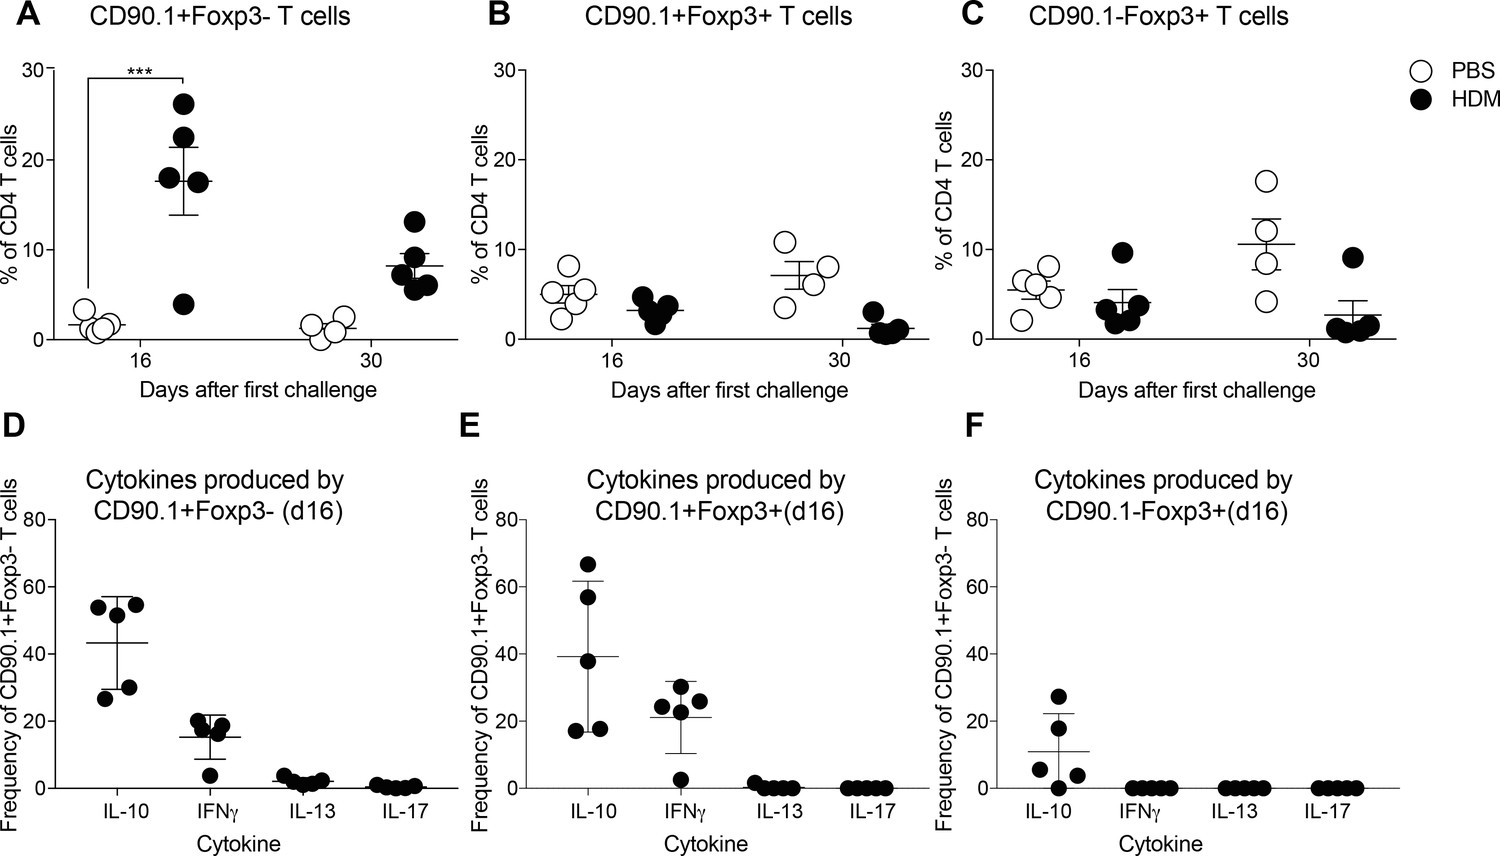
CD90.1+Foxp3-, CD90.1+Foxp3+ and CD90.1-Foxp3- cells frequency and cytokine production in the BAL.
(A) Frequency of CD90.1+Foxp3- (B) CD90.1+Foxp3+ (C) CD90.1-Foxp3+ cells within CD4 T cells in BAL of control and HDM-treated animals at indicated timepoints post challenge. CD4 cells from BAL of HDM- treated mice were restimulated with PMA, Ionomycin and Brefeldin A, surface stained, fixed, and permeabilized for detection of cytokines. The frequency of cells producing IL-13, IL-17, and IFNγ within (D) CD90.1+Foxp3- (E) CD90.1+Foxp3+ and (F) CD90.1-Foxp3+ CD4+ T cells are shown. Statistical significance was determined using 2-way ANOVA (post hoc test: Sidaks). ***P0.001.
-
Figure 5—figure supplement 1—source data 1
CD90.1+Foxp3-, CD90.1+Foxp3+ and CD90.1-Foxp3- cells frequency and cytokine production in the BAL.
- https://doi.org/10.7554/eLife.44821.016
Figure 6 with 1 supplement
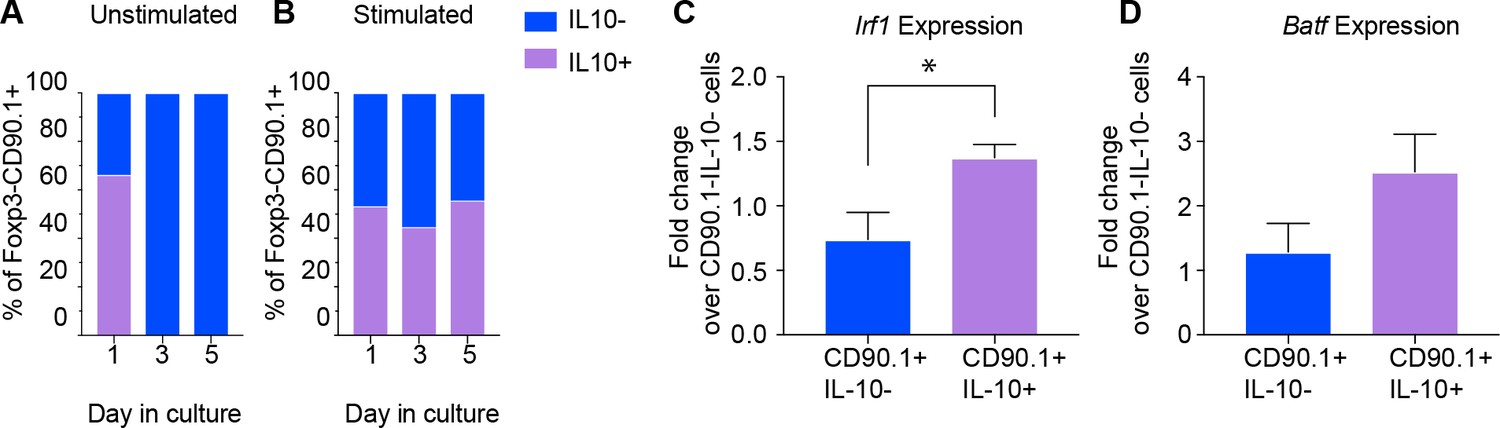
Active IL-10 production is associated with Irf1 and Batf expression.
CD90.1- and CD90.1+ CD4 T cells were isolated from 10BiT spleens and cultured (A) unstimulated in plain media or (B) with CD3/CD28 stimulation for 5 days to assess kinetics of Thy1.1 surface expression and intracellular IL-10 cytokine staining. (C) Irf1 expression and (D) Batf expression in indicated subsets obtained from in vitro differentiated Tr1 cell cultures. Data was normalized to beta actin as reference gene and is expressed as fold change over 90.1-IL-10- cells using delta Ct method. Expression data are pooled from five independent experiments.
-
Figure 6—source data 1
Active IL-10 production is associated with Irf1 and Batf expression.
- https://doi.org/10.7554/eLife.44821.021
Figure 6—figure supplement 1
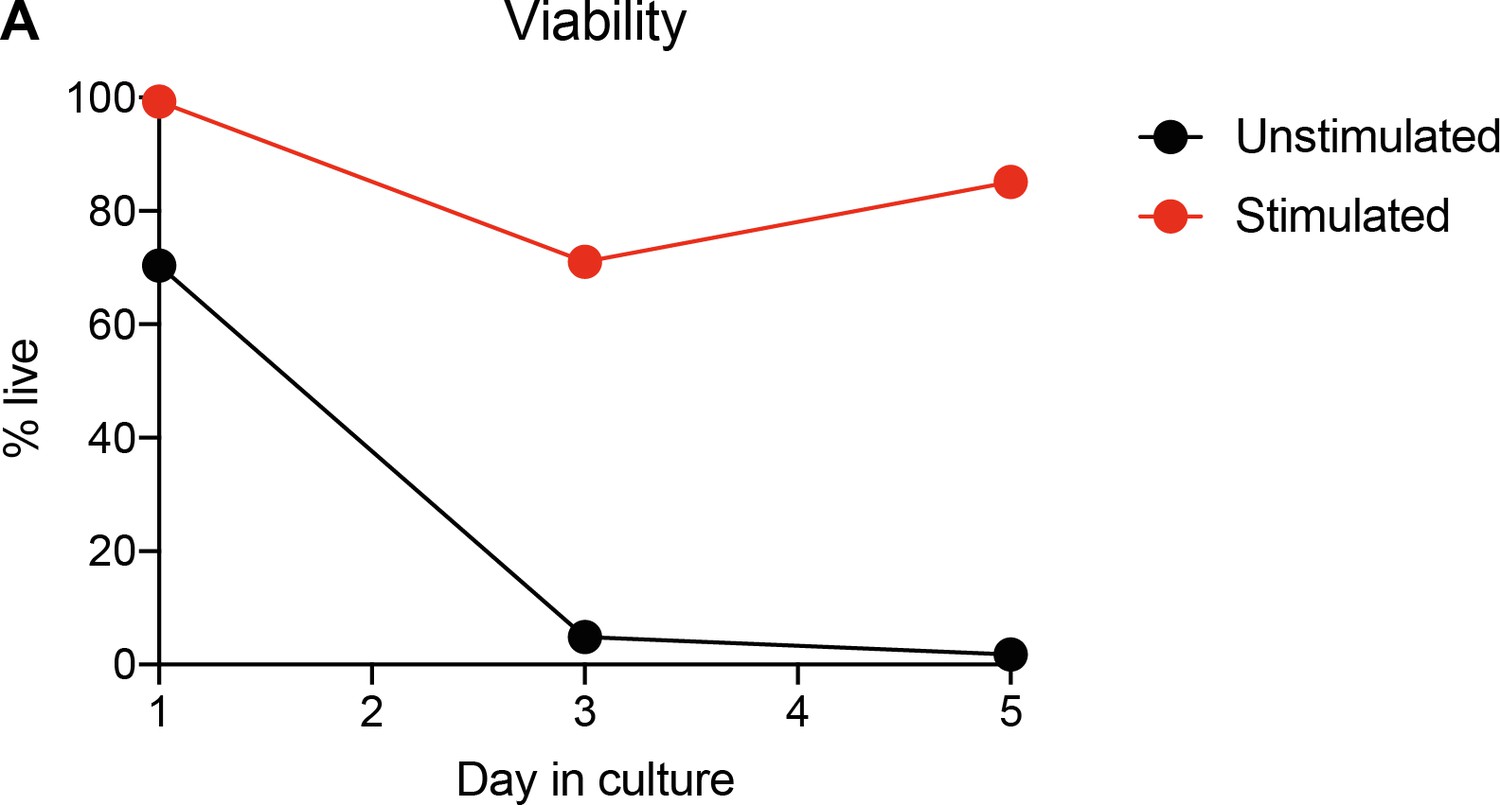
Viability of ex vivo Tr1 cells with and without TCR stimulation.
CD90.1- and CD90.1+ CD4 T cells were isolated from 10BiT spleens and cultured unstimulated in plain media or with CD3/CD28 stimulation for 5 days. One aliquot was removed each day, stained with ZombieAqua viability stain, and fixed. Samples from all days were run together for viability analysis on via flow cytometry.
-
Figure 6—figure supplement 1—source data 1
Viability of ex vivo Tr1 cells with and without TCR stimulation.
- https://doi.org/10.7554/eLife.44821.020
Figure 7 with 2 supplements
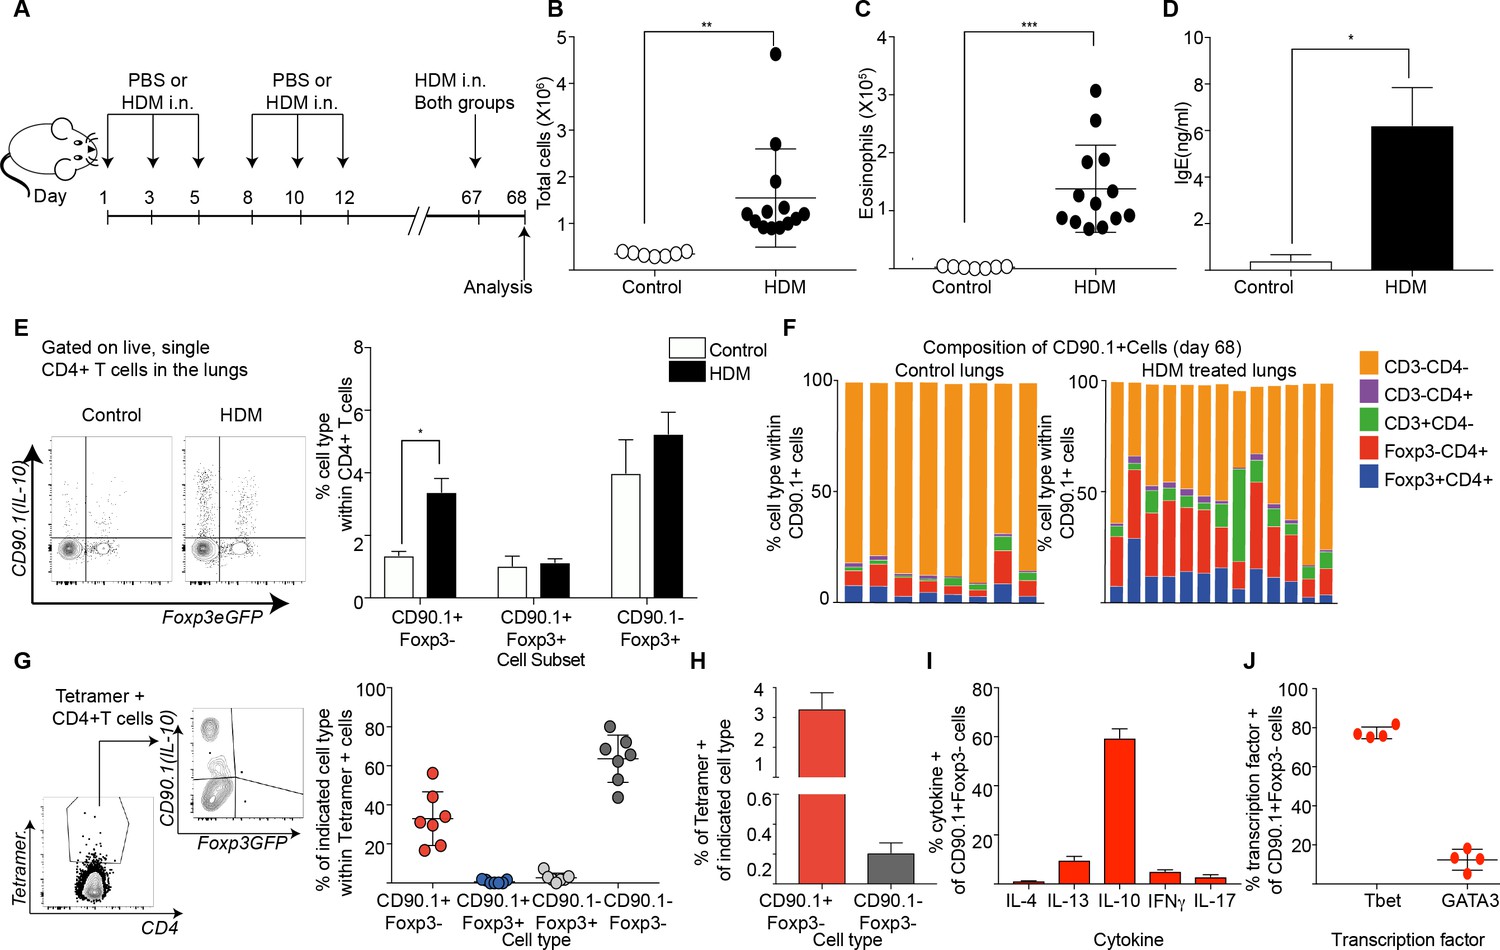
Tr1-like cells contribute to allergen-specific memory T-cells in the lung.
(A) Mice were administered either PBS as control or crude HDM intranasally (i.n.) Six times over 2 weeks as shown. The mice were then left unchallenged until day 67 when both PBS (control) and HDM-sensitized animals were challenged with HDM. Analysis was done one day after the rechallenge at day 68. (B) The total number of cells in the BAL was determined. Data are pooled from two experiments. Each symbol represents a single animal. Error bars represent standard error of mean. n=7 for control group, n=13 for HDM group. Statistical significance was determined using an unpaired two tailed students t test. (C) The total number of eosinophils in the BAL is also plotted. Data are pooled from two experiments. Each symbol represents a single animal. Error bars represent standard error of mean. n=7 for control group, n=13 for HDM group. Statistical significance was determined using an unpaired two tailed students t test. **P0.01, ***P0.001. (D) The level of IgE in BAL supernatant was determined by ELISA. n=8 for control group n=16 for HDM group. (E) Representative flow cytometry plot showing all IL-10-producing cells within CD4+ T cells in lungs of control or HDM-treated animals at day 68. (F) Composition of IL-10-producing cells is shown by plotting the frequency of indicated cell types within all IL-10-producing (CD90.1+) cells. Data are pooled from two experiments. Each column is an individual animal. (G) Gating scheme showing the HDM specific T cells stained using Derp1 tetramer and the different T cell subsets that constitute the tetramer + CD4+ T cells in the lungs of HDM-treated animals. The frequency of IL-10-producing Foxp3- (CD90.1+Foxp3-), IL-10-producing Foxp3+ (CD90.1+Foxp3+), Foxp3+ cells which do not produce IL-10 (CD90.1-Foxp3+) and CD90.1-Foxp3- within all CD4+ T cells is plotted. (H) The frequency of Tetramer + cells within CD90.1-Foxp3- and CD90.1+Foxp3- cells in the lungs of HDM-treated animals is plotted. Error bars represent standard deviation of the mean. n=7. (I) PMA, Ionomycin and Brefeldin stimulated CD4 T cells from lungs of HDM-treated mice were surface stained, fixed and permeabilized for detection of cytokines. The frequency of cells producing IL-4, IL-13, IL-10, IFNγ and IL-17 within CD90.1+ Foxp3- (Tr1-like) CD4+ T cells is shown. Data are pooled from two experiments. N is between 4-13 mice per cytokine (J). The frequency of cells expressing transcription factors Tbet and GATA3 the within CD90.1+ Foxp3- (Tr1-like) CD4+ T cells is shown. Error bars represent standard deviation of mean. n=13. Data representative of three independent experiments.
-
Figure 7—source data 1
Tr1-like cells contribute to allergen-specific memory T-cells in the lung.
- https://doi.org/10.7554/eLife.44821.027
Figure 7—figure supplement 1
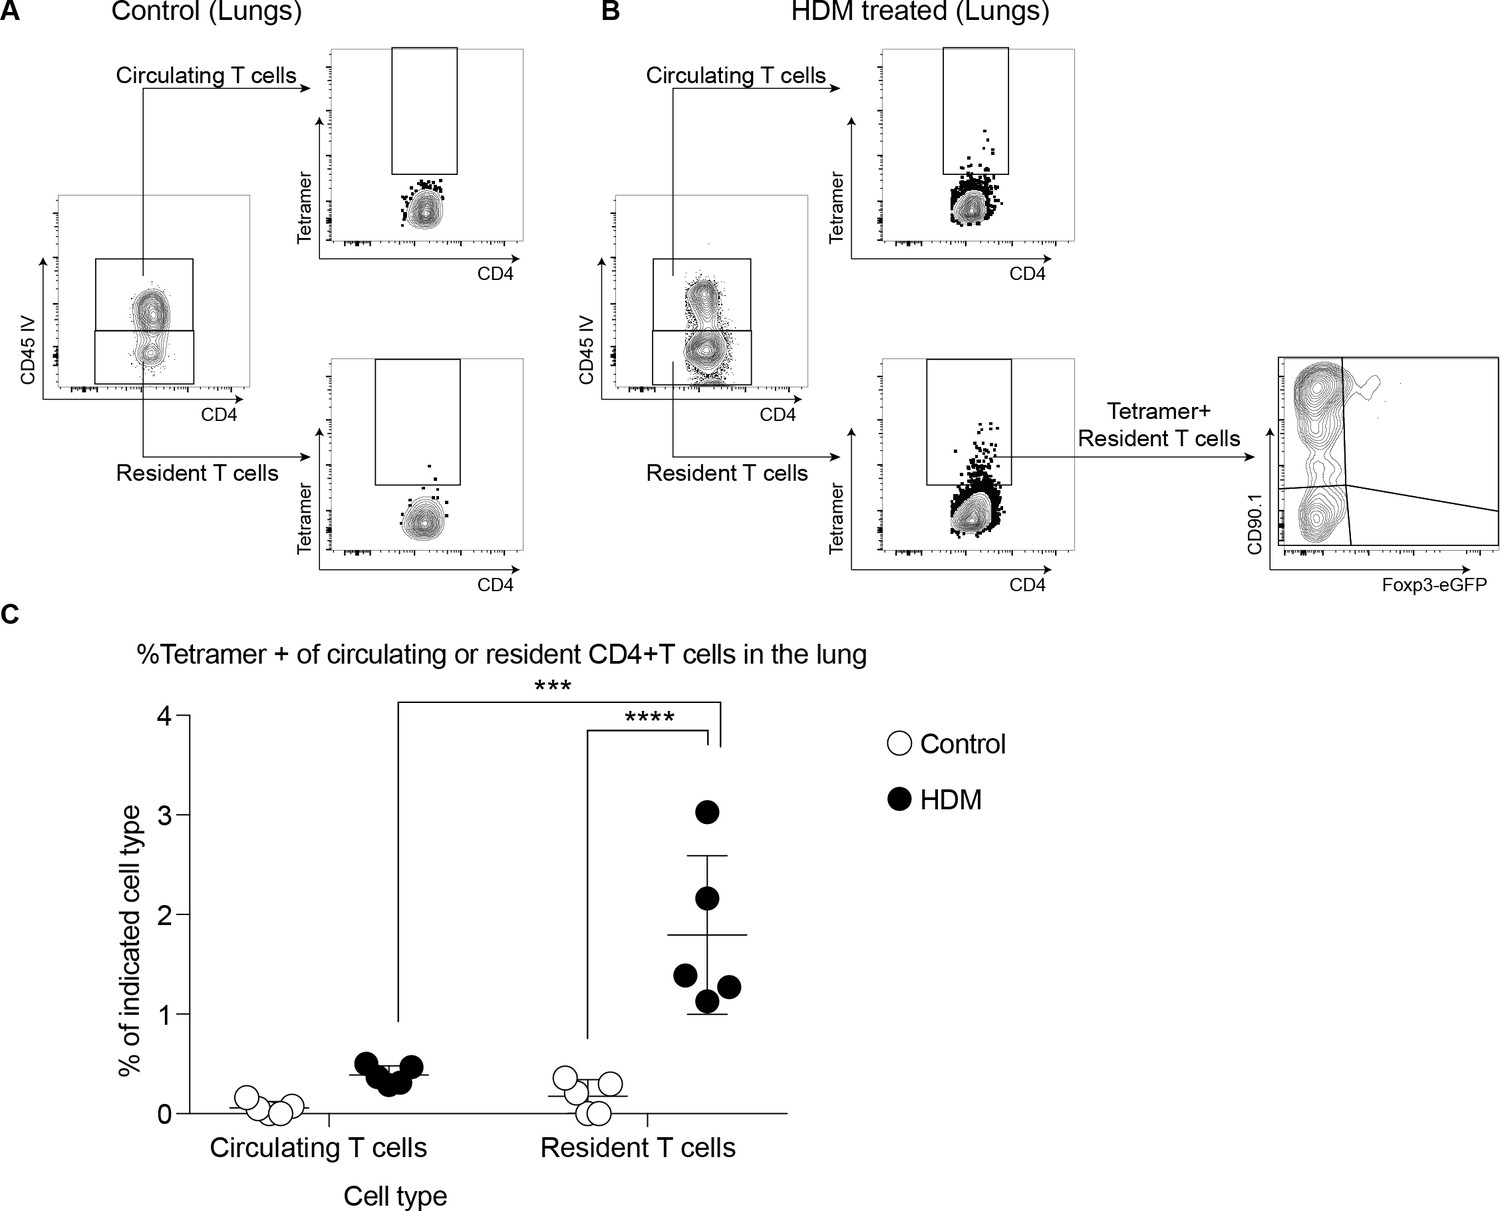
Gating scheme showing Tetramer positive cells in (A) control and (B) HDM-treated lungs after memory challenge.
(C) Frequency of tetramer+ cells within circulating and resident CD4+ T cells in the lungs of control or HDM- sensitized mice upon allergen rechallenge at day 64.
-
Figure 7—figure supplement 1—source data 1
Tetramer positive cells in control and HDM-treated lungs after memory challenge.
- https://doi.org/10.7554/eLife.44821.024
Figure 7—figure supplement 2

Phenotype of CD4 subsets during memory rechallenge, gated on CD90.1 and Foxp3 expression.
The percentage positive and mean fluorescence intensity of (A) IL-10, (B) IL-4, (C) Tbet, and (D) Gata3 in indicated CD4+ T cell subsets from the lungs of HDM-treated mice 24 hours after memory rechallenge. Data are representative of two independent experiments. Error bars represent standard error of mean. n=4. Statistical significance was determined using one-way ANOVA (post hoc test: Tukey). # represents significant difference from CD90.1-Foxp3- cells and † represents significant difference from CD90.1-Foxp3+ cells. #P0.05, ## P0.01, † P 0.05, †† P0.01.
-
Figure 7—figure supplement 2—source data 1
Phenotype of CD4 subsets during memory rechallenge, gated on CD90.1 and Foxp3 expression.
- https://doi.org/10.7554/eLife.44821.026
Figure 8 with 2 supplements
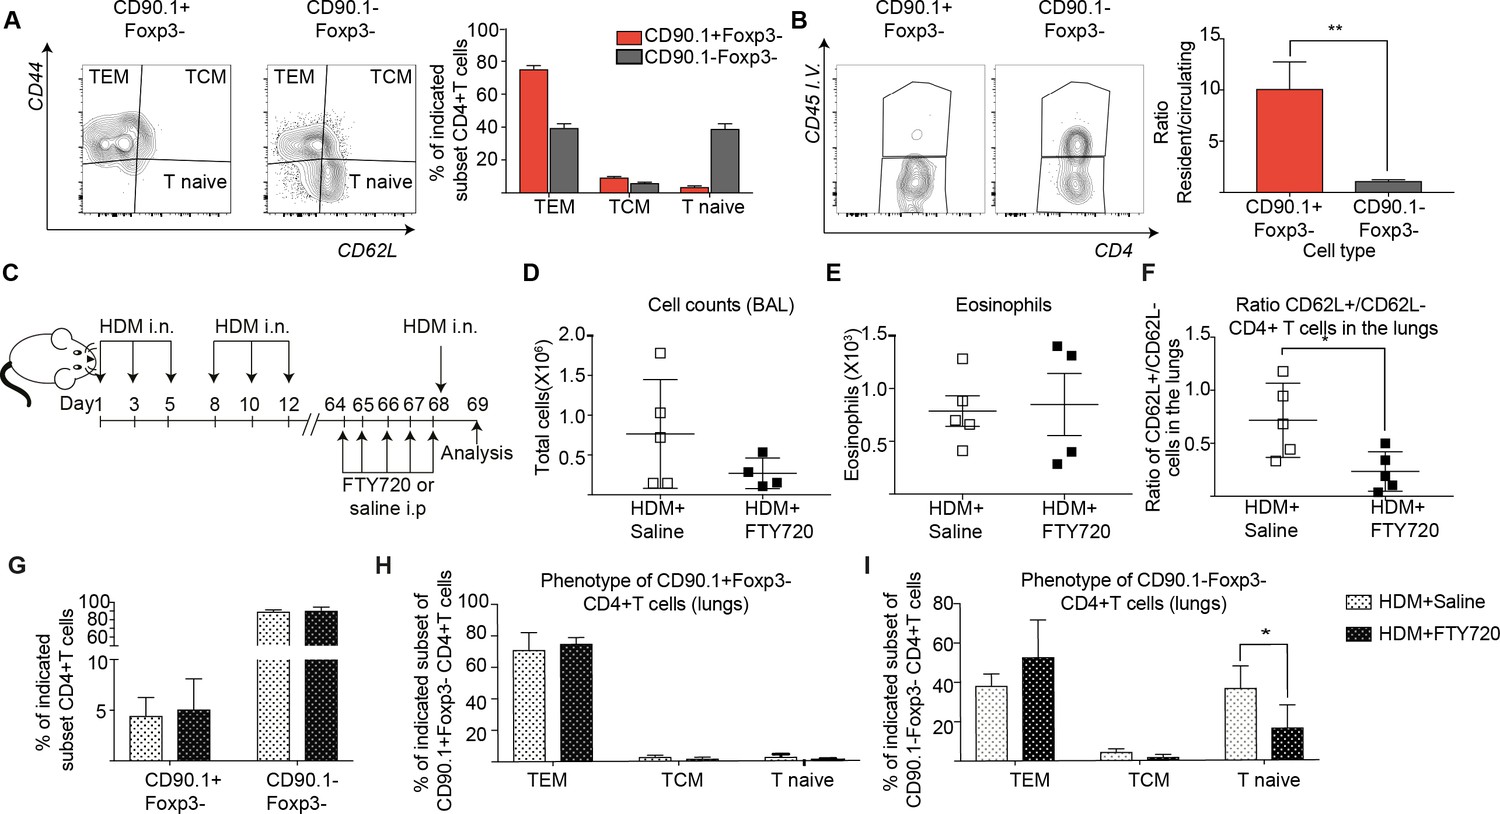
IL-10-producing T cells in the lung can originate from tissue resident memory cells.
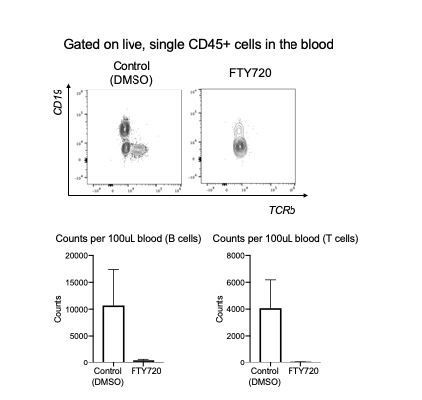
(A) Gating scheme showing different memory cell subsets of Tr1-like (CD90.1+Foxp3-) or (CD90.1-Foxp3-) CD4+ T cells in the lungs of mice treated with HDM using the same protocol outlined in Figure 6A. The frequency of each memory subset within CD90.1+Foxp3- CD4+ T cells or CD90.1-Foxp3- T cells in the lungs of HDM-treated mice is plotted on the left. Data are pooled from two experiments. Error bars represent standard error of mean. n=10 for control group, n=10 for HDM group. To identify lung resident T cells, intravascular (IV) labeling of cells was performed by retroorbital injection of CD45 antibody and mice were euthanized 2 minutes after injection. (B) Representative flow cytometry plot showing resident versus circulating T cells within CD90.1+Foxp3- and CD90.1-Foxp3- CD4+ T cells from lungs of HDM-treated mice is shown. The ratio of resident to circulating cells within CD90.1+Foxp3- and CD90.1-Foxp3- CD4+ T cells from lungs of HDM-treated mice is plotted. Data are pooled from two experiments. Error bars represent standard error of mean. n=9 for control group, n=9 for HDM group. Statistical significance was determined using an unpaired two tailed students t test. Data representative of three independent experiments (C) To block lymphocyte egress from lymph nodes, HDM-sensitized animals were treated with FTY720. (D) The total number of cells in the BAL was determined. Each symbol represents a single animal (E) The total number of eosinophils in the BAL is also plotted. Each symbol represents a single animal. (F) The ratio of CD62L+/CD62L- CD4+ T cells in the lungs is plotted. (G) The frequency of CD90.1+Foxp3- CD4+ (Tr1-like T cells) and CD90.1-Foxp3- CD4+ (conventional T cells) in the lungs of control or FTY720-treated mice is shown. (H) Frequency of different memory subsets within CD90.1+Foxp3- (Tr1-like cells) and (I) CD90.1-Foxp3- (T conventional) cells in the lungs of control or FTY720-treated animals is plotted. n=5 for each group. **P0.01 TEM=Effector memory TCM =T central memory.
-
Figure 8—source data 1
IL-10-producing T cells in the lung can originate from tissue resident memory cells.
- https://doi.org/10.7554/eLife.44821.033
Figure 8—figure supplement 1
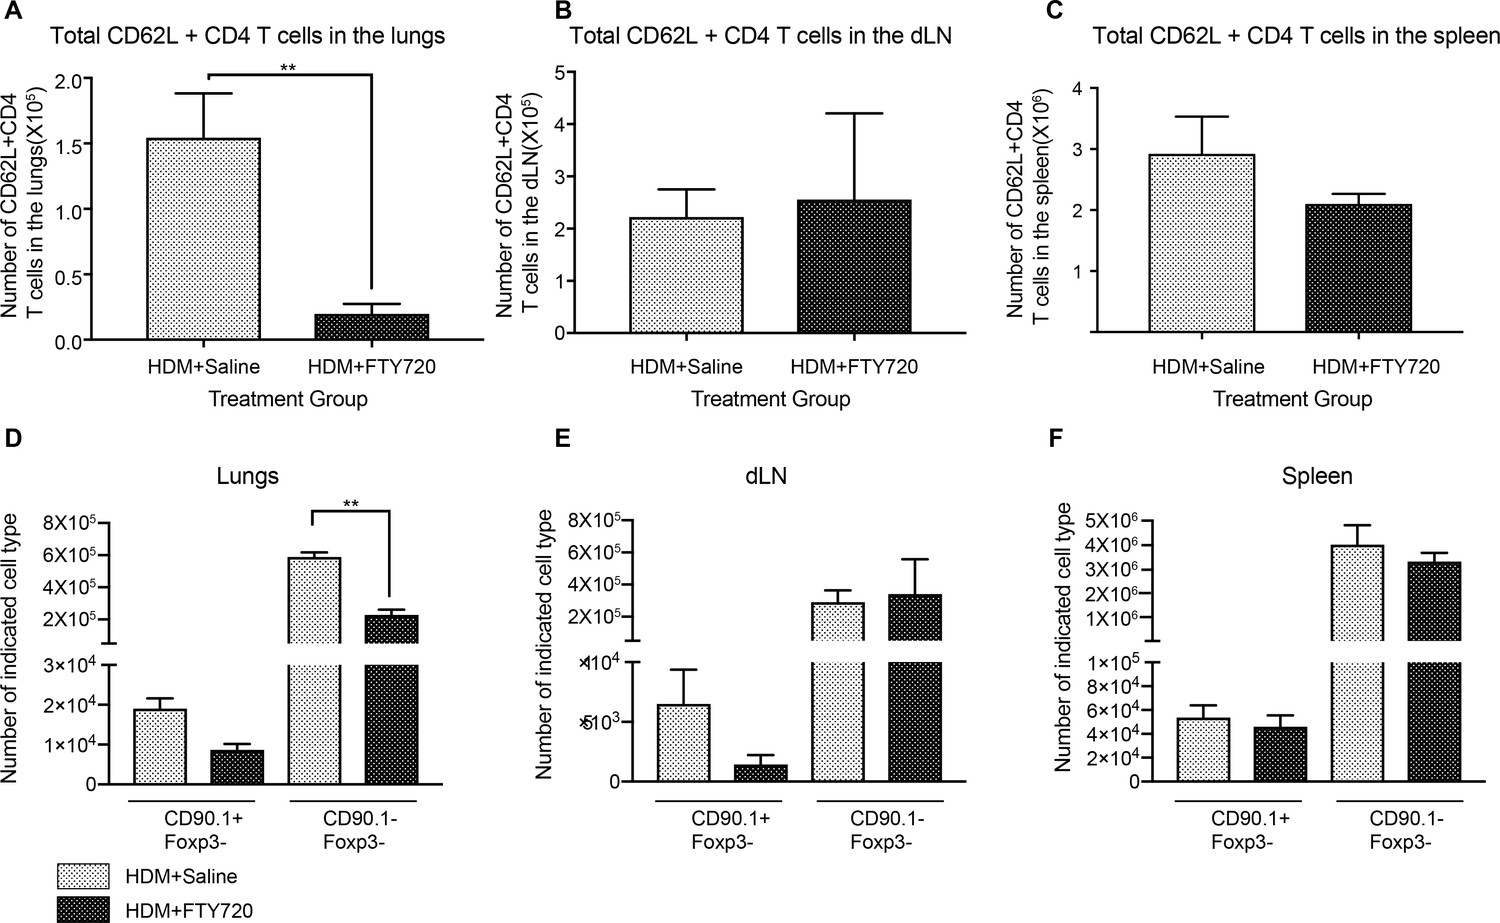
Efficiency of FTY270 treatment.
Total number of CD62L+ cells in (A) lungs (B) dLN and (C) spleen of control and FTY270-treated animals. Statistical significance determined by using unpaired t test. **P0.01, Total numbers of CD90.1+Foxp3- and CD90.1-Foxp3- cells in the (D) lungs (E) dLN and (F) spleen of control and FTY270-treated animals. Error bars represent standard error of mean. Statistical significance was determined using 2-way ANOVA (post hoc test: Sidaks). **P0.01.
-
Figure 8—figure supplement 1—source data 1
Efficiency of FTY270 treatment.
- https://doi.org/10.7554/eLife.44821.030
Figure 8—figure supplement 2
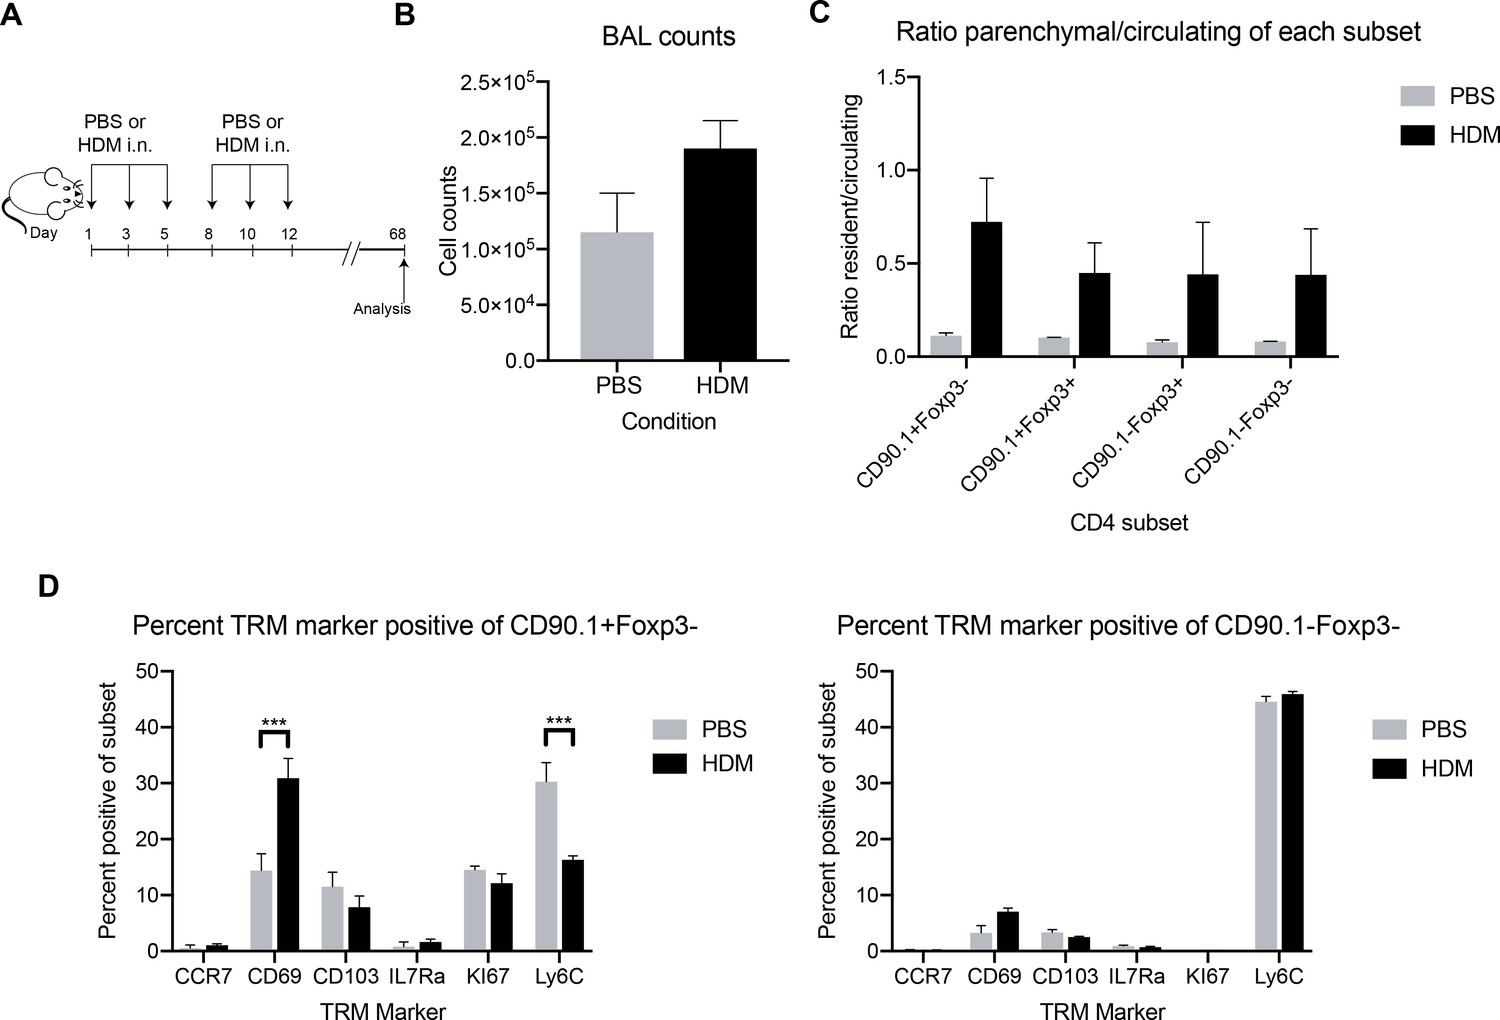
long-term persistence of CD90.1+ cells in allergen sensitized lungs.
(A) Mice were sensitized with either PBS as control or crude HDM extract intranasally (i.n.) Six times over 2 weeks. The mice were then left unchallenged and analyzed on day 68. (B) Total BAL counts were assessed. (C) The ratio of parenchymal to circulating cells in the lung within each CD90.1/Foxp3 subset were assessed. (D) CD90.1+Foxp3- and CD90.1-Foxp3- CD4 T cell subsets in the lung were assessed for common markers of tissue resident memory. n=3 for HDM group, n=2 for PBS group. Error bars represent standard error of mean. Statistical significance was determined using 2-way ANOVA (post hoc test: Sidaks). ***P0.001.
-
Figure 8—figure supplement 2—source data 1
long-term persistence of CD90.1+ cells in allergen sensitized lungs.
- https://doi.org/10.7554/eLife.44821.032
Figure 9 with 2 supplements
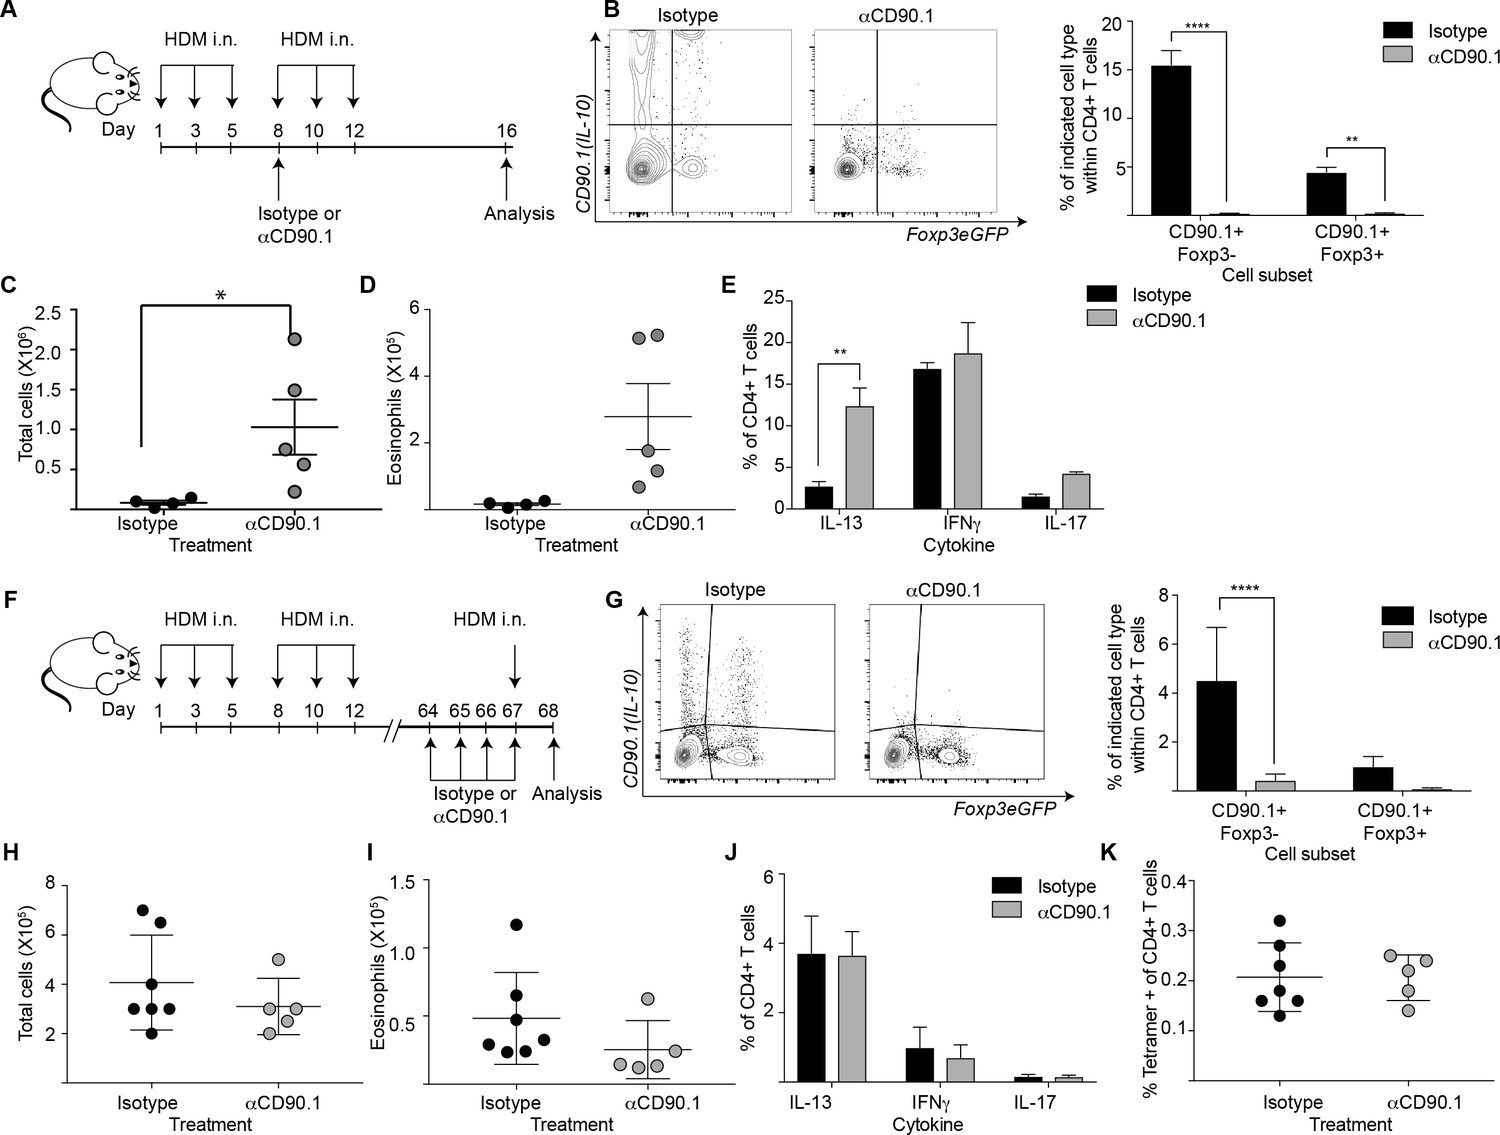
Depletion of CD90.1+Foxp3- IL-10 competent Tr1 cells does not influence long-term tolerance to airway allergens.
(A) Schematic illustrating the protocol used in experiments A-E. CD90.1+ cells were depleted in the sensitization phase using an anti CD90.1 antibody as depicted. Control animals were given matched isotype. (B) Representative flow cytometry plots showing the efficiency of depletion of CD90.1+ CD4 T cells in the lungs. Frequency of CD90.1+Foxp3- and CD90.1+Foxp3+ cells within CD4+ T cells in lungs of isotype or anti CD90.1 treated mice are plotted. Error bars represent standard deviation of the mean. n = 4 for isotype group, n = 5 for anti-CD90.1 group. Statistical significance was determined using 2-way ANOVA (post hoc test: Sidaks). (C) The total number of cells and (D) total number of eosinophils in the BAL was determined. Each symbol represents a single animal. Error bars represent standard deviation of mean. (E) Lung CD4 cells from isotype or anti-CD90.1 treated mice were restimulated with PMA, Ionomycin and Brefeldin A, surface stained, fixed and permeabilized for detection of intracellular cytokines. The frequency of cells producing IL-13, IL-17, and IFNγ within Foxp3- CD90.1- CD4+ T cells are shown. Error bars represent standard deviation of mean. n = 4 for isotype group, n = 5 for anti CD90.1 group. (F) Schematic illustrating the protocol used in experiments F-K. CD90.1+ cells were depleted using an anti CD90.1 antibody as depicted. Control animals were given matched isotype. (G) Representative flow cytometry plots showing the efficiency of depletion of CD90.1+ CD4 T cells in the lungs. Frequency of CD90.1+Foxp3- and CD90.1+Foxp3+ cells within CD4+ T cells in lungs of isotype or anti CD90.1 treated mice are plotted. Error bars represent standard deviation of the mean. n = 7 for isotype group, n = 5 for anti CD90.1 group. Statistical significance was determined using 2-way ANOVA (post hoc test: Sidaks). (H) The total number of cells and (I) total number of eosinophils in the BAL was determined. Each symbol represents a single animal. Error bars represent standard deviation of mean. (J) Lung CD4 cells from isotype or anti-CD90.1 treated mice were restimulated with PMA, Ionomycin and Brefeldin A, surface stained, fixed and permeabilized for detection of cytokines. The frequency of cells producing IL-13, IL-17, and IFNγ within Foxp3- CD90.1- CD4+ T cells are shown. Error bars represent standard deviation of mean. n = 7 for isotype group, n = 5 for anti CD90.1 group. (K) The frequency of Tetramer + cells within CD90.1-Foxp3- and CD90.1+Foxp3- cells in the lungs of HDM-treated animals is plotted. Error bars represent standard deviation of the mean. n = 7 for isotype group, n = 5 for anti CD90.1 group. Data representative of at least two independent experiments.
-
Figure 9—source data 1
Depletion of CD90.1+Foxp3- IL-10 competent Tr1 cells does not influence long-term tolerance to airway allergens.
- https://doi.org/10.7554/eLife.44821.039
Figure 9—figure supplement 1
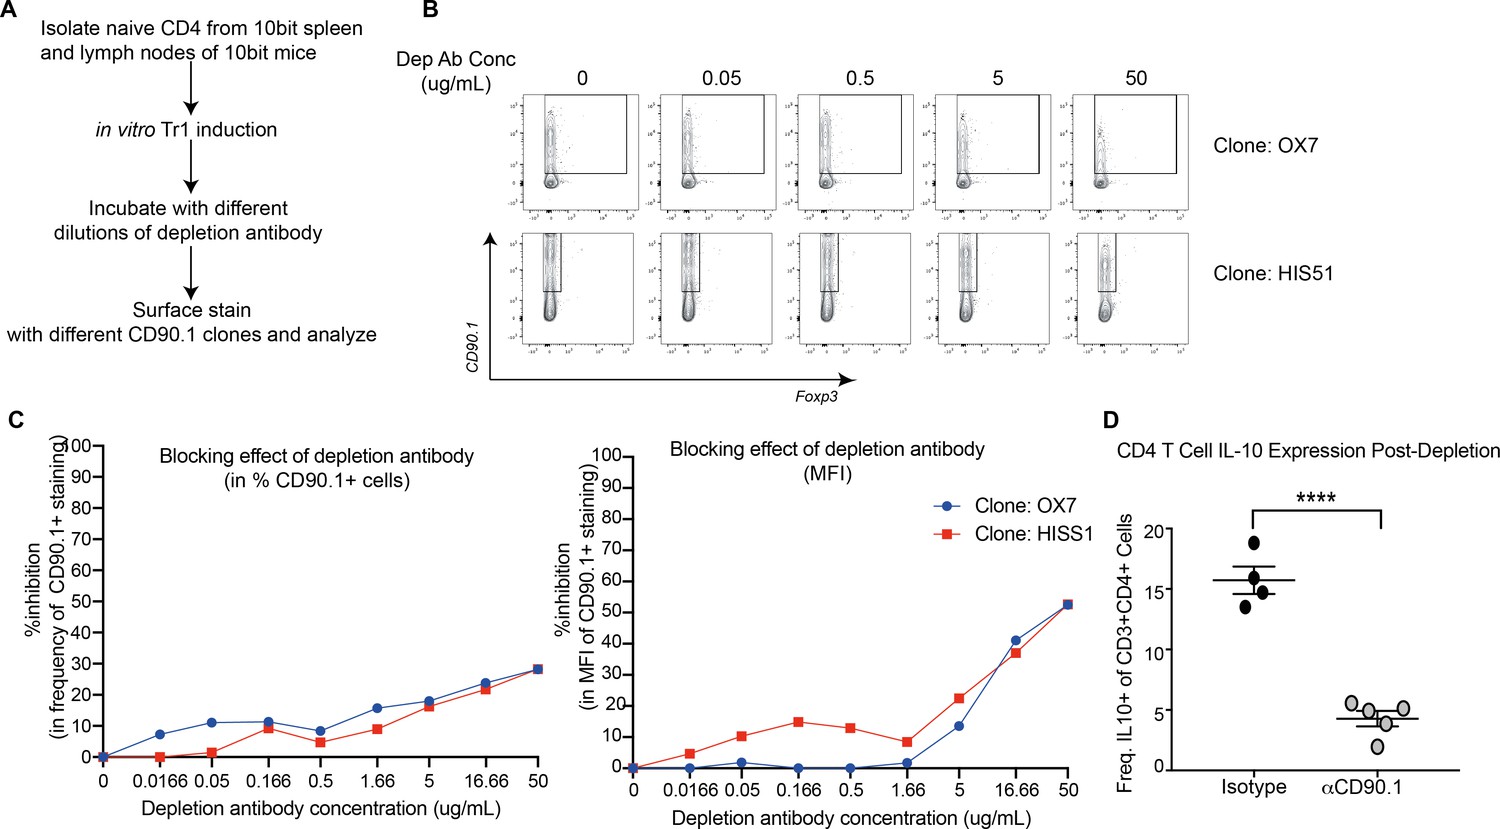
Specificity and efficiency of using aCD90.1 for the depletion of IL-10 competent cells.
(A) Scheme showing experimental set up for testing masking effect of depletion antibody with two separate anti-CD90.1 clones used for staining. (B) Representative flow plots showing expression of CD90.1 detected using clone OX7 and HIS51 after using depletion antibody. (C) Percent inihibition in the detection of frequency and MFI of CD90.1+ after incubating cells with depletion antibody. (D) In vivo reduction in IL-10 production by CD4+T cells in mice that were treated with depletion antibody during the sensitization phase. IL-10 production was determined by ex vivo stimulation with PMA, ionomycin, and Brefeldin A followed by intracellular cytokine staining.
-
Figure 9—figure supplement 1—source data 1
Specificity and efficiency of using aCD90.1 for the depletion of IL-10 competent cells.
- https://doi.org/10.7554/eLife.44821.036
Figure 9—figure supplement 2
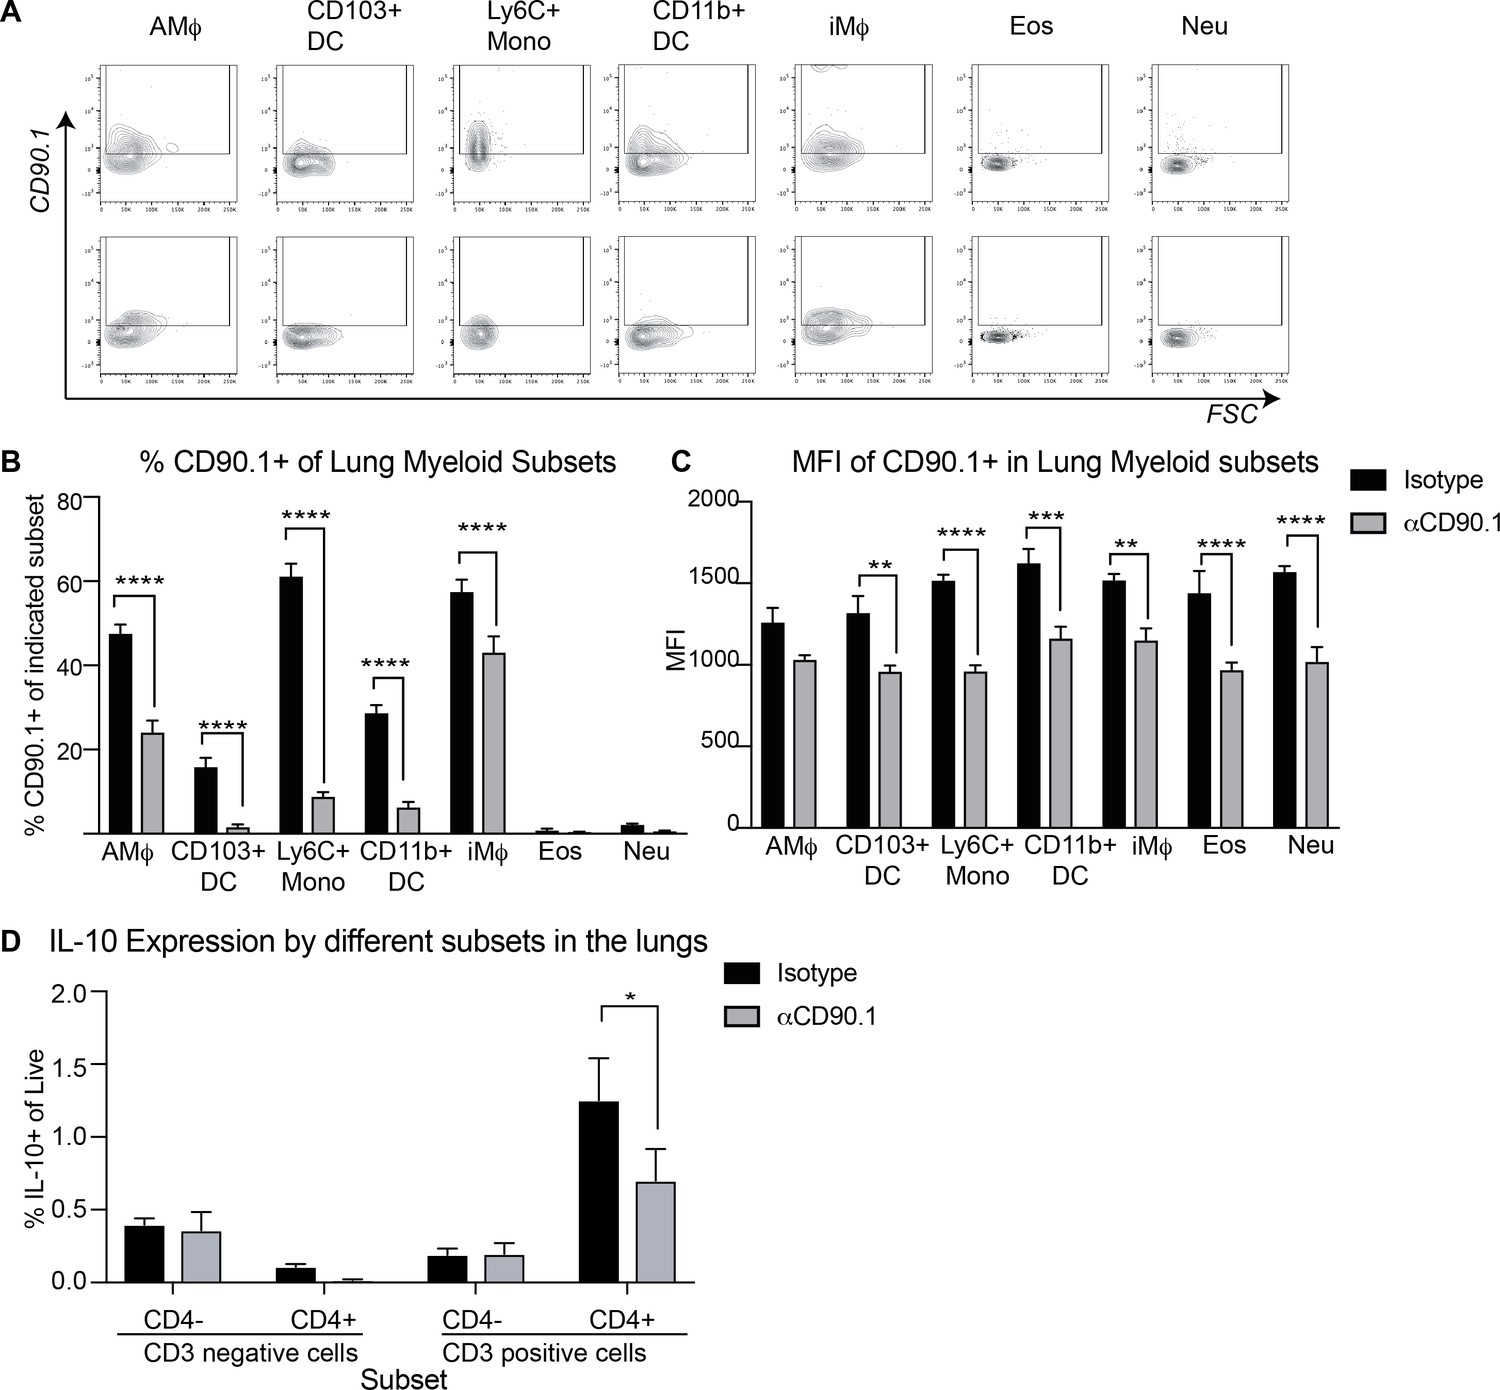
Characterization of CD3 negative CD90.1+ cell subsets.
(A) Representative flow plots showing CD90.1 expression by indicated cell subsets. (B) Frequency and (C) MFI of CD90.1 in indicated cell subsets in the lungs of mice treated with isotype control or depleting anti-CD90.1 antibody during sensitization phase with HDM. (D) IL-10 expression by different subsets in the lungs of isotype versus anti-CD90.1 treated animals. Statistical significance was determined using 2-way ANOVA (post hoc test: Sidaks). **P0.01, ***P0.001, ****P0.0001.
-
Figure 9—figure supplement 2—source data 1
Characterization of CD3 negative CD90.1+ cell subsets.
- https://doi.org/10.7554/eLife.44821.038
Figure 10 with 2 supplements
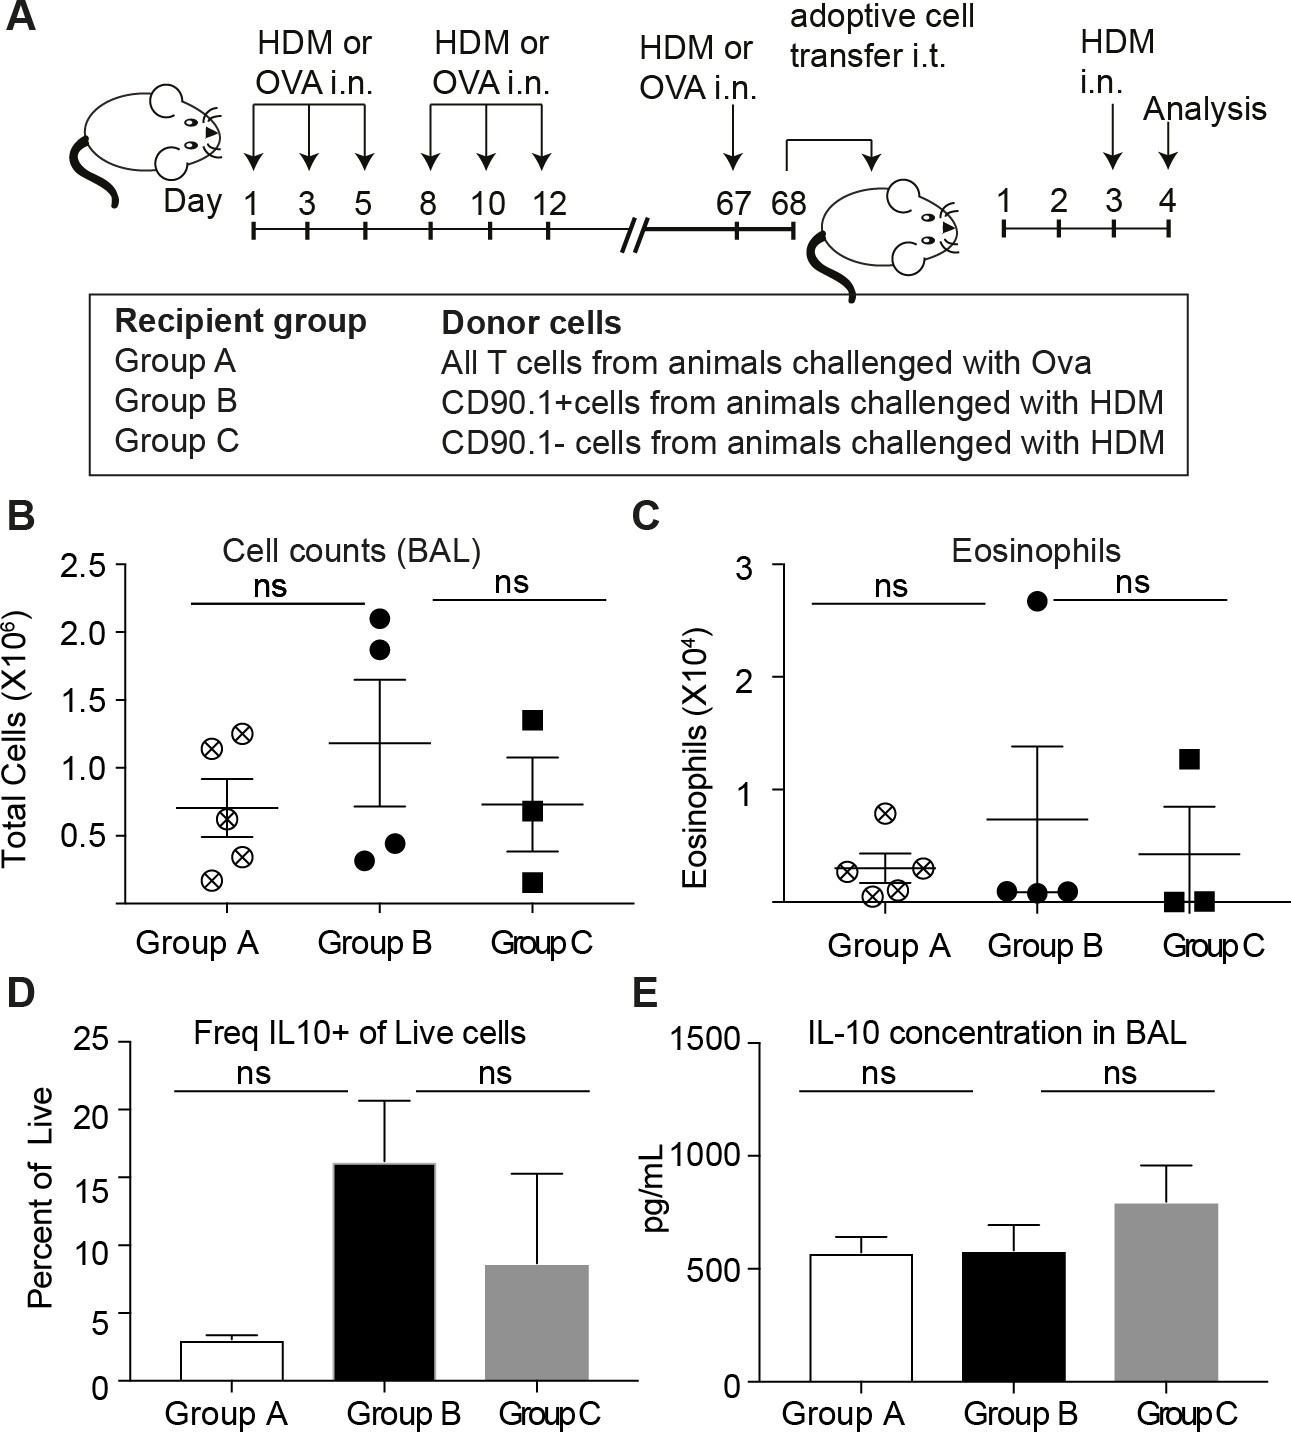
Transferred CD90.1+Foxp3- IL-10 competent Tr1 cells are not more likely than other T-cells to make IL-10 upon memory challenge to allergen.
(A) All T cells or Tr1-like like cells or Effector T cells were isolated from lungs of HDM-sensitized animals after challenge and transferred into recipient groups as described. (B) Total cellular infiltration in the BAL and (C) eosinophilia in the BAL in recipients after HDM challenge is plotted. (D) Frequency of IL-10 expressing cells in lungs of recipient mice after 4 hr restimulation ex vivo with PMA/ionomycin/Brefeldin. (E) IL-10 ELISA from BAL fluid of recipient lungs. Error bars represent standard deviation of mean. n = 5 for group A, n = 4 For group B and n = 3 for group C.
-
Figure 10—source data 1
Transferred CD90.1+Foxp3- IL-10 competent Tr1 cells are not more likely than other T-cells to make IL-10 upon memory challenge to allergen.
- https://doi.org/10.7554/eLife.44821.045
Figure 10—figure supplement 1
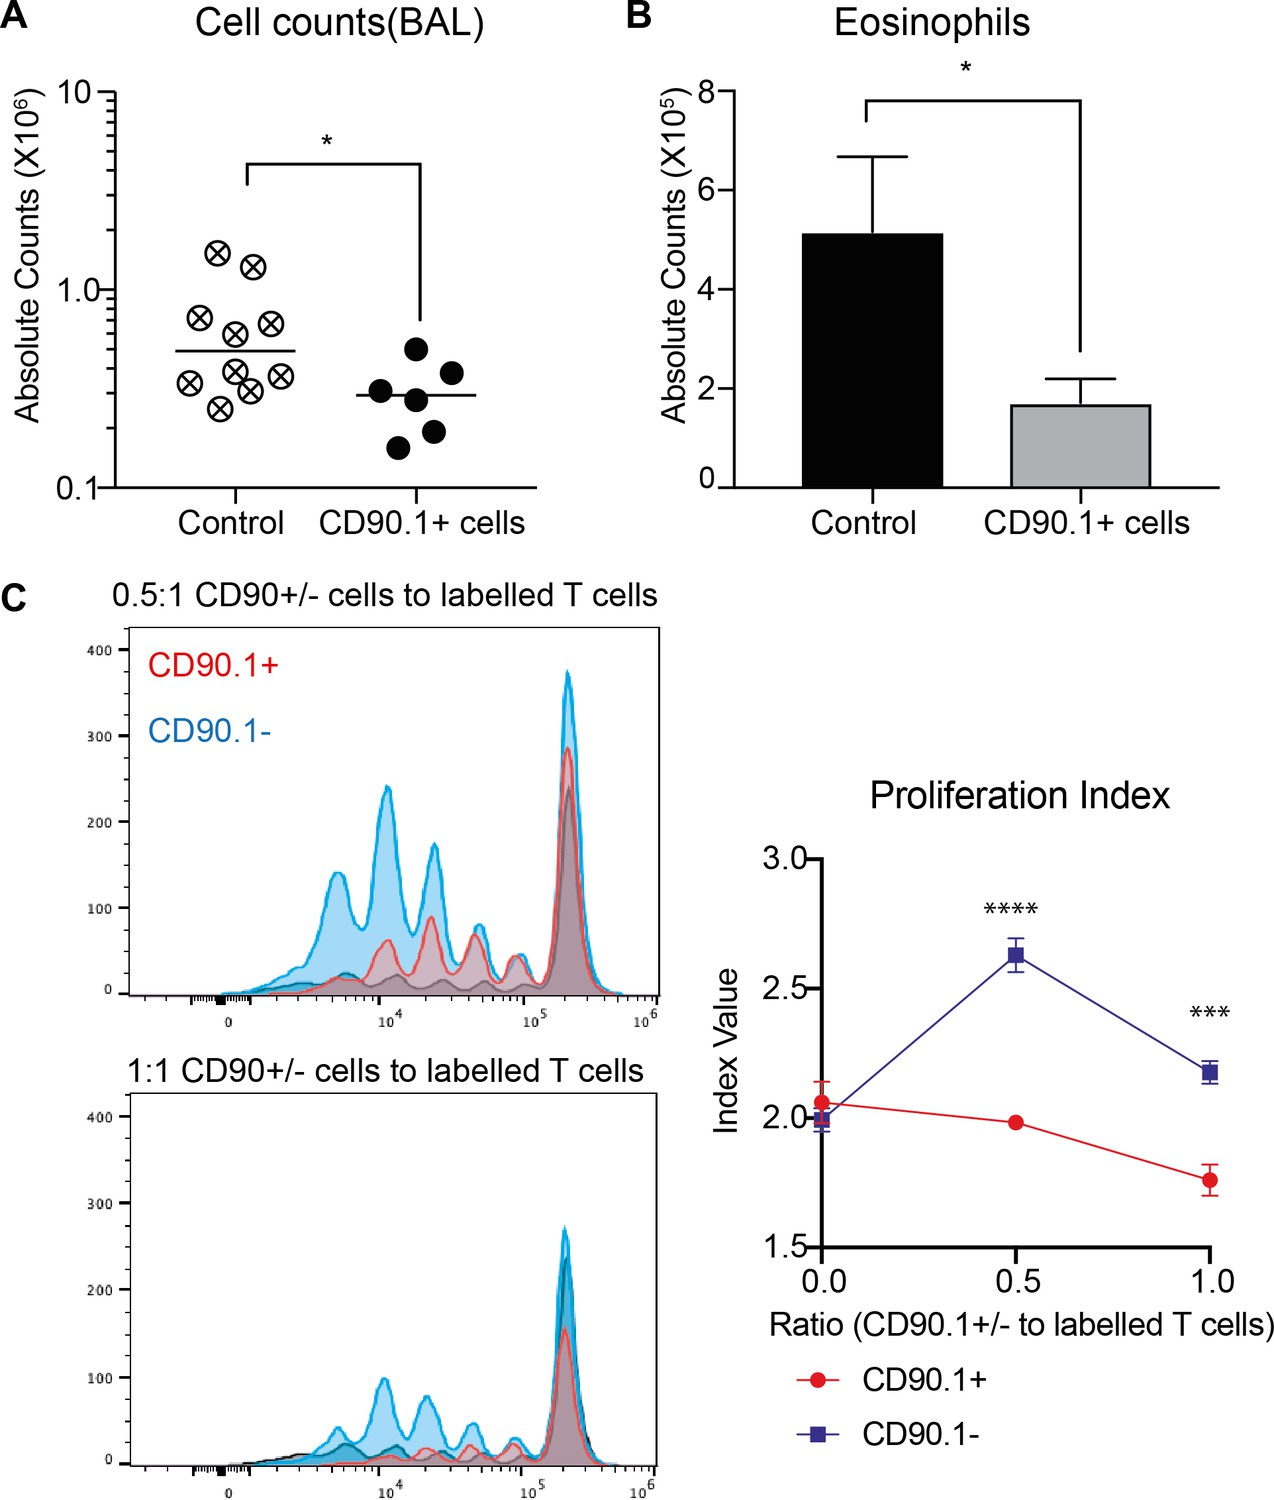
CD90.1 + CD4 T cells are functionally suppressive in vivo and in vitro.
1E6 in vitro differentiated CD90.1+Foxp3- CD4 T cells from 10BiT mice were adoptively transferred intratracheally into congenically marked C57BL/6 recipients on day 7 of the standard sensitization protocol. (A) Total cell and (B) total eosinophil counts in the BAL was accessed in recipient mice on day 16, 4 days post final challenge. Statistical significance was determined using a one-tailed students t-test. *P0.05. (C) Naïve splenic 10BiT CD4 T cells were cultured in vitro under Tr1-differentiating conditions, sorted based on CD90.1 expression and plated at varying ratios with CFSE-labeled naïve responder CD4 T cells, CD11c+ DCs, and soluble anti-CD3 for 3 days. Representative flow plots as well as proliferation index are shown.Statistical significance was determined using 2-way ANOVA (post hoc test: Sidaks) ***P0.001, ****P0.0001.
-
Figure 10—figure supplement 1—source data 1
CD90.1 + CD4 T cells are functionally suppressive in vivo and in vitro.
- https://doi.org/10.7554/eLife.44821.042
Figure 10—figure supplement 2
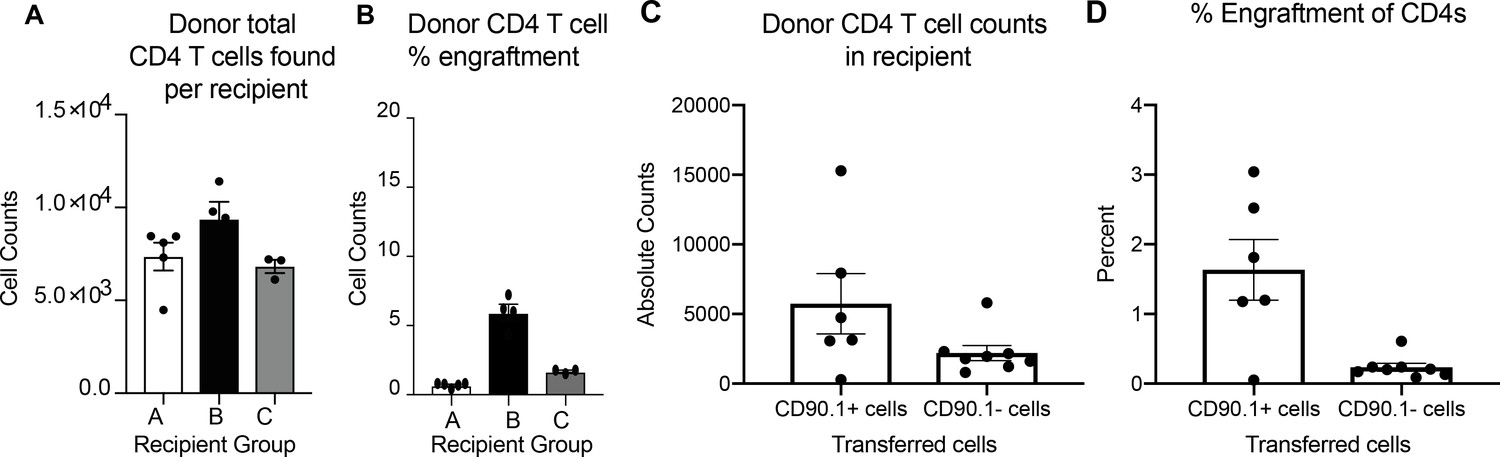
Engraftment efficiencies in adoptive transfer studies.
(A) Total number donor cells recovered and (B) percent donor engraftment in lungs of recipient mice when memory cells were transferred. Error bars represent standard error of mean. n = 5 for group A, n = 4 For group B and n = 3 for group C. (C) Total number donor cells recovered and (D) percent donor engraftment in lungs of recipient mice when in vitro differentiated Tr1 cells were transferred. Error bars represent standard error of mean. n = 6 for CD90.1+ cells and n = 8 for CD90.1- cells.
-
Figure 10—figure supplement 2—source data 1
Engraftment efficiencies in adoptive transfer studies.
- https://doi.org/10.7554/eLife.44821.044
Author response image 1
Author response image 2

Tables
Key resources table
| Reagent type | Designation | Source of reference | Identifiers | Additional Information |
|---|---|---|---|---|
| Genetic Reagent (M. musculus) | 10BiT mice (Tg(Il10-Thy1)1Weav) | PMID: 17694059 | RRID: MGI:3767675 | |
| Genetic Reagent (M. musculus) | Foxp3eGFP (Foxp3tm2Tch) | PMID: 15780990 | RRID: MGI:3699400 | |
| Genetic Reagent (M. musculus) | B6.129(Cg)-Cd44tm1Hbg/J | PMID: 10528194 | RRID: MGI:4942279 | |
| Biological sample | Crushed House dust mite (Der p 1: 1911.78 mcg/vial, Endotoxin: 15900 UE/vial)obtained from D. pteronyssinus | Greer Laboratories Inc, Lenoir, NC | Cat: XPB70D3A25 Lot: 322781 | 20 ug house dust mite given intranasally |
| Biological sample | Crushed House dust mite (Der p 1: 2009.03 mcg/vial, Endotoxin: 9150 EU/vial) obtained from from D. pteronyssinus | Greer Laboratories Inc, Lenoir, NC | Cat: XPB70D3A25 Lot: 279019 | 20 ug house dust mite given intranasally |
| Antibody | Rat monoclonal CD4 (clone RM4-4), | Biolegend | Cat: 100552 | 1:100 for flow cytometry |
| Antibody | Rat monoclonal CD3 (clone 17A2), | Biolegend | Cat: 100220 | 1:100 for flow cytometry |
| Antibody | Mouse monoclonal CD90.1 (Thy1.1)(clone OX-7) | Biolegend | Cat: 202516 | 1:150 for flow cytometry |
| Antibody | Rat monoclonal CD44 (clone IM7) | Biolegend | Cat: 103020 | 1:100 for flow cytometry |
| Antibody | Rat monoclonal Lag3 (clone C9B7W) | BD Biosciences | Cat: 562346 | 1:50 for flow cytometry |
| Antibody | Rat monoclonal CD49b (clone DX5) | eBiosciences | Cat: 12-5971-82 | 1:50 for flow cytometry |
| Antibody | Rat monoclonal CD25 (clone PC61) | Biolegend | Cat: 102026 | 1:100 for flow cytometry |
| Antibody | Syrian Hamster monoclonal KLRG1 (clone 2F1) | Biolegend | Cat: 138411 | 1:50 for flow cytometry |
| Antibody | Rat monoclonal PD1 (clone RMP1-30) | Biolegend | Cat: 109110 | 1:50 for flow cytometry |
| Antibody | Rat monoclonal IL-10 (clone JES5-16E3), | Biolegend | Cat: 505009 | 1:20 for flow cytometry |
| Antibody | Rat monoclonal IFNg (clone XMG1.2), | Biolegend | Cat: 505839 | 1:20 for flow cytometry |
| Antibody | Rat monoclonal IL-17 (clone TC11-18H10.1), | Biolegend | Cat: 506917 | 1:20 for flow cytometry |
| Antibody | Rat monoclonal IL-13 (clone eBio13A), | eBiosciences | Cat: 12-7133-41 | 1:20 for flow cytometry |
| Antibody | Rat monoclonal IL-4 (clone 11B11) | Biolegend | Cat: 504125 | 1:20 for flow cytometry |
| Antibody | Mouse monoclonal T-bet (clone 4B10) | Biolegend | Cat: 644813 | 1:20 for flow cytometry |
| Antibody | Rat monoclonal Gata-3 (clone TWAJ) | eBiosciences | Cat: 12-9966-42 | 1:20 for flow cytometry |
| Antibody | Mouse monoclonal CD90.1 (Thy1.1) (clone OX-7) | Biolegend | Cat: 202529 | 1:150 for flow cytometry |
| Antibody | Rat monoclonal CD11b (clone M1/70) | BD Biosciences | Cat: 562128 | 1:100 for flow cytometry |
| Antibody | Rat monoclonal MHC Class II (I-A/I-E) (clone M5/114.15.2) | eBiosciences | Cat: 86-5321-41 | 1:100 for flow cytometry |
| Antibody | Rat monoclonal Ly-6C (clone HK1.4) | Biolegend | Cat: 128041 | 1:200 for flow cytometry |
| Antibody | Mouse monoclonal CD64 (clone X54-5/7.1) | Biolegend | Cat: 139307 | 1:100 for flow cytometry |
| Antibody | Rat monoclonal Siglec F (clone S17007L) | Biolegend | Cat: 155505 | 1:200 for flow cytometry |
| Antibody | Rat monoclonal Ly-6G (clone 1A8) | Biolegend | Cat: 127617 | 1:200 for flow cytometry |
| Antibody | Armenian Hamster monoclonal CD11c (clone N418) | Biolegend | Cat: 117310 | 1:100 for flow cytometry |
| Antibody | Rat monoclonal CD24 (clone M1/69) | Biolegend | Cat: 101839 | 1:100 for flow cytometry |
| Antibody | Rat monoclonal CCR7 (clone 4B12) | eBiosciences | Cat: 48-1971-82 | 1:100 for flow cytometry |
| Antibody | Rat monoclonal CD62L (clone MEL-14) | Biolegend | Cat: 104438 | 1:100 for flow cytometry |
| Antibody | Rat monoclonal CD44 (clone IM7) | Biolegend | Cat: 103032 | 1:100 for flow cytometry |
| Antibody | Rat monoclonal IL-7Ra (clone SB/199) | Biolegend | Cat: 121111 | 1:100 for flow cytometry |
| Antibody | Mouse monoclonal Thy1.1/CD90.1 (clone HIS51) | eBiosciences | Cat: 15-0900-82 | 1:150 for flow cytometry |
| Antibody | Armenian hamster monoclonal CD69 (clone H1.2F3) | Biolegend | Cat: 104511 | 1:100 for flow cytometry |
| Antibody | Mouse monoclonal KI-67 (clone B56) | BD Biosciences | Cat: 558615 | 1:100 for flow cytometry |
| Antibody | Armenian hamster monoclonal CD103 (clone 2E7) | Biolegend | Cat: 121431 | 1:100 for flow cytometry |
| Other | Derp1:I-Ab tetramer conjugated to PE | Gift from James moon | 20 nM for flow | |
| Antibody | Rat monoclonal CD45 AF700 clone 30-F11 (Biolegend, San Diego, CA) | Biolegend | Cat: 103128 | 3 ug/mouse |
| Antibody | InVivoMAb mouse monoclonal anti-mouse Thy1.1/CD90.1 (clone 19E12) | BioXcell | Cat: BE0214 | 200 ug/mouse |
| Chemical compound (drug) | Fingolimod (FTY720) | Sigma-Aldrich | Cat: SML0700-5MG | used at at 5 mg/kg, estimating 25 g per mouse |
Additional files
-
Transparent reporting form
- https://doi.org/10.7554/eLife.44821.046
Download links
A two-part list of links to download the article, or parts of the article, in various formats.
Downloads (link to download the article as PDF)
Open citations (links to open the citations from this article in various online reference manager services)
Cite this article (links to download the citations from this article in formats compatible with various reference manager tools)
Natural Tr1-like cells do not confer long-term tolerogenic memory
eLife 8:e44821.
https://doi.org/10.7554/eLife.44821


