Neuronal integration in the adult mouse olfactory bulb is a non-selective addition process
- Aix-Marseille University, CNRS, IBDM, UMR 7288, France
- Harvard University, United States
- Université Grenoble Alpes, France
Figures
Figure 1 with 3 supplements
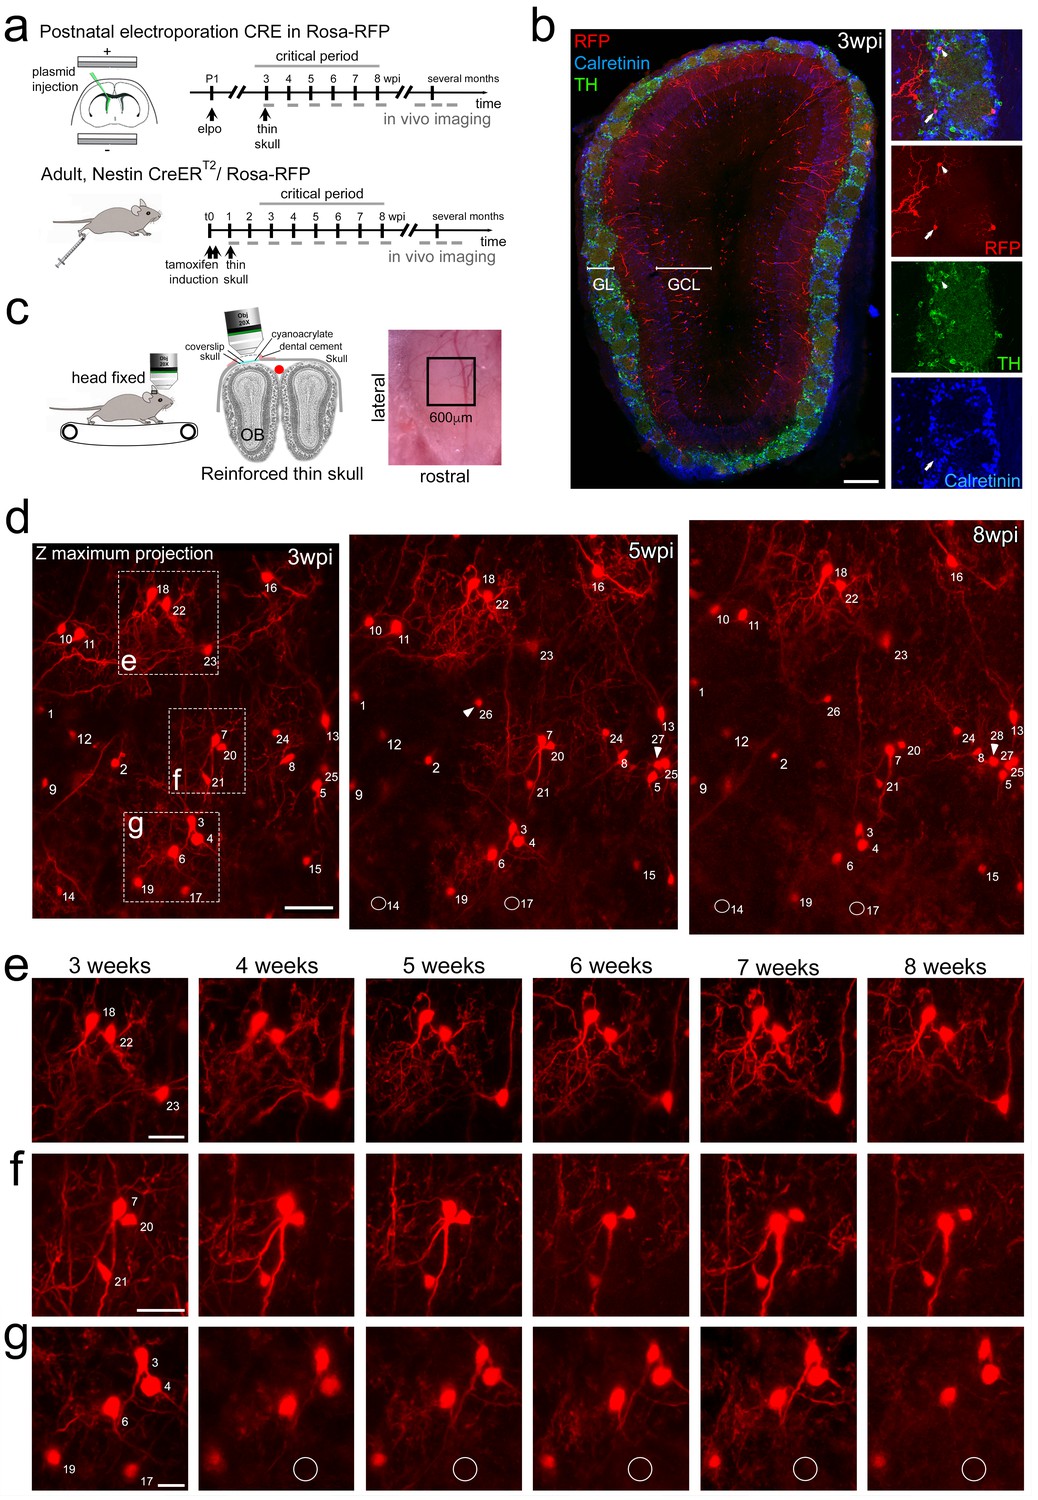
Long-term in vivo imaging in the OB.
(a) Induction protocols and imaging timeline. In perinatal animals, a CRE-expression plasmid was introduced in the dorsal neural stem cell compartment of Rosa-RFP mice using postnatal electroporation. To label neurons in adults, Nestin-CreERT2 animals were bred to Rosa-RFP mice and induced with tamoxifen at 2 months of age. Thin skull preparation was routinely performed one-week post induction. A weekly imaging scheme was implemented over the critical period and up to 5 months. (b) Postnatal in vivo brain electroporation at P1-P4 leads at three wpi to the appearance of various interneuron types, including TH and CR expressing subtypes, in the superficial GCL and the GL layers of the OB. (c) In vivo microscopy setup. Mice were imaged with the head fixed to the two-photon microscope. Animals could move on a treadmill but rarely did so during imaging sessions. Thin skull preparation allowed high-resolution imaging on a weekly basis. (d) Example of an image Z-stack showing 25 individually identified neurons from 3, 5, and 8 weeks after CRE electroporation. Note that neurons 14 and 17 are lost (circles) while several neurons are added (arrowheads). (e, f, g) High-resolution images of weekly observations of three groups of neurons highlighted in d. Cell substructures, dendrites and minor cell displacements can be followed over time. Scale bar: 200 μm in b, 50 μm in d, 30 μm in e, f, g.
Figure 1—figure supplement 1
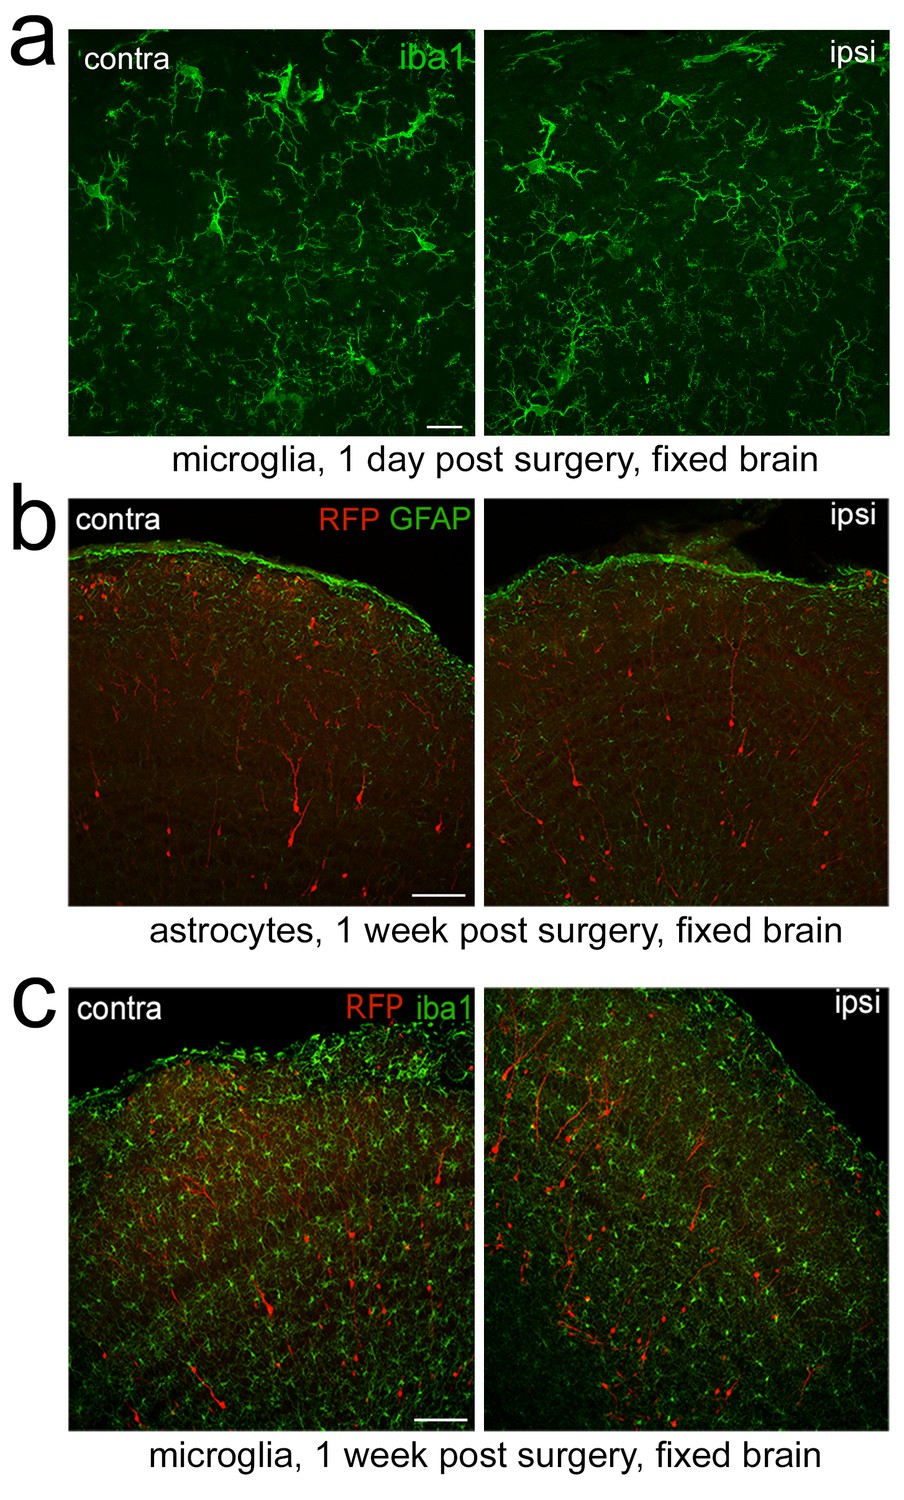
Absence of inflammation after thin skull surgery.
(a) Immunostaining for the microglial marker iba1 demonstrates the absence of a detectable microglia reaction at 1 day post-surgery. (b) Comparison of GFAP staining in the OB. Control and window carrying OB are indistinguishable at 1 week post-surgery. (c) Immunostaining for the microglial marker iba1 demonstrates the absence of a detectable microglia reaction at 1 week post-surgery. Scale bar: 10 μm in a, 50 μm in b,c.
Figure 1—figure supplement 2
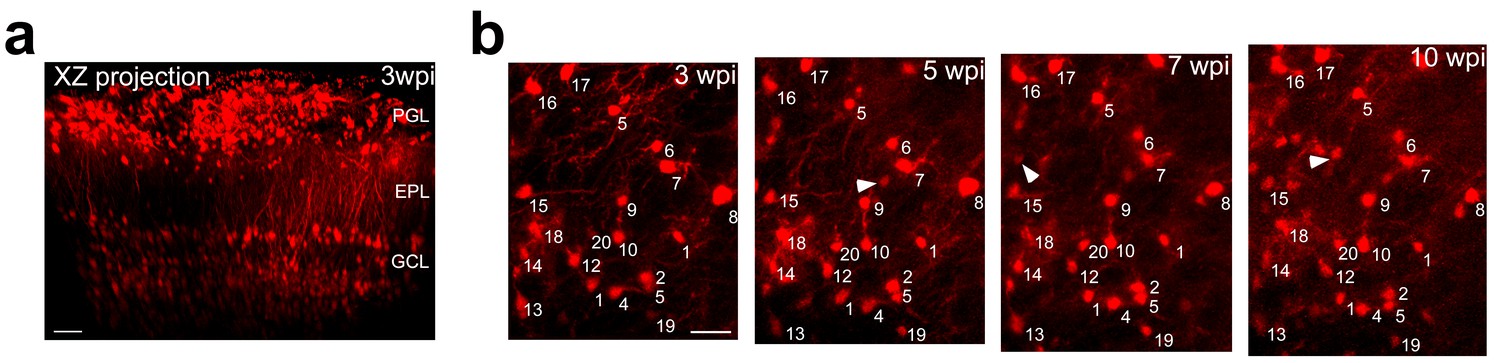
Long term imaging of postnatally born granule neurons.
(a) XZ projection of the OB showing that the PGL, EPL and the superficial GCL can be reached through a thin skull preparation. (b) Example of Z-projection identifying individual granule neurons between 3 and 10 weeks post induction in perinatal mice. The first cohort is numbered. Additional neurons of later cohorts appeared in the observation window over successive imaging sessions (arrowheads). Scale bar: 50 μm in a, 30 μm b.
Figure 1—figure supplement 3
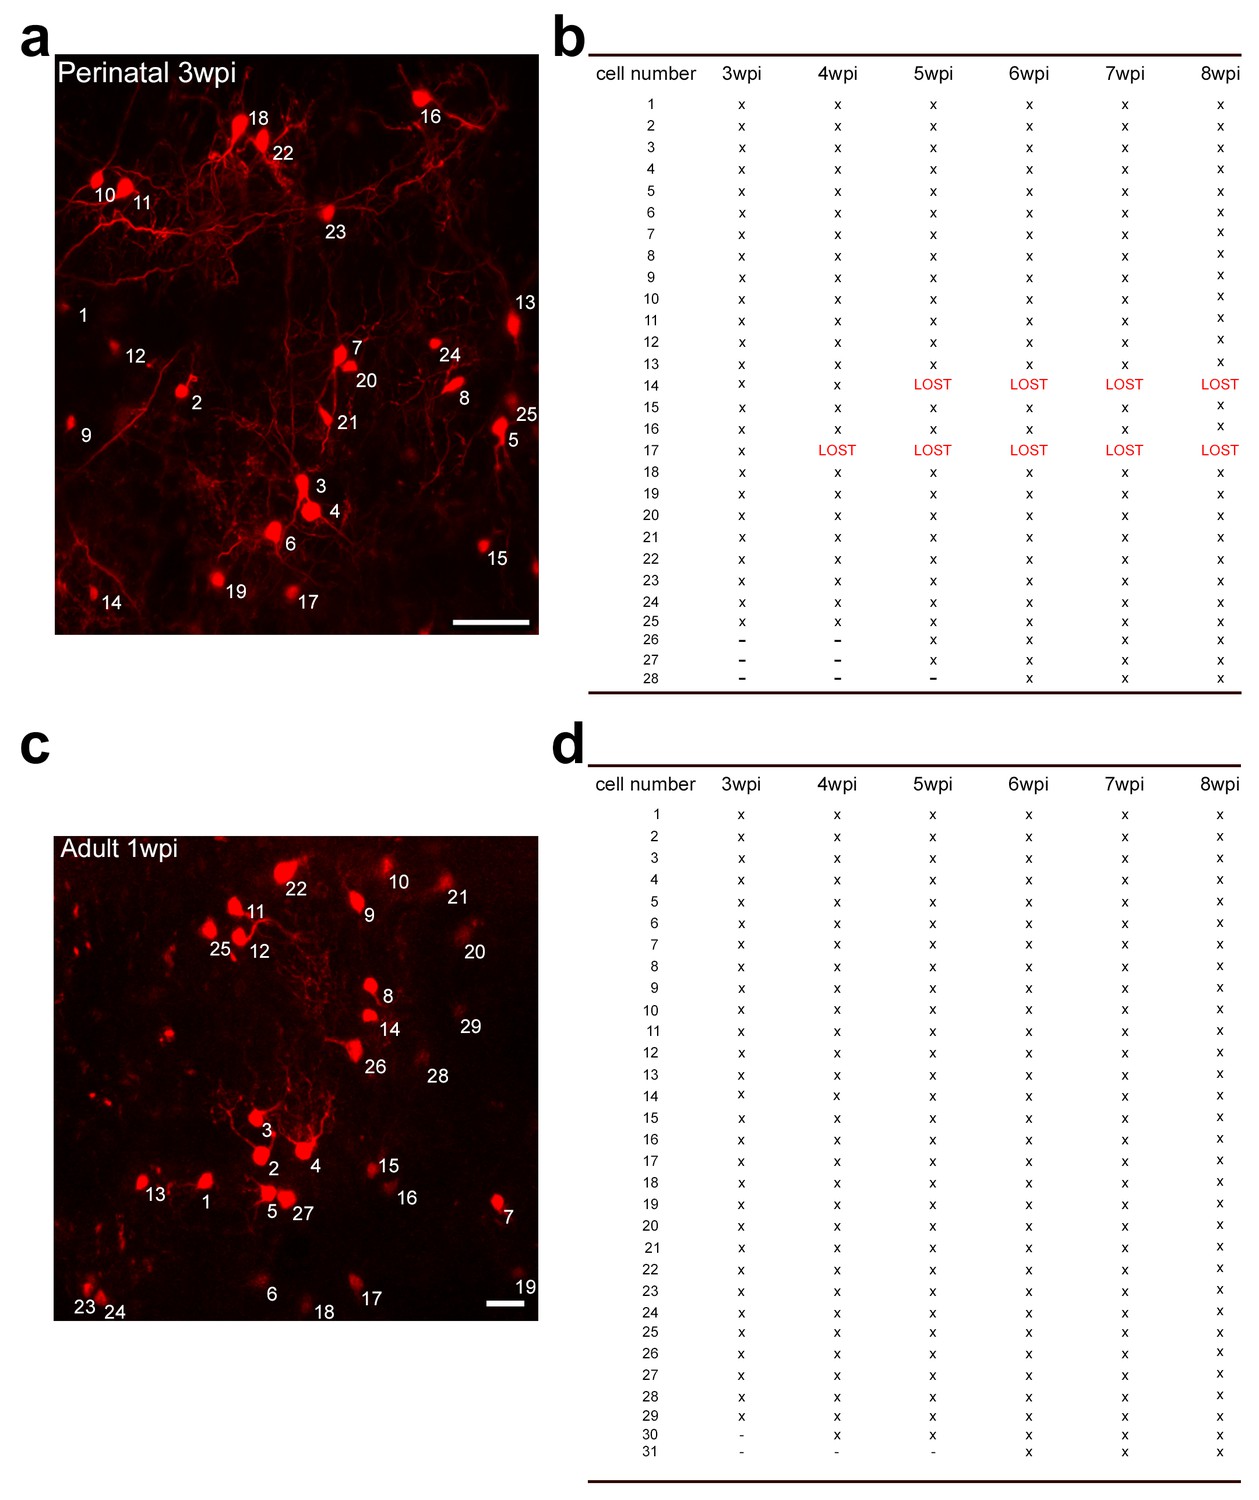
Image and table exemplifying how perinatally (a,b) and adult (c,d) generated neurons were scored over the critical period (for a,b compare also Figure 1d).
Scale bar: 50 μm in a, 20 μm b.
Figure 2 with 1 supplement
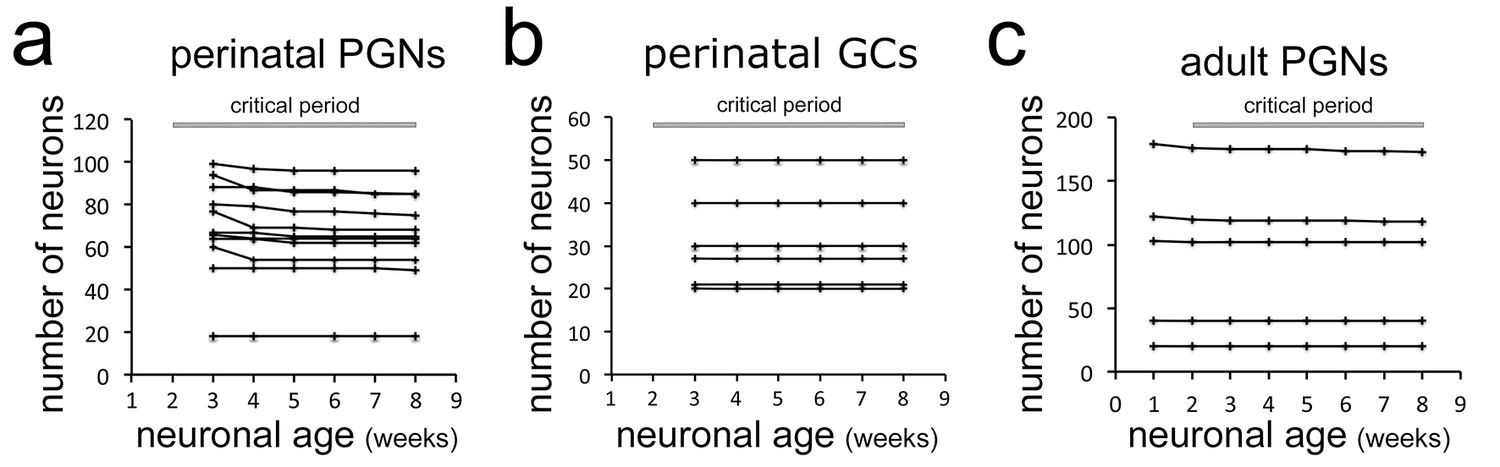
Stability of neuron populations in the OB in vivo.
(a) Tracing of perinatally induced timed neuron first cohorts (755 neurons) in 11 mice from 3 to 8 wpi. (b) Tracing of perinatally induced first cohorts of granule cells (178 cells in six mice) during the proposed critical period. (c) Tracing of the first cohort of periglomerular neurons in eight adult animals (538 neurons) after induction with tamoxifen injection at 2 months.
Figure 2—figure supplement 1
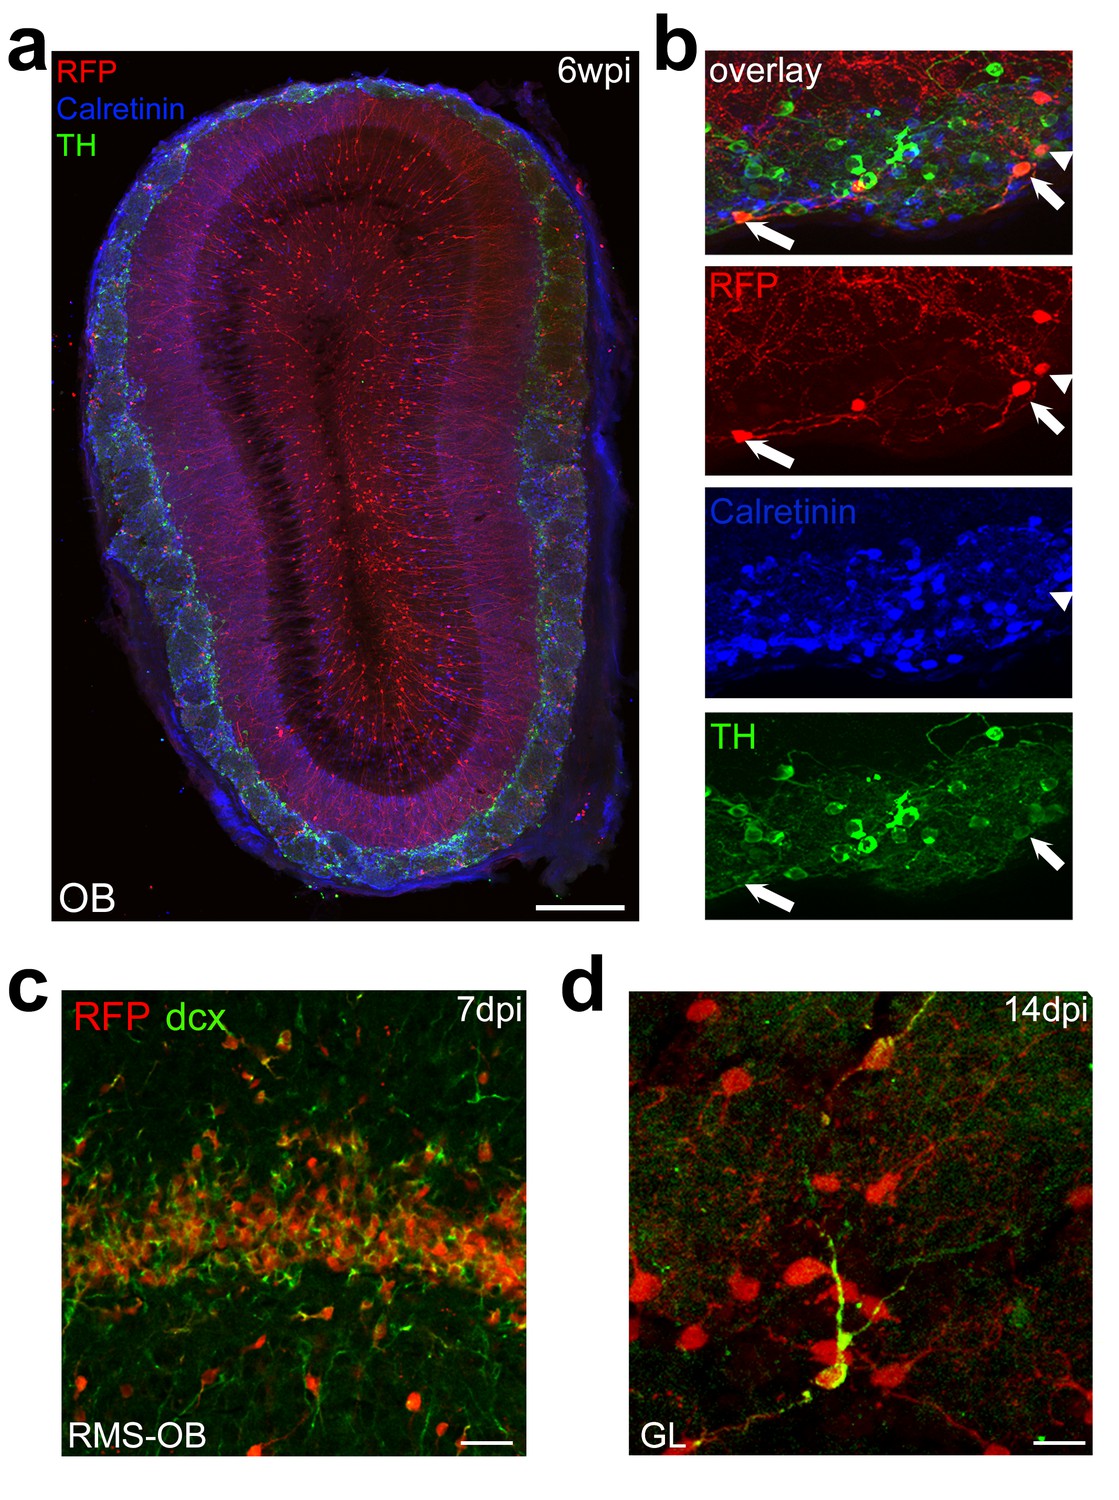
Adult born neuron labeling using Nestin-Cre-ERT2/Rosa -RFP mice.
(a, b) Coronal section through the OB of an adult Nestin-Cre-ERT2/Rosa-RFP mouse 6 weeks after tamoxifen injection at 2 months of age stained for the OB neuron subtype markers TH and Calretinin. (c, d) Seven days post induction (dpi) large amounts of OB neurons in the OB express the immature neuronal marker doublecortin (dcx). At 14 dpi individual cells in the GCL still express dcx. Scale bar: 300 μm in a, 30 μm in c, 10 μm in d.
Figure 3
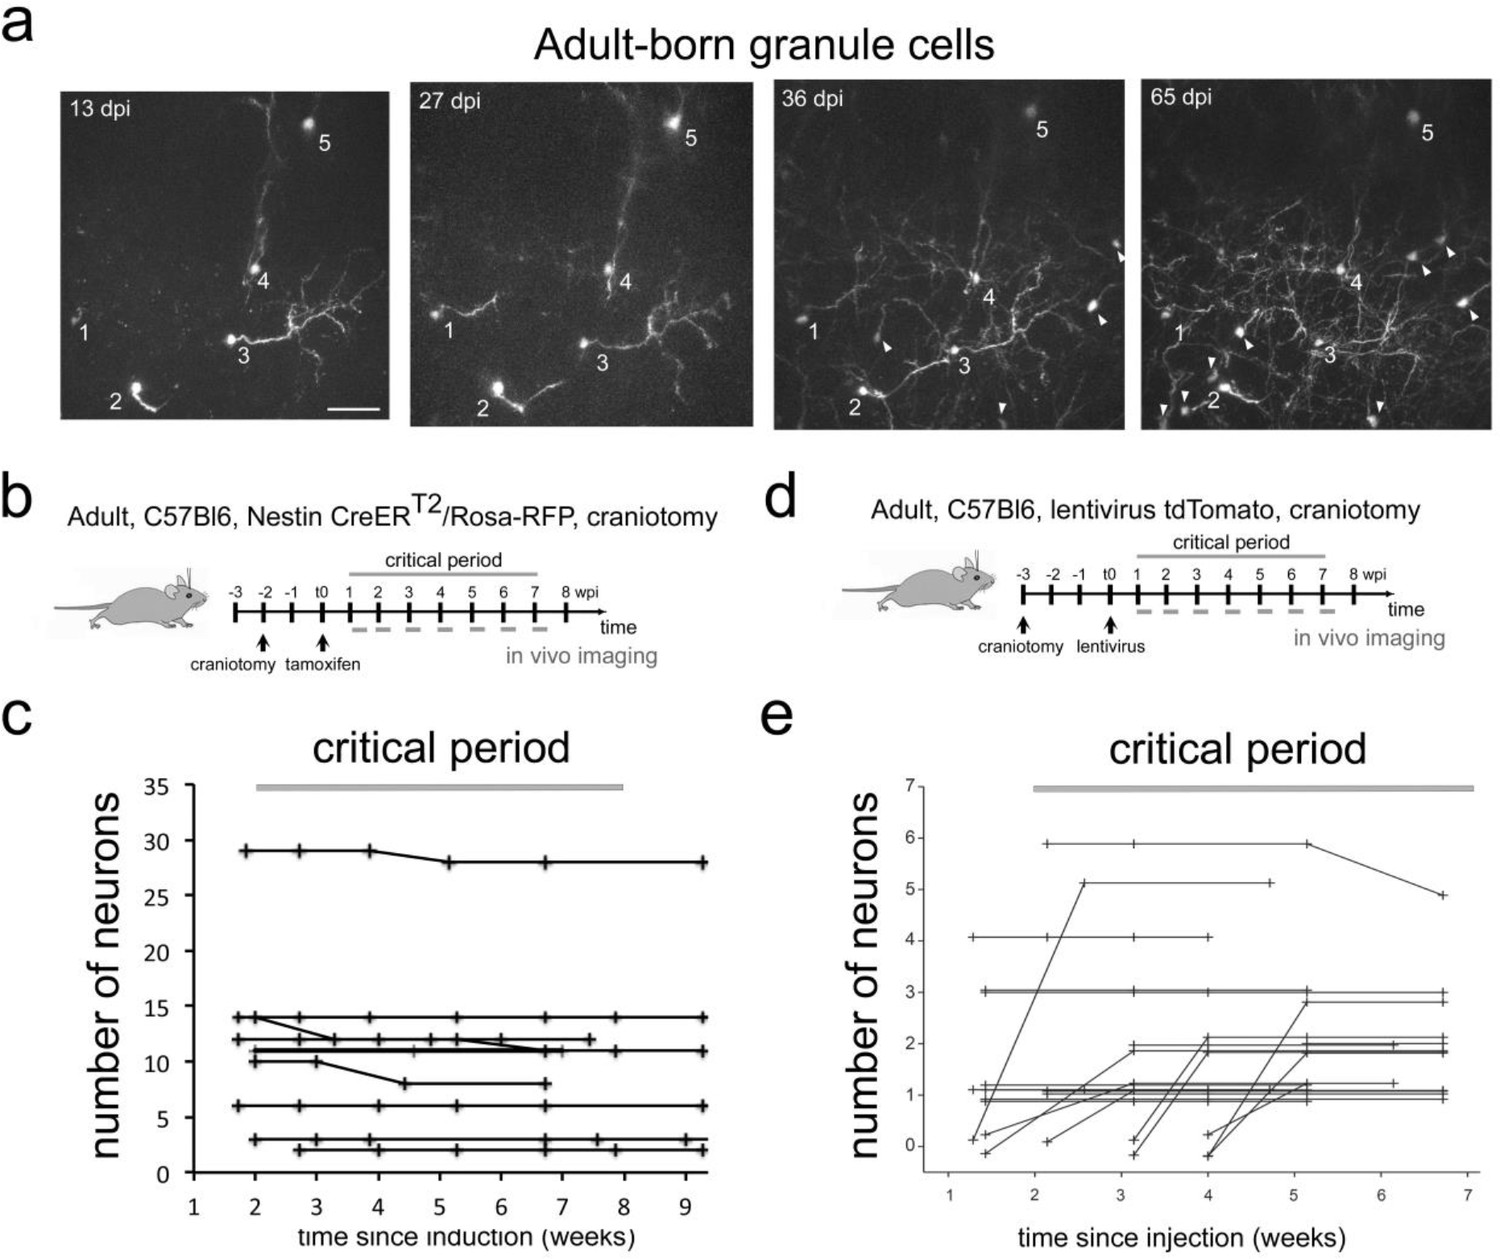
Adult-born granule cells stability in the OB in vivo.
(a) Example field of view (maximum intensity projection of volume with depth 150 µm) showing cells that were tracked between 13 and 65 days post tamoxifen injection (dpi). Arrowheads indicate newcomers that appeared after the first day of imaging and were subsequently stable at later time point. Scale bar 50 µm. (b) Labeling protocols and imaging timeline. To label granule neurons in adults, Nestin CRE-ERT2/Rosa-RFP animals were induced with tamoxifen. A craniotomy was performed 2 weeks before tamoxifen injection. A weekly imaging scheme was implemented over the critical period. (c) Tracing of adult-born granule cells (101 neurons) in nine mice over the critical period. (d) Labeling protocols and imaging timeline. To label granule neurons in adults, C57Bl6 animals were injected with a tomato lentivirus in the RMS. A craniotomy was performed 3 weeks before lentivirus injection. A weekly imaging scheme was implemented over the critical period. (e) Tracing of adult-born granule cells (48 neurons) in 3 mice from 19 fields of view from 1 to 7 weeks post injection in the RMS. Lines beginning at zero indicate new cells that appeared in the field of view and were subsequently tracked.
Figure 4

Sensory deprivation in the OB lead to neuronal death.
(a) Timeline for sensory deprivation experiment. Naris occlusion and thin skull preparation were performed 1 week after induction of RFP-positive neurons in adult mice. (b) Two weeks after occlusion neurons with complex morphologies were lost in the OB. (c) Quantification of neuron loss in control and occluded OBs over 8 weeks. Scale bar: 20 μm in b.
Figure 5
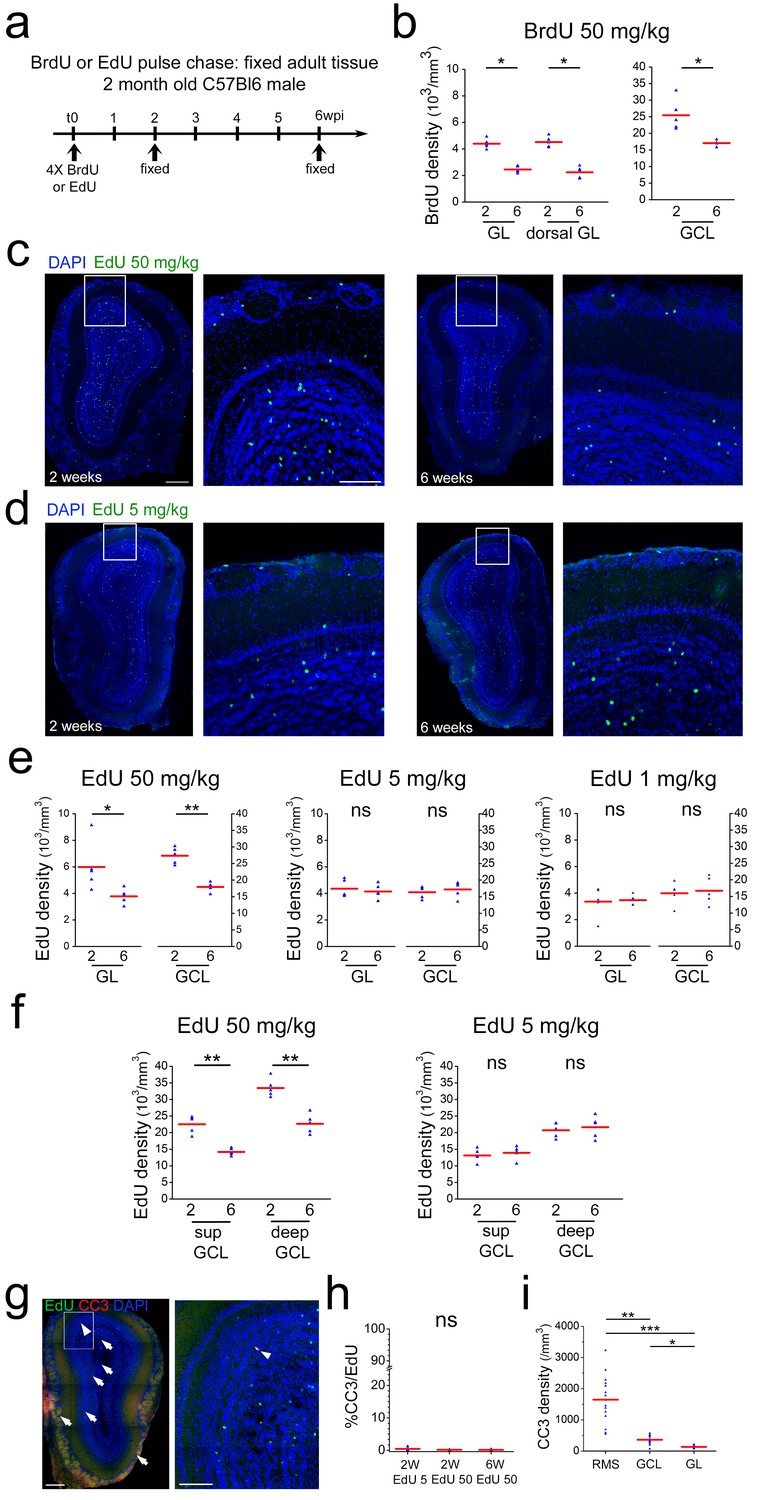
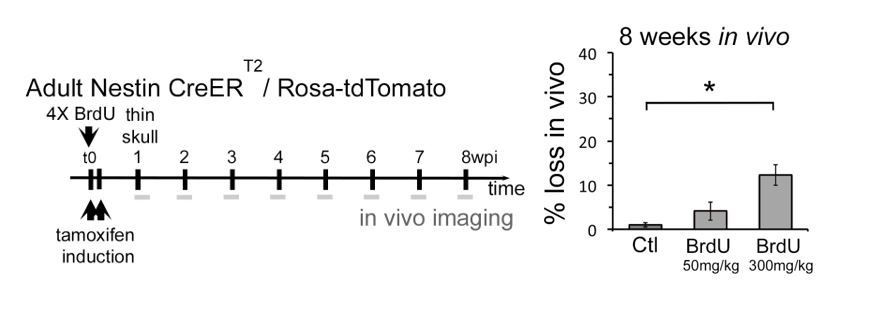
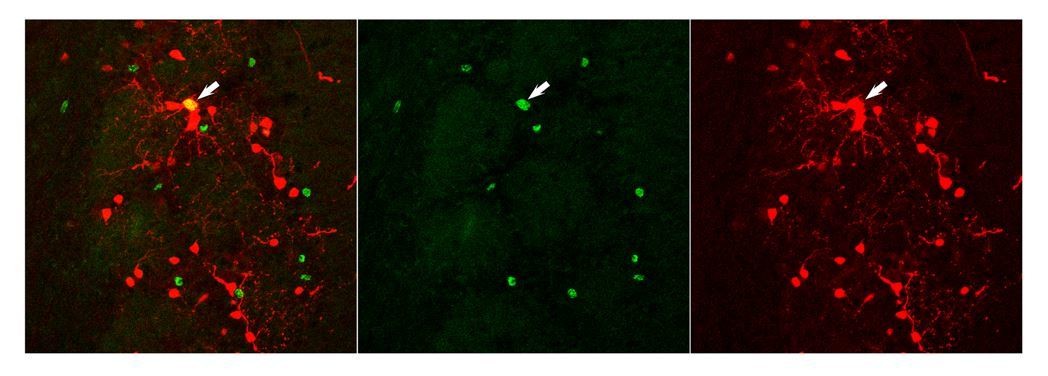
Neuronal survival after thymidine analog pulse chase.
(a) Timeline of BrdU or EdU pulse chase experiment. Four BrdU/EdU injections at different concentrations were performed in adult mice. Animals were sacrificed 2 and 6 wpi, respectively. (b) BrdU cell density in GL, dorsal GL and GCL between 2 and 6 weeks after injection. (c) Example of immunohistochemical staining of a coronal OB section 2 and 6 weeks after 4 × 50 mg/kg EdU injection. (d) Example of immunohistochemical staining of coronal OB sections 2 and 6 weeks after 4 × 5 mg/kg EdU injection. (e) EdU cell density in GL and GCL between 2 and 6 weeks after 4 × 50 mg/kg edU, 4 × 5 mg/kg edU and 4 × 1 mg/kg EdU injection, respectively. Note the strong cell loss at 50 mg/kg of EdU between 2 and 6 weeks and the absence of cell loss at 4 × 5 and 4 × 1 mg/kg EdU. (f) EdU cell density in superficial and deep GCL between 2 and 6 weeks after 4 × 50 mg/kg edU and 4 × 5 mg/kg edU injection, respectively. Note that for EdU 50 kg both layers show a similar cell loss between 2 and 6 weeks while this cell loss is absent in both layers at 5 mg/kg. (g) Example of immunohistochemical staining of a coronal OB section for EdU at 50 mg/kg (green) and cleaved Caspase 3 (red) (h) Increased concentrations of EdU do not augment the number of EdU/cleaved Caspase3 co-labeled cells. (i) Cleaved Caspase three density is more than four times higher in the RMS that in the GCL or GL layers. Scale bar: 300 μm in left panel in c, 100 μm in middle panel in c, 300 and 100 μm in g.
Figure 6
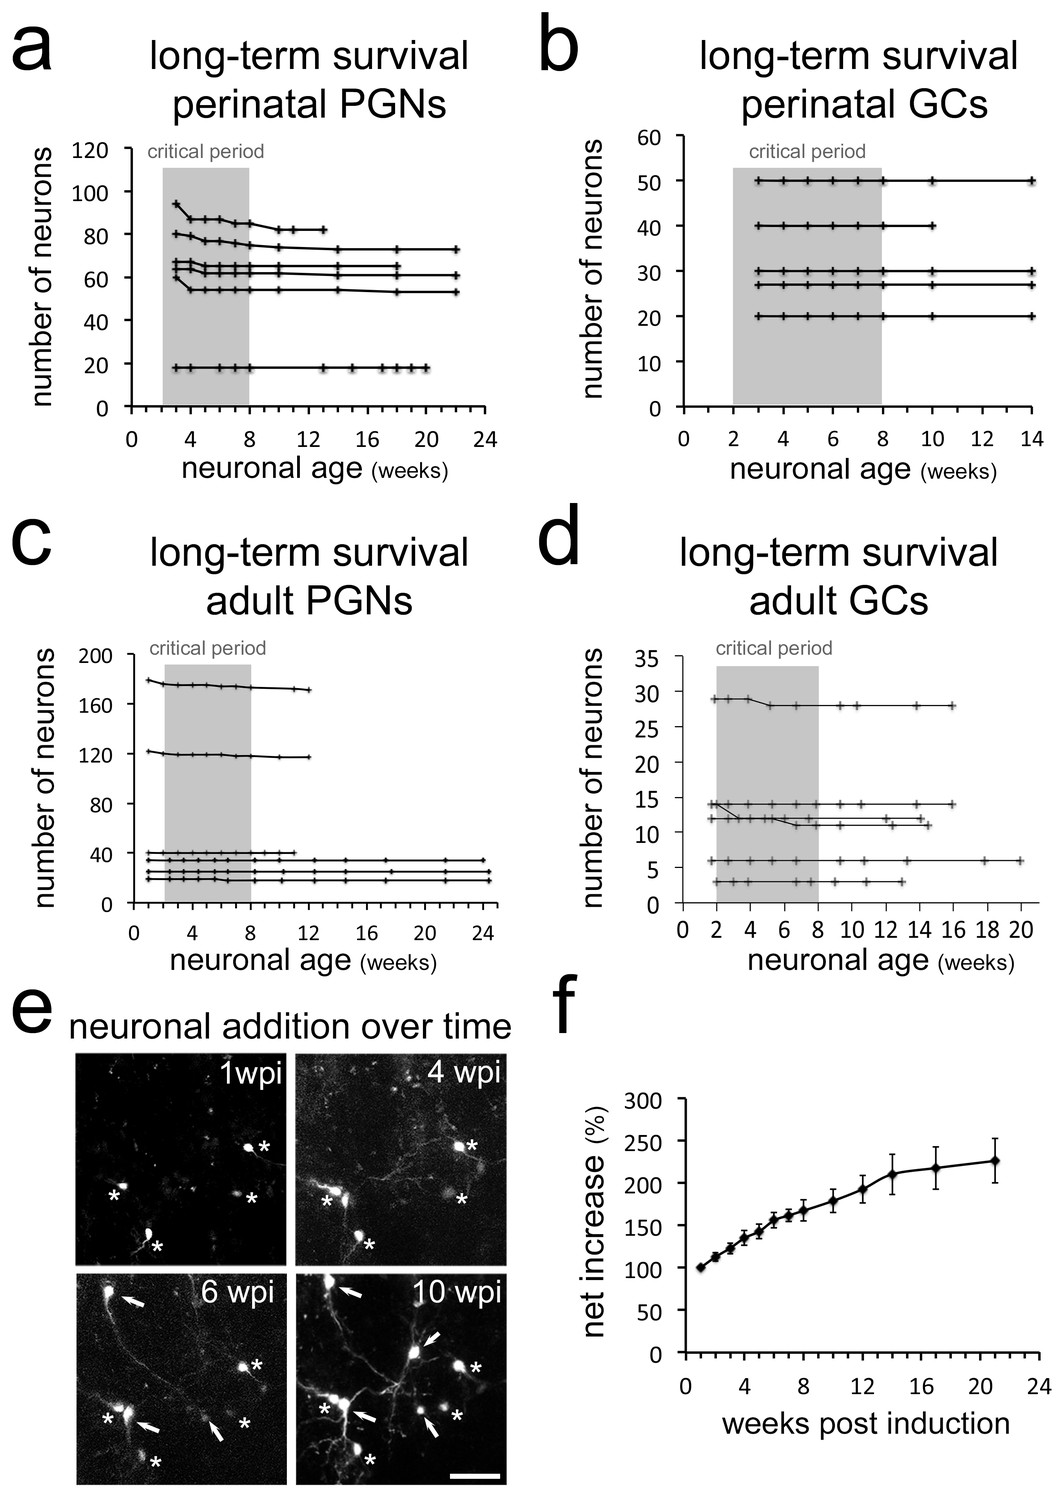
Long-term survival of neuron populations and neuronal addition in vivo.
Long-term survival of neuron populations and neuronal addition in vivo Very limited cell loss in (a) perinatal PGNs, (b) perinatal GCs, (c) adult born PGNs and (d) adult born GCs in long-term in vivo observations. (e) Additional RFP expressing neurons appear constantly in the observation window. (f) Net increase in all newborn periglomerular neurons in adult Nestin Cre-ERT2 mice over time. Scale bar in 40 μm in e.
Figure 7 with 1 supplement

Neuronal addition and growth of the OB.
(a) Example of volumetric analysis of inter-neuronal space between individually identified neurons in vivo (groups of four neurons in X,Y,Z; thus an irregular pyramid). (b) Quantification inter-neuronal space shows that distances between identified neurons increase in adult animals. (c) Reconstruction of an adult OB and part of the cortex based on 3-D light sheet imaging. (d) Comparison of 2- and 12-month-old OBs reconstructed from lightsheet images. (e) Quantification of volume increase in OBs from 1 to 12 months, normalized to 2 months. (f) Quantification of volume increase in OB sublayers from 1 to 12 months, normalized to 2 months. Volume increase affects both, the GL and the GCL. (g) Quantification of the volume of the forebrain at 2, 6 and 12 months, normalized to 2 months. Forebrain size over time does not change. (h) Examples of GCL cell density based on TOPRO-3 nuclear staining in whole, cleared OBs of 2- and 6-month-old mice. (i) Quantification of cell density from 1 to 12 months. Cell density is constant over the observation period. Scale bar: 800 μm in a,b. 40 μm in f, 50 μm in h.
Figure 7—figure supplement 1
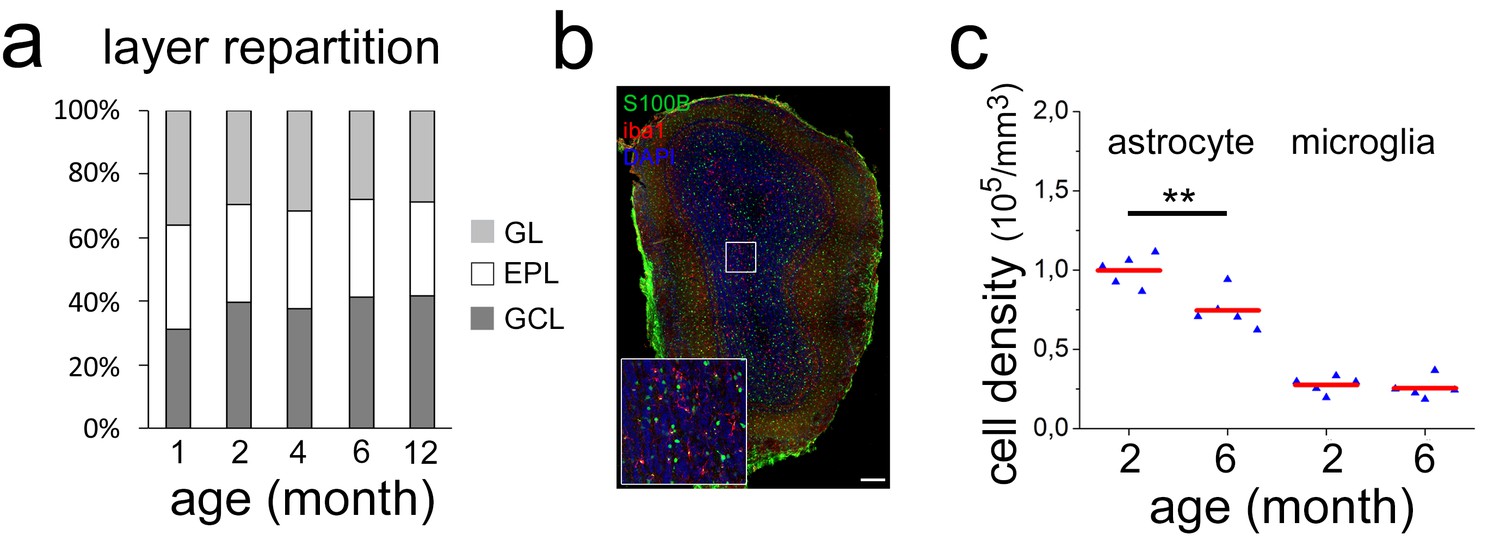
Repartition of neurons in the different OB layers over time and density of astrcoyte and microglia over time.
(a) Repartition of OB layers (GL, EPL, GCL) with increasing age. Although the volume of all layers increases with time their ratio remains constant. (b) Coronal section through the OB of a 6-month-old C57Bl6 stained for the astrocytic marker S100b, the microglial marker iba1 and the nucleus with DAPI. (c) Quantification of astrocytic and microglial density between 2 and 6 months. Astrocyte density is significantly decreased (p=0,006) while microglia density is constant. Scale bar: 200 μm in b.
Author response image 1
Author response image 2
Videos
Video 1
Example of a Z-stack showing perinatally born neurons in the GL.
This stack was the basis for the projection presented in Figure 1d.
Video 2
Example of a Z-stack showing adult born neurons in the GL.
This stack was the basis for the projection presented in Extended Data Figure 1—figure supplement 3.
Video 3
3D representation of an adult OB based on light sheet microscopy.
https://doi.org/10.7554/eLife.44830.016Additional files
-
Source data 1
Source data.
- https://doi.org/10.7554/eLife.44830.017
-
Transparent reporting form
- https://doi.org/10.7554/eLife.44830.018
Download links
A two-part list of links to download the article, or parts of the article, in various formats.
Downloads (link to download the article as PDF)
Open citations (links to open the citations from this article in various online reference manager services)
Cite this article (links to download the citations from this article in formats compatible with various reference manager tools)
Neuronal integration in the adult mouse olfactory bulb is a non-selective addition process
eLife 8:e44830.
https://doi.org/10.7554/eLife.44830


