Primate prefrontal neurons signal economic risk derived from the statistics of recent reward experience
- University of Cambridge, United Kingdom
Figures
Figure 1
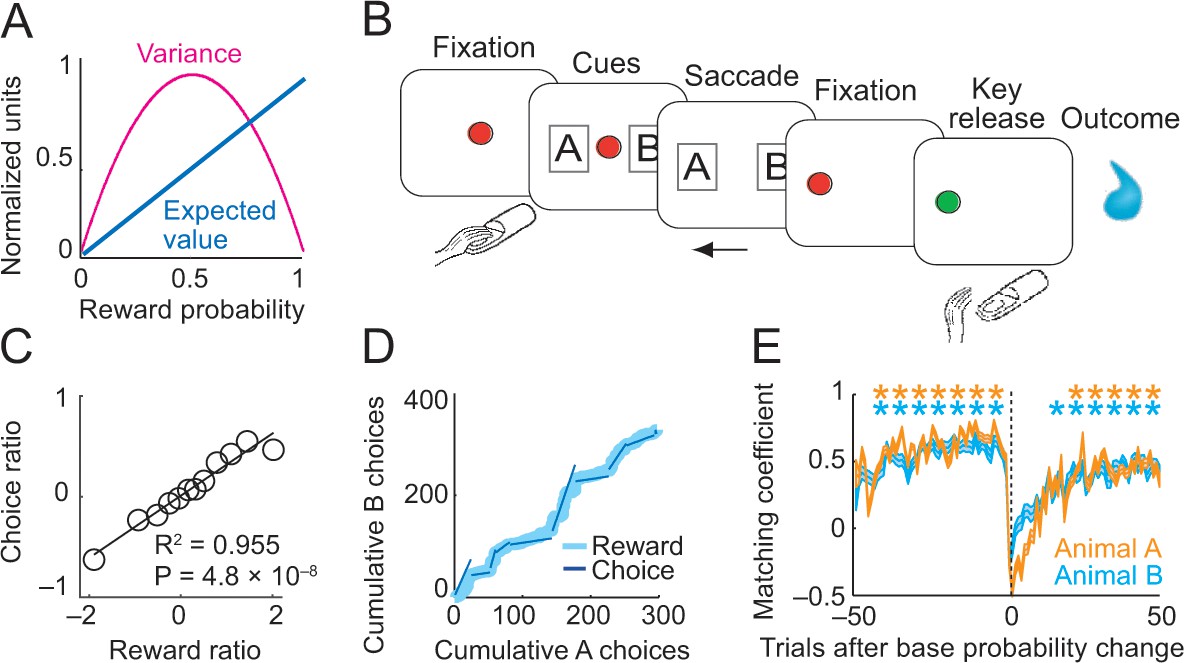
Risk, choice task and basic behavior.
(A) Relationship between risk measured as reward variance and reward probability. (B) Choice task. The animal made a saccade-choice between two visual stimuli (fractals, ‘objects’) associated with specific base reward probabilities. Object reward probabilities varied predictably trial-by-trial according to a typical schedule for eliciting matching behavior and unpredictably block-wise due to base-probability changes. Probabilities were uncued, requiring animals to derive reward risk internally from the variance of recently experienced rewards. Left-right object positions varied pseudorandomly. (C) Matching behavior shown in log ratios of rewards and choices. Relationship between log-transformed choice and reward ratio averaged across sessions and animals (N = 16,346 trials; linear regression; equally populated bins of reward ratios; standard errors of the mean (s.e.m.) were smaller than symbols). (D) Cumulative object choices in an example session. The choice ratio in each trial block (given by the slope of the dark blue line) matched the corresponding reward ratio (light blue). (E) Adaptation to block-wise reward-probability changes. Matching coefficient (correlation between choice and reward ratio) calculated using seven-trial sliding window around base probability changes (data across sessions, asterisks indicate significant correlation, p<0.05).
-
Figure 1—source data 1
- https://doi.org/10.7554/eLife.44838.003
Figure 2
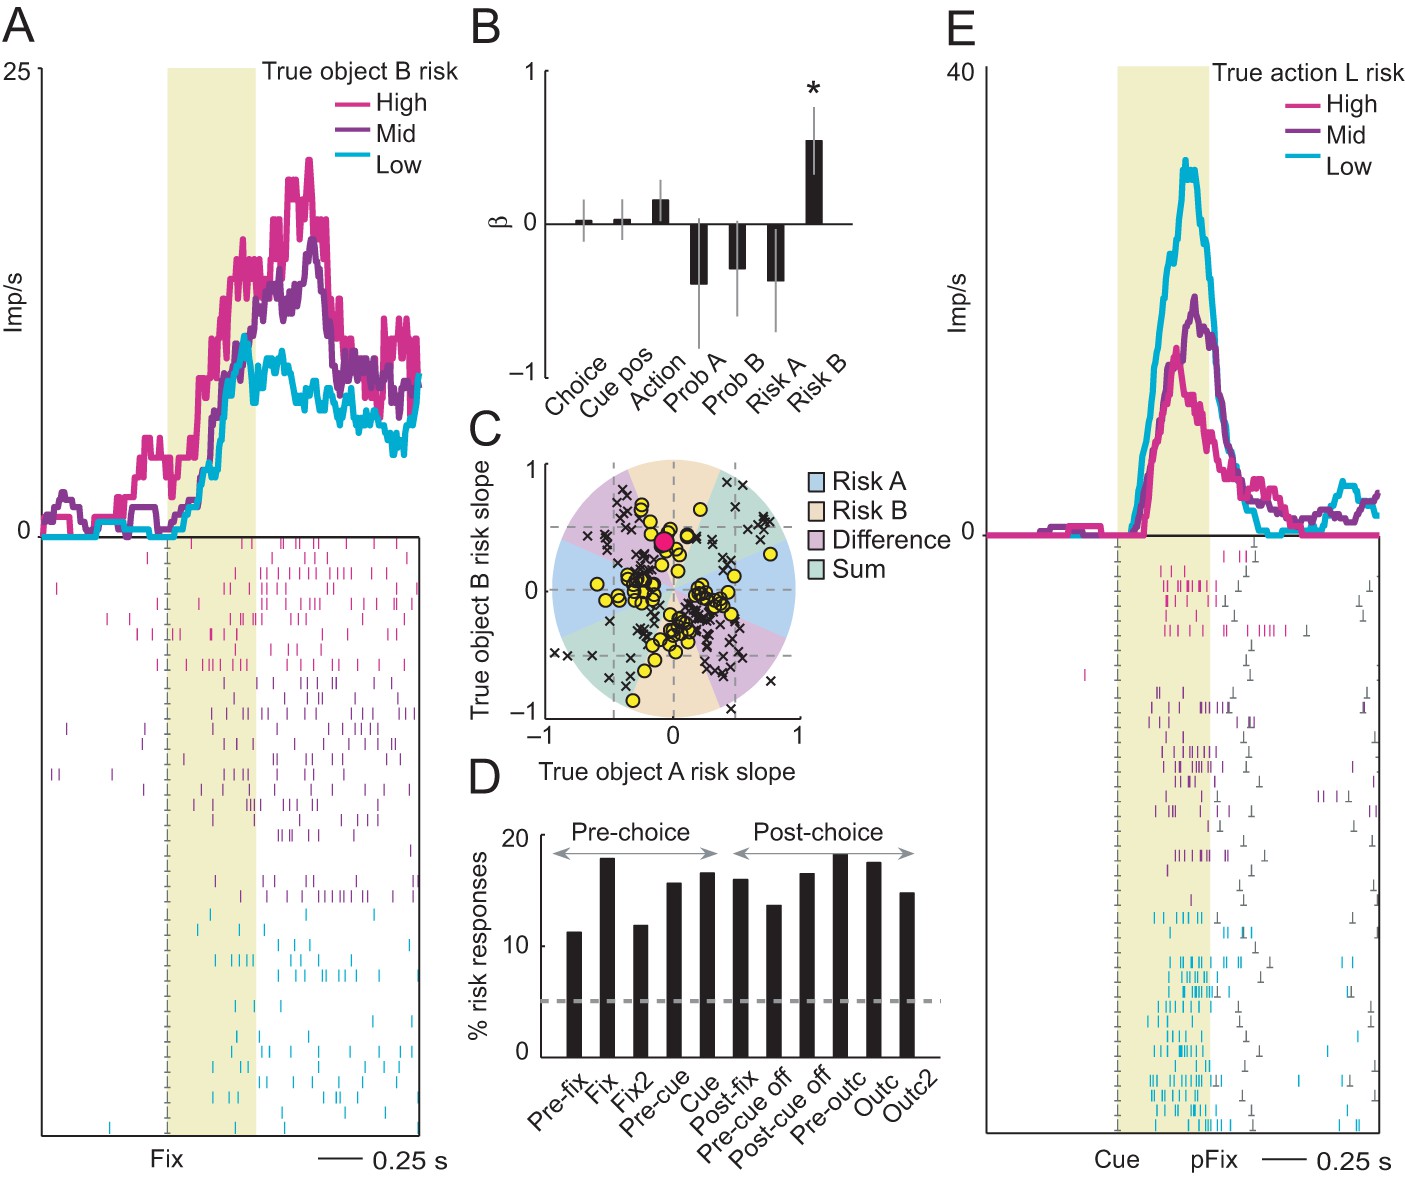
Neuronal coding of objective risk for objects and actions.
(A) Activity from a single DLPFC neuron in fixation period related to the true risk associated with object B, derived from reward probability. Top: peri-event time histogram of impulse rate, aligned to fixation spot onset, sorted into object-risk terciles. Bottom: raster display: ticks indicate impulses, rows indicate trials; gray dots indicate event markers. Yellow shaded zone (500 ms after fixation cue onset) indicates analysis period. (B) Beta coefficients (standardized slopes ± s.e.m) from multiple linear regression. Only the object-B risk beta coefficient was significant (p=0.0172, t-test; all other coefficients: p>0.25). (C) Categorization of coding risk for object A or B or relative risk (risk difference or risk sum) based on the angle of regression coefficients across neurons. Each symbol represents a neuronal response by its normalized risk slopes for objects A and B; different symbols indicate differently classified neuronal responses as follows. Yellow circles: responses classified as coding object risk; red circle: position of object-B risk response of the neuron shown in A and B; black crosses: responses classified as coding relative risk. (D) Percentages of object risk responses for all task epochs (multiple linear regression; 1222 task-related responses from 205 neurons). (E) Activity of a single DLPFC neuron related to the true risk for leftward saccades (left action risk) in cue period (pFix: onset of peripheral fixation spot confirming choice).
-
Figure 2—source data 1
- https://doi.org/10.7554/eLife.44838.005
Figure 3 with 1 supplement
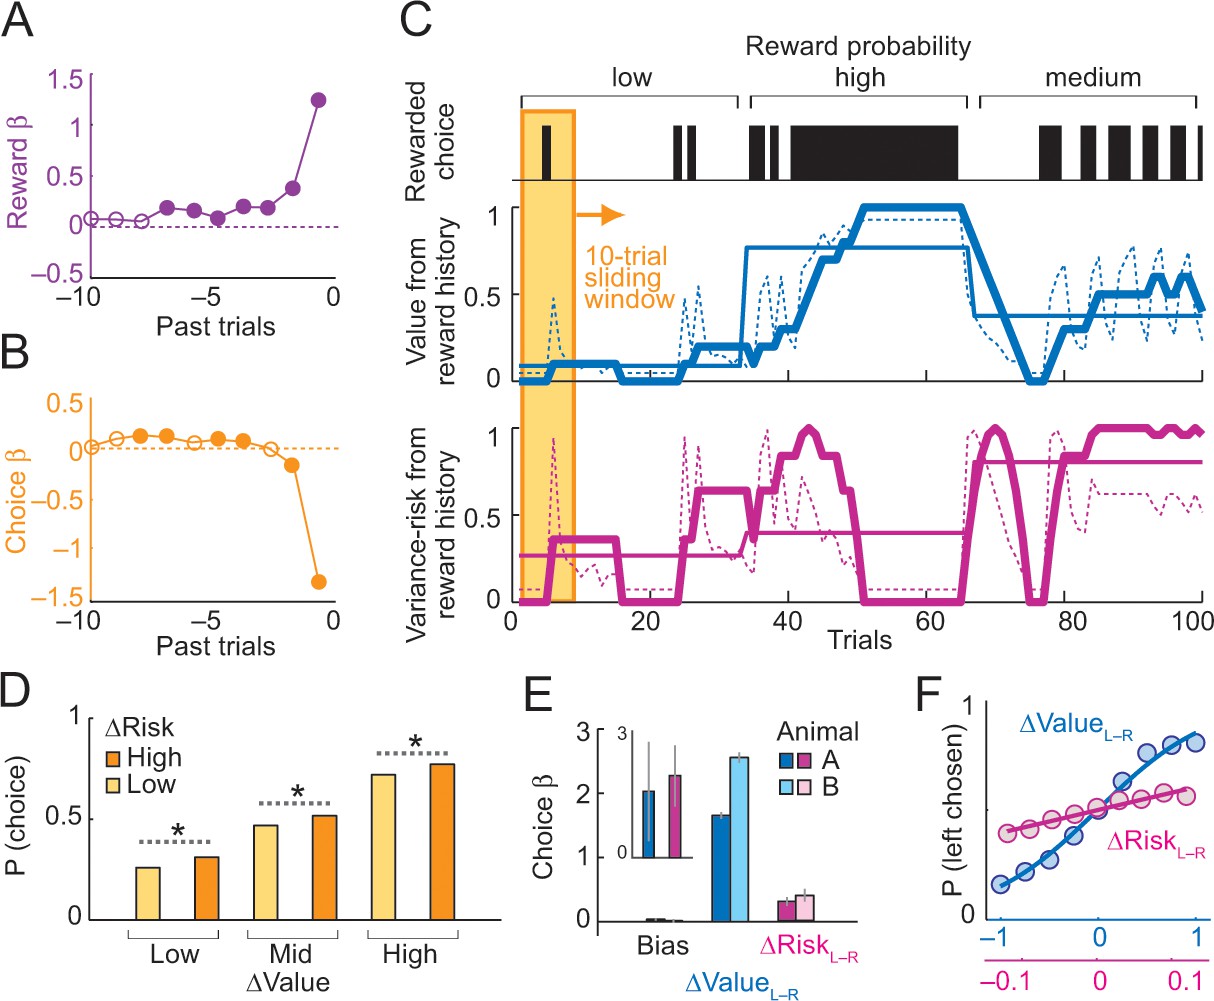
Deriving subjective risk from the variance of reward history.
(A) Subjective weights of influence of recent rewards on object choice, as derived from logistic regression. Filled symbols indicate significance (p<0.005, t-test; pooled across animals). (B) Subjective weights of influence of recent choice on object choice, as derived from logistic regression. (C) Approach for deriving subjective risk from the variance of recent reward history. Upper panel: vertical black bars represent rewarded choices for object A. Middle/lower panels: trial-by-trial estimates of value (middle) and risk (lower) calculated, respectively, as mean and variance of reward history over last 10 trials (using weights shown in A). The dashed magenta line indicates the subjective risk estimate used for neuronal and behavioral analysis. Heavy lines: running average of weighted estimates. Thin solid lines: unweighted, objective value/risk. Value from reward history was highest in the high-probability block, whereas risk was highest in medium-probability block (inverted U-shaped relationship, see Figure 1A). All units were normalized to allow for visual comparisons. (D) Positive influence of subjective risk on choice (risk-seeking attitude) and separate value and risk influences on choice. Object-choice probability increased with risk difference between objects (ΔRisk, sorted by median split; ‘high’ indicates higher risk with object A compared to object B; p<0.002 for all pair-wise choice probability comparisons between adjacent relative-risk levels, χ2-tests; N = 16,346 trials). The risk effect added monotonically and consistently to the increase of choice probability with object value difference (ΔValue). (E) Logistic regression. Coefficients (β) for relative value (ΔValue, p=4.4 × 10−39), relative risk (ΔRisk. p=2.8 × 10⁻⁴) and left-right bias (Bias, p=0.698) across sessions (t-tests, random-effects analysis). The constant (bias) was not significant, suggesting negligible side bias. The inset shows coefficients for a subset of trials where value difference was minimized (10% of trials); only risk difference was significantly related to choice (p=0.0072) but not value difference (p=0.182), data pooled across animals. (F) Psychometric functions relating relative value and risk to choice probability (across animals and sessions).
-
Figure 3—source data 1
- https://doi.org/10.7554/eLife.44838.009
Figure 3—figure supplement 1

Influences on saccadic reaction times.
Standardized regression coefficients from multiple regression of saccadic reaction times on different task-related variables. Data pooled across animals; reaction times were z-standardized within each testing session. |Val diff|: unsigned difference in object value between choice objects; Val sum: sum of object values; |Risk diff|: unsigned difference in object risk between choice objects; Risk sum: sum of object risks; Animal: dummy variable denoting animal identity. Asterisks indicate statistical significance (p<0.01, t-test on regression coefficients).
-
Figure 3—figure supplement 1—source data 1
- https://doi.org/10.7554/eLife.44838.008
Figure 4 with 4 supplements
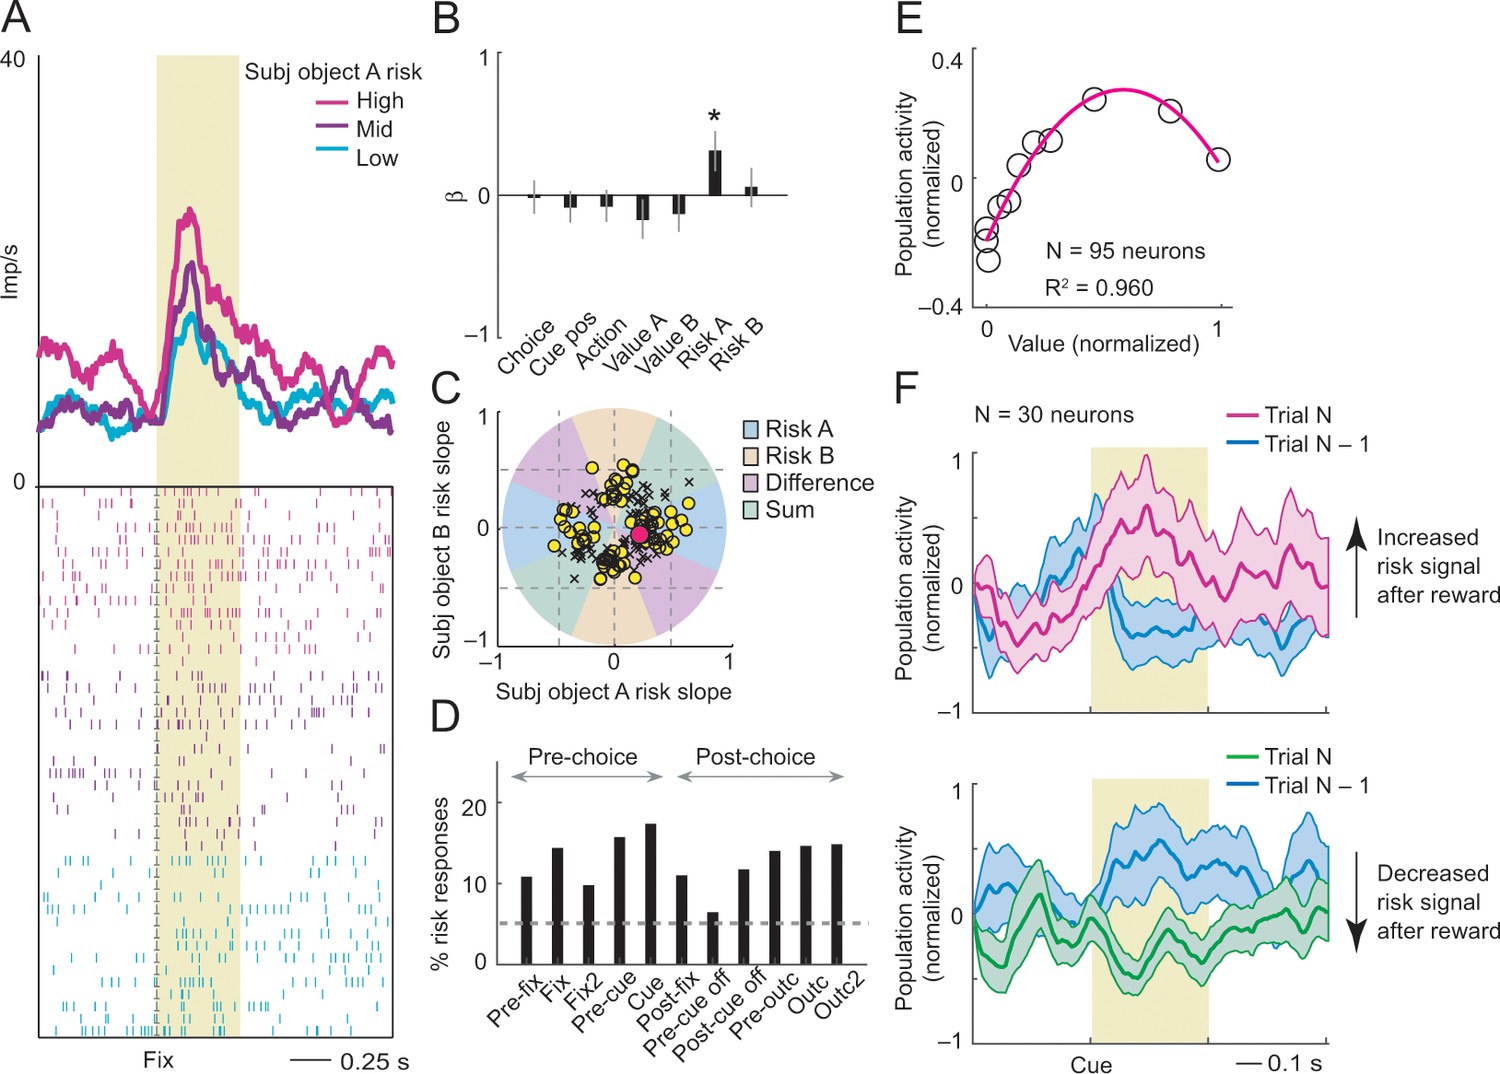
Subjective object-risk coding.
(A) Activity from a single DLPFC neuron coding subjective risk associated with object A before choice (fixation period). Object risk was derived from the variance of recently experienced rewards associated with a specific object. (B) Beta coefficients (standardized slopes) from a multiple linear regression of the neuron’s fixation impulse rate showed significant coding only for object-A risk (p=0.0316, t-test; all other coefficients: p>0.22). (C) Categorization of coding risk for object A or B, risk difference or risk sum based on the angle of coefficients. Red circle: position of object-A risk response of the neuron shown in A and B. (D) Percentages of object-risk responses for all task epochs (multiple regression, 1222 task-related responses from 205 neurons). (E) Population activity of object-risk neurons as a function of object value. Activity conformed to the characteristic inverted U-shaped relationship between reward-variance risk and reward probability (see Figure 1A). Error bars were smaller than symbols. (F) Neuronal risk-updating following reward. Population activity of object-risk neurons at the time of choice (cue period), shown separately for trials in which object risk on the current trial increased (top) or decreased (bottom) following reward on the previous trial. When a reward increased object risk (by increasing reward variance), cue-activity on the following trial (N, magenta) was significantly higher compared to that on the previous trial (N-1, blue; p<0.001, Wilcoxon test), reflecting the updated object risk. Conversely, when a reward decreased object risk (by decreasing reward variance), activity on the following trial (green) decreased correspondingly (p<0.001).
-
Figure 4—source data 1
- https://doi.org/10.7554/eLife.44838.019
Figure 4—figure supplement 1
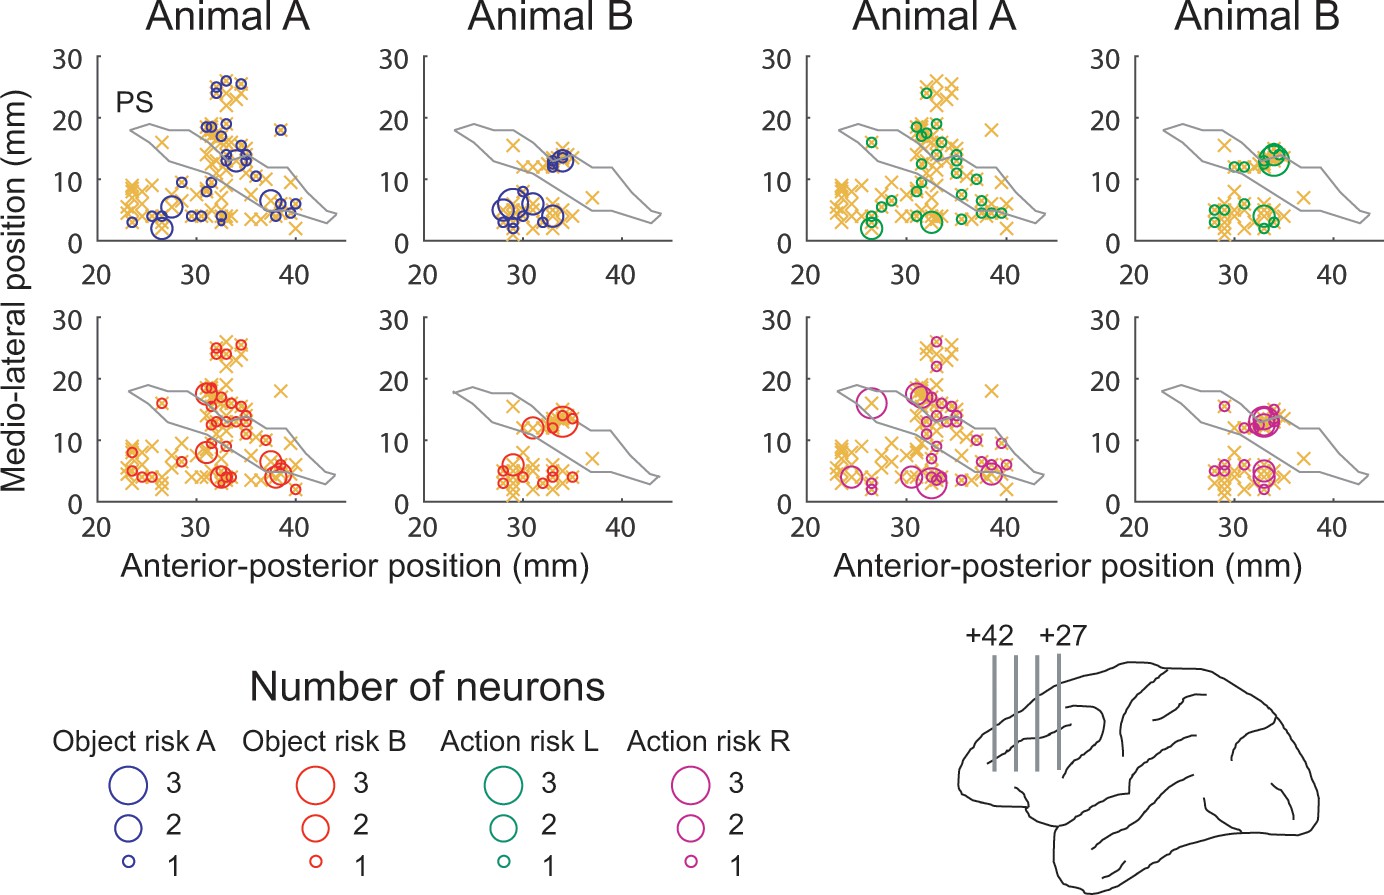
Anatomical location of recording sites.
Anterior-posterior position was defined with respect to inter-aural line. Orange crosses indicate locations for all recorded neurons. PS, approximate position of principal sulcus. Lower right anatomical schematic outlines recording locations in upper and lower banks of principal sulcus. Numbers indicate anterior-posterior distance from inter-aural line. .
-
Figure 4—figure supplement 1—source data 1
- https://doi.org/10.7554/eLife.44838.013
Figure 4—figure supplement 2
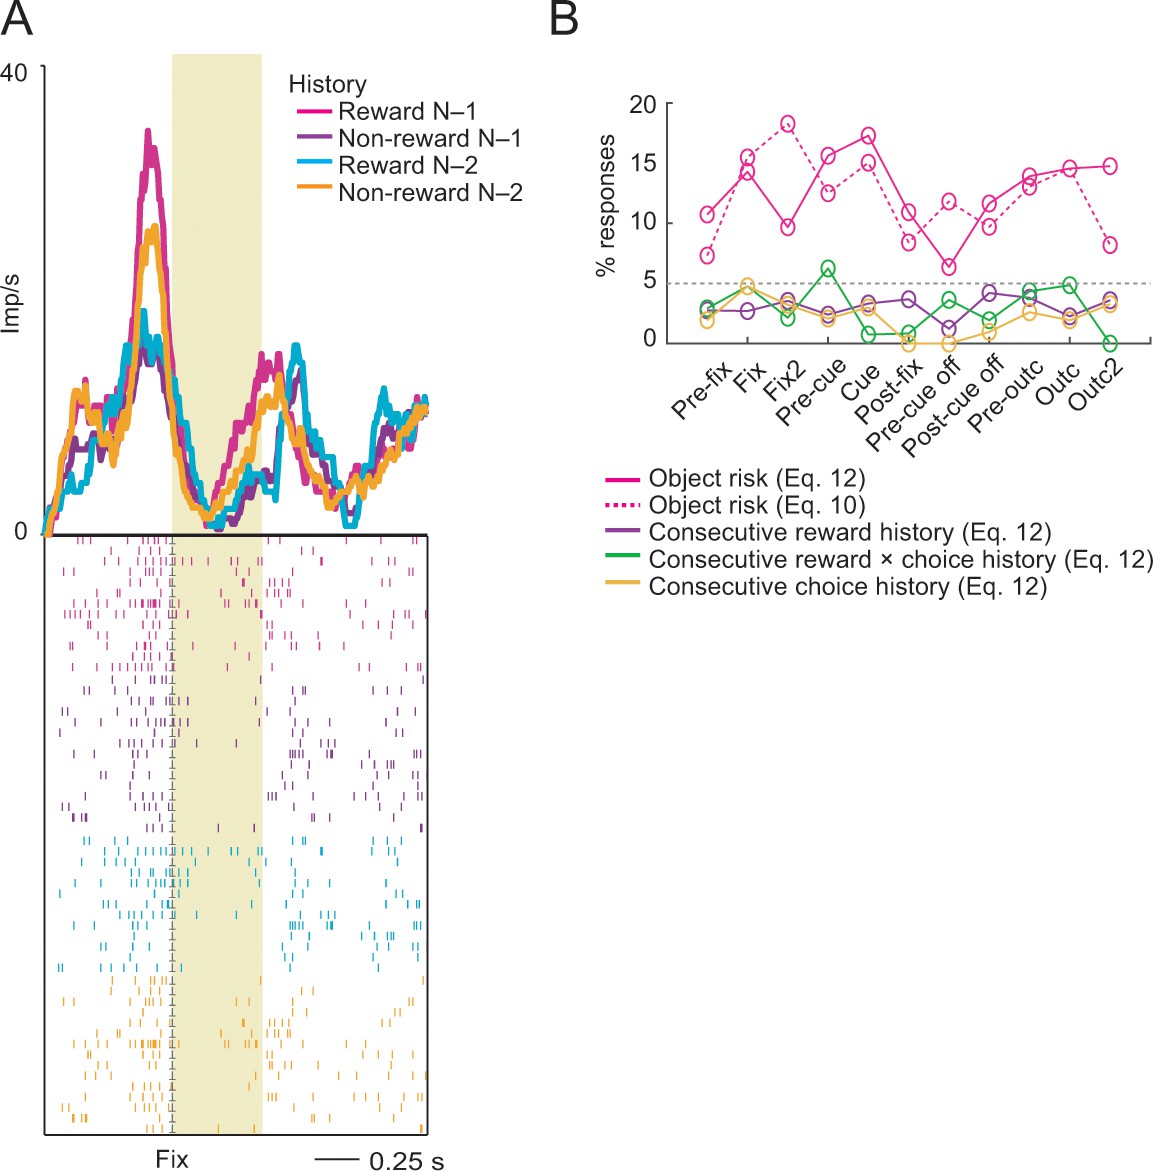
Reward-history control.
(A) Activity of a single DLPFC neuron reflecting the non-linear interaction between rewards in the previous two consecutive trials. The neuron showed stronger activity in the fixation period on the current trial (N) when reward had been received on the previous trial (N-1). By contrast, current-trial activity was stronger when no reward had been received two trials ago (N-2). (B) Percentage of object-risk neurons identified in a supplementary regression (Equation 12) that included additional covariates for reward, choice and reward × choice history for the preceding two consecutive trials (N-1 and N-2). Inclusion of these control covariates had only a minor effect on the percentage of identified object-risk neurons compared to our main regression (Equation 10). Compared to robust object-risk signals across task periods (magenta), responses explicitly reflecting consecutive reward history (purple) across the two preceding trials, or consecutive reward × choice history (green) or choice history (orange) were rare, likely because these effects were better accounted for by object-value and object-risk regressors.
-
Figure 4—figure supplement 2—source data 1
- https://doi.org/10.7554/eLife.44838.015
Figure 4—figure supplement 3
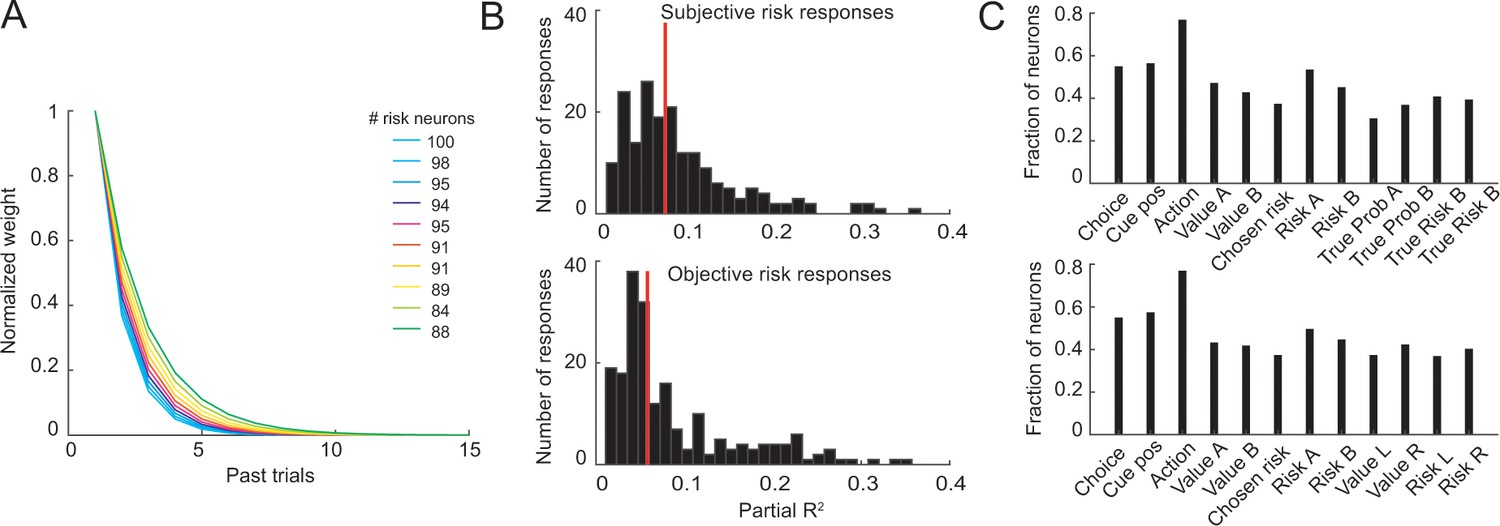
Control analyses for neuronal object-risk coding.
(A) Results from supplementary analyses in which neuronal activity was regressed on object-risk measures derived using different exponential weighting functions for past rewards. Numbers next to the color code in the legend state the number of identified object-risk neurons for each color-coded weighting function. The main analysis using empirically derived weighting function from the each animals’ choices identified 95 object-risk neurons. (B) Histograms of partial-R2 values (quantifying explained variance in neuronal activity) for neuronal responses with significant coefficient for subjective risk (upper histogram) and significant coefficient for objective risk (lower histogram). Red lines indicate distribution means. The distributions were significantly different (p=0.0015, Kolmogorov-Smirnov test) with higher distribution mean for subjective risk (p=0.04, Wilcoxon test). (C) Results from stepwise multiple regressions. Shown are the fractions of neurons (from 205 recorded DLPFC neurons, pooled across all task periods) with significant effects for the different variables when both objective and subjective value and risk variables were included in the starting set of regressors (upper panel) and when both object risk and action risk variables were included in the starting set (lower panel). These results and those in the main text show that significant numbers of neurons coded object risk across analysis approaches.
-
Figure 4—figure supplement 3—source data 1
- https://doi.org/10.7554/eLife.44838.018
Figure 4—figure supplement 4
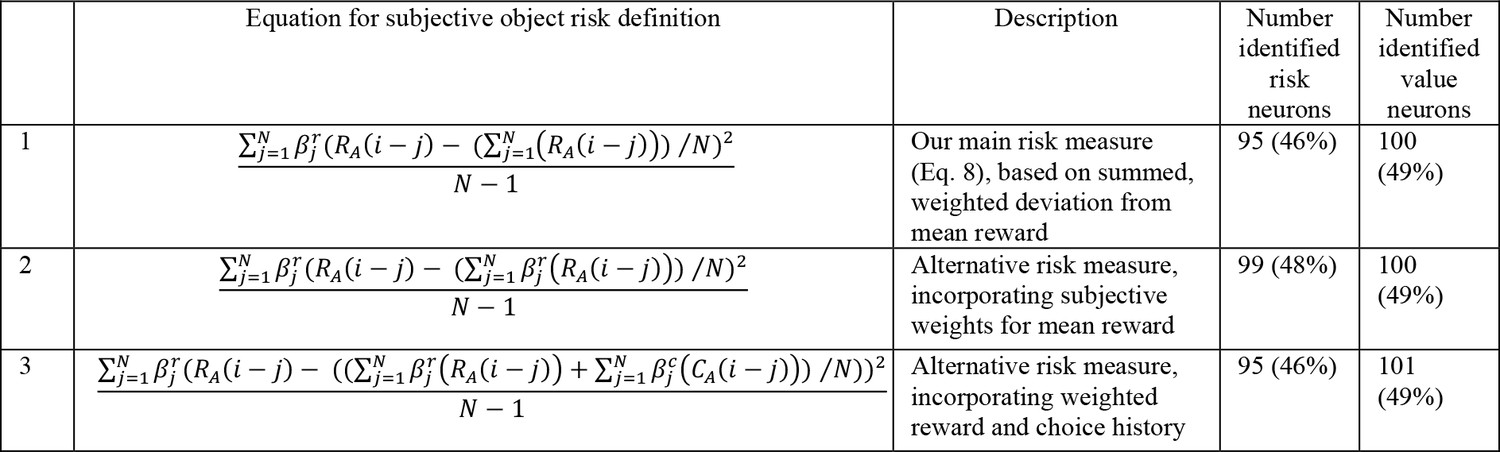
Numbers of neurons (and percentages of recorded neurons) encoding risk and value for alternative risk definitions.
The alternative definitions were used for calculating the object risk regressors in our main neuronal regression model (Equation 10).
Figure 5
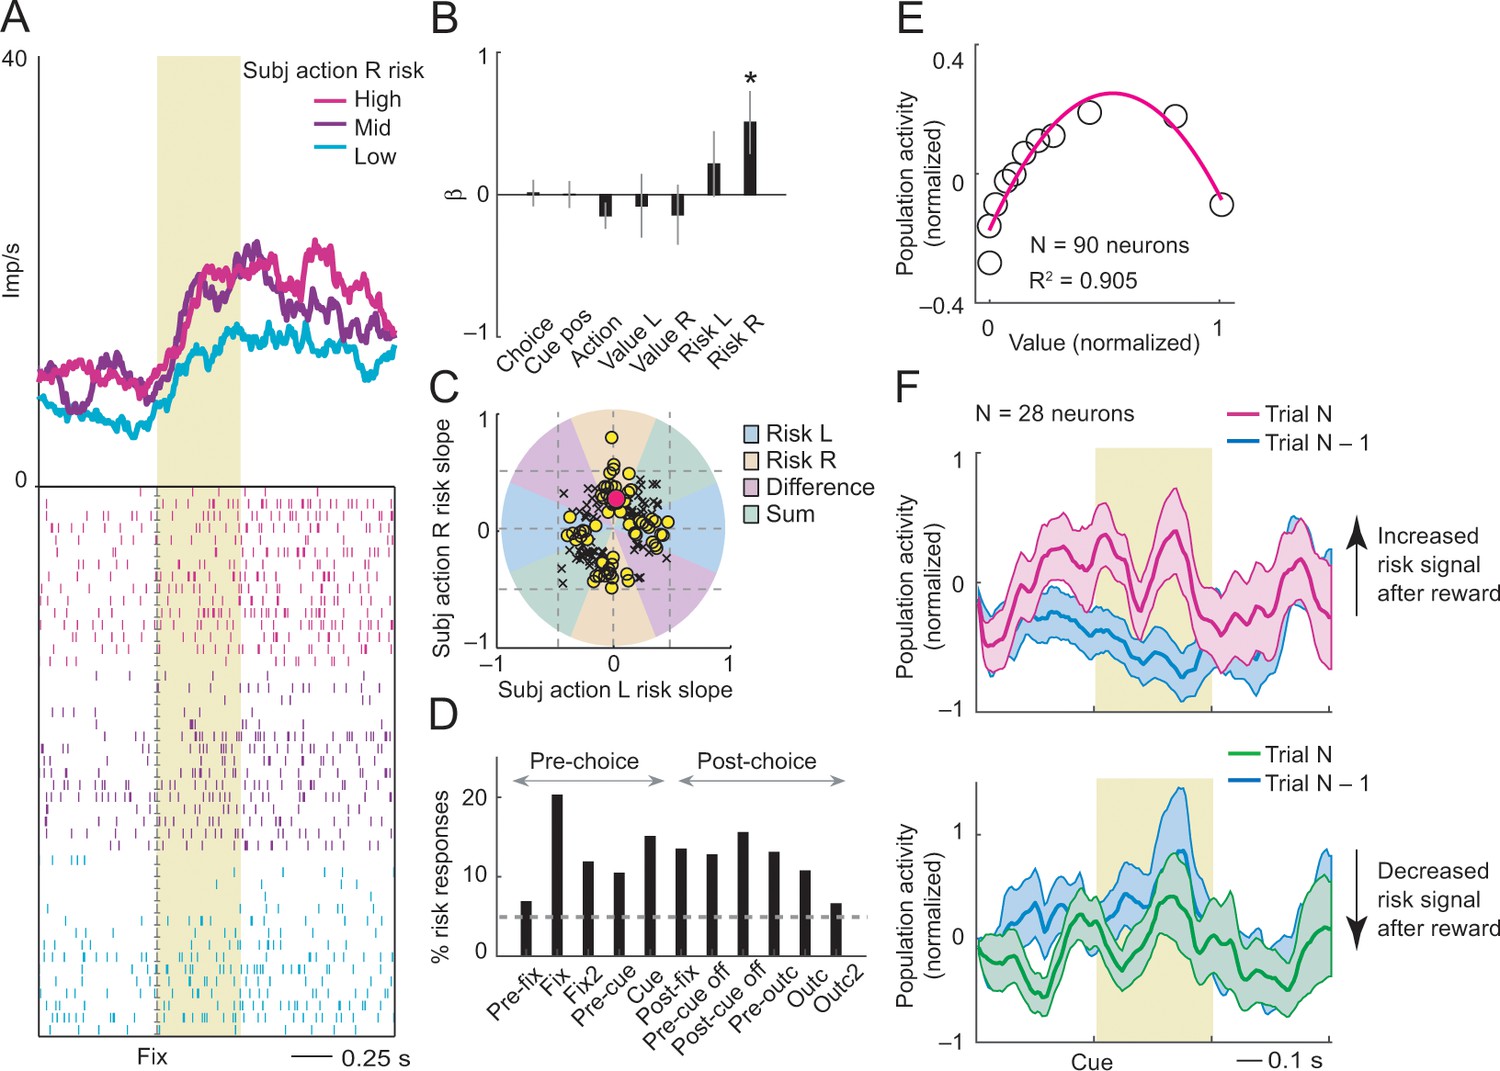
Subjective action-risk coding.
(A) Activity from a single DLPFC neuron coding subjective risk associated with rightward saccades (action R) during fixation. Action risk was derived from the variance of recently experienced rewards associated with a specific action. (B) Beta coefficients (standardized slopes) from a multiple linear regression of the neuron’s fixation impulse rate showed significant coding only for action risk associated with rightward saccades (p=0.0233, t-test; all other coefficients: p>0.11). (C) Categorization of coding risk for action L or R, risk difference or risk sum based on the angle of coefficients. Red circle: position of action-R risk response of the neuron shown in A and B. (D) Percentages of action-risk responses for all task epochs (multiple regression, 1222 task-related responses from 205 neurons). (E) Population activity of action-risk neurons as a function of reward value. Activity conformed to the characteristic inverted U-shaped relationship between reward-variance risk and reward probability (see Figure 1A). Error bars were smaller than symbols. (F) Neuronal risk-updating following reward. Population activity of action-risk neurons at the time of choice (cue period), shown separately for trials in which reward on the previous trial increased (top) or decreased (bottom) action risk. When a reward increased action risk (by increasing reward variance), cue-activity on the following trial (N, magenta) was significantly higher compared to that on the previous trial (N-1, blue; p<0.001, Wilcoxon test), reflecting the updated action risk. Conversely, when a reward decreased action risk (by decreasing reward variance), activity on the following trial (green) decreased correspondingly (p<0.001).
-
Figure 5—source data 1
- https://doi.org/10.7554/eLife.44838.021
Figure 6
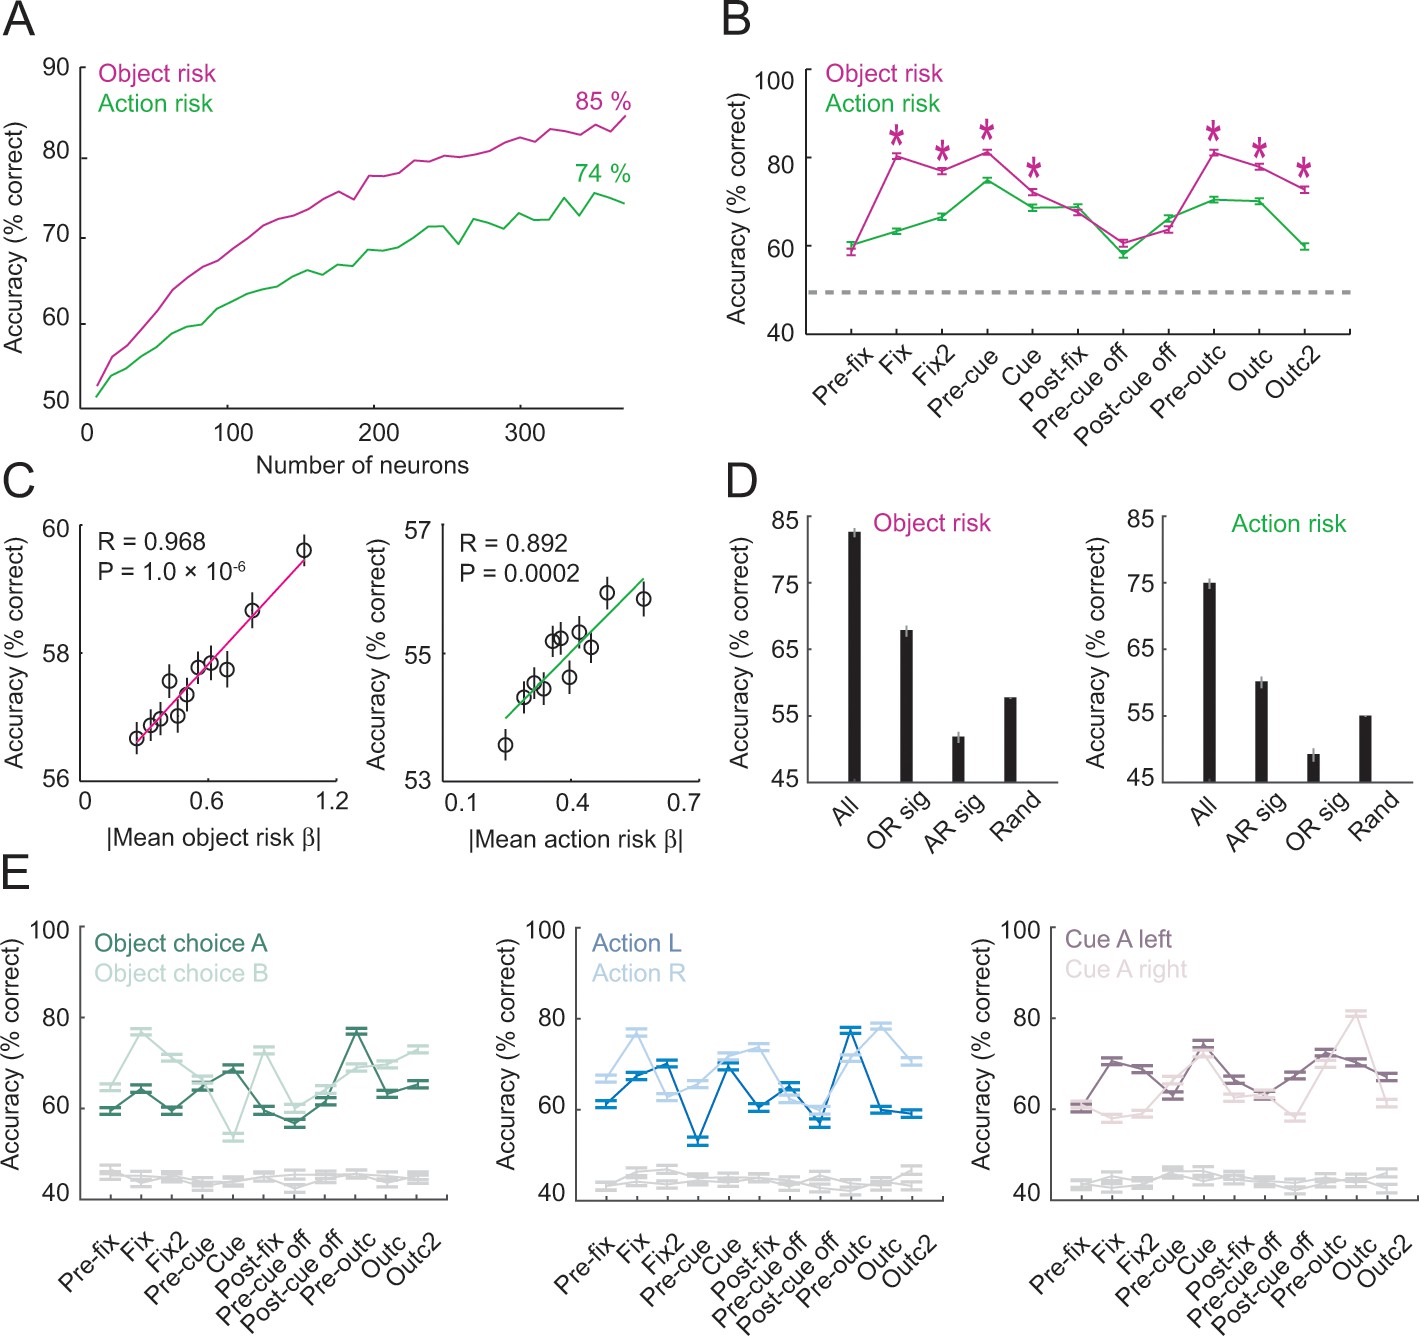
Population decoding of risk from unselected neurons.
(A) Leave-one-out cross-validated decoding accuracy (% correct classification) of a linear support-vector-machine classifier decoding object risk and action risk in pre-cue period. Decoding performance increased with the number of neurons. Analysis was based on normalized single-trial activity of neurons that met decoding criteria without pre-selection for risk-coding. Data for each neuron number show mean (± s.e.m) over 100 iterations of randomly selected neurons. Each neuron entered the decoder twice, to decode risk for object A and B (or action L and R). (B) Decoding for object risk and action was significantly above chance (gray line, decoding from shuffled data) in all task epochs (p<0.0001, Wilcoxon test). Object-risk decoding was significantly better than action-risk decoding in specific trial periods (Asterisks: p<0.005, Wilcoxon test). (C) Object-risk and action-risk decoding depended on individual neurons’ sensitivities for object risk and action risk. Linear regressions of decoding performance in pre-cue period from 5000 subsets of 20 randomly selected neurons on each subset’s mean single-neuron regression betas for object risk. (D) Decoding accuracy for specific subsets of neurons in pre-cue period. All: entire population of neurons. OR sig: significant object-risk neurons (N = 12). AR sig: significant action-risk neurons (N = 9). Rand: randomly selected neurons (mean ± s.e.m over 5000 randomly selected subsets of N = 20 neurons). (E) Decoding accuracy for object-risk decoding from trial subsets in which control variables were held constant. Left to right: decoding object-risk with constant object choice, action and cue position. Decoding was significant for all control variables and all task epochs (p<0.005, Wilcoxon test).
-
Figure 6—source data 1
- https://doi.org/10.7554/eLife.44838.023
Figure 7 with 2 supplements
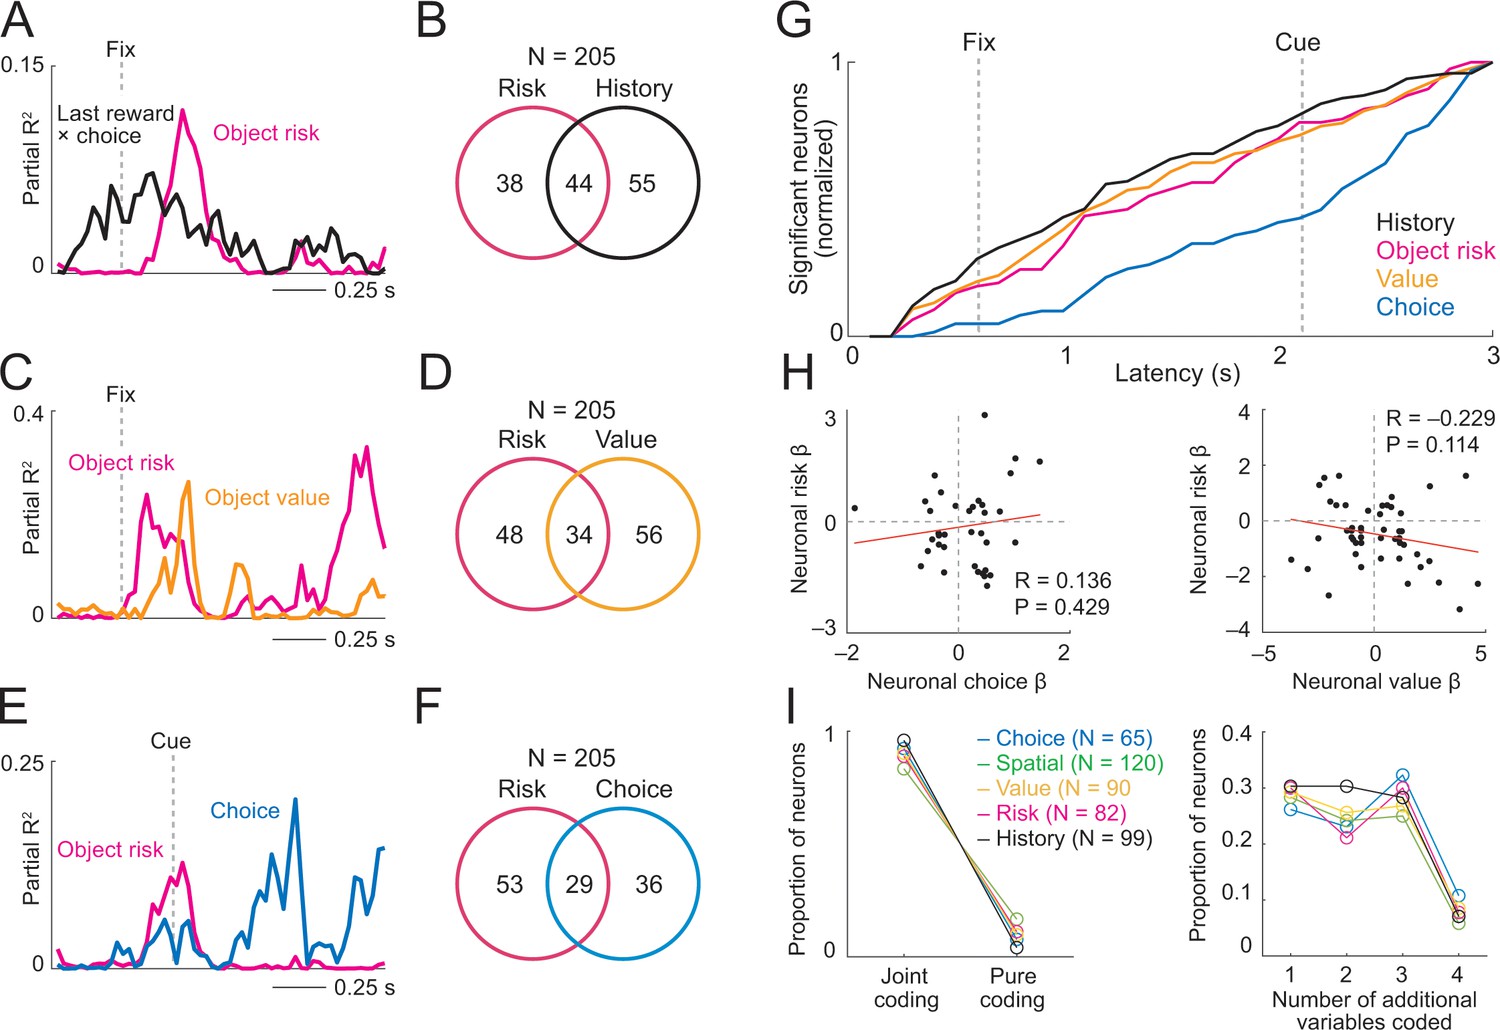
Prefrontal neurons dynamically code risk with other behaviorally important variables.
(A) Neuronal reward history-to-risk transition. A single DLPFC neuron with fixation-period activity that initially reflected whether reward was received from a particular choice on the last trial (‘Last reward × choice’) before reflecting current-trial object risk. Coefficients of partial determination (partial R2) obtained from sliding-window multiple regression analysis. The observed single-neuron transition from recent reward history to current object risk is consistent with the behavioral model in Figure 3C which constructs and updates object-risk estimates from reward experience. (B) Numbers of neurons with joint and separate coding of object risk and history variables that were relevant for risk updating (including last-trial reward, last-trial choice, last-trial reward × last trial choice). Numbers derived from sliding window analyses focused on early trial periods relevant to decision-making (trial start until 500 ms post-cue). (C) Neuronal value-to-risk integration. A single DLPFC neuron with fixation-period activity encoding both object risk and object value, compatible with the notion of integrating risk and object value into economic utility. (D) Number of neurons with joint and separate coding of risk and value. (E) Neuronal risk-to-choice transition. A single DLPFC neuron with activity encoding object risk before coding object choice, consistent with decision-making informed by risk. (F) Numbers of neurons with joint and separate coding of object risk and object choice. (G) Cumulative coding latencies of history variables, object risk, object value, and object choice. Latencies derived from sliding-window regression (first sliding window for which criterion for statistical significance was achieved, see Materials and methods; cumulative proportion of significant neurons normalized to maximum value for each variable). (H) Regression coefficients for neurons with joint risk coding and choice coding (left) and joint risk coding and value coding (right). (I) Proportion of neurons with joint coding and pure coding of specific task-related variables (left) and proportion of neurons coding different numbers of additional variables (right).
-
Figure 7—source data 1
- https://doi.org/10.7554/eLife.44838.029
Figure 7—figure supplement 1
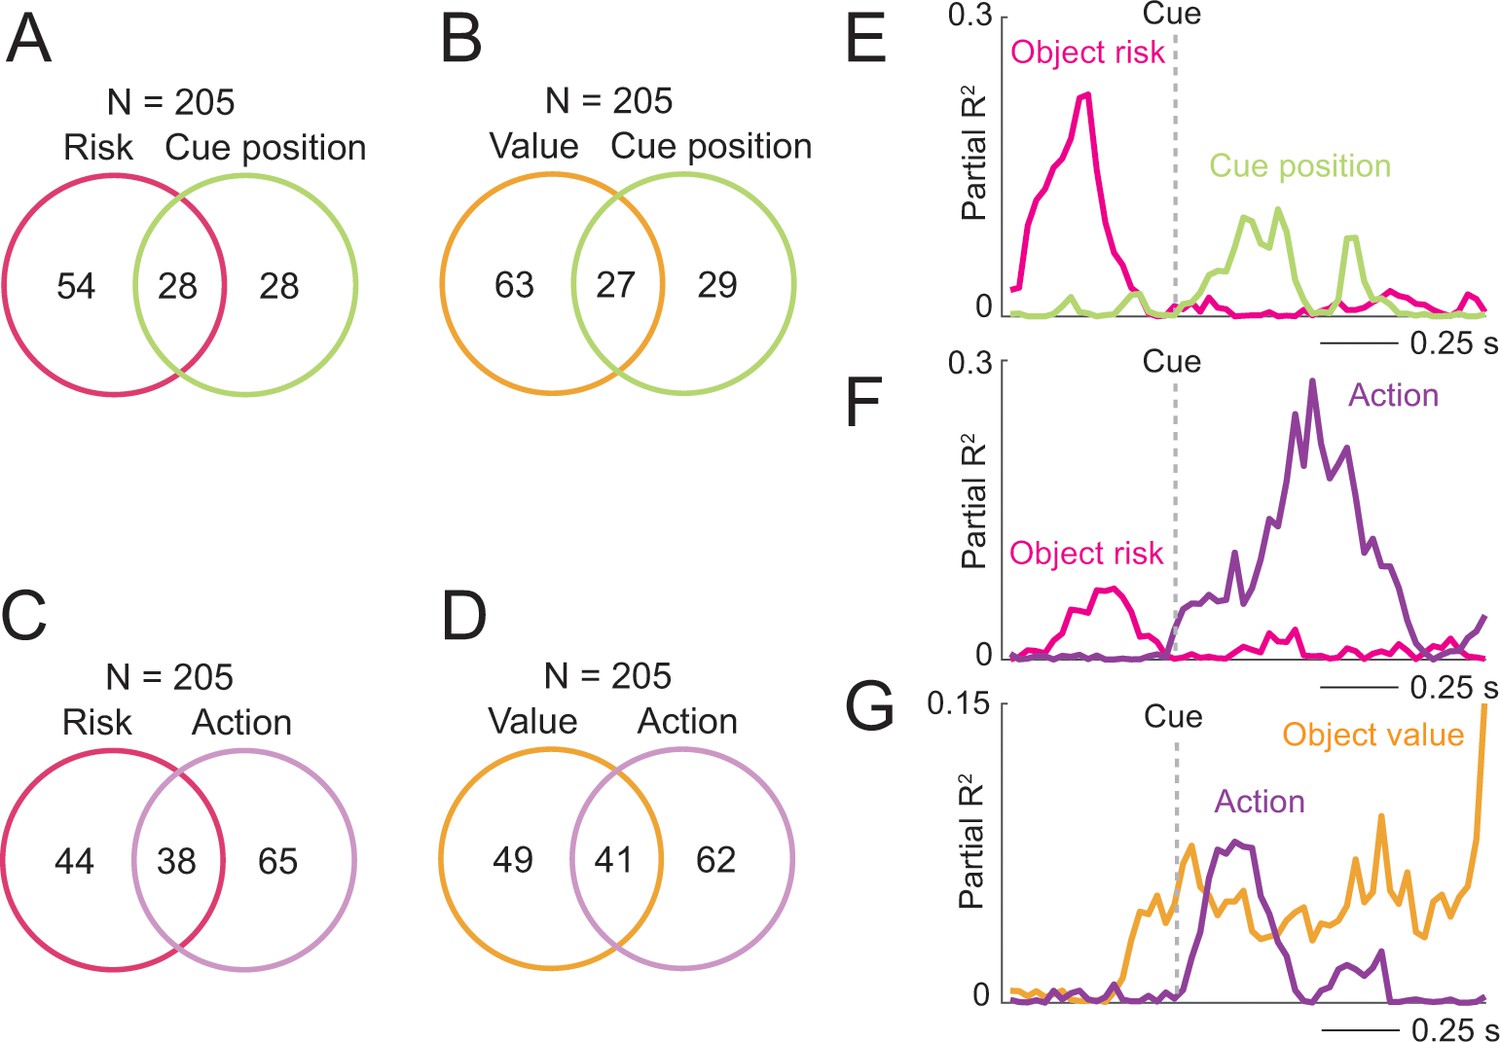
Coding of risk and value jointly with spatial variables.
(A) Numbers of neurons with joint and separate coding of object risk and left-right cue position. Numbers derived from sliding window analyses (Equation 11). (B) Numbers of neurons with joint and separate coding of object value and left-right cue position. (C) Numbers of neurons with joint and separate coding of object risk and left-right action. (D) Numbers of neurons with joint and separate coding of object value and left-right action. (E) Single neuron transitioning from pre-cue object-risk coding to cue-position coding. (F) Single neuron transitioning from pre-cue object-risk coding to action coding. (G) Single neuron transitioning from pre-cue object-value coding to action coding.
-
Figure 7—figure supplement 1—source data 1
- https://doi.org/10.7554/eLife.44838.026
Figure 7—figure supplement 2

Utility control.
(A) A single DLPFC neuron encoding the utility associated with object A at the time of choice (cue period). Utility was defined as the weighted linear combination of object value (based on reward history) and object risk, with weighting coefficients derived from individual animals’ choices (Figure 3E). (B) In a multiple regression, utility for object A explained a significant proportion of variance in impulse rate (p=0.025, t-test). (C) Categorization of coding utility for objects A or B, utility difference or utility sum based on the angle of coefficients. Red circle: neuron from A and B. (D) Percentages of utility-coding neuronal responses across all task epochs (based on multiple regression), calculated with respect to 1222 task-related responses from 205 neurons. (E) Population decoding of utility from unselected neurons. Decoding accuracy (% correct classification) for utility based on a linear support-vector-machine classifier (N = 161 neurons). Leave-one-out cross-validated decoding for utility was significantly above chance (gray line, decoding from shuffled data) in all task epochs (p<0.0001; Wilcoxon test). (F) Decoding performance increased with the number of neurons, late fixation period. Data for each neuron number show mean (± s.e.m) over 100 iterations of randomly selected neurons. (G) Relationship between neuronal utility decoding and individual neuron’s utility sensitivities. Linear regression of decoding performance from 5000 subsets of 20 randomly selected neurons on average utility sensitivity (single-neuron utility regression slope).
-
Figure 7—figure supplement 2—source data 1
- https://doi.org/10.7554/eLife.44838.028
Tables
Table 1
Comparison of different models fitted to the animals’ choices.
Best fitting model indicated in bold.
| Model | Description | Both animals | Animal A | Animal B | |||
|---|---|---|---|---|---|---|---|
| AIC | BIC | AIC | BIC | AIC | BIC | ||
| (1) | Value from reward history1 | 2.2482 | 2.2490 | 1.5077 | 1.5084 | 7.3571 | 7.3636 |
| (2) | Value from reward history and risk2 | 2.2477 | 2.2492 | 1.5077 | 1.5092 | 7.3522 | 7.3653 |
| (3) | Value from choice history3 | 2.1614 | 2.1622 | 1.4900 | 1.4907 | 6.5043 | 6.5109 |
| (4) | Value from choice history and risk | 2.0385 | 2.0400 | 1.4023 | 1.4037 | 7.3528 | 7.3660 |
| (5) | Value from reward and choice history4 | 2.0089 | 2.0097 | 1.3914 | 1.3922 | 6.0880 | 6.0945 |
| (6) | Value from reward and choice history and risk | 2.0073 | 2.0088 | 1.3899 | 1.3914 | 6.0747 | 6.0878 |
| (7) | Objective reward probabilities5 | 2.1213 | 2.1220 | 1.4615 | 1.4622 | 6.4972 | 6.5037 |
| (8) | Objective reward probabilities and objective risk6 | 2.1210 | 2.1225 | 1.4616 | 1.4631 | 6.4982 | 6.5114 |
| (9) | Reinforcement learning (RL) model7 | 2.0763 | 2.0779 | 1.4376 | 1.4391 | 6.2161 | 6.2293 |
| (10) | RL learning, stack parameter (Huh et al., 2009)8 | 2.0810 | 2.0826 | 1.4374 | 1.4389 | 6.3198 | 6.3330 |
| (11) | RL, reversal-learning variant9 | 2.2614 | 2.2630 | 1.5330 | 1.5344 | 7.2808 | 7.2939 |
-
1:Value defined according to Equation 6; 2: Risk defined according to Equation 8; 3: Value defined as sum of weighted choice history derived from Equation 5; 4: Value defined according to Equation 7; 5: Objective reward probabilities defined according to Equation 1; 6: Objective reward risk defined according to Equation 2; 7: Standard Rescorla-Wagner RL model updating value of chosen option based on last outcome; 8: Modified RL model incorporating choice-dependency; 9: Modified RL model updating value of chosen and unchosen option based on last outcome.
Additional files
-
Transparent reporting form
- https://doi.org/10.7554/eLife.44838.030
Download links
A two-part list of links to download the article, or parts of the article, in various formats.
Downloads (link to download the article as PDF)
Open citations (links to open the citations from this article in various online reference manager services)
Cite this article (links to download the citations from this article in formats compatible with various reference manager tools)
Primate prefrontal neurons signal economic risk derived from the statistics of recent reward experience
eLife 8:e44838.
https://doi.org/10.7554/eLife.44838


