GABA neurons in the ventral tegmental area regulate non-rapid eye movement sleep in mice
- Nagoya University, Japan
- CREST, JST, Honcho Kawaguchi, Japan
- Japan Society for the Promotion of Science, Japan
- Niigata University, Japan
- Okayama University, Japan
Figures
Figure 1 with 1 supplement
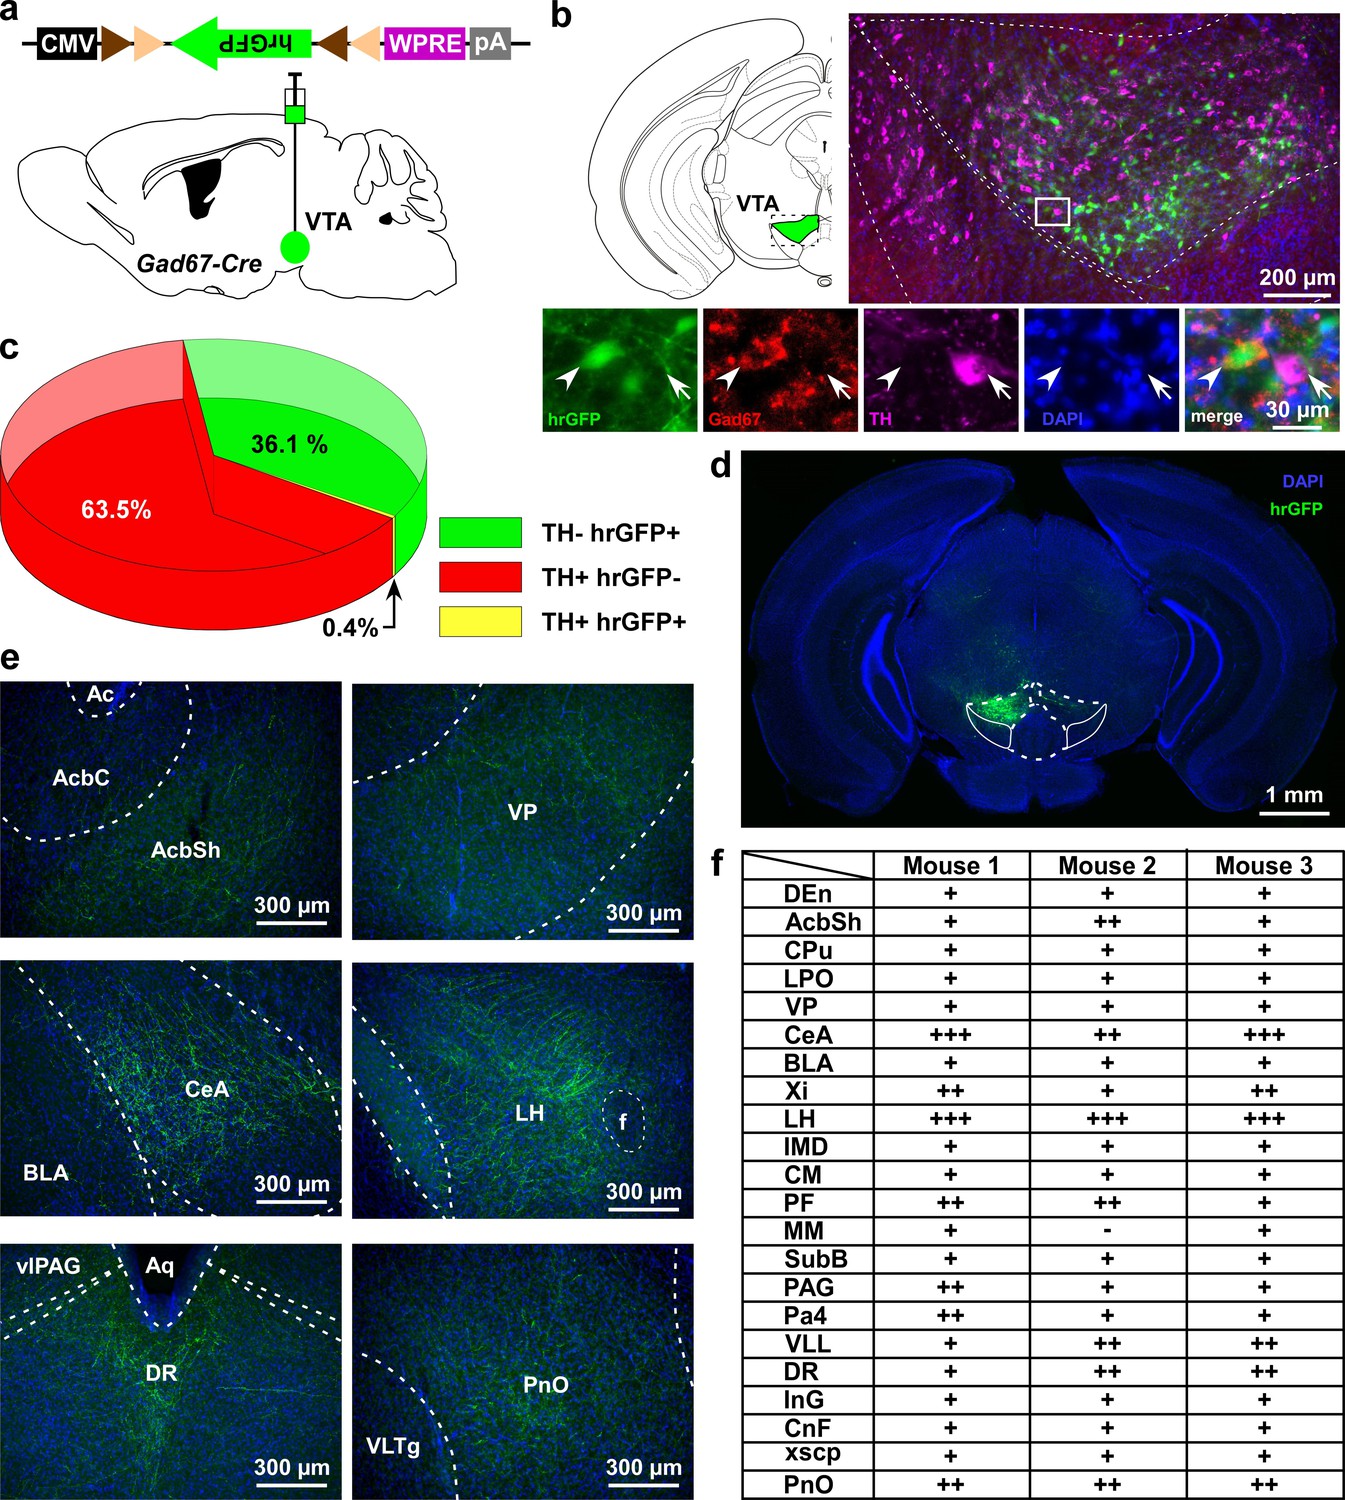
VTAGad67+ neurons project to multiple areas in the brain.
(a) Schematic of AAV injection to express Cre-inducible hrGFP in Gad67-Cre mice. The dotted brain map area is shown to the right. White rectangular area is shown below. (b) Immunohistochemical studies showing expression of hrGFP in Gad67+ neurons (arrowhead), but not in the nearby DA (arrow) neurons. (c) Pie chart showing the percent of hrGFP expression in DA and non-DA neurons in the VTA (n = 4 mice). (d and e) Expression of hrGFP in VTAGad67+ neurons and some of their projected brain areas are shown. (f) Table showing the comparative scoring of hrGFP signals across different brain areas. Abbreviations- AcbC: Nucleus accumbens core, AcbSh: Nucleus accumbens shell, BLA: Basolateral amygdala, CeA: Central nucleus of the amygdala, CM: Central medial thalamic nucleus, CnF: Cuneiform nucleus, CPu: Caudate putamen (striatum), DEn: Dorsal endopiriform nucleus, DR: Dorsal raphe nucleus, IMD: Intermediodorsal thalamic nucleus, InG: Intermediate gray layer of the superior colliculus, LH: Lateral hypothalamus, LPO: Lateral preoptic area, MM: Medial mammillary nucleus, Pa4: Paratrochlear nucleus, PAG: Periaqueductal gray, PF: Parafascicular thalamic nucleus, PnO: Pontine reticular nucleus, SubB: Subbrachial nucleus, VLL: Ventral nucleus of the lateral lemniscus, VP: Ventral pallidum, Xi: Xiphoid thalamic nucleus and xscp: Decussation of the superior cerebellar peduncles. DAPI (4′,6-diamidino-2-phenylindole) staining was used to label nuclear DNA and also to assist understanding of the anatomical position of VTAGad67+ neuronal projections.
-
Figure 1—source data 1
Source data for Figure 1c.
- https://doi.org/10.7554/eLife.44928.005
Figure 1—figure supplement 1
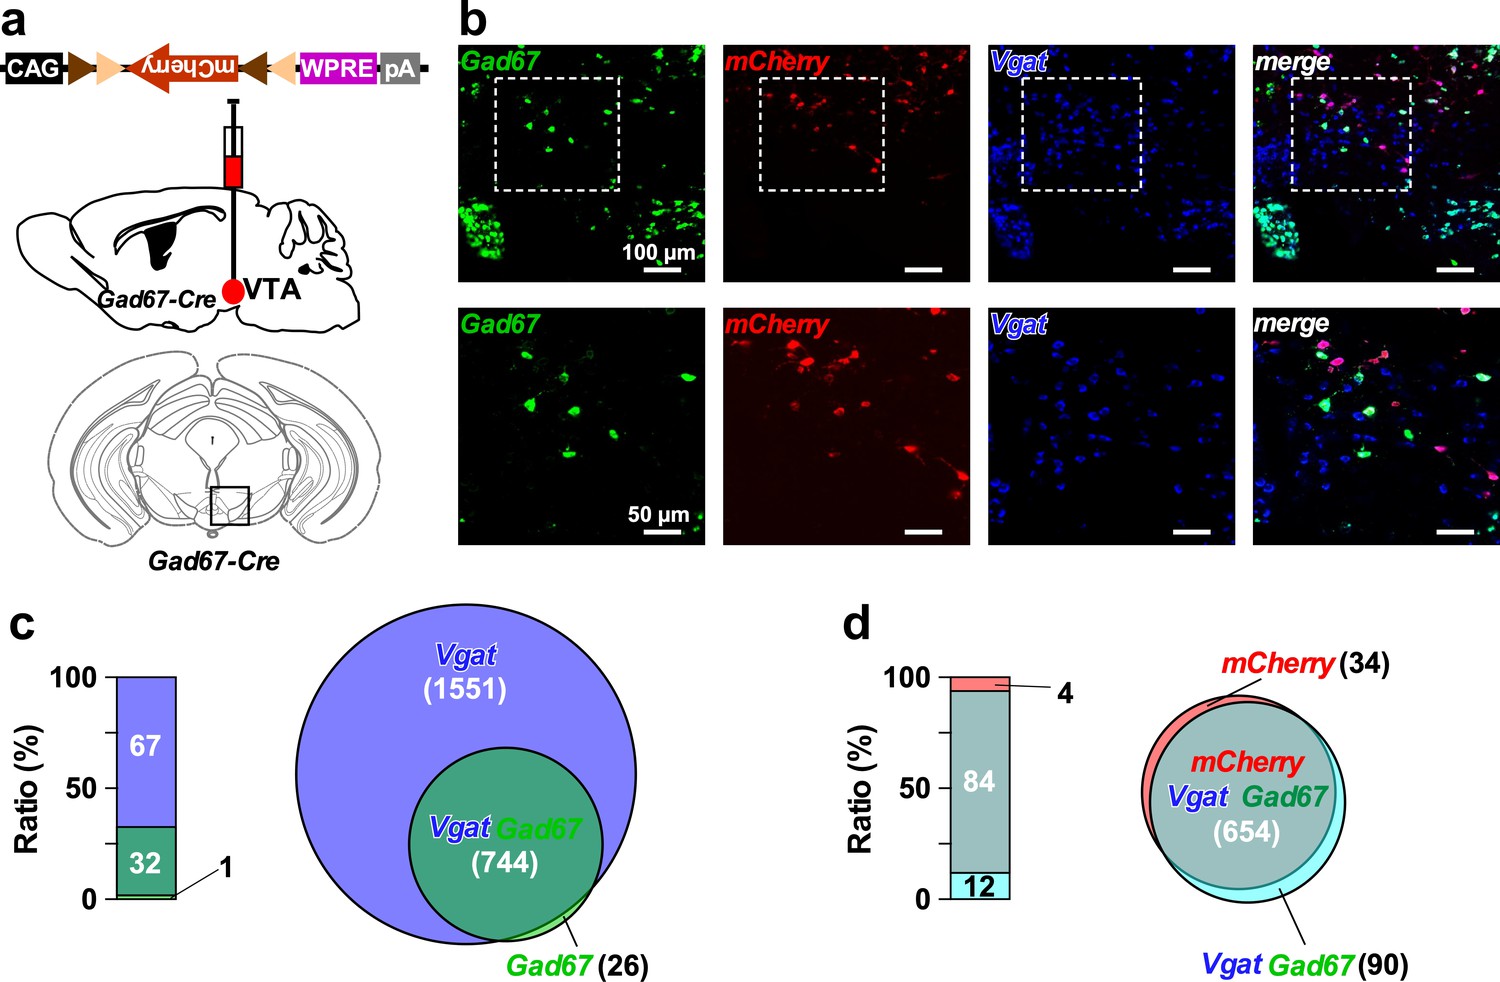
Gad67+ neurons represent a sub-population of GABAergic neurons in the VTA.
(a) Schematic of AAV micro-injection to express mCherry in VTAGad67+ neurons in Gad67-Cre mice. (b) Confocal images showing multiplex fluorescence detection by using probes against Gad67, mCherry, and Vgat mRNA. Dotted rectangular area in the upper panels are enlarged in the lower panels. (c) Bar and venn diagram showing the percent of Gad67+ neurons co-expressing Vgat. (d) Bar and venn diagram showing the percent of Gad67+ and Vgat+ neurons co-expressing mCherry (n = 4 mice). Numbers in the parenthesis indicate total number of neurons counted in all animals. Data are represented as mean ± SEM.
-
Figure 1—figure supplement 1—source data 1
Source data for Figure 1—figure supplement 1c and d.
- https://doi.org/10.7554/eLife.44928.004
Figure 2 with 2 supplements
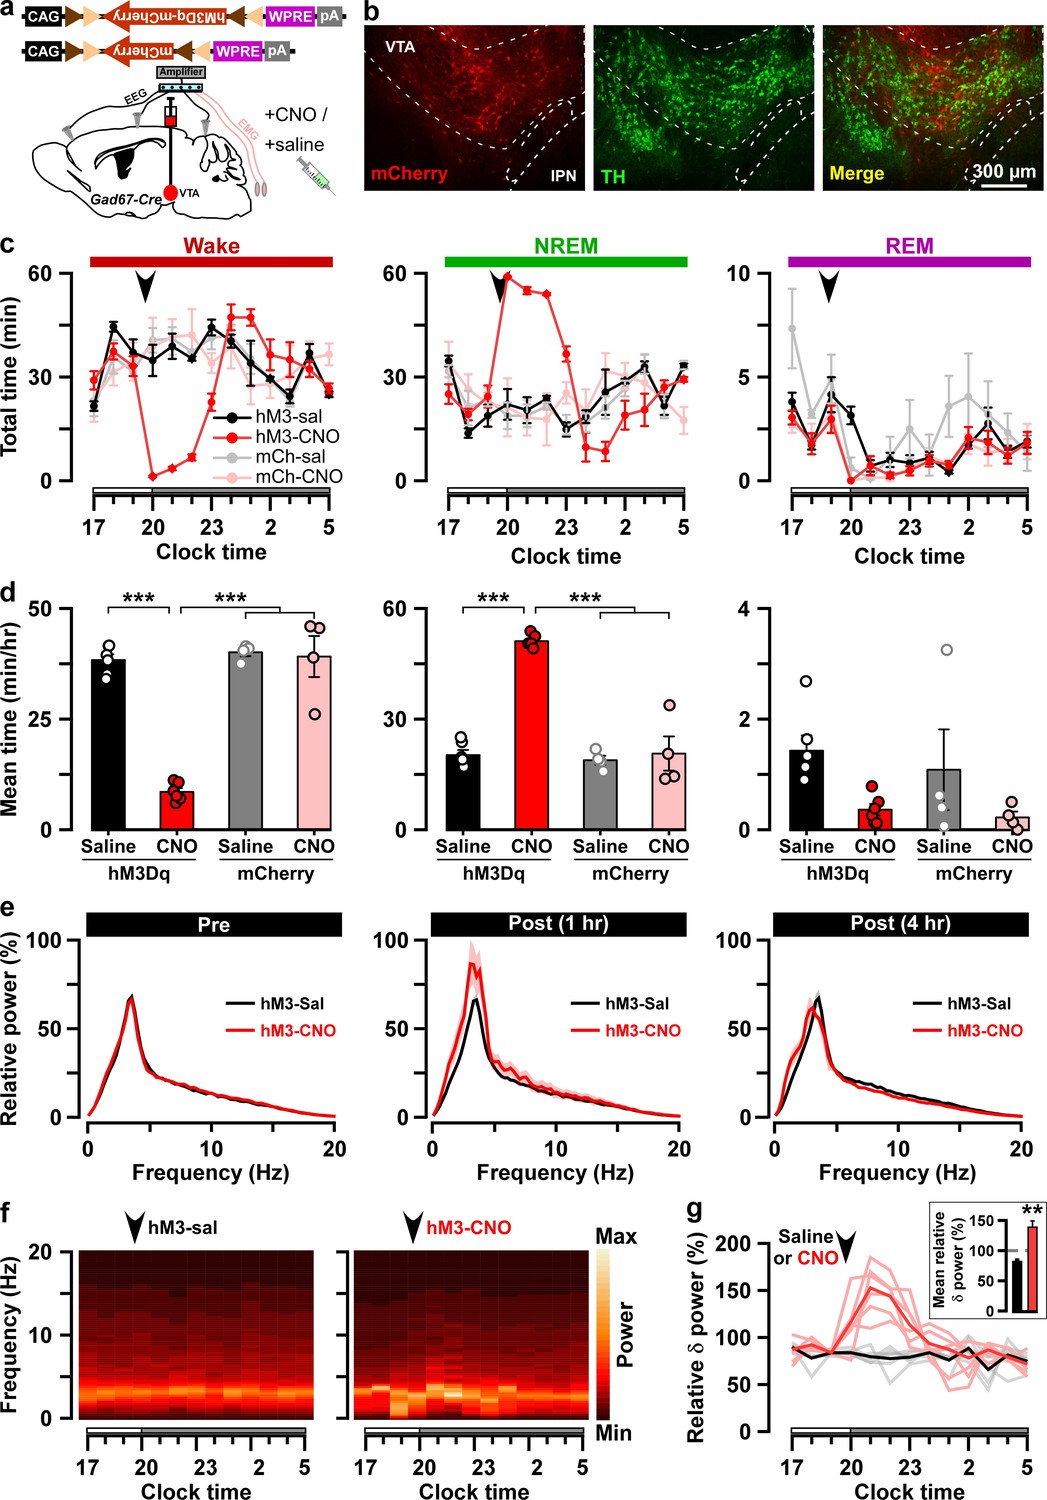
Chemogenetic activation of VTAGad67+ neurons induced long-lasting NREM sleep.
(a) Schematic of Cre-inducible expression of either hM3Dq-mCherry or mCherry in VTAGad67+ neurons. (b) Immunohistochemical confirmation of hM3Dq-mCherry expression in VTA non-DA neurons. (c) Time spent in each vigilance state before and after i.p. administration of either saline or CNO. Arrowhead indicates timing of injection (just before the dark period; hM3Dq: n = 6 mice; mCherry: n = 4 mice). White and gray bars above the x-axis indicate light and dark periods, respectively. (d) 4 hr average time spent in each vigilance state after i.p. administration. (e) Relative power of fast Fourier transformation (FFT) analysis of NREM sleep for hM3Dq-expressing saline and CNO groups before (pre: left) and after (1 hr post: middle, 4 hr post: right) i.p. administration. (f) Heatmap showing a trace indicating that delta wave power activity increases after CNO administration compared to the saline control. (g) Summary of the delta wave power change during NREM sleep after saline or CNO injection. Traces in dark color indicate mean value, while lighter color indicates EEG spectrum of each mice injected with saline (black) and CNO (red). Inset shows the mean relative delta power for 4 hr after either saline or CNO administration. Data are shown as the mean ± SEM (hM3Dq: n = 6 mice; mCherry: n = 4 mice). *p<0.05, ***p<0.001, (d) two-way ANOVA followed by Tukey post hoc, (e) two-tailed paired Student’s t-test (n = 8 mice).
-
Figure 2—source data 1
Source data for Figure 2c-e and 2g.
- https://doi.org/10.7554/eLife.44928.012
Figure 2—figure supplement 1
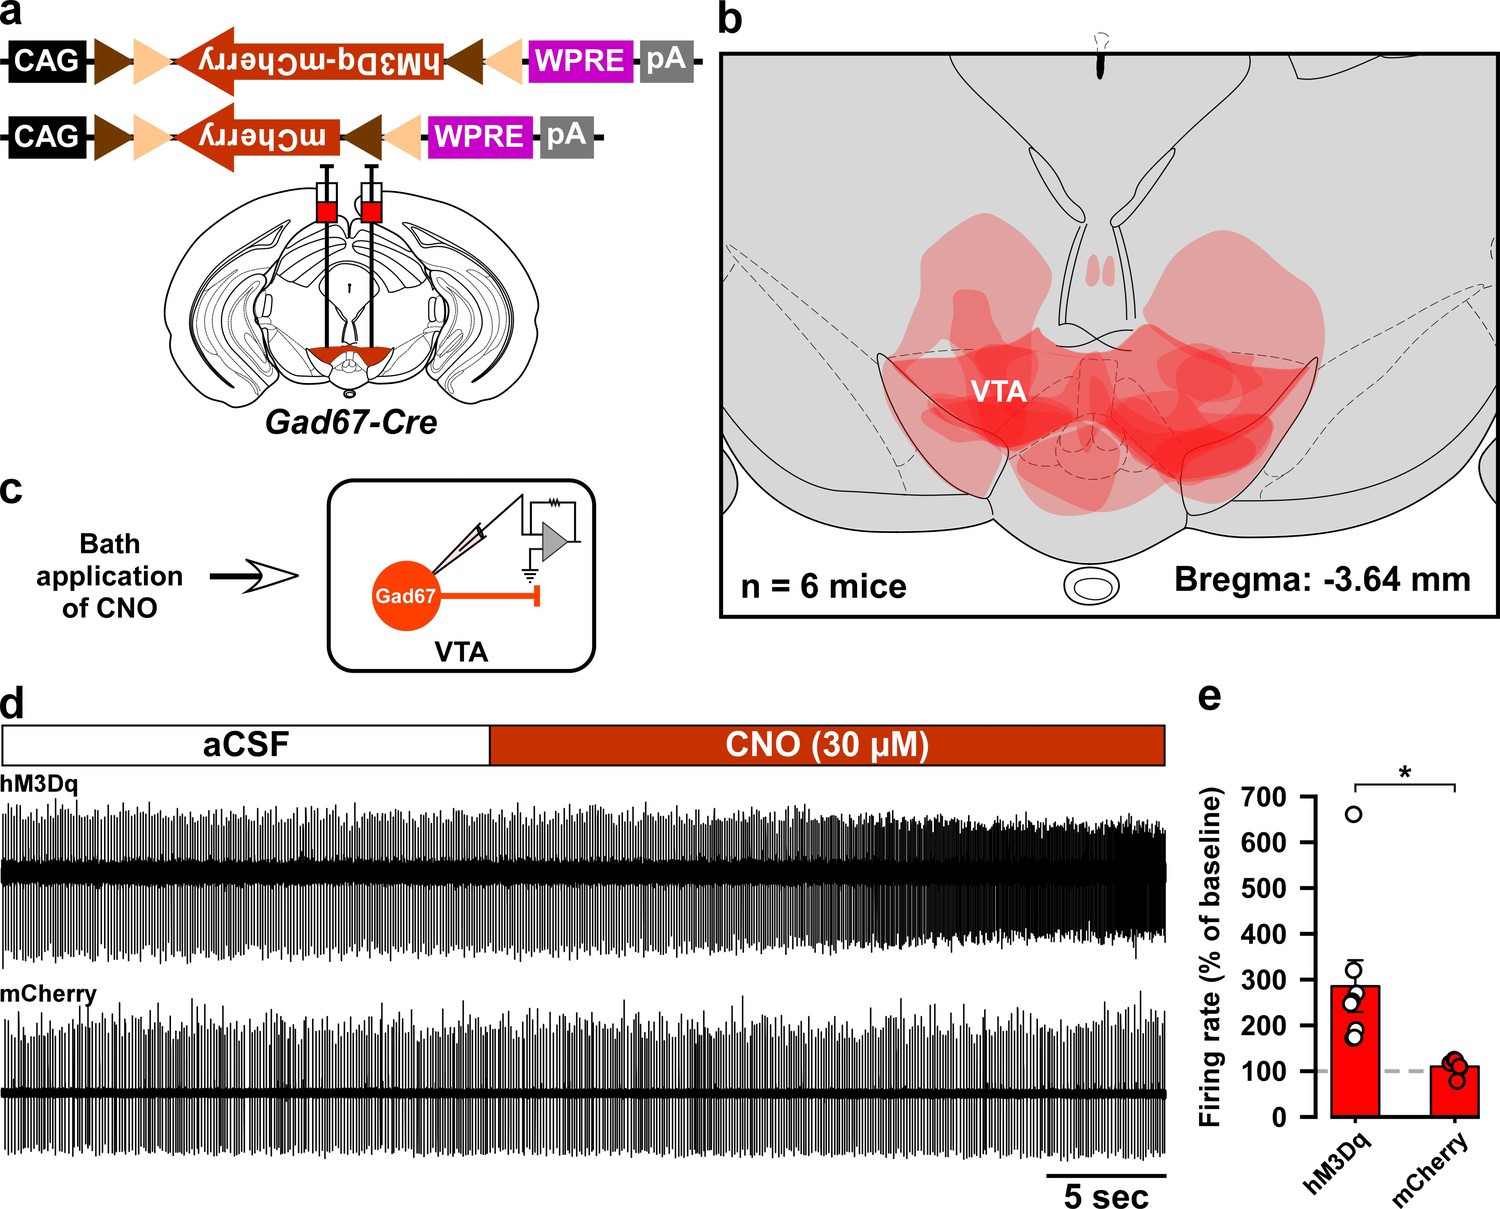
Histological and electrophysiological confirmation of the expression region and function of hM3Dq in the Gad67-Cre mice used in Figure 2.
(a) Schematic of Cre-mediated expression of either hM3Dq-mCherry or mCherry alone in Gad67-Cre mice. (b) Histological verification and reconstruction of hM3Dq-mCherry expressing areas in mice used in Figure 2. (c) Schematic of patch clamp recording from hM3Dq-mCherry- or mCherry-expressing neurons in the VTA while applying CNO through the bath solution. (d) Traces showing CNO-induced increases in firing of VTAGad67+ neurons expressing hM3Dq-mCherry, but not of neurons expressing mCherry alone. (e) Summary of experiment in (d) showing firing rate as a percent of baseline (average for 5 s before CNO application). CNO was applied at a concentration of 30 µM (hM3Dq: n = 8 cells and mCherry: n = 6 cells, p=0.02, two-tailed unpaired Student’s t-test). Data are represented as mean ± SEM.
-
Figure 2—figure supplement 1—source data 1
Source data for Figure 2—figure supplement 1e.
- https://doi.org/10.7554/eLife.44928.009
Figure 2—figure supplement 2
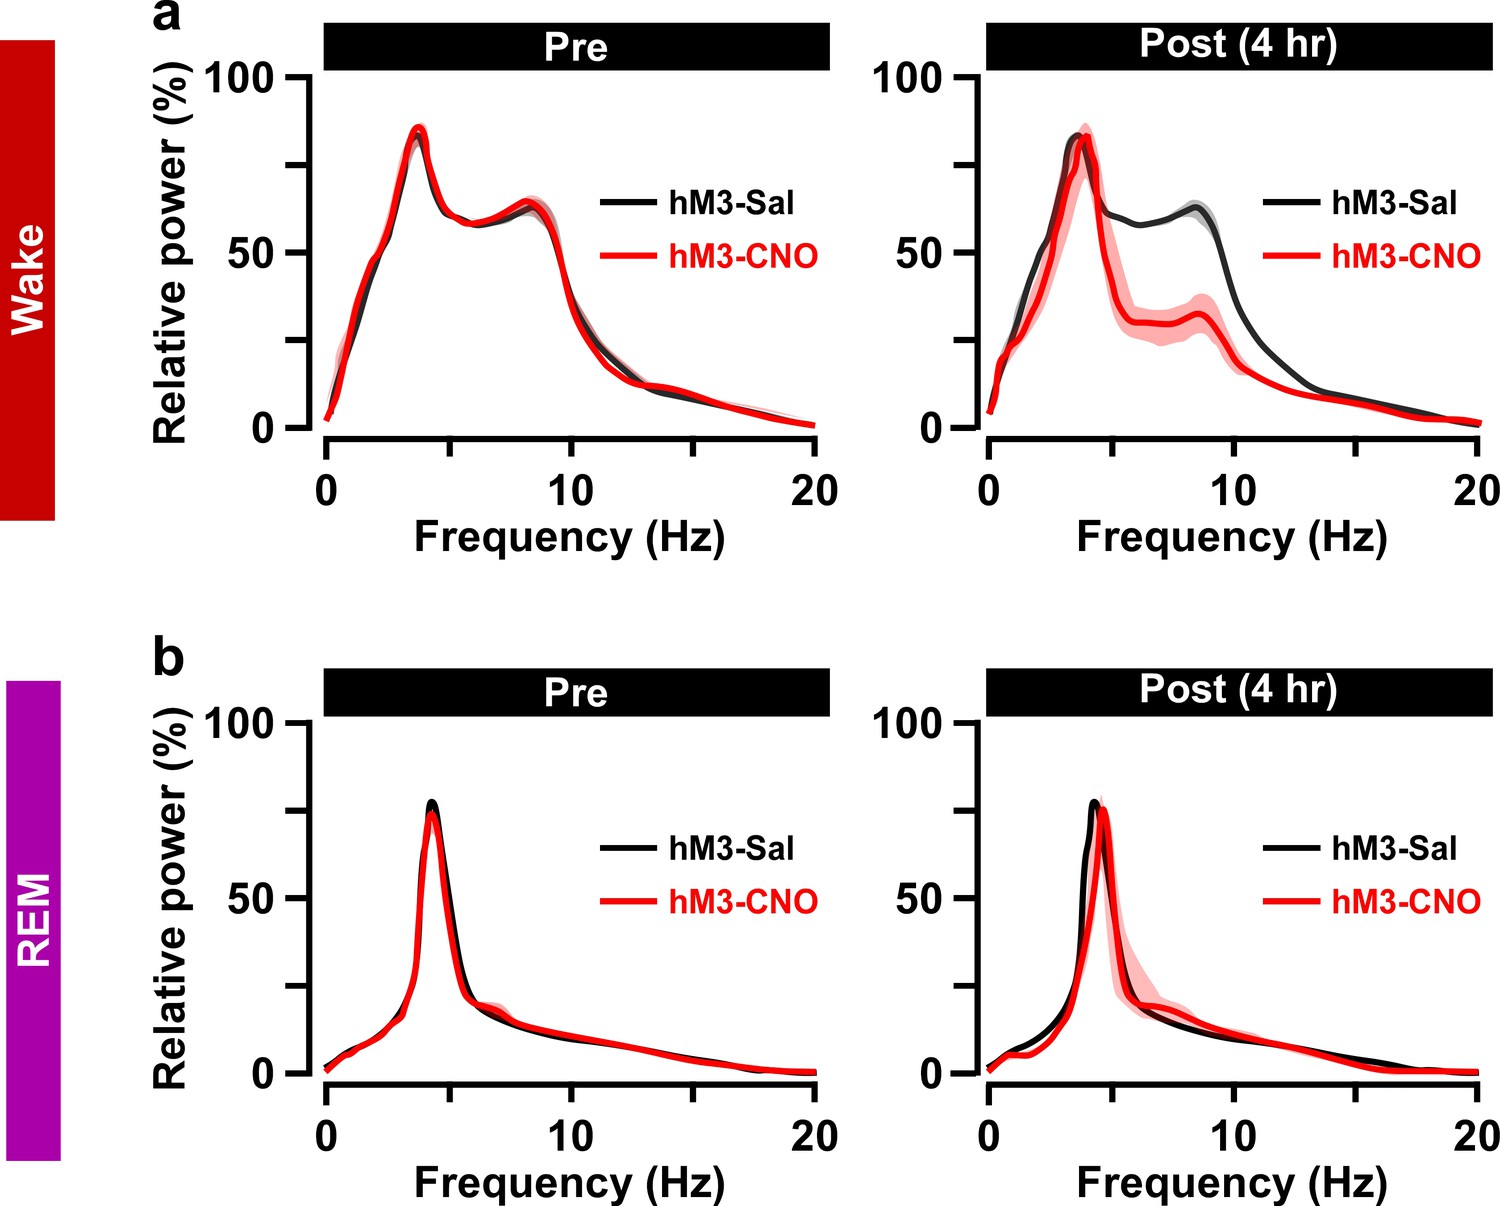
Relative power of FFT analysis during Wake and REM sleep for hM3Dq-expressing saline and CNO groups.
(a and b) Power spectra before (pre: left) and after 4 hr (post (4 hr): right) i.p. administration is shown. Note that during the wake period at 4 hr post-CNO injection mice display an EEG power spectrum with lower theta power, presumably because pharmacological activation lasts up to 4 hr after i.p. administration.
-
Figure 2—figure supplement 2—source data 1
Source data for Figure 2—figure supplement 2a and b.
- https://doi.org/10.7554/eLife.44928.011
Figure 3 with 1 supplement
Optogenetic inhibition of VTAGad67+ neurons induced wakefulness from NREM sleep, but not from REM sleep.
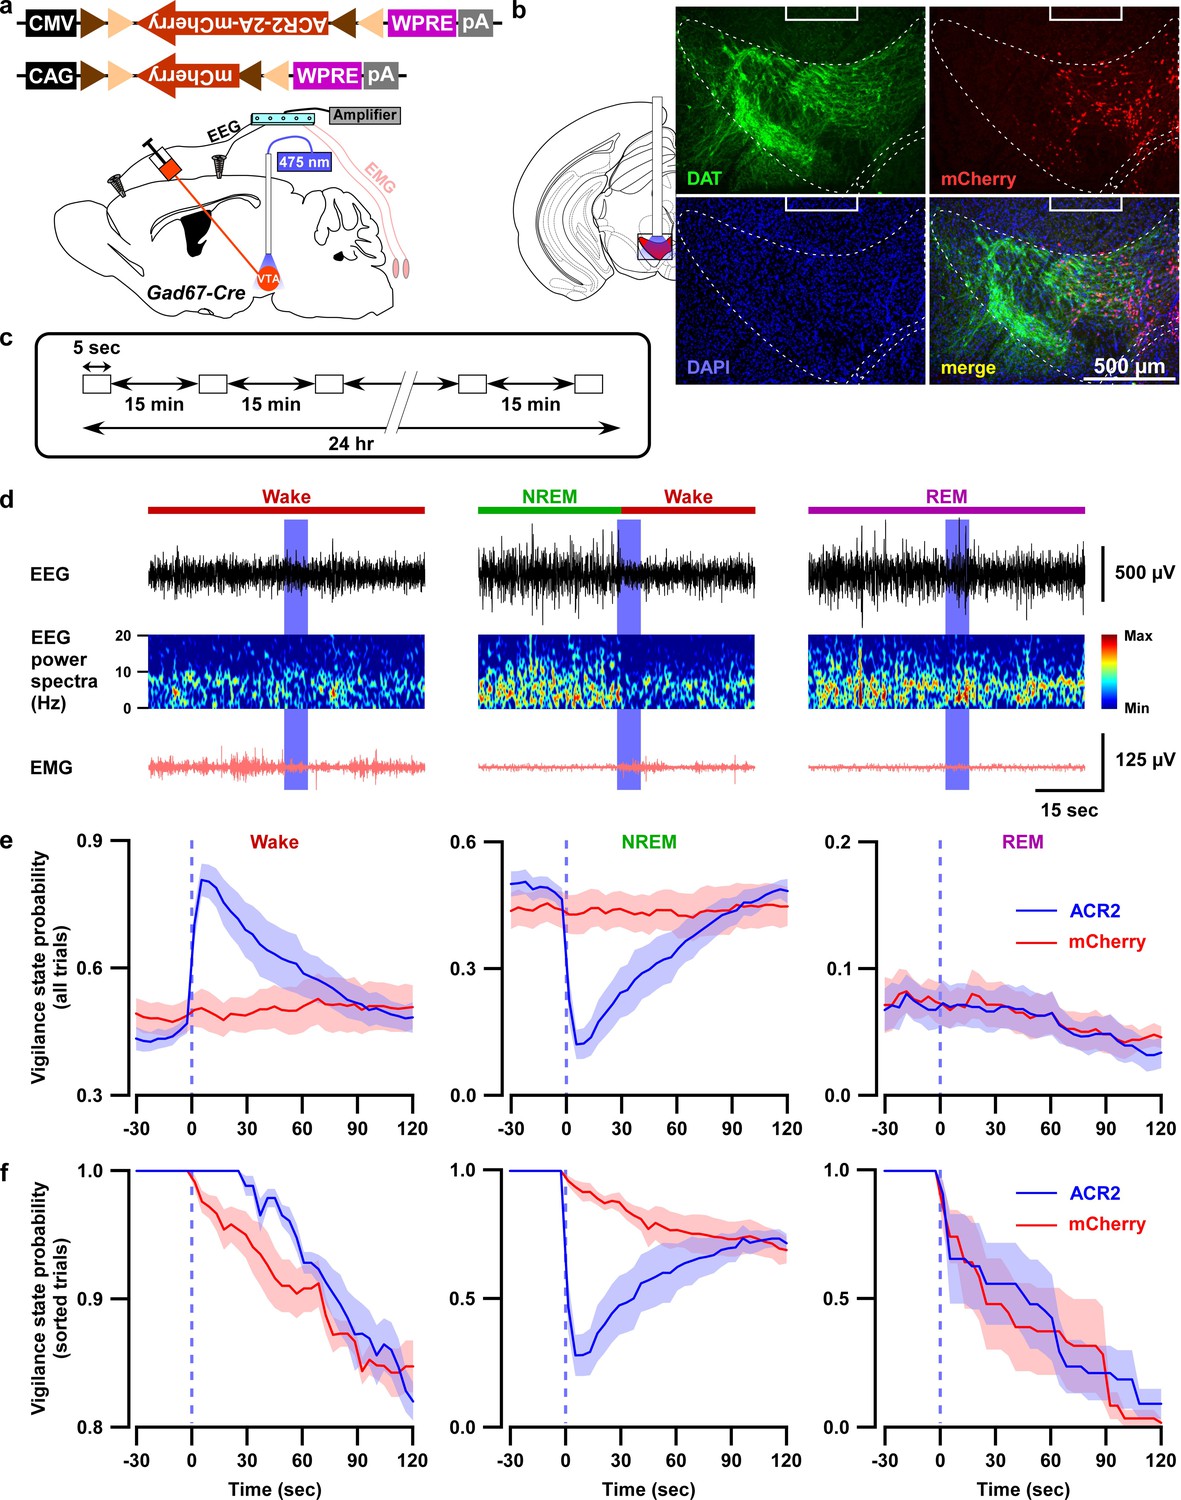
(a) Schematic of surgery showing Gad67-Cre mice expressing either ACR2-2A-mCherry or mCherry alone that were subjected to implantation of fiber optics and EEG-EMG electrodes. (b) Schematic of fiber optic implantation (left). Pictures indicate position of tip of fiber optics and ACR2-2A-mCherry expression and DAT-positive neurons in the VTA. (c) Schematic of protocol for light stimulation in optogenetic inhibition experiments. (d) Representative traces showing EEG, EEG power spectra, and EMG during optogenetic inhibition in different vigilance states (wake, NREM, and REM sleep). Vigilance states are indicated by colored bars above the EEG traces. (e) Probability of vigilance state before and after light illumination in all recorded trials of ACR2-2A-mCherry or mCherry-alone expressing mice. Blue and red lines indicate mean probability of each vigilance state, ACR2-2A-mCherry (n = 6 mice) and mCherry (n = 5 mice). (f) Light illumination during wakefulness, NREM, or REM sleep was isolated from subfigure e (ACR2-2A-mCherry = 6 mice; and mCherry = 5 mice). Each vigilance state lasted for at least 30 s before light illumination was isolated. SEM is indicated as the lighter color band.
-
Figure 3—source data 1
Source data for Figure 3e and 3f.
- https://doi.org/10.7554/eLife.44928.016
Figure 3—figure supplement 1
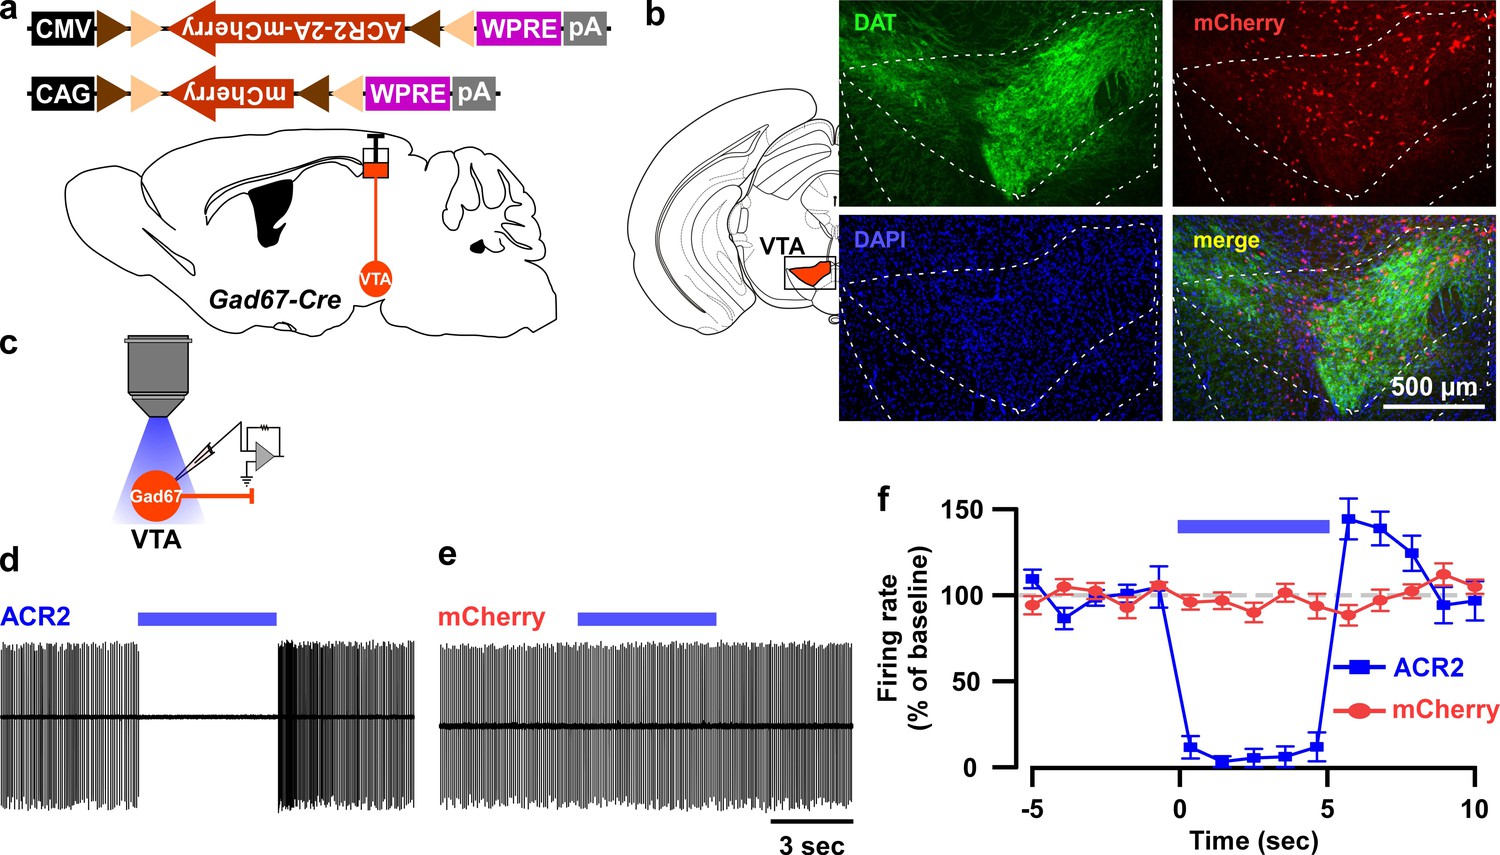
In vitro confirmation of ACR2-mediated optogenetic inhibition of VTAGad67+ neurons.
(a) Schematic of Cre-inducible expression of either ACR2 (AAV(9)-CMV-FLEX-ACR2-2A-mCherry, 300 nl each side, 6.2 × 10¹² copies/ml) or mCherry (AAV(9)-CAG-FLEX-mCherry, 300 nl each side, 1.9 × 10¹² copies/ml) in VTAGad67+ neurons. (b) Immunohistochemical confirmation that ACR2-2A-mCherry-positive Gad67+ neurons are not co-expressing the dopamine transporter (DAT, expressed by DA neurons in the VTA). (c) Schematic of recordings from ACR2-2A-mCherry or mCherry-expressing VTAGad67+ neurons. (d and e) Traces showing firing in a loose cell-attached mode from VTAGad67+ neurons expressing either ACR2-2A-mCherry (d) or mCherry alone (e). (f) Summary of experiment in (d) and (e), showing the firing rate as a percent of baseline (average for 5 s before illumination). Blue light of 6.8 mW/mm2 was illuminated for 5 s (ACR2: n = 10 and mCherry: n = 7). Data are represented as mean ± SEM.
-
Figure 3—figure supplement 1—source data 1
Source data for Figure 3—figure supplement 1f.
- https://doi.org/10.7554/eLife.44928.015
Figure 4
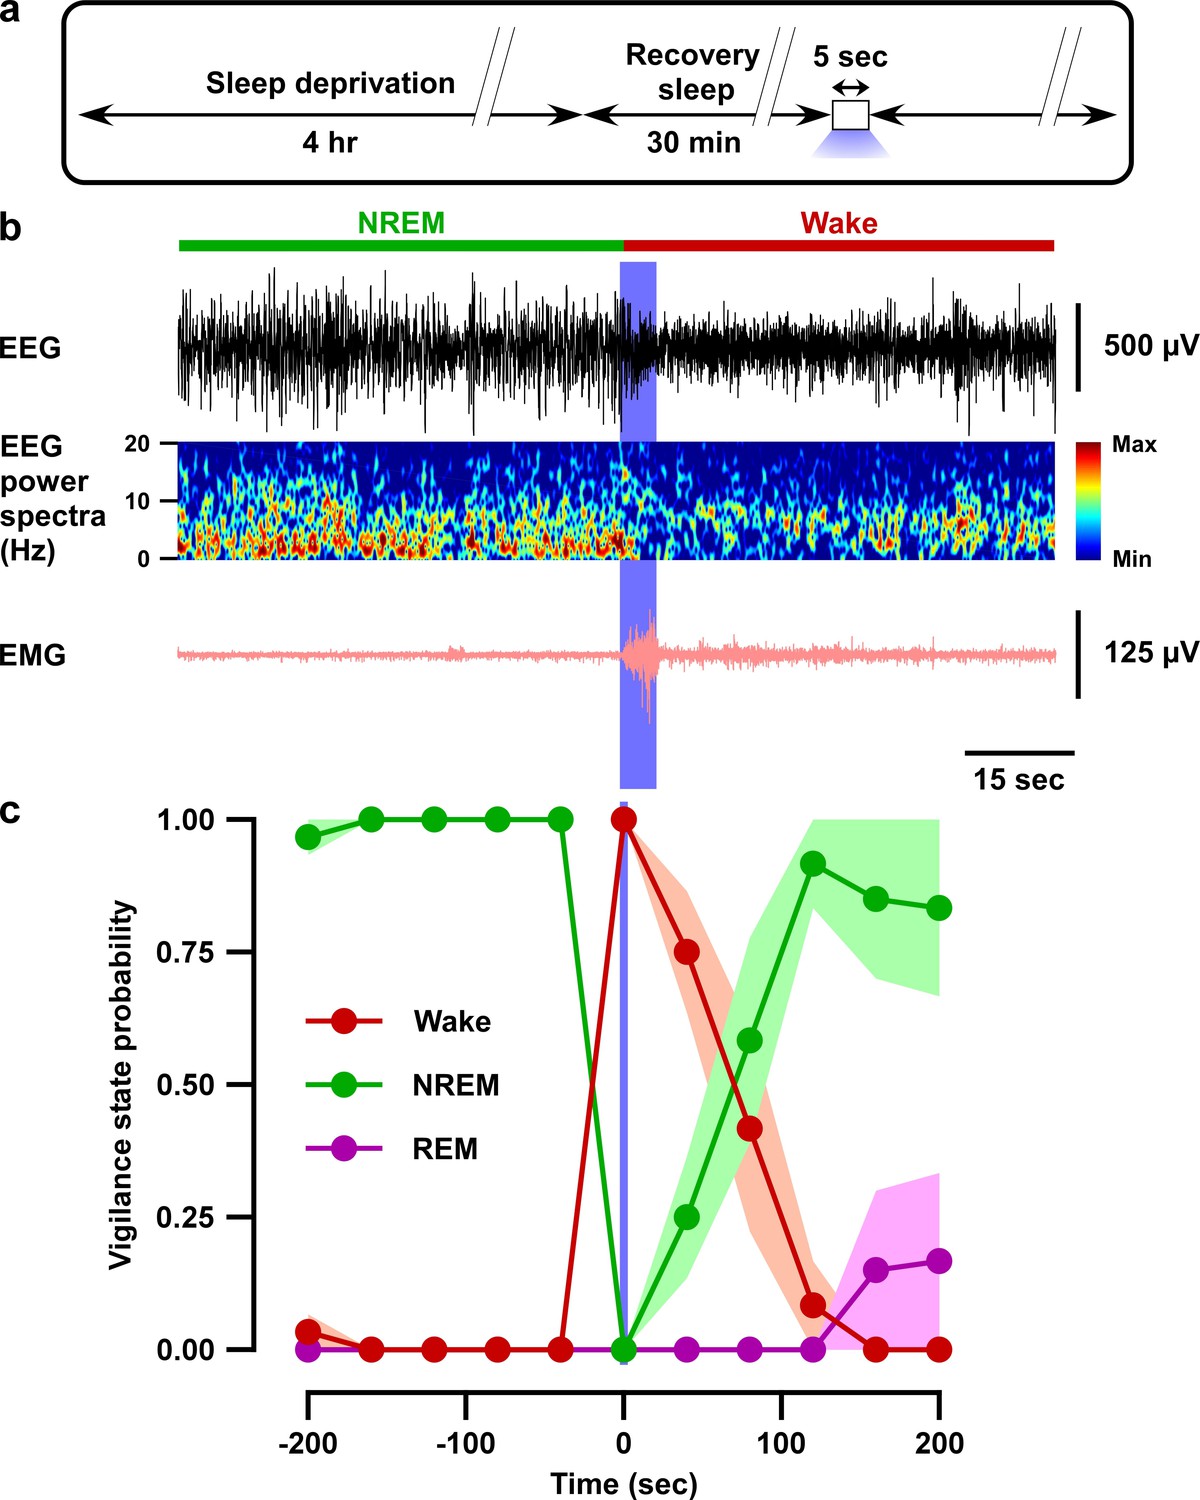
Optogenetic inhibition of VTAGad67+ neurons induced wakefulness even under conditions of high homeostatic sleep pressure.
(a) Schematic of the protocol of the experiment. (b) EEG, EEG power spectra, and EMG before and after optogenetic inhibition during recovery sleep after 4 hr sleep deprivation. (c) Summary of the experiment in (a) showing the probability of each vigilance state before and after blue light illumination. Colored circles and lines indicate mean probability of each vigilance state and shaded area indicates SEM (ACR2-2A-mCherry: n = 6 mice and mCherry alone: n = 5 mice).
-
Figure 4—source data 1
Source data for Figure 4c.
- https://doi.org/10.7554/eLife.44928.019
Figure 5 with 2 supplements
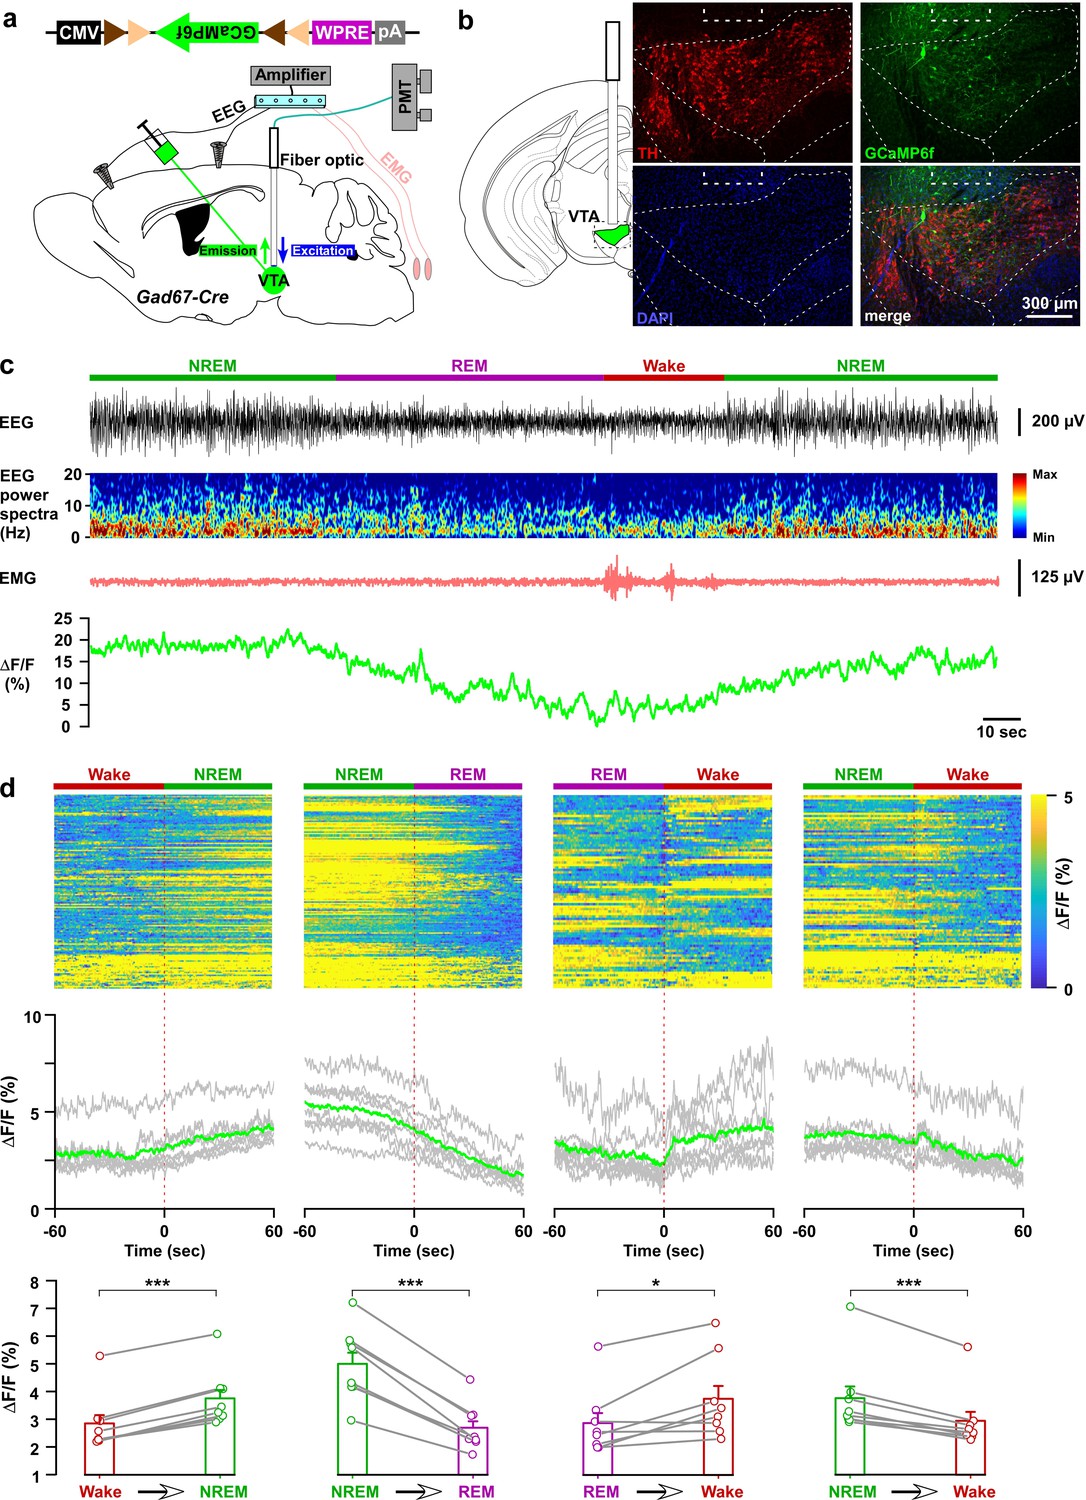
In vivo activity recordings of VTAGad67+ neurons using fiber photometry.
(a) Schematic of GCaMP6f expression in VTAGad67+ neurons and position of fiber optics. Gad67-Cre mice expressing GCaMP6f were subjected to implantation of guide cannula, EEG, and EMG electrodes. PMT indicates photomultiplier tube. (b) Immunohistochemical studies confirmed that GCaMP6f expression was in the TH-negative cells in the VTA. (c) Representative traces of EEG, EEG spectra, EMG, and fluorescent intensity from GCaMP6f (represented as ΔF/F) in a trial having all different states. Vigilance states were determined by EEG and EMG signals and indicated by colored bars. (d) Fluorescent intensity alterations in each trial 60 s before and after vigilance state changes. Upper panel shows the heat map of all separated transitions. Middle panel represents the changes in the intensity of calcium signals represented as ΔF/F. Gray lines indicate average intensities in individual mice and the green line indicates the mean of all mice. Lower panel indicates the average intensity separated for specific vigilance states. Data are represented as mean ± SEM. ***, p<0.001; *, p<0.05. Two-tailed paired Student’s t-test (n = 8 mice).
-
Figure 5—source data 1
Source data for Figure 5d.
- https://doi.org/10.7554/eLife.44928.024
Figure 5—figure supplement 1
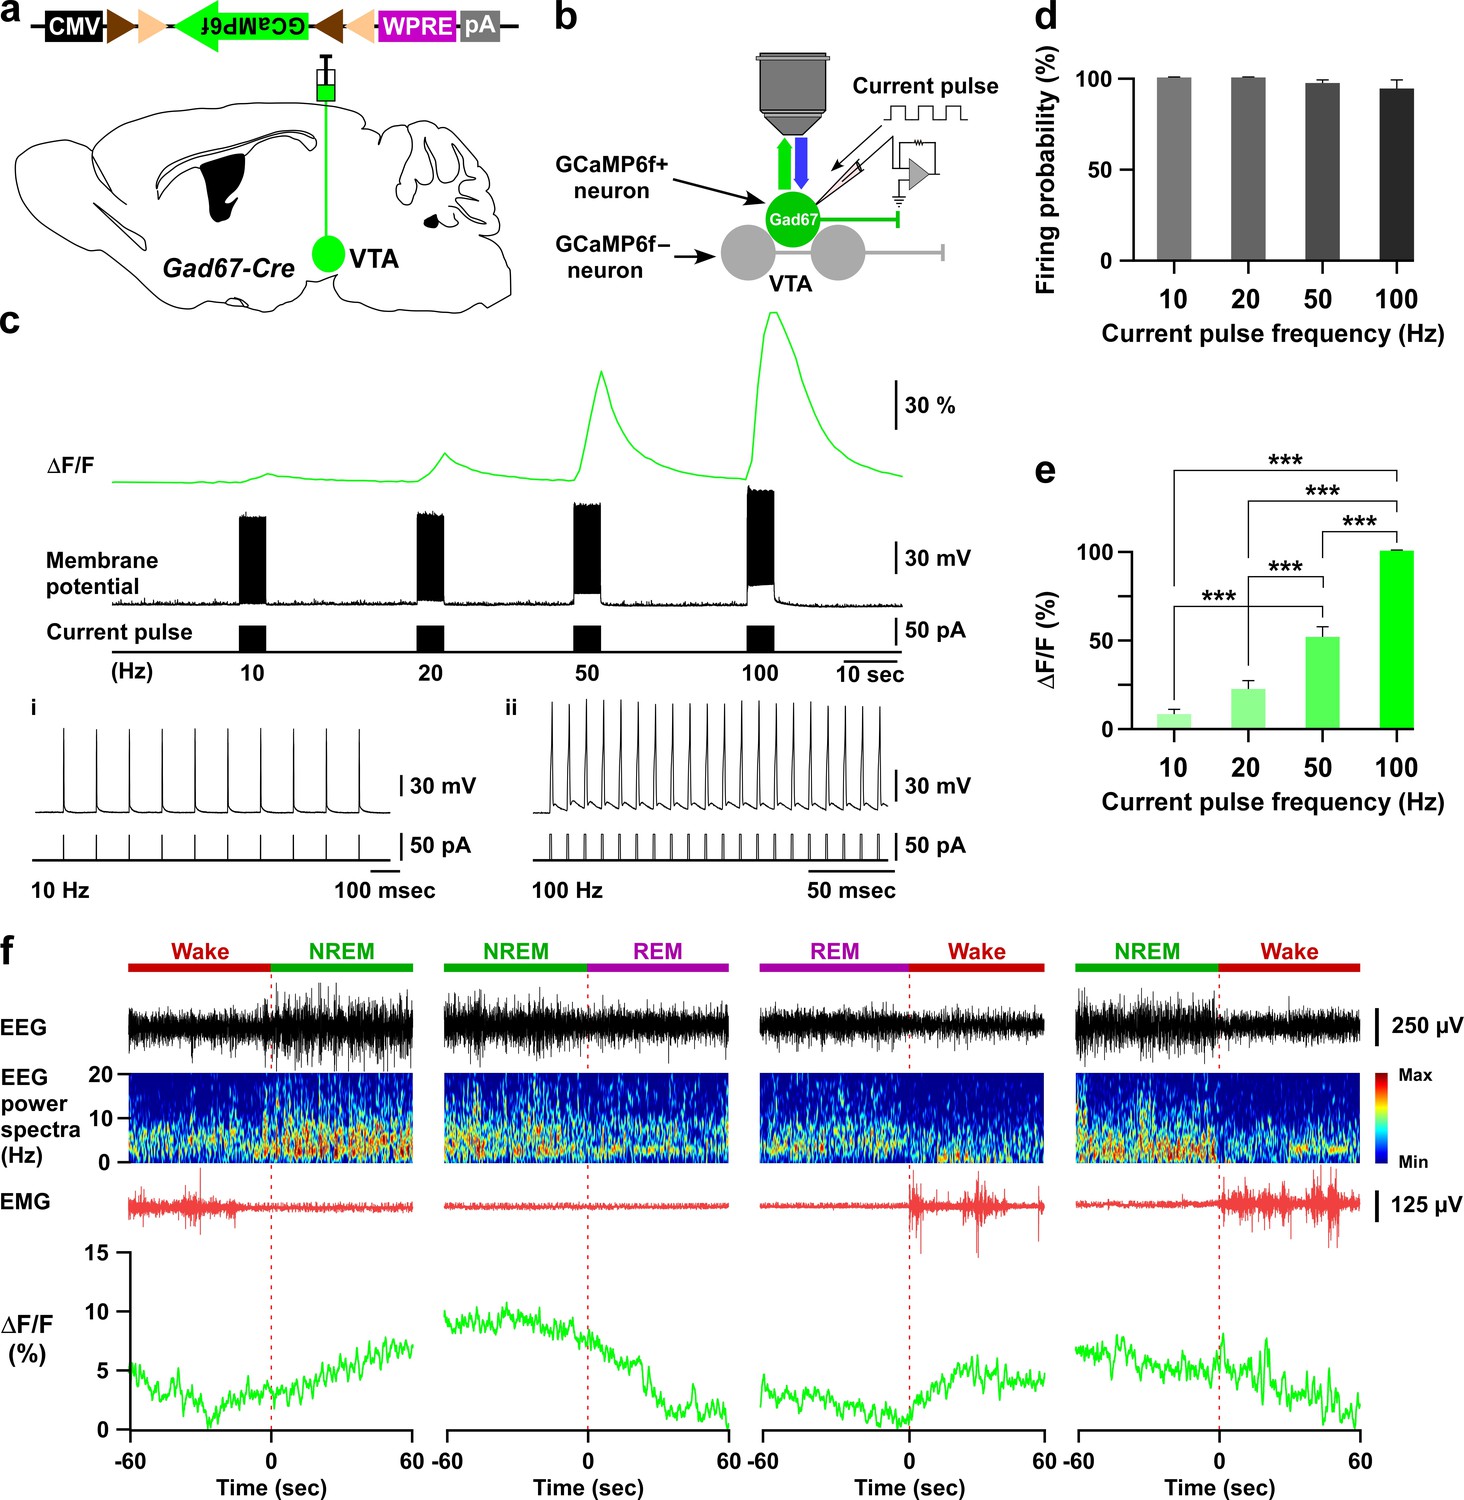
GCaMP6f-mediated recordings of VTAGad67+ neuronal activity both in vitro and in vivo.
(a and b) Schematic of Cre-inducible expression of GCaMP6f in VTAGad67+ neurons (a), and simultaneous recording of membrane potential by electrophysiology and changes in intracellular calcium concentration by calcium imaging from GCaMP6f-expressing VTAGad67+ neurons (b) in brain slice using Gad67-Cre mice. (c) Representative traces showing the correlation between the action potential frequency (middle trace) and the increase in calcium concentration intensity (ΔF/F, upper trace). Action potentials were generated by injecting depolarizing current (~50 pA, lower trace) through the recording pipette at 10 Hz, 20 Hz, 50 Hz, and 100 Hz, while the ΔF/F was simultaneously measured from the same VTAGad67+ neuron. i and ii show 10 and 100 Hz current-induced action potentials. (d, e) Summarized data showing induced firing probability (d) and normalized ΔF/F (e) of VTAGad67+ neurons from the experiment in (c) (n = 13 cells, p=0.13 (10 vs 20 Hz), p=2.5e-8 (10 vs 50 Hz), p=1.0e-4 (20 vs 50 Hz), p=0 (10 vs 100, 20 vs 100 and 50 vs 100 Hz), one-way ANOVA followed by post hoc Tukey test). Data are represented as mean ± SEM. (f) Traces showing four different types of vigilance state transitions (Wake to NREM, NREM to REM, REM to Wake, and NREM to wake) with corresonding EEG, EEG power spectra, EMG and calcium fluorescence (ΔF/F) recorded by fiber photometry in a Gad67-Cre mice expressing GCaMP6f. Note that the highest fluorescence (ΔF/F) was observed during the NREM sleep and the lowest during REM sleep.
-
Figure 5—figure supplement 1—source data 1
Source data for Figure 5—figure supplement 1d and e.
- https://doi.org/10.7554/eLife.44928.022
Figure 5—figure supplement 2
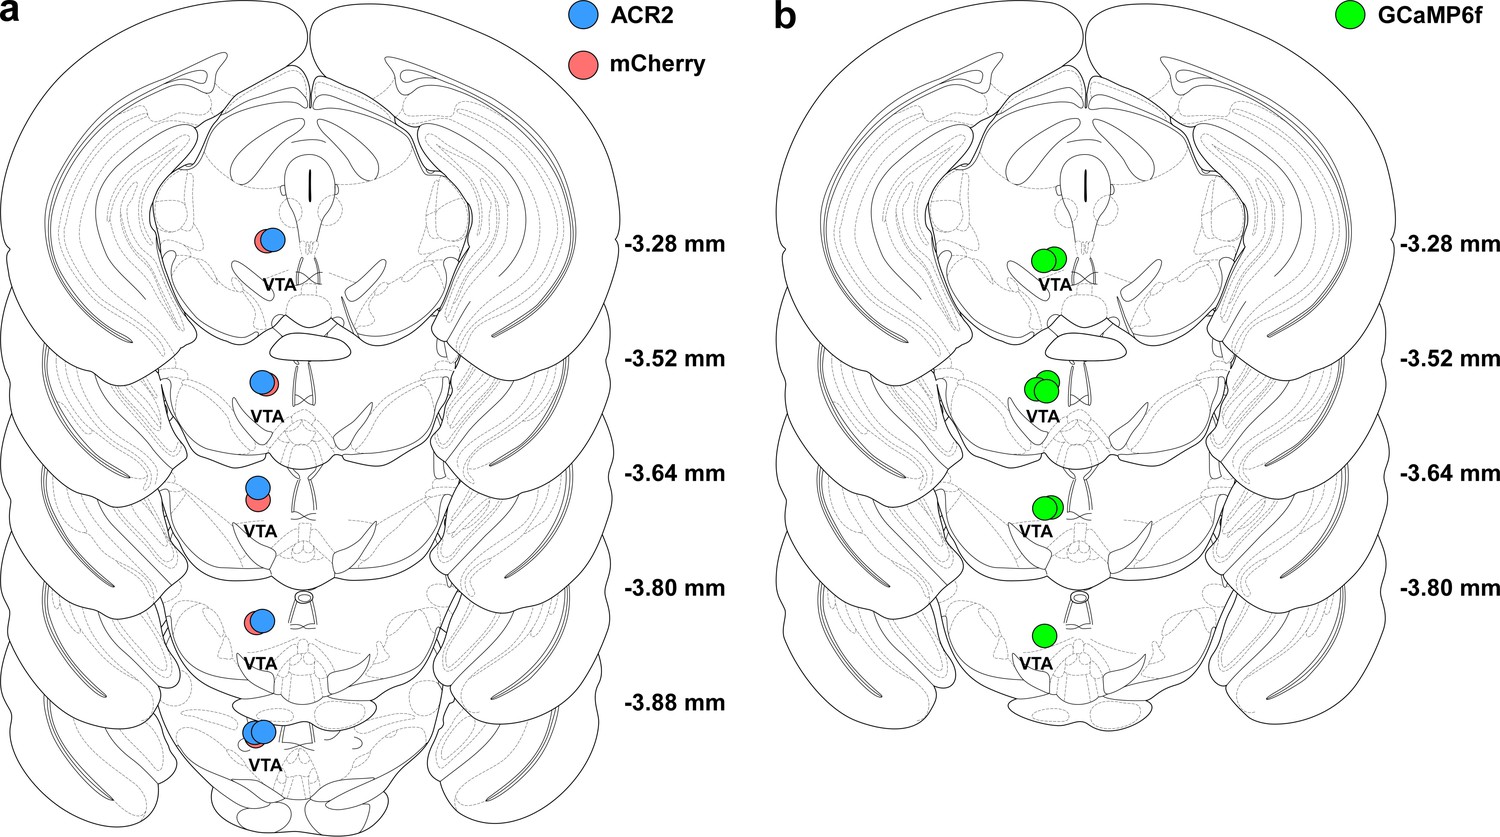
Histological verification of tip of fiber optics in mice used in behavioral experiments.
(a) Location of tip of optical fibers in all mice injected with either ACR2-2a-mCherry (n = 6 mice, blue circles) or mCherry alone (n = 5 mice, red circles). (b) Same as in a, but for GCaMP6f-expressing mice (n = 6 mice, green circles).
Figure 6 with 1 supplement
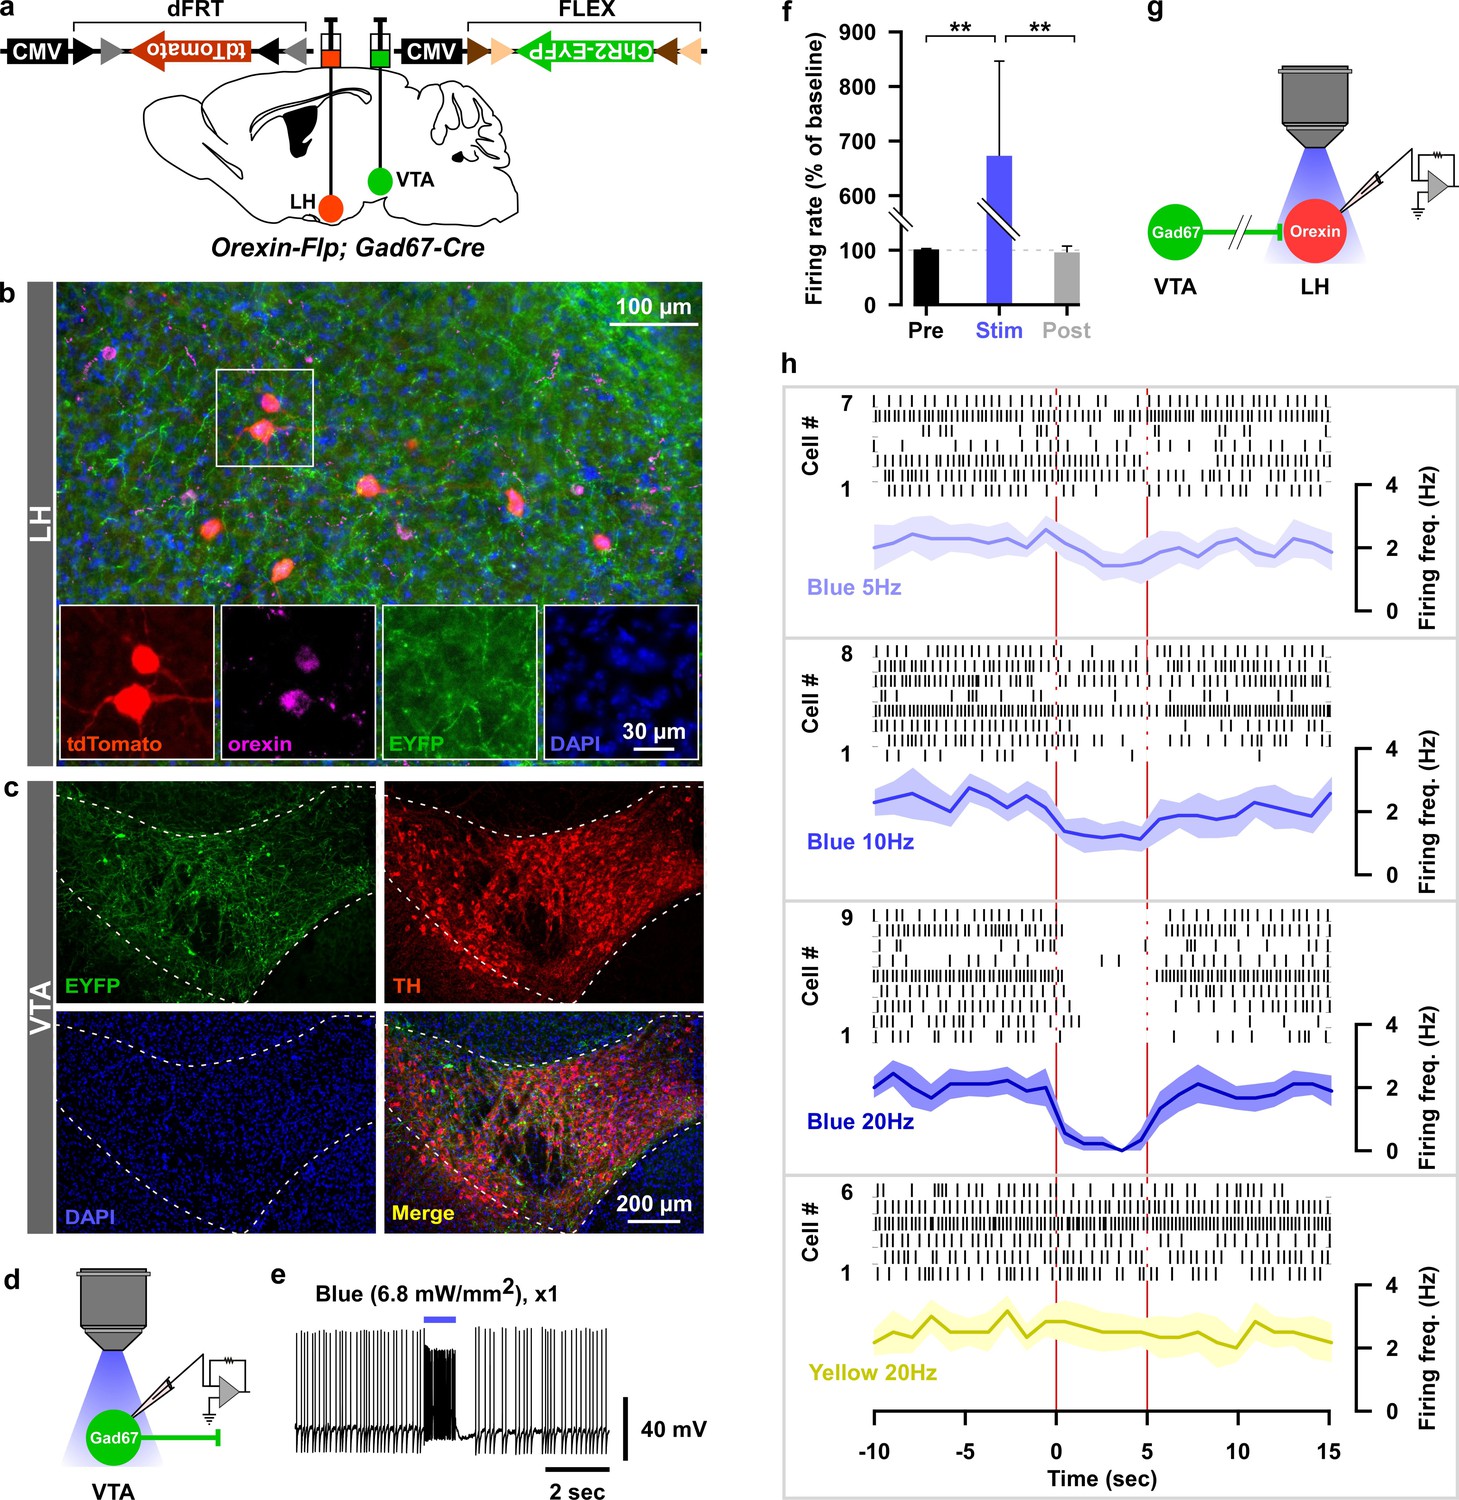
Optogenetic activation of VTAGad67+ neuronal terminals in the LH inhibited orexin neurons in vitro.
(a) AAV-mediated gene expression in orexin-Flp; Gad67-Cre bigenic mice. (b and c) Immunohistochemical studies confirmed expression of tdTomato exclusively in orexin neurons and ChR2 in non-TH-positive neurons in the VTA. (d–f) Schematic and current clamp recordings from ChR2-expressing Gad67+ neurons in the VTA in acute brain slices. Blue light stimulation of 6.8 mW/mm2 increased the firing up to 674 ± 174% (n = 5 cells, p=0.004 vs both pre and post, one-way ANOVA followed by Tukey post hoc tests). (g) Schematic of the experiments in (h). (h) Firing of LHorexin neurons in vitro and effect of activation of VTAGad67+ neuronal terminals using different frequencies of blue lights (5, 10, or 20 Hz). Yellow light of 20 Hz was used as a negative control. Raster plot of each trial (upper panel) and running average of firing frequencies (lower panel) of LHorexin neurons are indicated in each rectangular box following illumination of the brain slice through the objective lens. Two vertical red lines indicate illumination start (left) and stop (right) timing.
-
Figure 6—source data 1
Source data for Figure 6f.
- https://doi.org/10.7554/eLife.44928.028
Figure 6—figure supplement 1
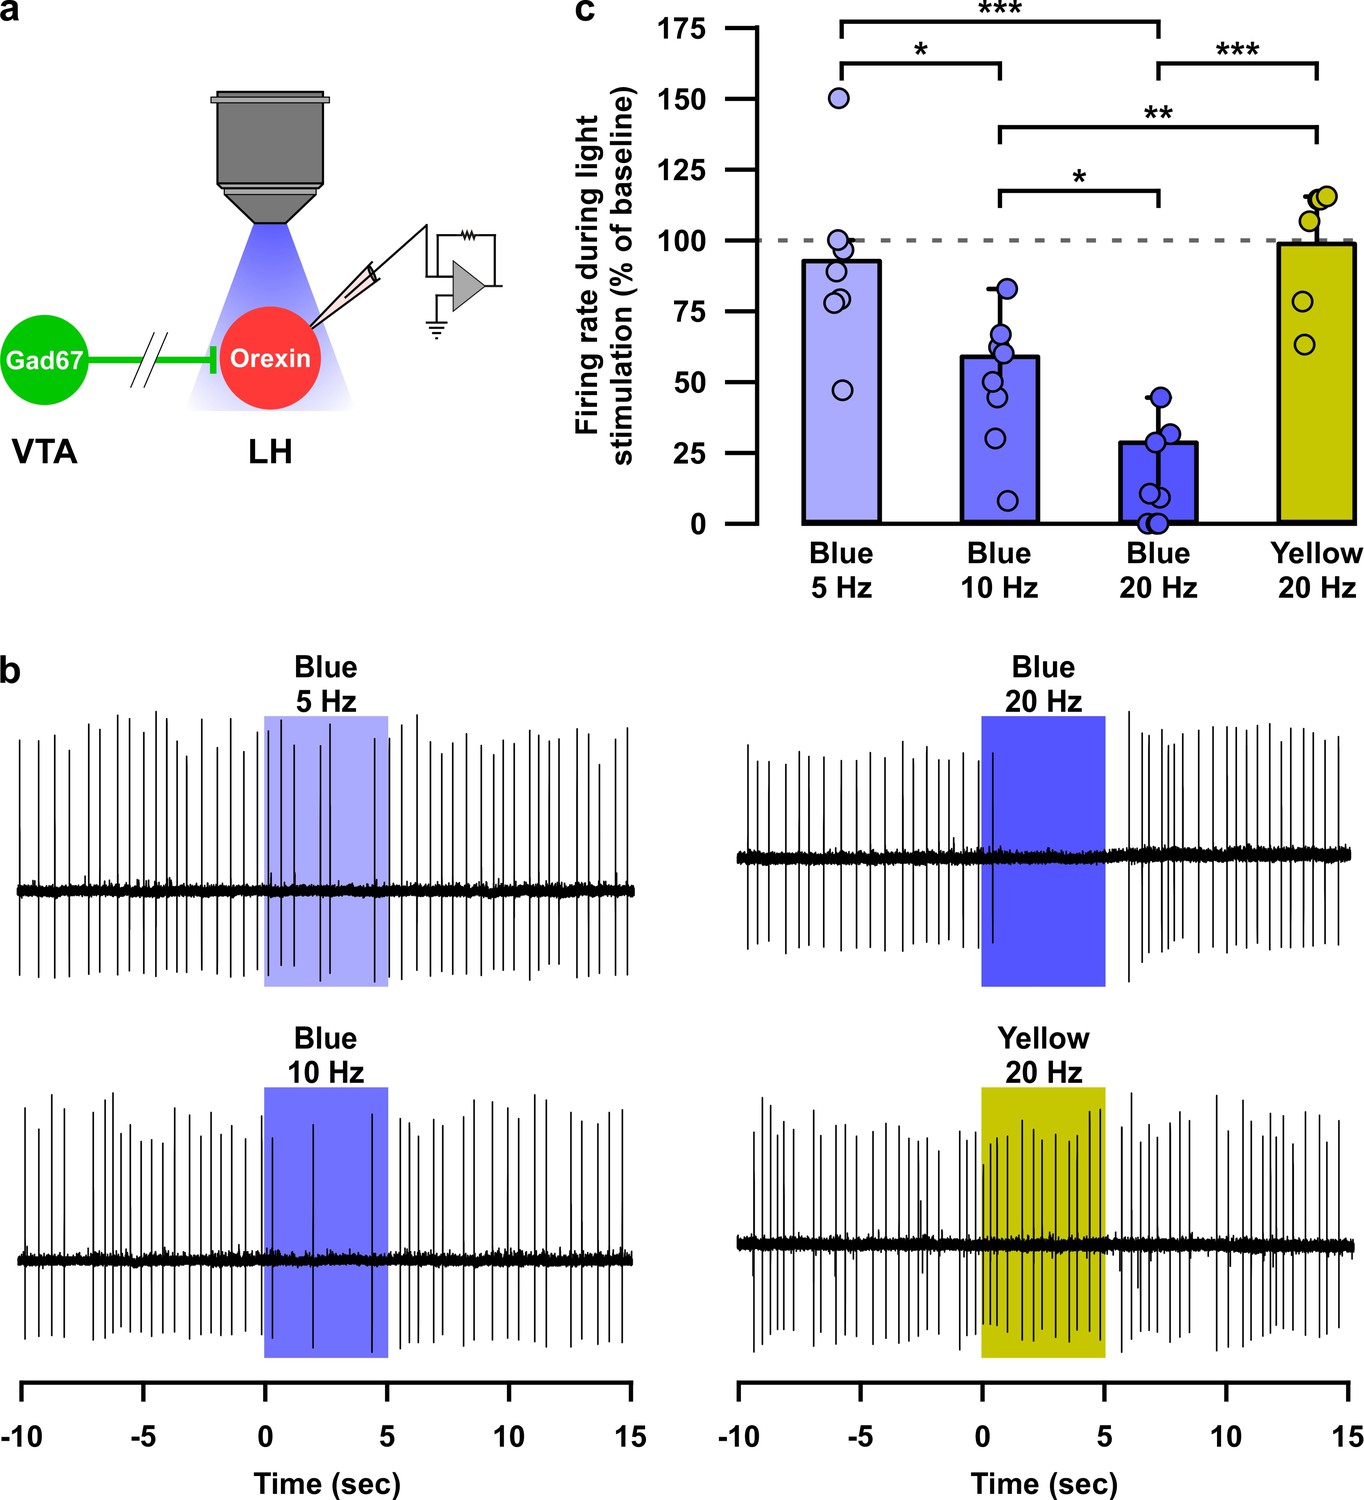
Optogenetic activation of nerve terminals of VTAGad67+ neurons in the LH inhibited orexin neurons in a blue-light pulse frequency-dependent manner.
(a) Schematic of experiment. (b) Loose cell-attached recording traces from LHorexin neurons while optogenetically activating VTAGad67+ nerve terminals using light pulse of different wavelength and frequency. (c) Summary of experiments in (b). Blue light 5 Hz (n = 7 cells), 10 Hz (n = 8 cells), 20 Hz (n = 9 cells), and yellow light 20 Hz (n = 6 cells). p=0.01 (Blue 5 vs 10 Hz), p=3.6e-6 (Blue 5 vs 20 Hz), p=0.02 (Blue 10 vs 10 Hz), p=0.9 (Blue five vs Yellow 20 Hz), p=0.004 (Blue 10 vs Yellow 20 Hz), and p=1.7e-6 (Blue 20 vs Yellow 20 Hz) one-way ANOVA followed by post hoc Tukey test). Data are represented as mean ± SEM.
-
Figure 6—figure supplement 1—source data 1
Source data for Figure 6—figure supplement 1c.
- https://doi.org/10.7554/eLife.44928.027
Figure 7
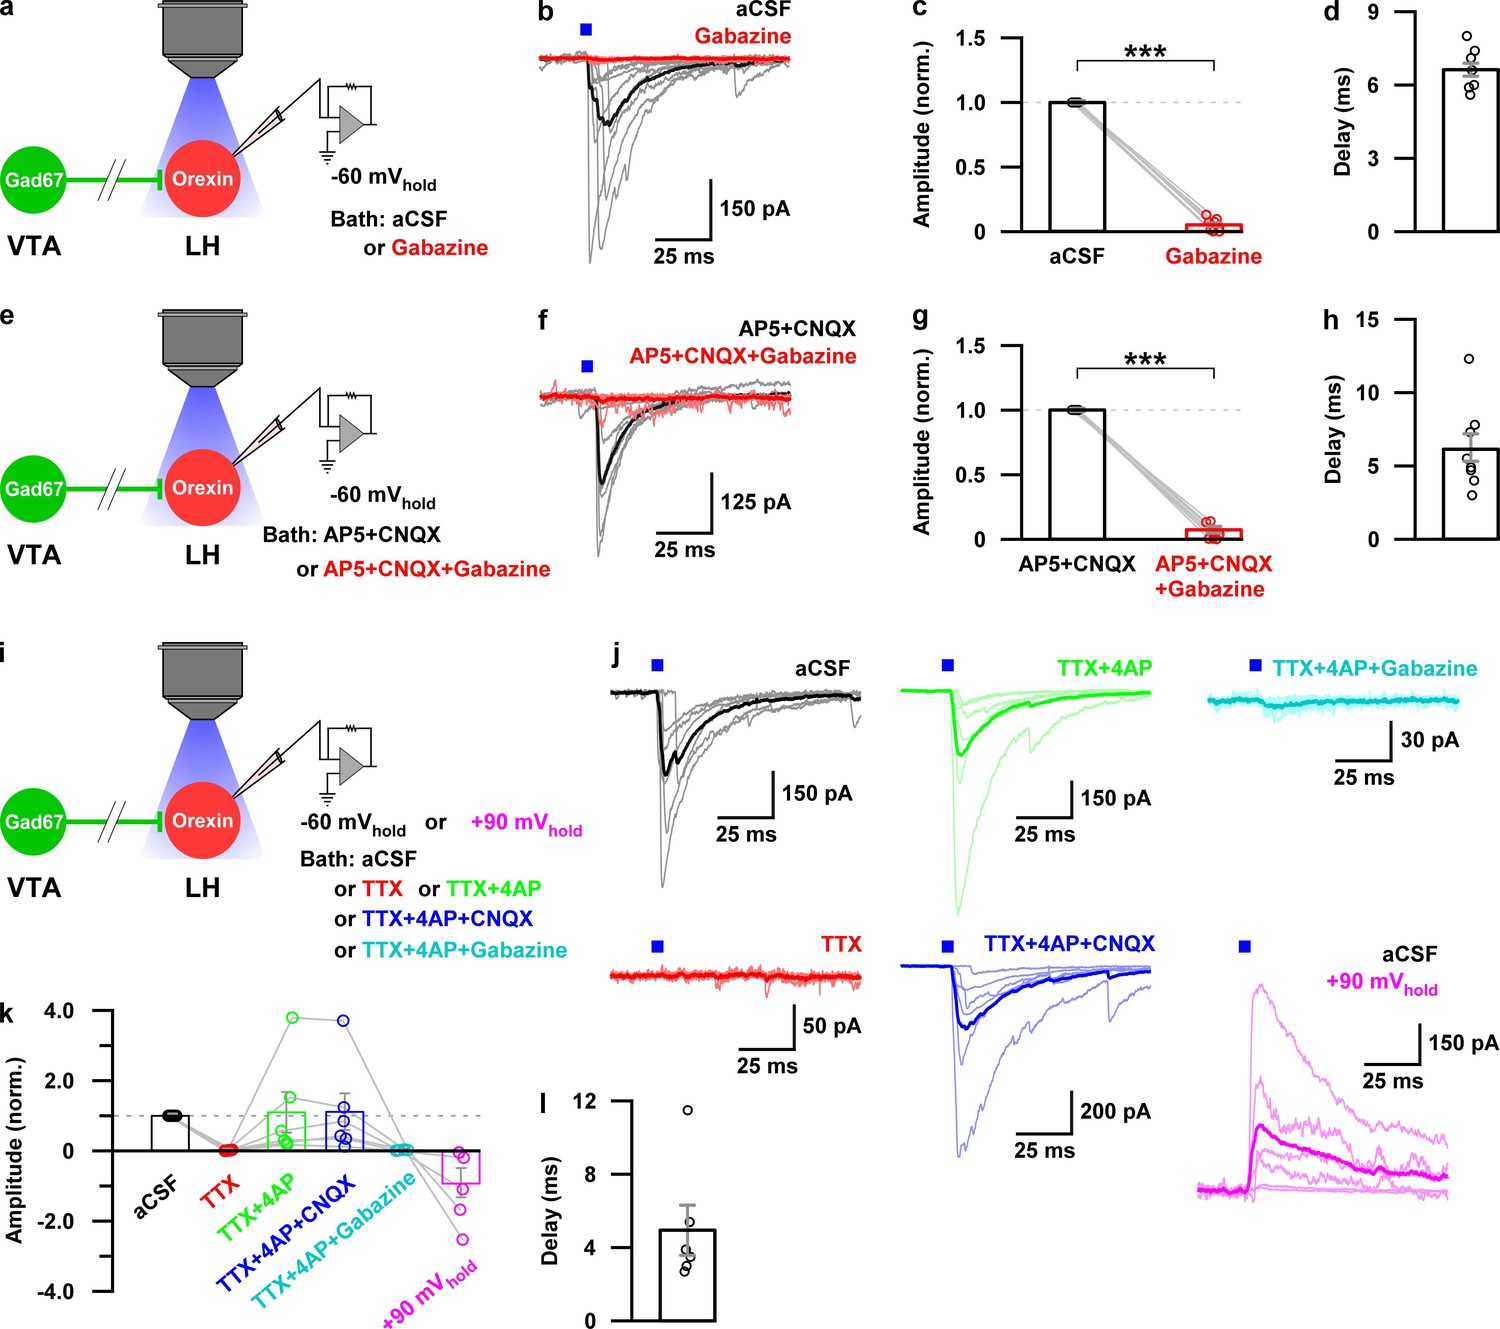
Monosynaptic GABAergic input underlies the inhibitory effect of VTAGad67+ neurons onto LHorexin neurons.
(a) Schematic of experiments in b-d. (b) Blue light pulses (5 ms) induced post-synaptic currents in the LHorexin neurons. The thicker line indicates average traces, and the thinner line indicates responses in individual cells (n = 8 cells). (c) Summary of the experiments in b showing the amplitude of current normalized to the aCSF application. (d) Delay in response from light onset. (e) Schematic of the experiments in f-h. (f–h) Similar data representation as in (b–e) in the presence of glutamatergic and GABAergic antagonists. (i) Schematic of the experiments j-l. (j) The effect of glutamatergic and GABAergic antagonists and channel blockers on blue light pulse-induced currents (n = 7 cells). (k) Summary of the experiments in (j) showing the amplitude of current normalized to aCSF (n = 6 cells). Data are represented as mean ± SEM. ***, p<0.001. p values were calculated by two-tailed paired Student’s t-test.
-
Figure 7—source data 1
Source data for Figure 7c, 7g and 7k.
- https://doi.org/10.7554/eLife.44928.030
Figure 8
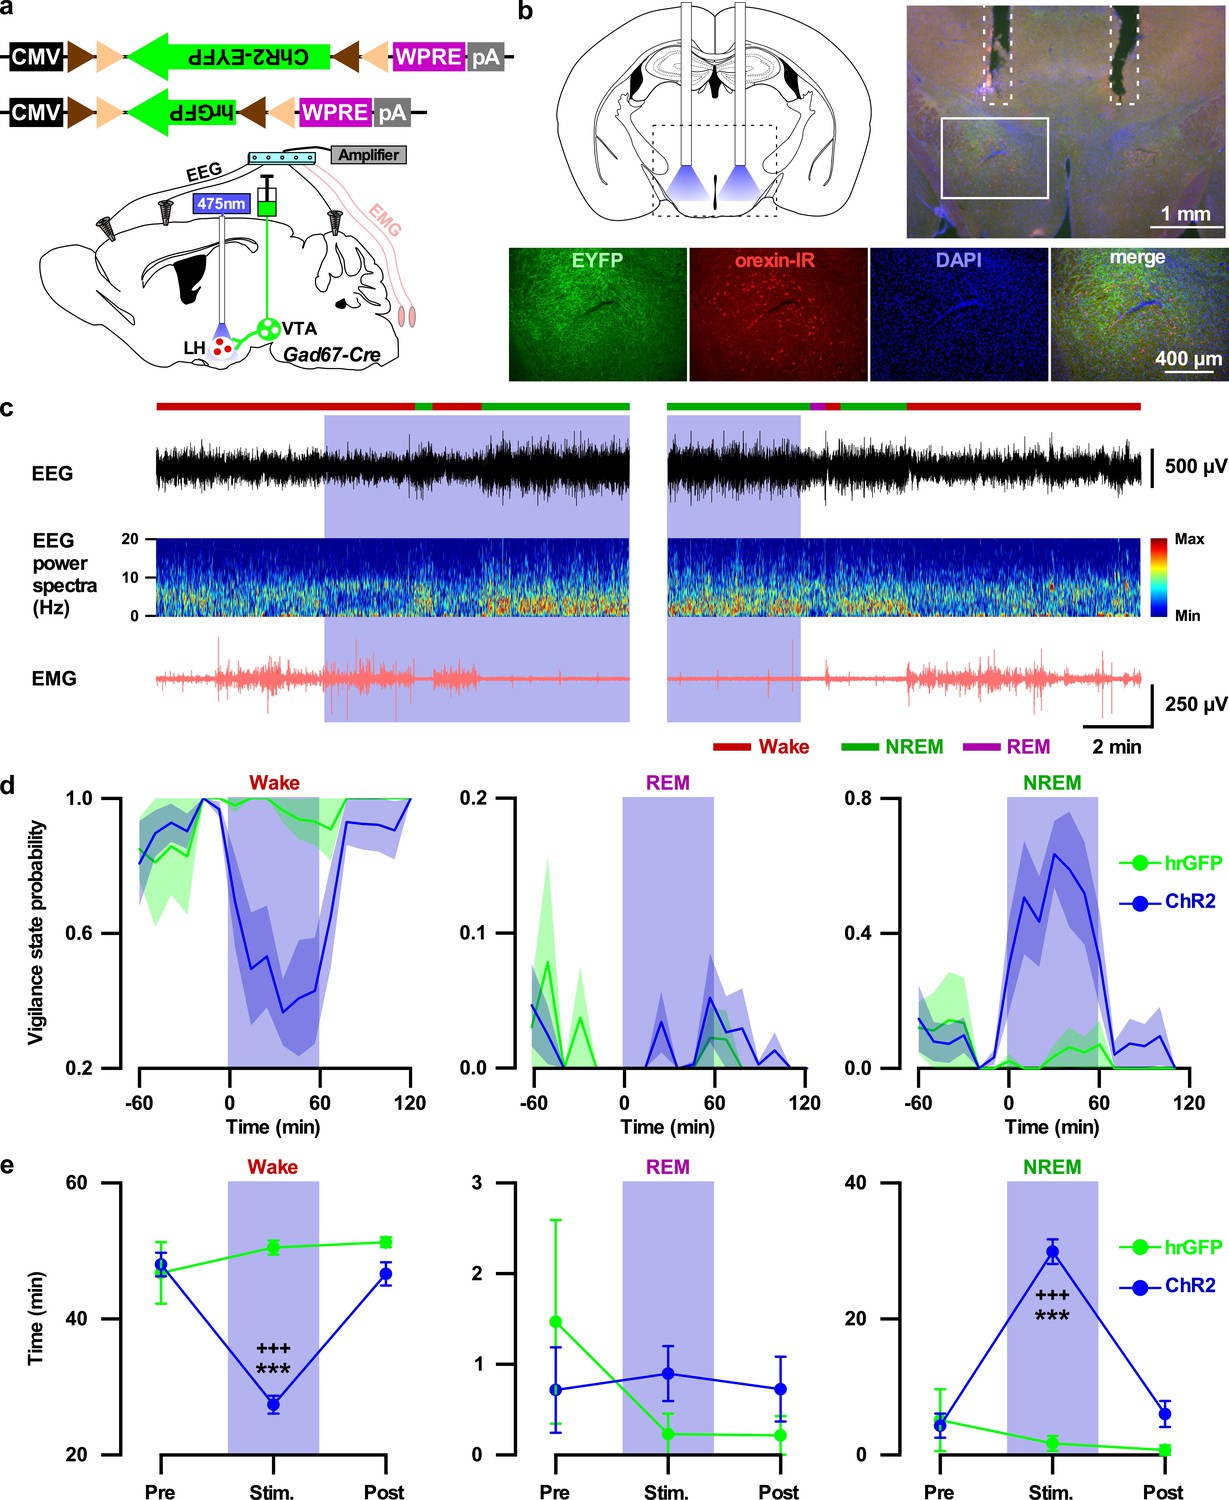
Activation of VTAGad67+ nerve terminals in the LH promoted NREM sleep.
(a) Schematic of the projection specific optogenetic activation. (b) Schematic and immunohistochemistry of fiber implantation in the LH. Top right panel shows merged fluorescence image depicted in the coronal brain map. Lower panels indicate enlarged images of the boxed area shows VTAGad67+ terminals near orexin neurons in the LH. (c) Representative traces showing EEG, EEG spectra, and EMG while mice experienced 20 Hz blue light stimulation (left: start of light illumination, right: stop of light illumination). Vigilance states determined by EEG and EMG signals are indicated by colored bars. (d and e) Probability of vigilance state (d) and total time spent (e) of either ChR2- or hrGFP-expressing mice. Blue and green lines indicate mean probability of each vigilance state in ChR2 (n = 7 mice) and hrGFP (n = 5 mice) group, respectively. Data are represented as mean ± SEM. ***, p<0.001 (vs Pre); +++, p<0.001 (vs Post). p values were calculated by one-way ANOVA followed by post-hoc Tukey test.
-
Figure 8—source data 1
Source data for Figure 8d and 8e.
- https://doi.org/10.7554/eLife.44928.032
Videos
Video 1
Optogenetic inhibition of VTAGad67+ neurons during NREM sleep, REM sleep, and wakefulness.
Blue light (475 ± 18 nm, 10 mW, 5 s) was illuminated in the VTA area in each vigilance state to inhibit ACR2-expressing VTAGad67+ neurons. EEG, EMG, and light stimulation signals appear at the top of the window.
Video 2
mCherry control of optogenetic inhibition during NREM sleep, REM sleep, and wakefulness.
Blue light (475 ± 18 nm, 10 mW, 5 s) was illuminated in the VTA area in each vigilance state in mCherry-expressing Gad67-Cre mice. EEG, EMG, and light stimulation signals appear at the top of the window.
Tables
Table 1
Details of probes designed for in situ hybridization.
https://doi.org/10.7554/eLife.44928.006| Gene | Channel | Color | Position | Accession | Catalog number |
|---|---|---|---|---|---|
| Gad67 | 1 | Opal 520 | 62-3113 | NM_008077.4 | 400951 |
| Vgat (SLC32A1) | 4 | Opal 690 | 894-2037 | NM_009508.2 | 319191-C4 |
| mCherry | 3 | Opal 620 | 23-681 | n/a | 431201-C3 |
Key resources table
| Reagent type (species) or resource | Designation | Source or reference | Identifiers | Additional information |
|---|---|---|---|---|
| Strain, strain background | AAV(9)-CMV-FLEX-hrGFP | This paper | NA | Titer: 6.0 × 10¹² copies/ml |
| Strain, strain background | AAV(9)-CAG-FLEX-hM3Dq-mCherry | This paper | NA | Titer: 1.1 × 10¹² copies/ml |
| Strain, strain background | AAV(9)-CMV-FLEX-ACR2-2A-mCherry | Mohammad et al., 2017 | Genbank accession# KP171709 | Titer: 6.2 × 10¹² copies/ml |
| Strain, strain background | AAV(9)-CAG-FLEX-mCherry | This paper | NA | Titer: 1.9 × 10¹² copies/ml |
| Strain, strain background | AAV(9)-CMV-FLEX-ChR2 (ET/TC)-eYFP | Berndt et al., 2011 | NA | Titer: 3.0 × 10¹³ copies/ml |
| Strain, strain background | AAV(9)-CMV-FLEX-GCaMP6f | Chen et al., 2013 | NA | Titer: 1.3 × 10¹² copies/ml |
| Strain, strain background | AAV(DJ)-CMV-dFrt-tdTomato-WPRE | This paper | NA | Titer: 8.1 × 10¹² copies/ml |
| Genetic reagent (Mus musculus) | Glutamic acid decarboxylase 67-Cre | Higo et al., 2009 | Gad67-Cre | |
| Genetic reagent (Mus musculus) | Orexin-Flippase | Chowdhury et al., 2019 | Orexin-Flp | |
| Genetic reagent (Mus musculus) | Orexin-Flippase; Glutamic acid decarboxylase 67-Cre | Chowdhury et al., 2019 | Orexin-Flp; Gad67-Cre | |
| Antibody | Rabbit polyclonal anti-TH | Millipore | AB-152 | (1/1000) |
| Antibody | Mouse monoclonal anti-GFP | Fujifilm Wako Pure Chemical Corporation | mFX75 | (1/1000) |
| Antibody | Goat polyclonal anti-orexin | Santa Cruz Biotechnology | sc-8070 | (1/1000) |
| Antibody | Mouse monoclonal anti-Gad67 | Millipore | MAB5406 | (1/500) |
| Antibody | Mouse monoclonal anti-DAT | Frontier Institute Co. Ltd. | DAT-Rb-Af1800 | (1/1000) |
| Antibody | Mouse monoclonal anti-DsRED | Santa Cruz Biotechnology | sc-390909 | (1/1000) |
| Commercial assay or kit | RNAscope Fluorescent Multiplex Reagent ver.2 | ACD Bio | ||
| Chemical compound, drug | clozapine-N-oxide (CNO) | Enzo Life Sciences | BML-NS105-0025 | |
| Chemical compound, drug | 4',6-diamidino-2-phenylindole dihydrochloride (DAPI) | Thermo Fisher Scientific | Cat# D1306 | |
| Chemical compound, drug | Gabazine | Abcam | Cat# Ab-120042 | |
| Chemical compound, drug | tetrodotoxin (TTX) | Alomone Labs | Cat# T-550 | |
| Chemical compound, drug | D-2-Amino-5-phosphopentanoic acid (AP5) | Alomone Labs | Cat# D-145 | |
| Chemical compound, drug | 6-cyano-7-nitroquinoxaline-2,3-dione (CNQX) | Sigma-Aldrich | Cat# C127 | |
| Chemical compound, drug | 4-Aminopyridine (4-AP) | Sigma-Aldrich | Cat# 8.01111 | |
| Software, algorithm | Origin 2017 | Lightstone | Origin 2018 | |
| Software, algorithm | SleepSign | Kissei Comtec | Version 3 | |
| Software, algorithm | pClamp 10.5Software and Algorithms | Molecular Devices | RRID:SCR_011323 | |
| Software, algorithm | ImageJ | https://imagej.nih.gov/ij/ | RRID:SCR_003070 | |
| In situ hybridyzation probe | Gad67 Channel 1 | ACD Bio | Cat# 400951 | |
| In situ hybridyzation probe | Vgat Channel 4 | ACD Bio | Cat# 319191 | |
| In situ hybridyzation probe | mCherry Channel 3 | ACD Bio | Cat# 431201 | |
| TSA enhancement (ISH) | Opal520 | PerkinElmer | ||
| TSA enhancement (ISH) | Opal620 | PerkinElmer | ||
| TSA enhancement (ISH) | Opal690 | PerkinElmer |
Additional files
-
Transparent reporting form
- https://doi.org/10.7554/eLife.44928.034
Download links
A two-part list of links to download the article, or parts of the article, in various formats.
Downloads (link to download the article as PDF)
Open citations (links to open the citations from this article in various online reference manager services)
Cite this article (links to download the citations from this article in formats compatible with various reference manager tools)
GABA neurons in the ventral tegmental area regulate non-rapid eye movement sleep in mice
eLife 8:e44928.
https://doi.org/10.7554/eLife.44928


