The dorsomedial prefrontal cortex computes task-invariant relative subjective value for self and other
- Yale University, United States
- Yale University School of Medicine, United States
- Kavli Institute for Neuroscience, Yale University School of Medicine, United States
Figures
Figure 1 with 3 supplements
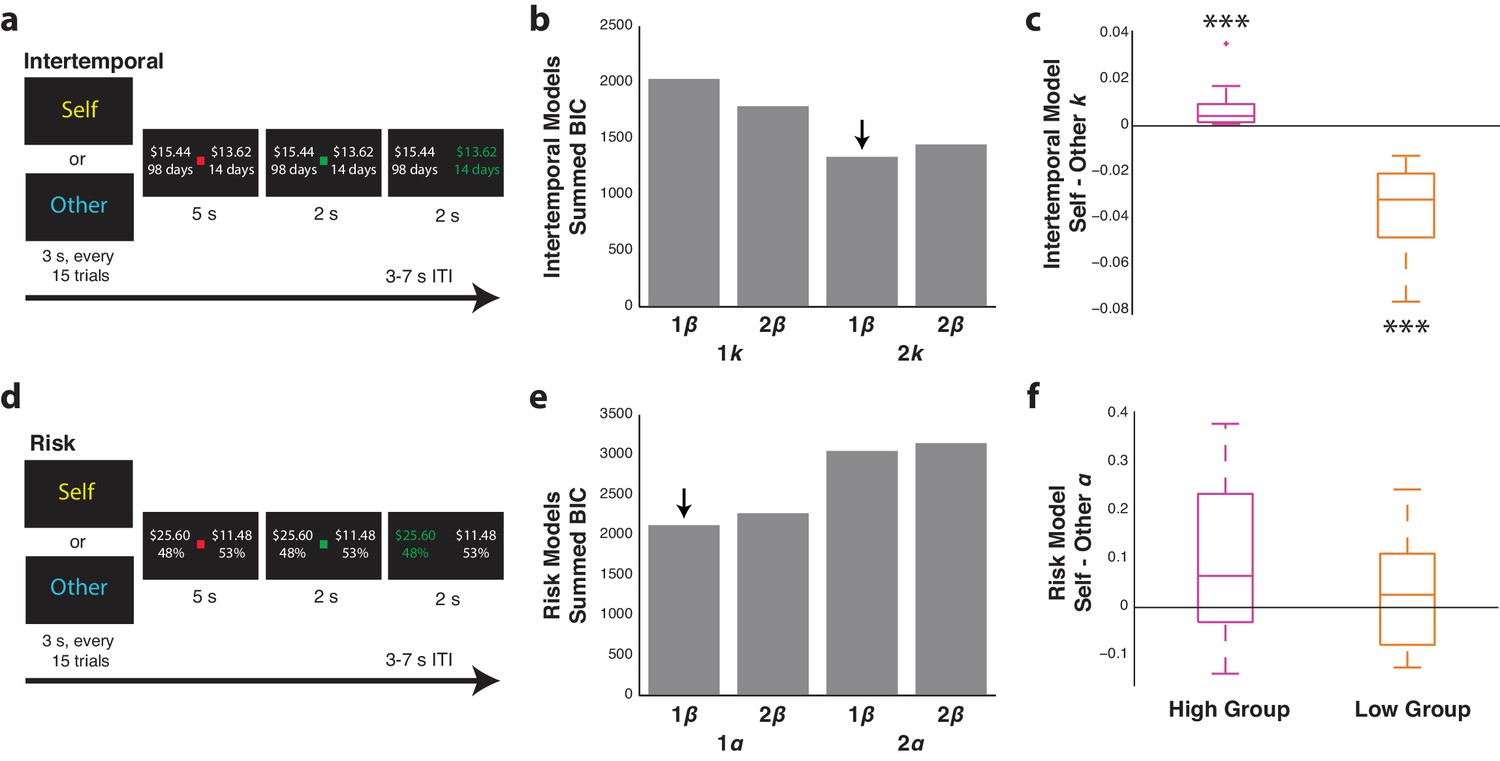
Participants differentiate between similar and dissimilar others in the intertemporal and risky choice tasks.
(a,d) Intertemporal (top) and risky (bottom) choice task design. Every 15 trials, participants were presented with either ‘Self’ or ‘Other’ to indicate for whom they would be making choices in a given block. Each trial involved the presentation of two options, and participants were given the opportunity to indicate their choice either for themselves or for another participant in the study with a left or right button press. (b,e) Summed Bayesian information criterion (BIC) for the one and two discounting or risk parameter models for the intertemporal (top) and risky (bottom) choice tasks, respectively. For each of these models, variants with a common β parameter or two β parameters, one for Self and one for Other trials, were also included. Downward arrows indicate the best fitting model as determined via lowest BIC. (c,f) Self minus Other discounting parameters (k) or risk parameters (α) for the intertemporal (top) and risky (bottom) choice two-parameter models, respectively, each with one β parameter. For each analysis, participants were median-split into either high or low discounting or risk tolerance based on the value of their fitted k or α parameters for Self trials. Data are plotted as box plots for each condition in which horizontal lines indicate median values, boxes indicate 25–75% interquartile range and whiskers indicate minimum and maximum values; data points outside 1.5x the interquartile range are shown separately as crosses. *** indicates p=0.005, Wilcoxon signed rank test. N = 20 participants for intertemporal choice with 10 high-discounting and 10 low-discounting individuals, N = 21 for risky choice with 11 high-risk tolerance and 10 low-risk tolerance individuals.
-
Figure 1—source data 1
Bayes factor approximation for behavioral model fitting.
An approximation of the Bayes factor was calculated from BIC values for the 2 k model relative to the 1 k model for the intertemporal choice task, as well as for the 1 α model relative to the 2 α model for the risky choice task. Higher values thus indicate a higher probability of the 2 k model for intertemporal choice and the 1 α model for risky choice. Individual parameters for the best fitting model for each participant are also displayed.
- https://doi.org/10.7554/eLife.44939.006
Figure 1—figure supplement 1
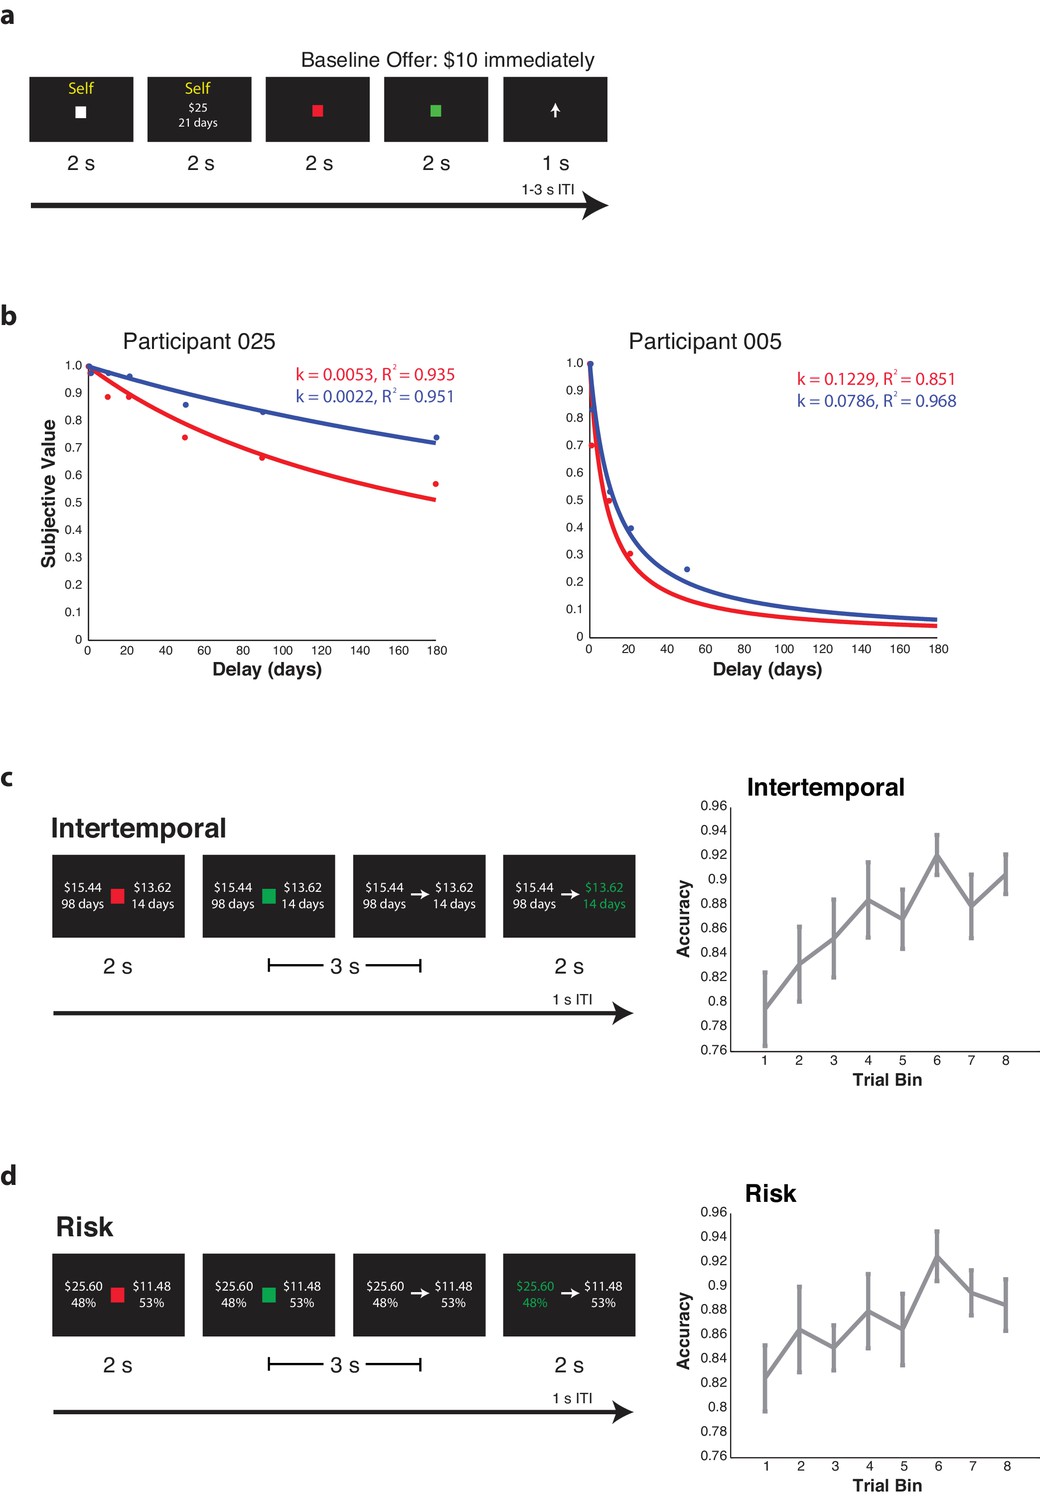
Behavioral results from the preliminary behavior-only intertemporal choice task as well as the intertemporal and risky choice learning tasks.
(a) Preliminary, behavior-only intertemporal choice task design. Participants made choices for either themselves (Self) or another participant in the study (Other) about whom they were not given any additional information, indicating their choice with either a sustained or released button press. This task was designed to evaluate participants’ baseline preferences prior to the intertemporal choice learning task and scanning session. (b) Example participants showing the temporal decay of subjective value in the preliminary task over time for Self (red) and Other (blue) trials. (c,d) Task design for the intertemporal (c) and risky (d) choice learning tasks (left panels). Participants were asked to guess which of two choices another participant in the study would choose, indicating their guess with a left or right button press. They were then given feedback as to what the other participant would actually choose, iteratively learning the preferences of the other individual. Accuracy learning curves for the intertemporal (c) and risky (d) choice learning tasks averaged across all participants (right panels). Each bin averaged the accuracy of 10 trials. Data are plotted as mean ± s.e.m. N = 20 participants for intertemporal choice, N = 21 participants for risky choice.
Figure 1—figure supplement 2
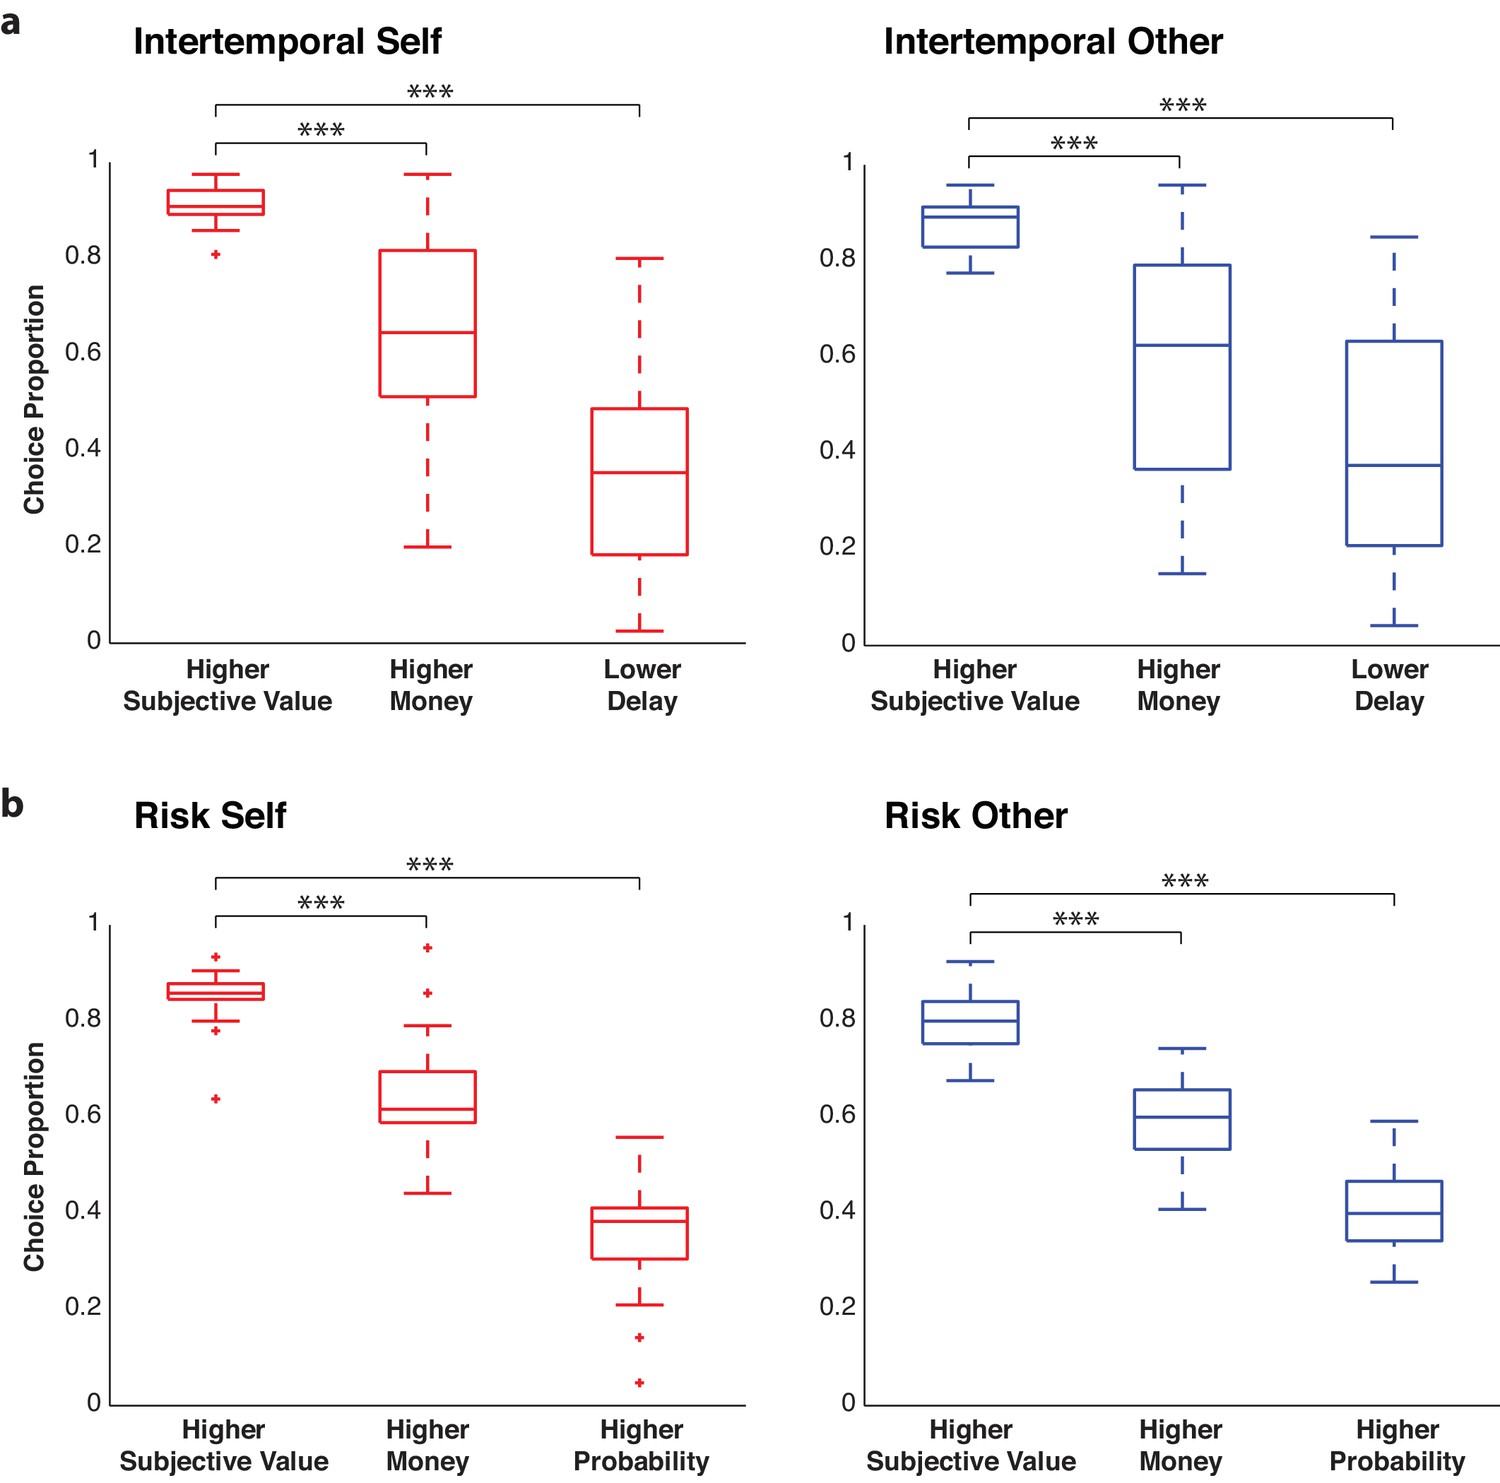
Choice behavior is more impacted by subjective value than individual trial variables.
(a) Proportion of choices that are predicted by higher subjective value, higher monetary value, or lower delay for Self (left) and Other (right) trials in the intertemporal choice task. (b) Proportion of choices that are predicted by higher subjective value, higher monetary value, or higher probability of reward for Self (left) and Other (right) trials in the risky choice task. In all cases, choice behavior was most impacted by the modeled subjective value than any other individual task variable. Data are plotted as box plots for each condition in which horizontal lines indicate median values, boxes indicate 25–75% interquartile range and whiskers indicate minimum and maximum values; data points outside 1.5x the interquartile range are shown separately as crosses. *** indicates p<0.005. Significance was determined by a comparison of choice proportion via Wilcoxon signed rank test. N = 20 participants for intertemporal choice, N = 21 participants for risky choice.
Figure 1—figure supplement 3
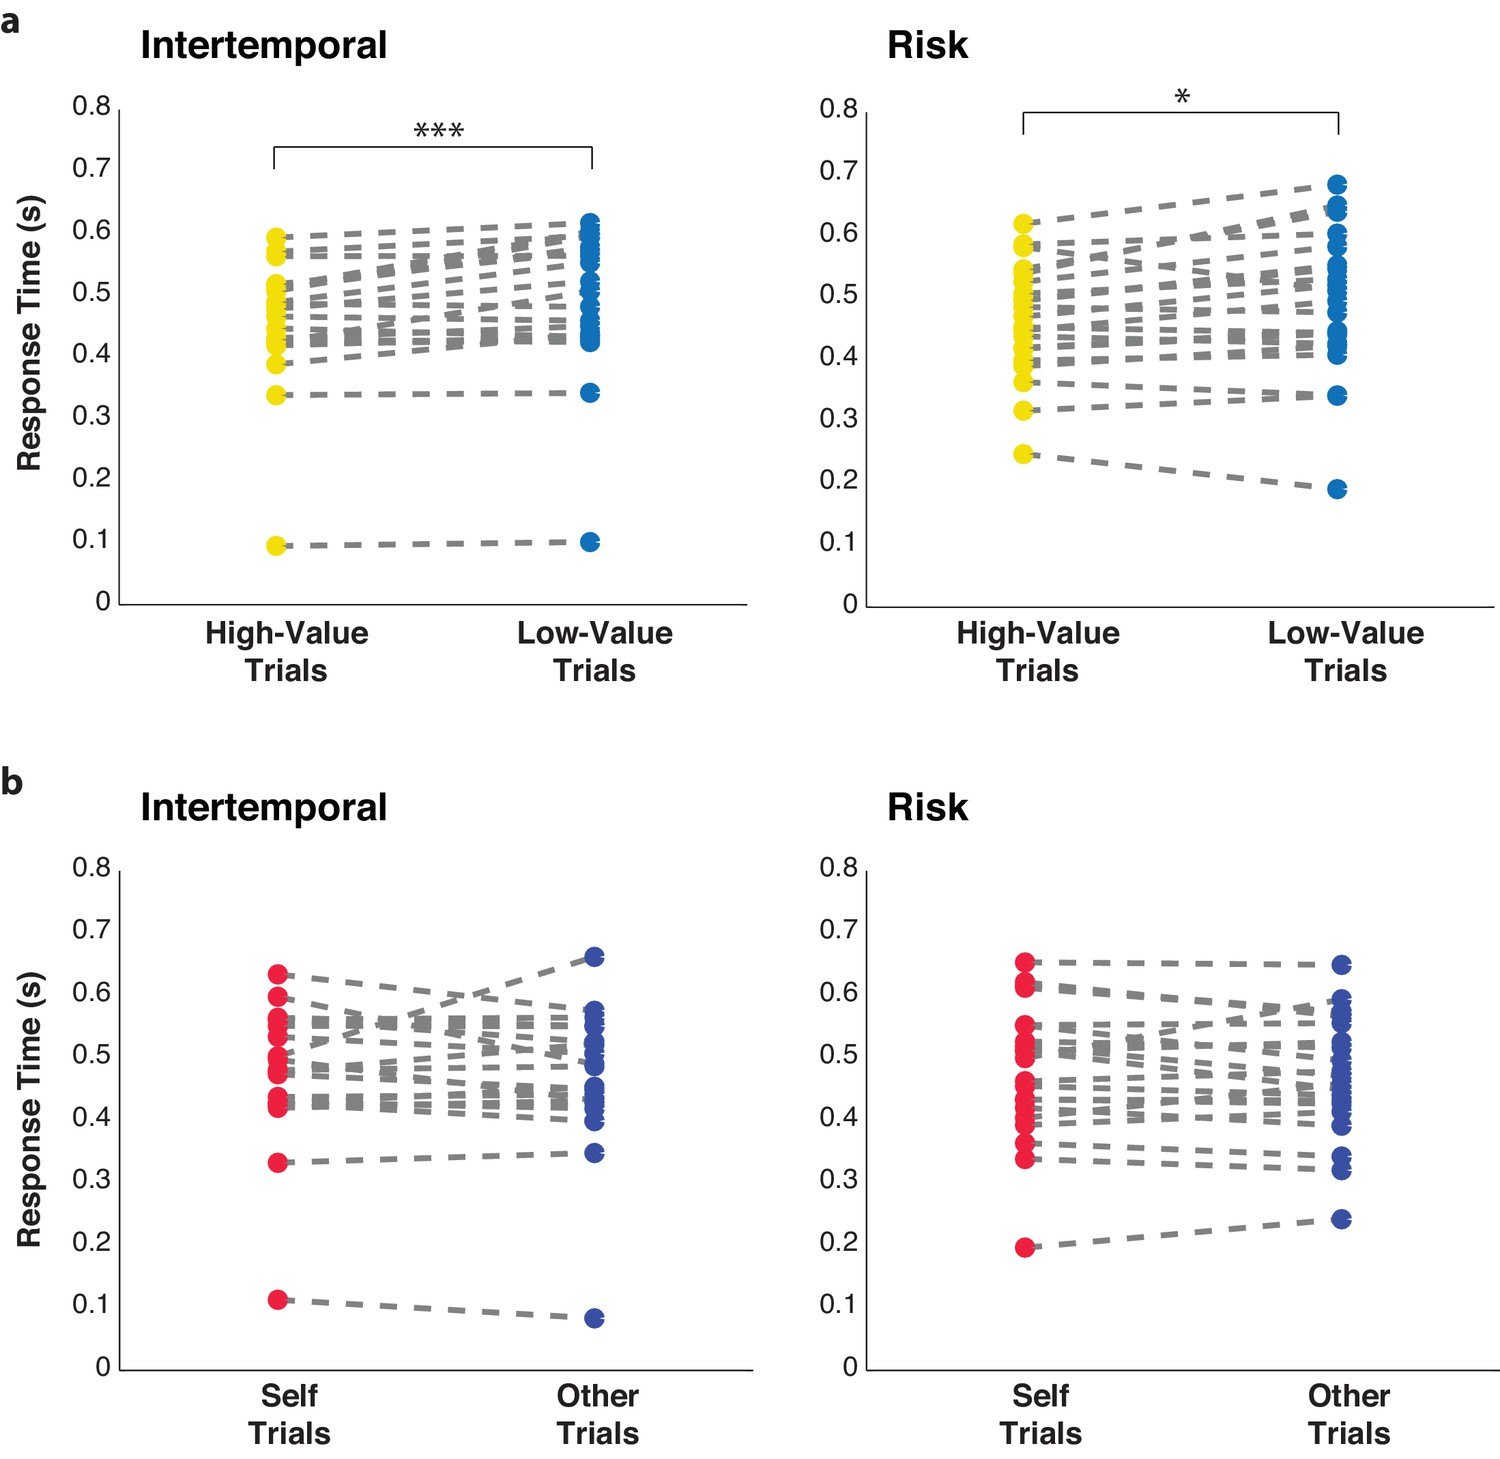
Response times differ between high and low-relative subjective value trials but not for Self and Other trials for both behavioral paradigms.
Trials were pooled over decision-making for self and other and median-split between high versus low relative subjective value (a) or between Self and Other trials (b). Response times were then averaged and compared between high and low-value trials for both the intertemporal (left) and risky (right) choice paradigms. Each individual set of points with a connecting dotted line indicates data from one participant. * indicates p<0.05, *** indicates p<0.005, Wilcoxon signed rank test. N = 20 participants for intertemporal choice, N = 21 participants for risky choice.
Figure 2
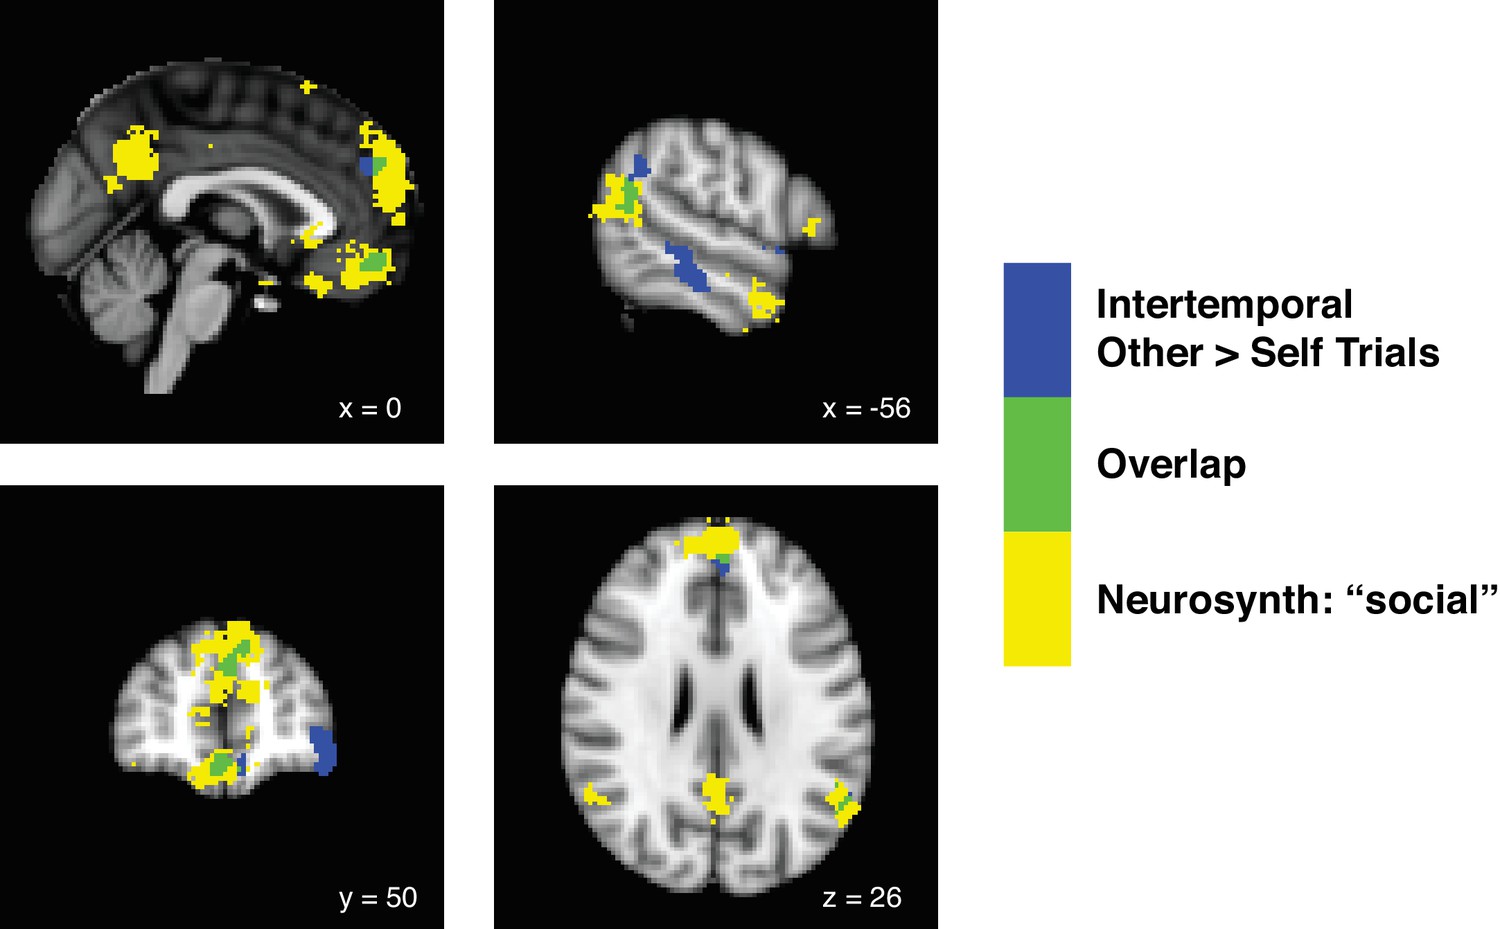
Decision-making for dissimilar others in the intertemporal choice paradigm drives activity in the ‘social’ brain.
Statistical parametric maps showing the contrast of Other over Self trials during the intertemporal choice task (blue), a term search for ‘social’ in Neurosynth (yellow), and the overlap between the two analyses (green). We identified the neural correlates of decision-making from the perspective of other relative to self by performing a contrast of Other over Self trials, and vice versa. For the intertemporal choice paradigm in which participants were paired with others displaying dissimilar preferences, a contrast of other over self yielded significant activations in the ventromedial prefrontal cortex (vmPFC), the anterior portion of the dorsomedial prefrontal cortex (anterior dmPFC), and the temporal-parietal junction (TPJ) at a whole brain family-wise error (FWE) threshold of p<0.05, height threshold of p<0.001. All three of these clusters overlapped with a Neurosynth term search for ‘social’ (FDR-corrected to p<0.01), indicating that these clusters overlapped with brain areas associated with social cognition in previous studies. For the risky choice paradigm, in which participants were paired with others displaying similar preferences, no clusters survived even a lenient cluster correction at an FWE threshold of p<0.05 and a height threshold of p<0.01. No clusters were observed for the contrast of Self over Other trials at this threshold for either paradigm. N = 20 participants for intertemporal choice, N = 21 participants for risky choice.
-
Figure 2—source data 1
Other over Self trials GLM contrast for the intertemporal choice paradigm and ‘social’ term search on Neurosynth.
Other over Self trials GLM for intertemporal choice thresholded at p<0.05 FWE-corrected, cluster-defining threshold p<0.001. Neurosynth term search thresholded at p<0.01, FDR-corrected. Only clusters with greater than 40 voxels listed for Neurosynth term search. Coordinates were reported in accordance with the Montreal Neurological Institute (MNI) Atlas.
- https://doi.org/10.7554/eLife.44939.008
Figure 3 with 3 supplements
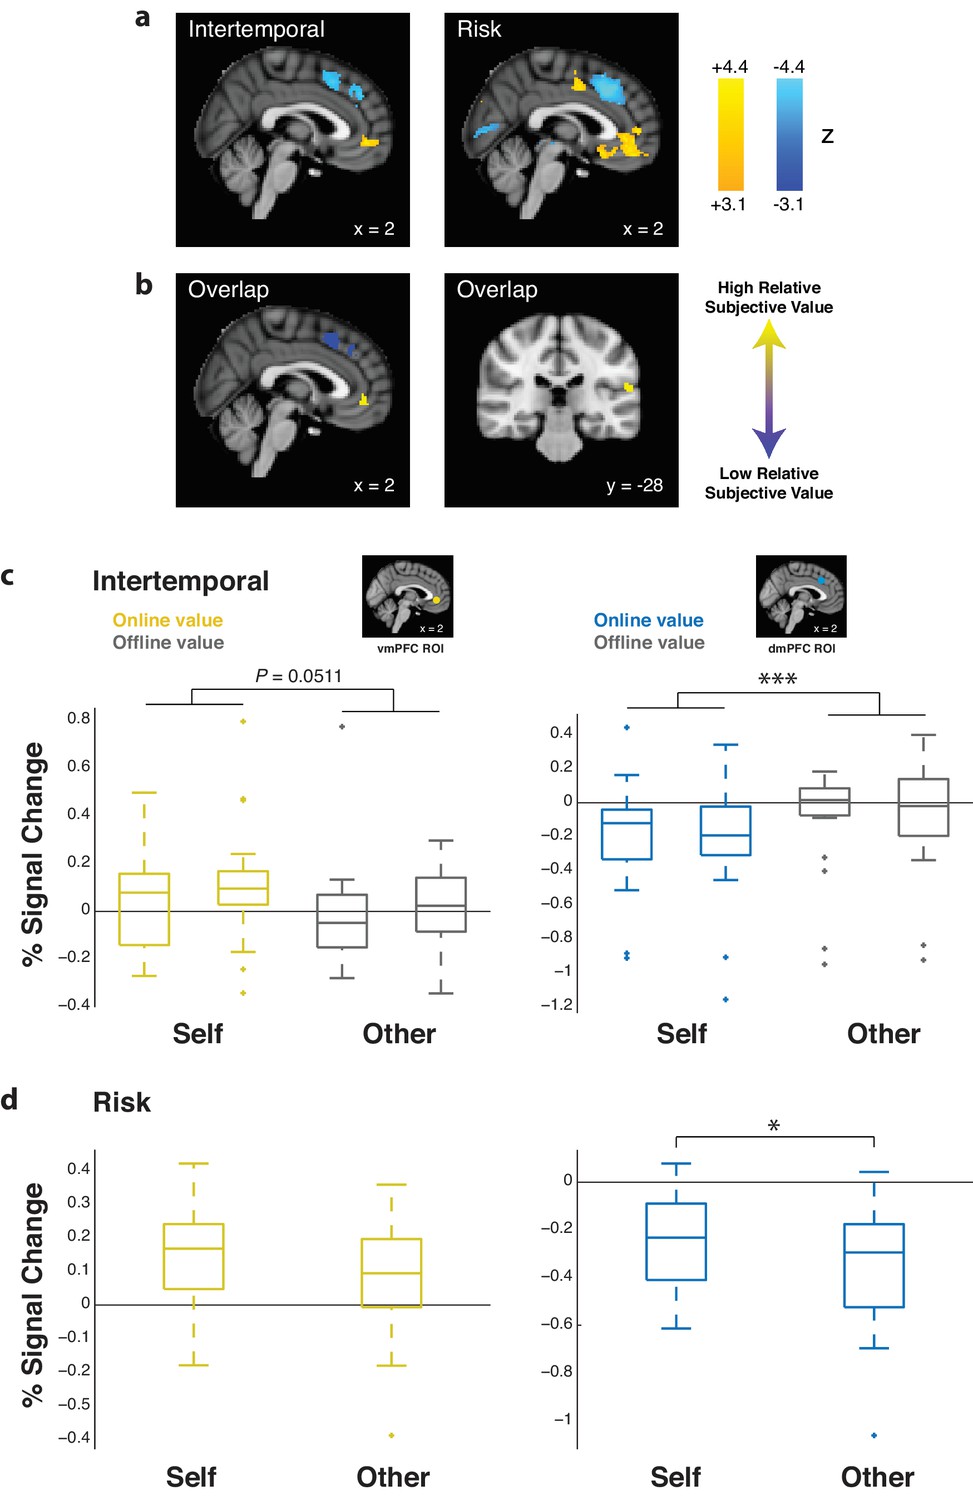
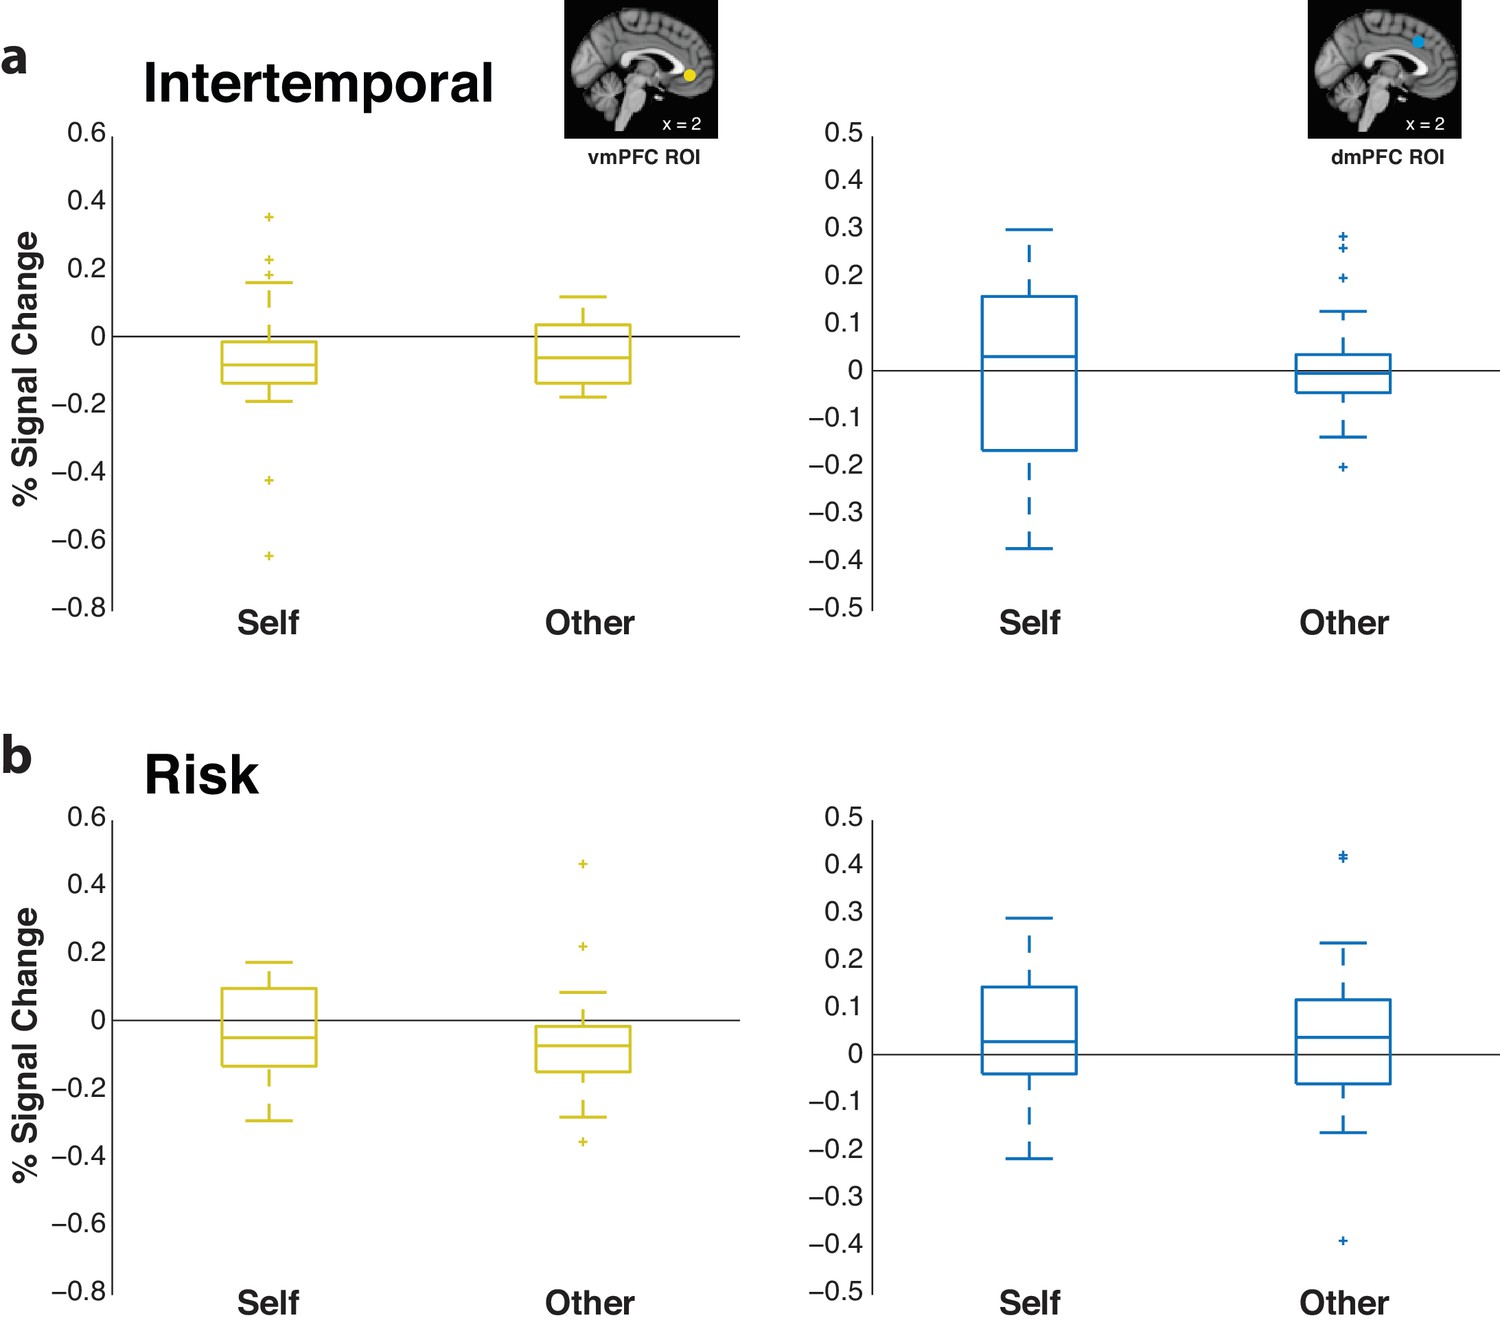
Ventromedial prefrontal cortex (vmPFC) and temporal-parietal junction (TPJ) activity is positively correlated with relative subjective value, while dorsomedial prefrontal cortex (dmPFC) activity is negatively correlated with relative subjective value.
(a) Whole-brain statistical parametric map for the positive (yellow) and negative (blue) correlation with relative subjective value, thresholded at p<0.05 FWE-corrected, cluster-defining threshold p<0.001, for the intertemporal (left) and risky (right) choice paradigms (sagittal section, x = 2). (b) Simple overlap between the statistical maps for the intertemporal and risky choice paradigms, including the positive (yellow) and negative (blue) correlation with relative subjective value (sagittal section, x = 2; coronal section, y = −28). (c,d) Extracted % signal changes for positive (left; yellow boxes; vmPFC ROI) and negative (right; blue boxes; dmPFC ROI) correlation with relative subjective value for the intertemporal (top) and risky (bottom) choice paradigms for Self and Other trials. Gray boxes indicate the corresponding % signal change for offline relative subjective value in the intertemporal choice task. Insets show 8 mm spherical ROIs for vmPFC (yellow) and dmPFC (blue) used to extract effect sizes. Data are plotted as box plots for each condition in which horizontal lines indicate median values, boxes indicate 25–75% interquartile range and whiskers indicate minimum and maximum values; data points outside 1.5x the interquartile range are shown separately as crosses. * indicates p<0.05, *** indicates p<0.005, all p>0.05 are explicitly stated. Significance was determined by comparison with either Wilcoxon signed rank or Friedman tests. N = 20 participants for intertemporal choice, N = 21 participants for risky choice.
-
Figure 3—source data 1
Relative subjective value (RSV) GLM for Self and Other trials in the intertemporal and risky choice paradigms.
Whole-brain thresholded at p<0.05 FWE-corrected, cluster-defining threshold p<0.001. Coordinates were reported in accordance with the Montreal Neurological Institute (MNI) Atlas.
- https://doi.org/10.7554/eLife.44939.013
-
Figure 3—source data 2
GLM analysis of offline subjective value recapitulating the methods of Nicolle et al. (2012) in the intertemporal choice task.
Whole-brain thresholded at p<0.05 FWE-corrected, cluster-defining threshold p<0.001. Coordinates were reported in accordance with the Montreal Neurological Institute (MNI) Atlas.
- https://doi.org/10.7554/eLife.44939.014
Figure 3—figure supplement 1
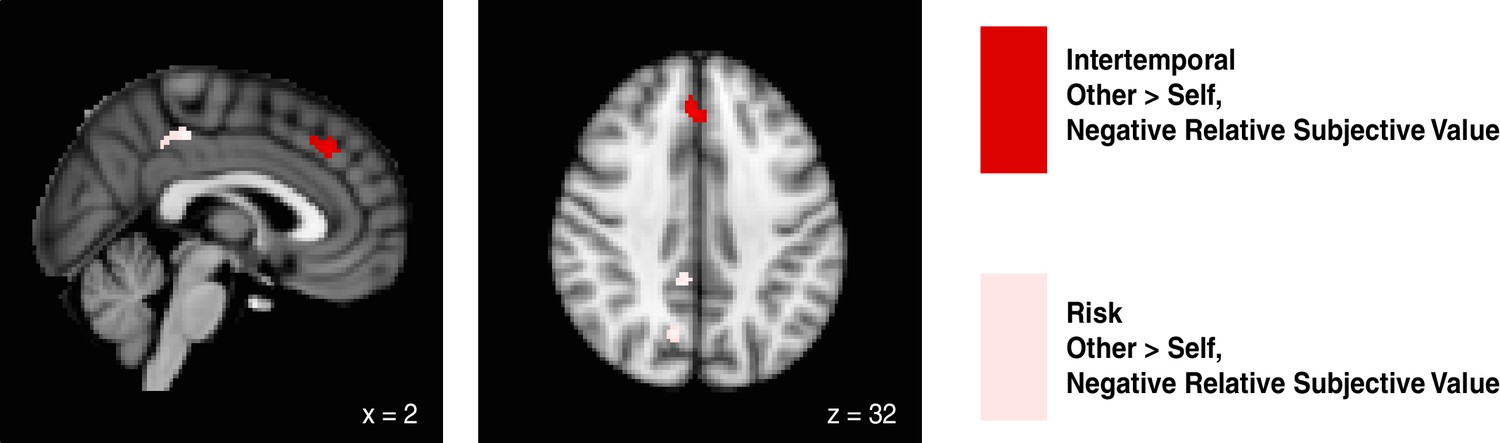
Negative correlation with relative subjective value in Other over Self trials does not yield overlapping clusters between paradigms.
Statistical parametric maps show the contrast of negative correlation for relative subjective value in Other over Self trials for the intertemporal (red) and risky (pink) choice paradigms. Maps were thresholded at p<0.05 FWE-corrected, cluster-defining threshold p<0.001. This analysis yielded clusters in the dmPFC for the intertemporal choice paradigm (intertemporal peak MNI coordinates [4 34 38], zpeak = 4.37) as well as precuneous cortex for the risky choice paradigm (risk coordinates [12 -60 26], zpeak = 4.12). No overlap between the two paradigms was observed. No clusters survived statistical thresholding for the comparison of relative subjective value representation in Self over Other trials. N = 20 participants for intertemporal choice, N = 21 participants for risky choice.
Figure 3—figure supplement 2
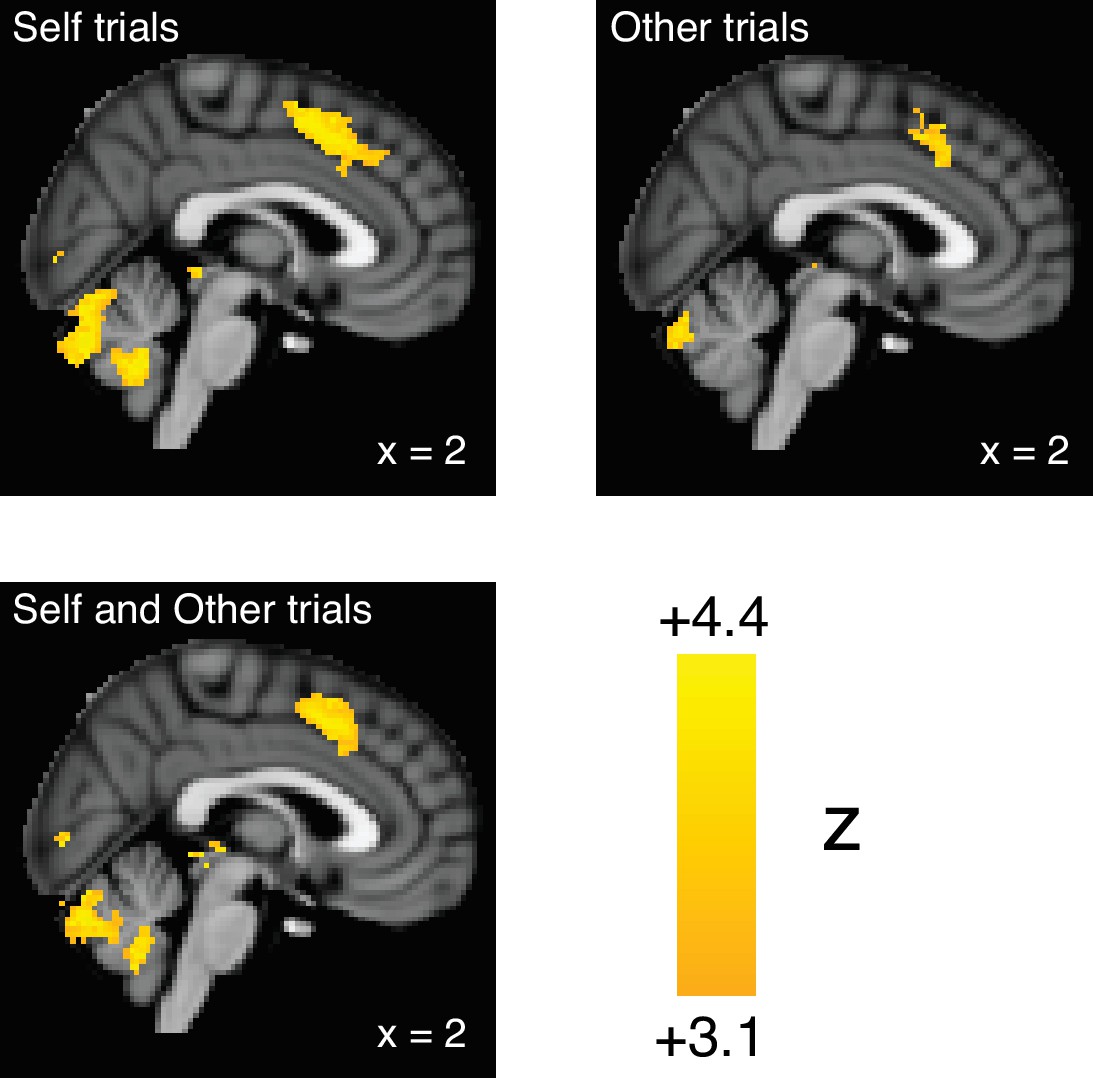
When recapitulating the methods of Nicolle et al. (2012), evidence is found for representation of offline subjective value in the posterior dorsomedial prefrontal cortex (dmPFC) in the intertemporal choice task.
Statistical parametric maps show the contrast of the offline subjective value of the chosen option over the offline subjective value of the unchosen option for Self trials alone (top left), Other trials alone (top right), or for Self and Other trials together (bottom). Maps were thresholded at p<0.05 FWE-corrected, cluster-defining threshold p<0.001. N = 20 participants for intertemporal choice.
Figure 3—figure supplement 3
The absolute value of the chosen option is uncorrelated with activity in either the ventromedial prefrontal cortex (vmPFC) or dorsomedial prefrontal cortex (dmPFC).
Percent signal change corresponding to the absolute value of the chosen option for the vmPFC (left) or dmPFC (right) for the intertemporal (a) and risky (b) choice paradigms, broken into Self and Other trials. Data are plotted as box plots for each condition in which horizontal lines indicate median values, boxes indicate 25–75% interquartile range and whiskers indicate minimum and maximum values; data points outside 1.5x the interquartile range are shown separately as crosses. Insets show the spherical ROIs for the vmPFC (yellow) and dmPFC (blue), which were based on prior studies. N = 20 participants for intertemporal choice, N = 21 participants for risky choice.
Figure 4 with 3 supplements
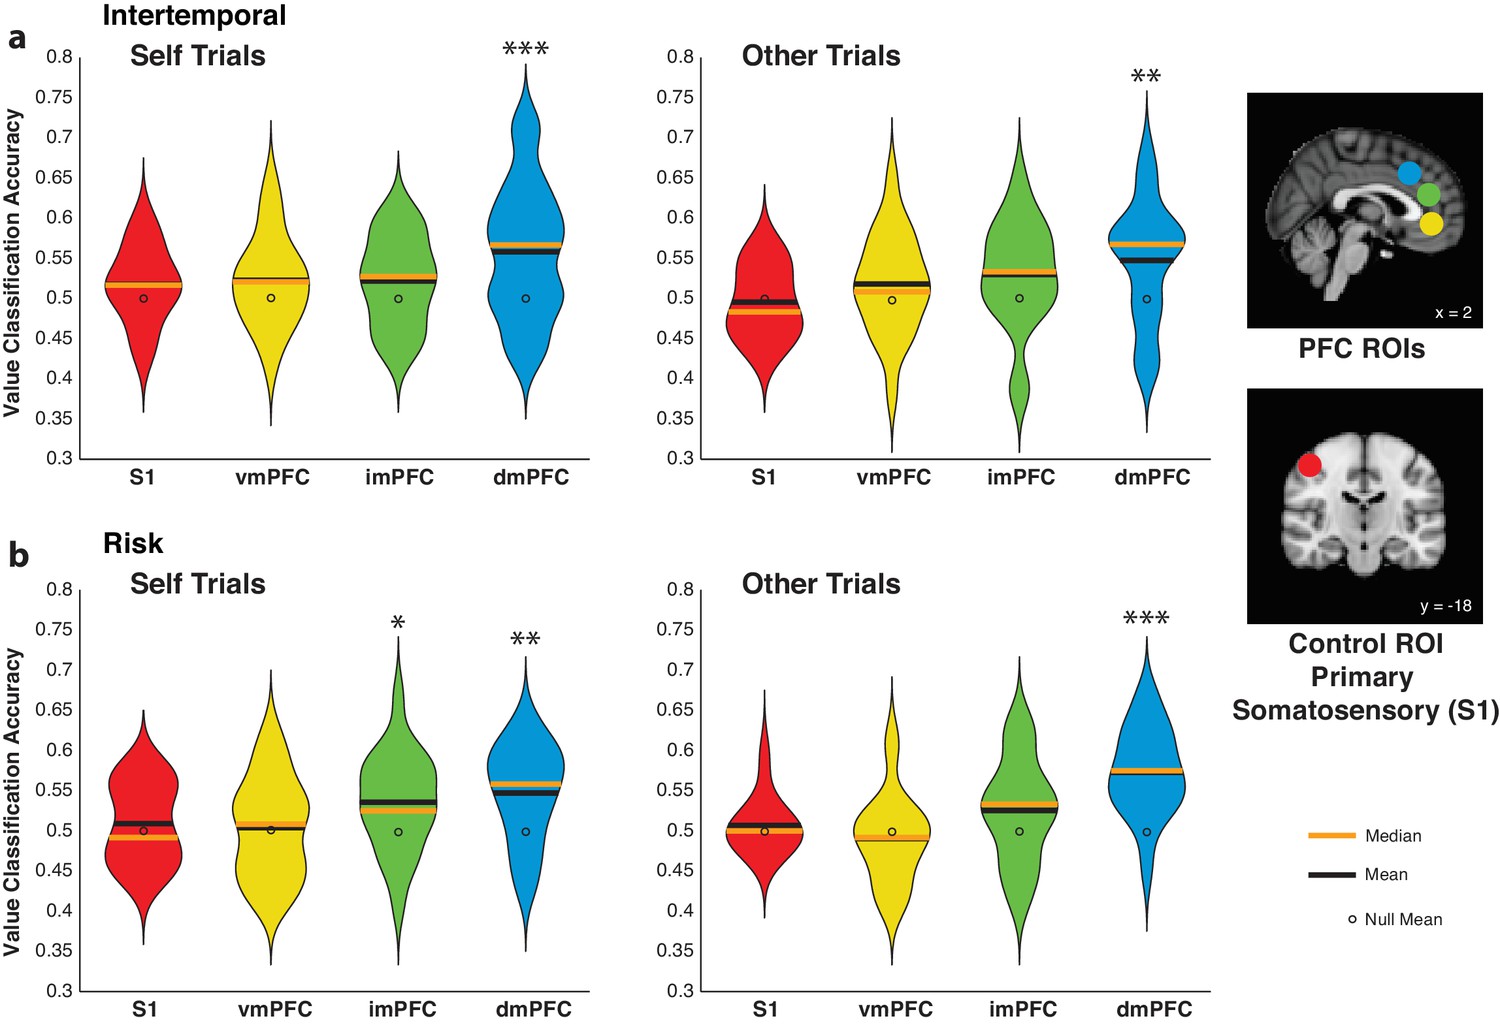
Activity in the dorsomedial prefrontal cortex (dmPFC) encodes relative subjective value for self and other.
(a,b) Decoding accuracy of pattern classifiers trained on Self (left) and Other (right) trials in the intertemporal (top) and risky (bottom) choice paradigms for primary somatosensory cortex (S1), ventromedial prefrontal cortex (vmPFC), dmPFC, and an intermediate ROI (imPFC) placed between the vmPFC and dmPFC. Insets show anatomical location of 8 mm spherical ROIs. Plots indicate the full distribution of data using a kernel density estimation with a bandwidth of 0.025 applied to all plots. The orange horizontal line indicates the median of a distribution, the black horizontal line indicates the mean of a distribution, and the black dot indicates the mean of the corresponding empirically derived null distribution. * indicates p<0.05, ** indicates p<0.01, *** indicates p<0.005, permutation test. N = 20 participants for intertemporal choice, N = 21 participants for risky choice.
-
Figure 4—source data 1
ROIs generated for multivariate analyses.
Dorsomedial prefrontal cortex (dmPFC), ventromedial prefrontal cortex (vmPFC), and an intermediate area (imPFC) spherical ROIs were grown to 8 mm based on peak voxels from previous studies for MVPA. Please note that small dmPFC and vmPFC spherical ROIs grown to 5 mm were used to extract GLM effect sizes. Anatomical ROIs for dmPFC and vmPFC were also taken from previous studies. COG stands for center of gravity. Coordinates were reported in accordance with the Montreal Neurological Institute (MNI) Atlas.
- https://doi.org/10.7554/eLife.44939.019
-
Figure 4—source data 2
MVPA significance for online relative subjective value analyses.
Analysis types include Self and Other trials from the intertemporal or risky choice tasks. 8 mm spherical regions of interest (ROIs) include primary somatosensory cortex (S1), ventromedial prefrontal cortex (vmPFC), dorsomedial prefrontal cortex (dmPFC), and an intermediate ROI placed in the medial prefrontal cortex between the vmPFC and dmPFC (imPFC).
- https://doi.org/10.7554/eLife.44939.020
Figure 4—figure supplement 1
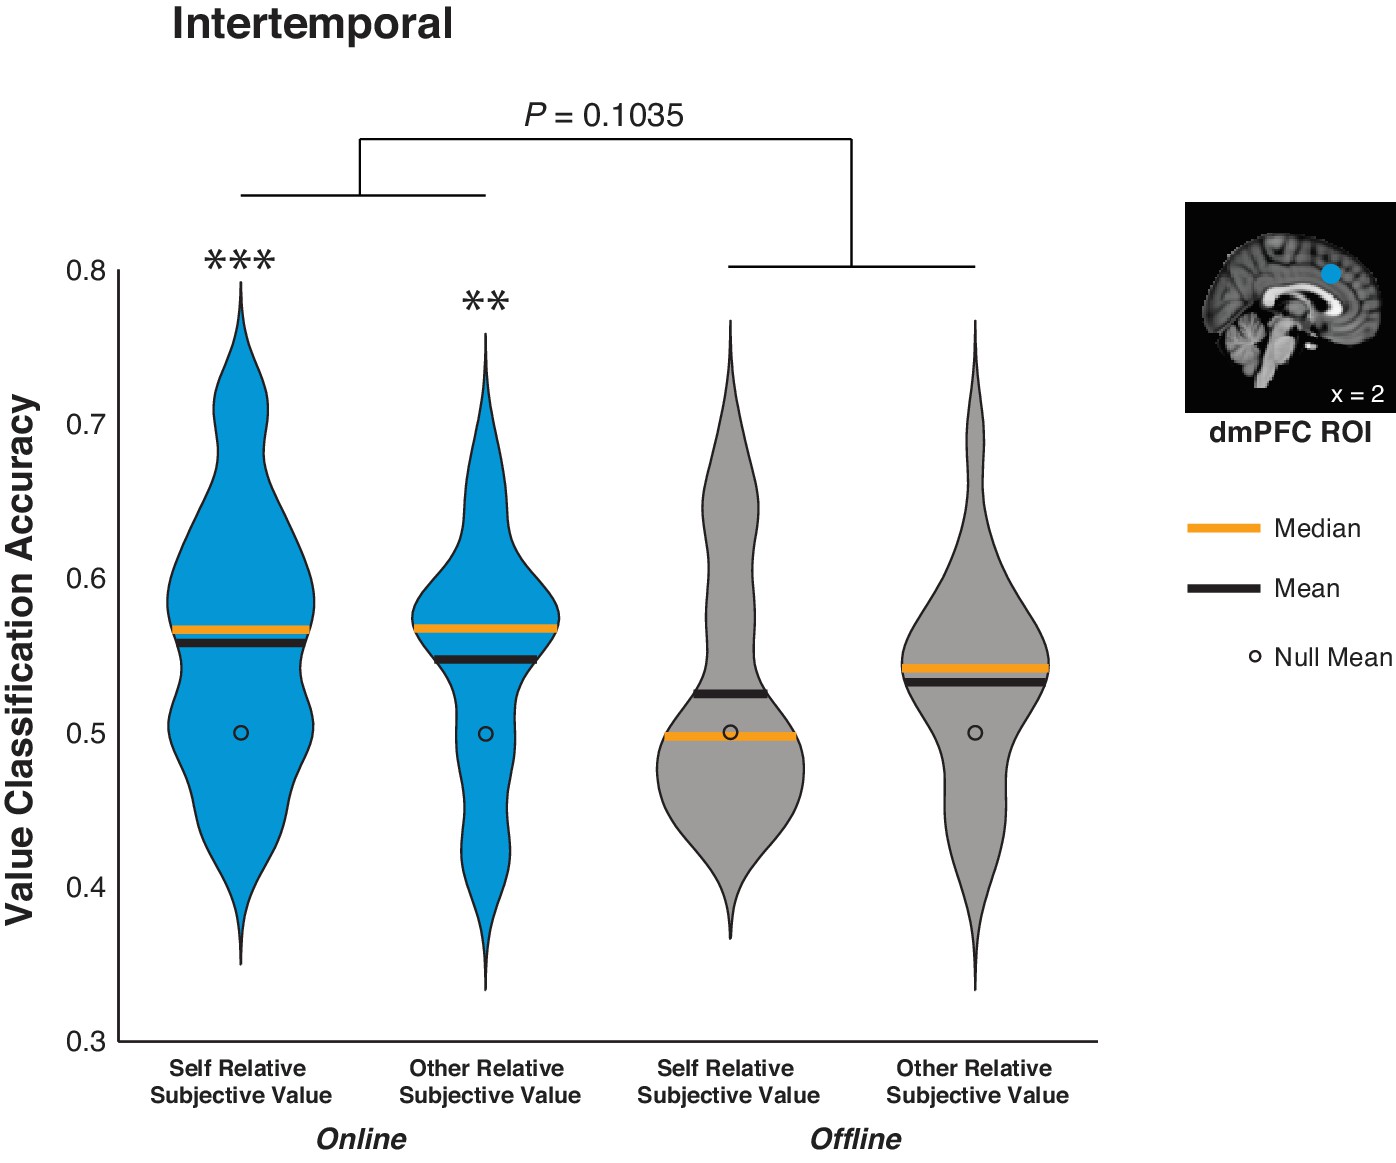
Dorsomedial prefrontal cortex (dmPFC) activity encodes online, but not offline, relative subjective value in the intertemporal choice task.
Decoding accuracy of pattern classifiers trained using dmPFC activity data from Self and Other trials. Blue plots indicate online relative subjective value, whereas gray plots indicate offline relative subjective value. Plots indicate the full distribution of data using a kernel density estimation with a bandwidth of 0.025 applied to all plots. The orange horizontal line indicates the median of a distribution, the black horizontal line indicates the mean of a distribution, and the black dot indicates the mean of the corresponding empirically derived null distribution. Inset shows the spherical ROI for the dmPFC (blue) based on prior studies. ** indicates p<0.01, *** indicates p<0.005, permutation test. Individually listed p-value was determined by a comparison in the decoding accuracy for the online versus offline relative subjective value analyses via Friedman test. N = 20 participants.
Figure 4—figure supplement 2
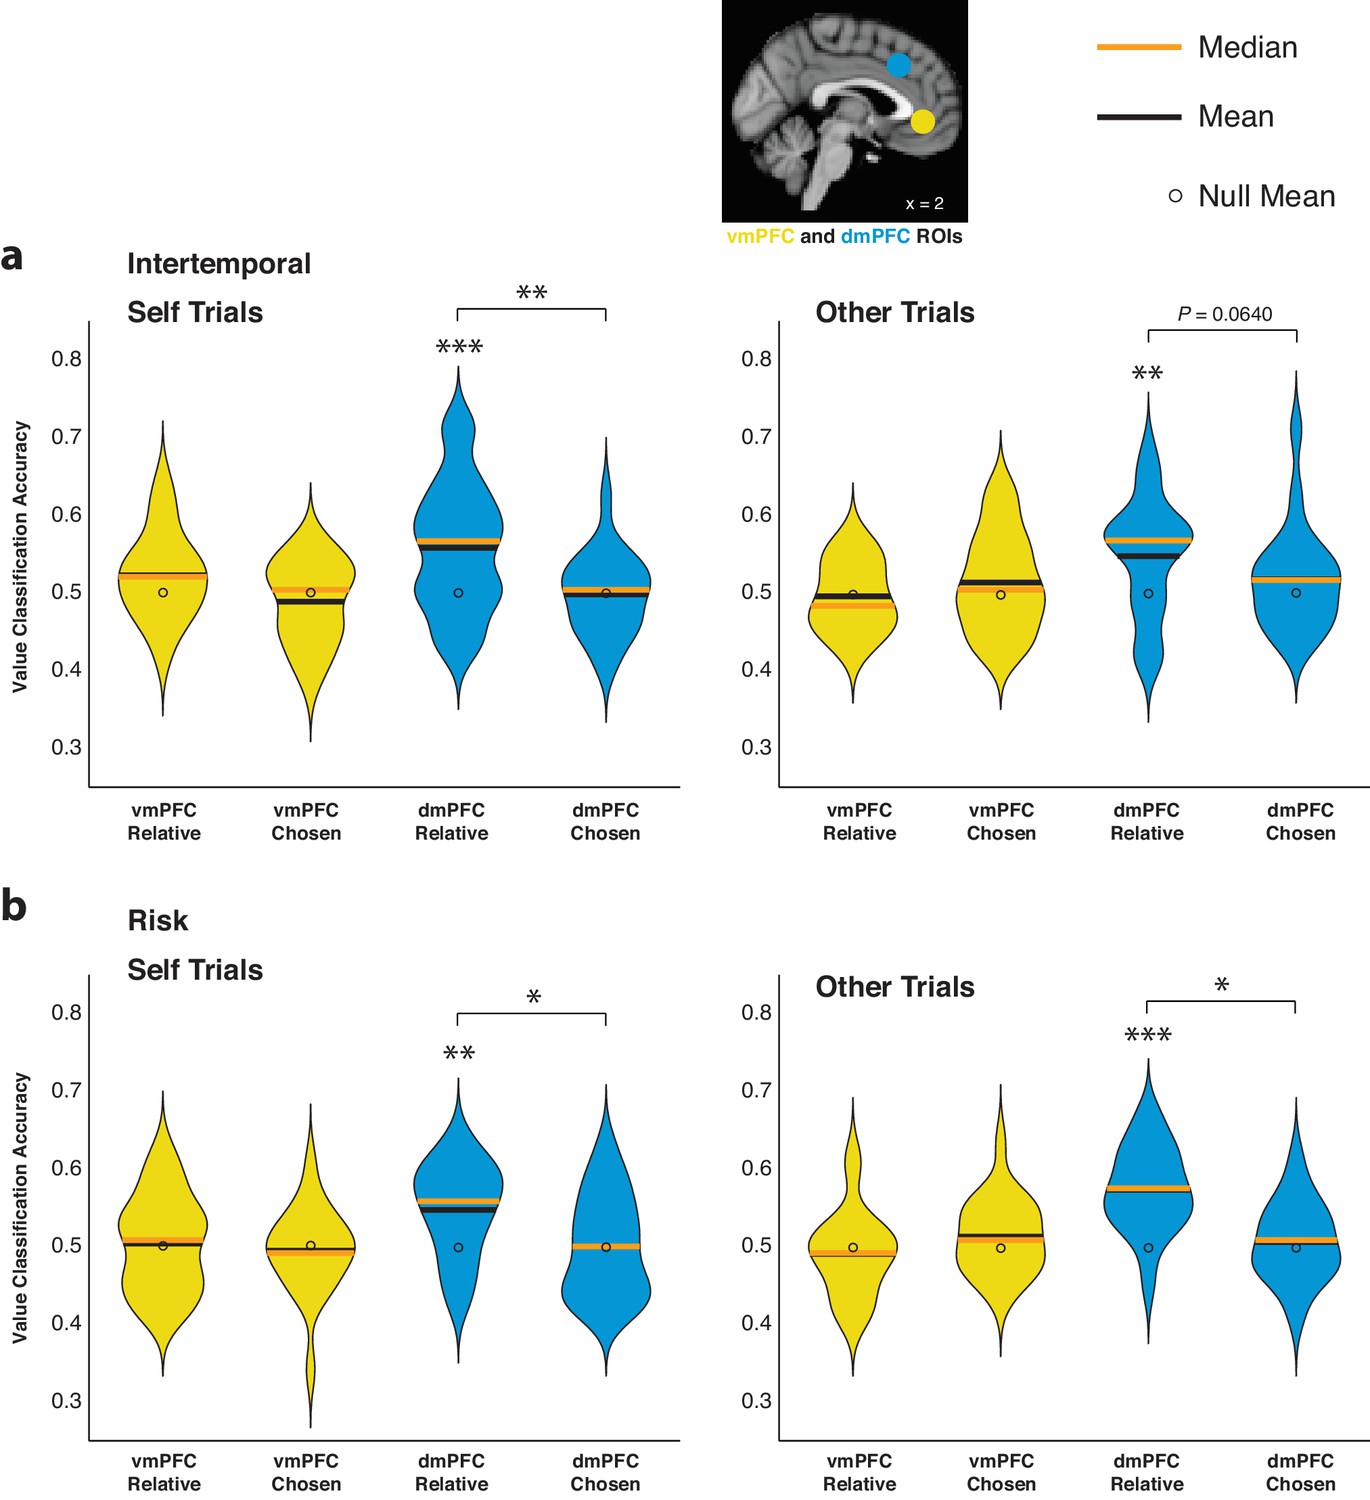
Dorsomedial prefrontal cortex (dmPFC) activity encodes relative subjective value, but not the absolute subjective value of the chosen option.
(a,b) Decoding accuracy of pattern classifiers trained on data from Self (left) and Other (right) trials from either the ventromedial prefrontal cortex (vmPFC; yellow) or dmPFC (blue) for either relative subjective value (Relative; chosen – unchosen value) or the absolute subjective value of the chosen option (Chosen). The intertemporal choice paradigm is shown in (a) with the risky choice paradigm shown in (b). Plots indicate the full distribution of data using a kernel density estimation with a bandwidth of 0.025 applied to all plots. The orange horizontal line indicates the median of a distribution, the black horizontal line indicates the mean of a distribution, and the black dot indicates the mean of the corresponding empirically derived null distribution. Inset shows the spherical ROIs for the vmPFC and dmPFC, defined based on previous studies. * indicates p<0.05, ** indicates p<0.01, *** indicates p<0.005, all p>0.05 are explicitly listed. Significance was determined either by a comparison to the null distribution via permutation test, or by a comparison in the decoding accuracy for the Relative versus Chosen analyses via Wilcoxon signed rank test. N = 20 participants for intertemporal choice, N = 21 participants for risky choice.
Figure 4—figure supplement 3
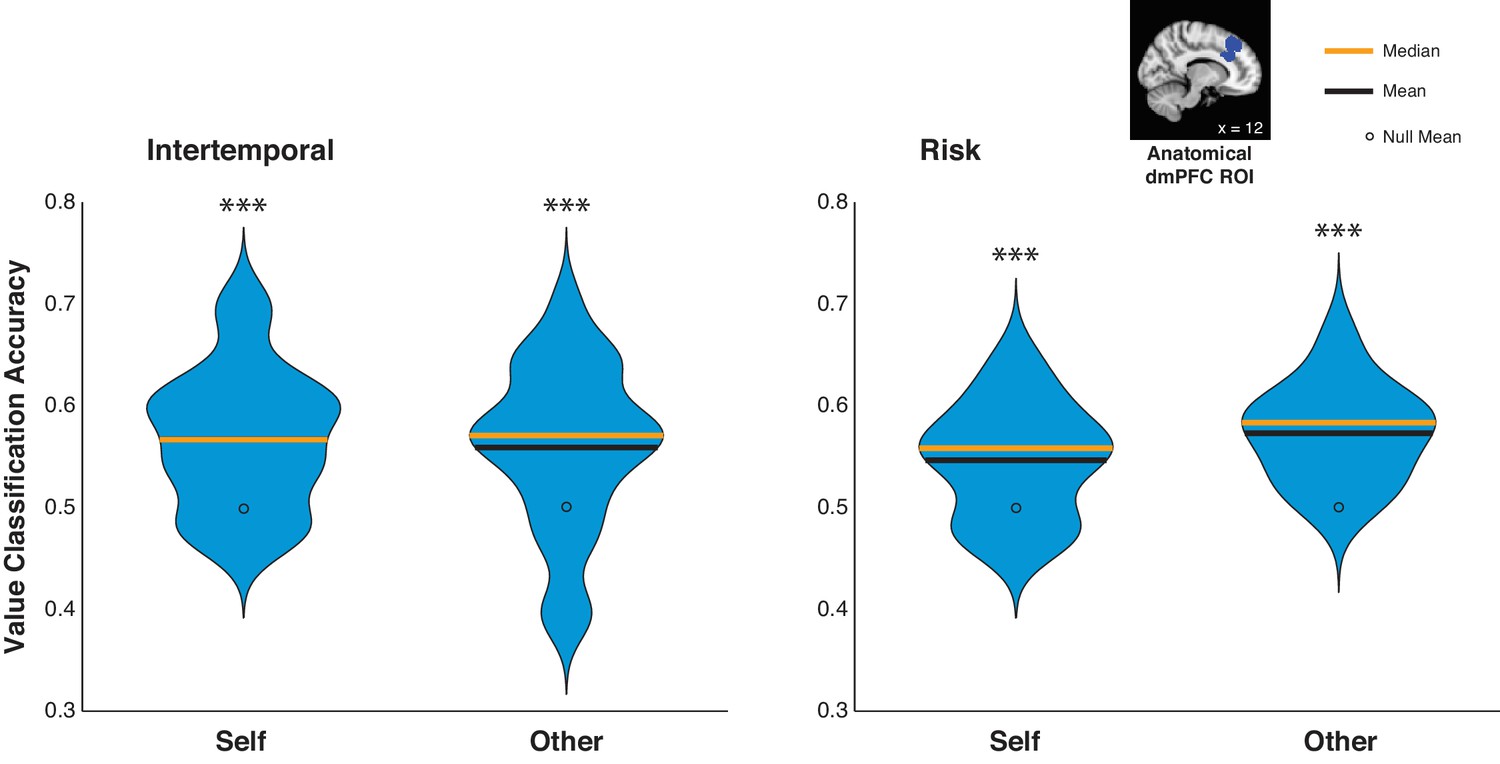
Activity in the anatomically defined dorsomedial prefrontal cortex (dmPFC) encodes relative subjective value.
Decoding accuracy of pattern classifiers trained on activity in the anatomically defined dmPFC for Self and Other trials from the intertemporal and risky choice tasks. Plots indicate the full distribution of data using a kernel density estimation with a bandwidth of 0.025 applied to all plots. The orange horizontal line indicates the median of a distribution, the black horizontal line indicates the mean of a distribution, and the black dot indicates the mean of the corresponding empirically derived null distribution. Inset shows the anatomically defined ROI for the dmPFC. *** indicates p<0.005, permutation test. N = 20 participants for intertemporal choice, N = 21 participants for risky choice.
Figure 5
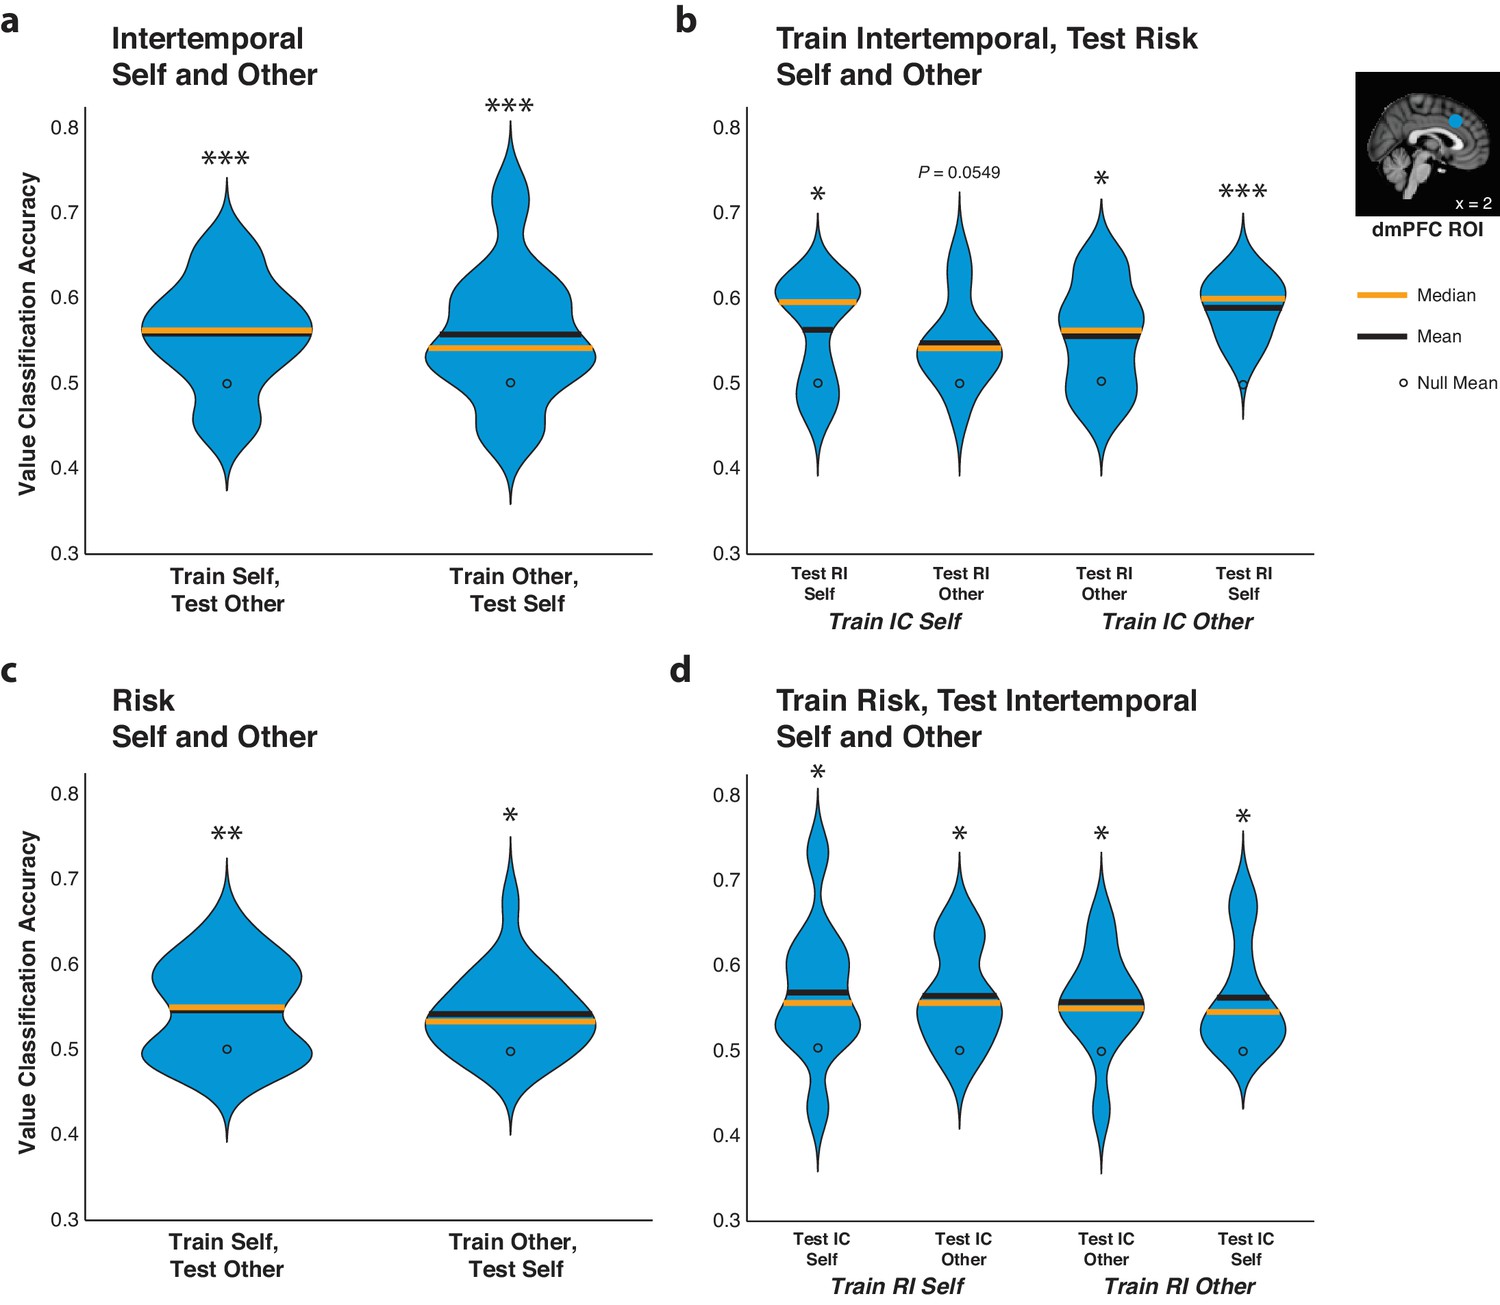
The code for relative subjective value in the dorsomedial prefrontal cortex (dmPFC) retains information over agents and contexts.
(a,c) Agency generalizability. Decoding accuracy of pattern classifiers trained on dmPFC data from Self trials and tested on dmPFC data from Self or Other trials as well as pattern classifiers trained on dmPFC data from Other trials and tested on dmPFC data from Self or Other trials for both the intertemporal (top) and risky (bottom) choice paradigms. (b,d) Paradigm generalizability. Decoding accuracy of pattern classifiers trained on dmPFC data from Self or Other trials in the intertemporal choice (IC) task and tested on dmPFC data from Self or Other trials in the risky choice (RI) task (top) or tested on data from the RI task and tested on data from the IC task (bottom). Plots indicate the full distribution of data using a kernel density estimation with a bandwidth of 0.025 applied to all plots. The orange horizontal line indicates the median of a distribution, the black horizontal line indicates the mean of a distribution, and the black dot indicates the mean of the corresponding empirically derived null distribution. Inset shows anatomical location of the 8 mm spherical dmPFC ROI. * indicates p<0.05, ** indicates p<0.01, *** indicates p<0.005, all p>0.05 are explicitly stated, permutation test. N = 20 participants for intertemporal choice, N = 21 participants for risky choice, N = 10 for (c) and (d) in which data were trained on intertemporal and tested on risk, and vice versa.
-
Figure 5—source data 1
MVPA significance for online relative subjective value analyses across agents and tasks.
Analysis types include training on Self and testing on Other trials, and vice versa, with the intertemporal and risky choice tasks. Also included are analyses training pattern classifiers on either intertemporal Self or Other trials and testing them on risk Self or Other trials, and vice versa. All pattern classifiers in this table were trained on data from the dorsomedial prefrontal cortex (dmPFC) 8 mm spherical region of interest.
- https://doi.org/10.7554/eLife.44939.022
Figure 6 with 2 supplements
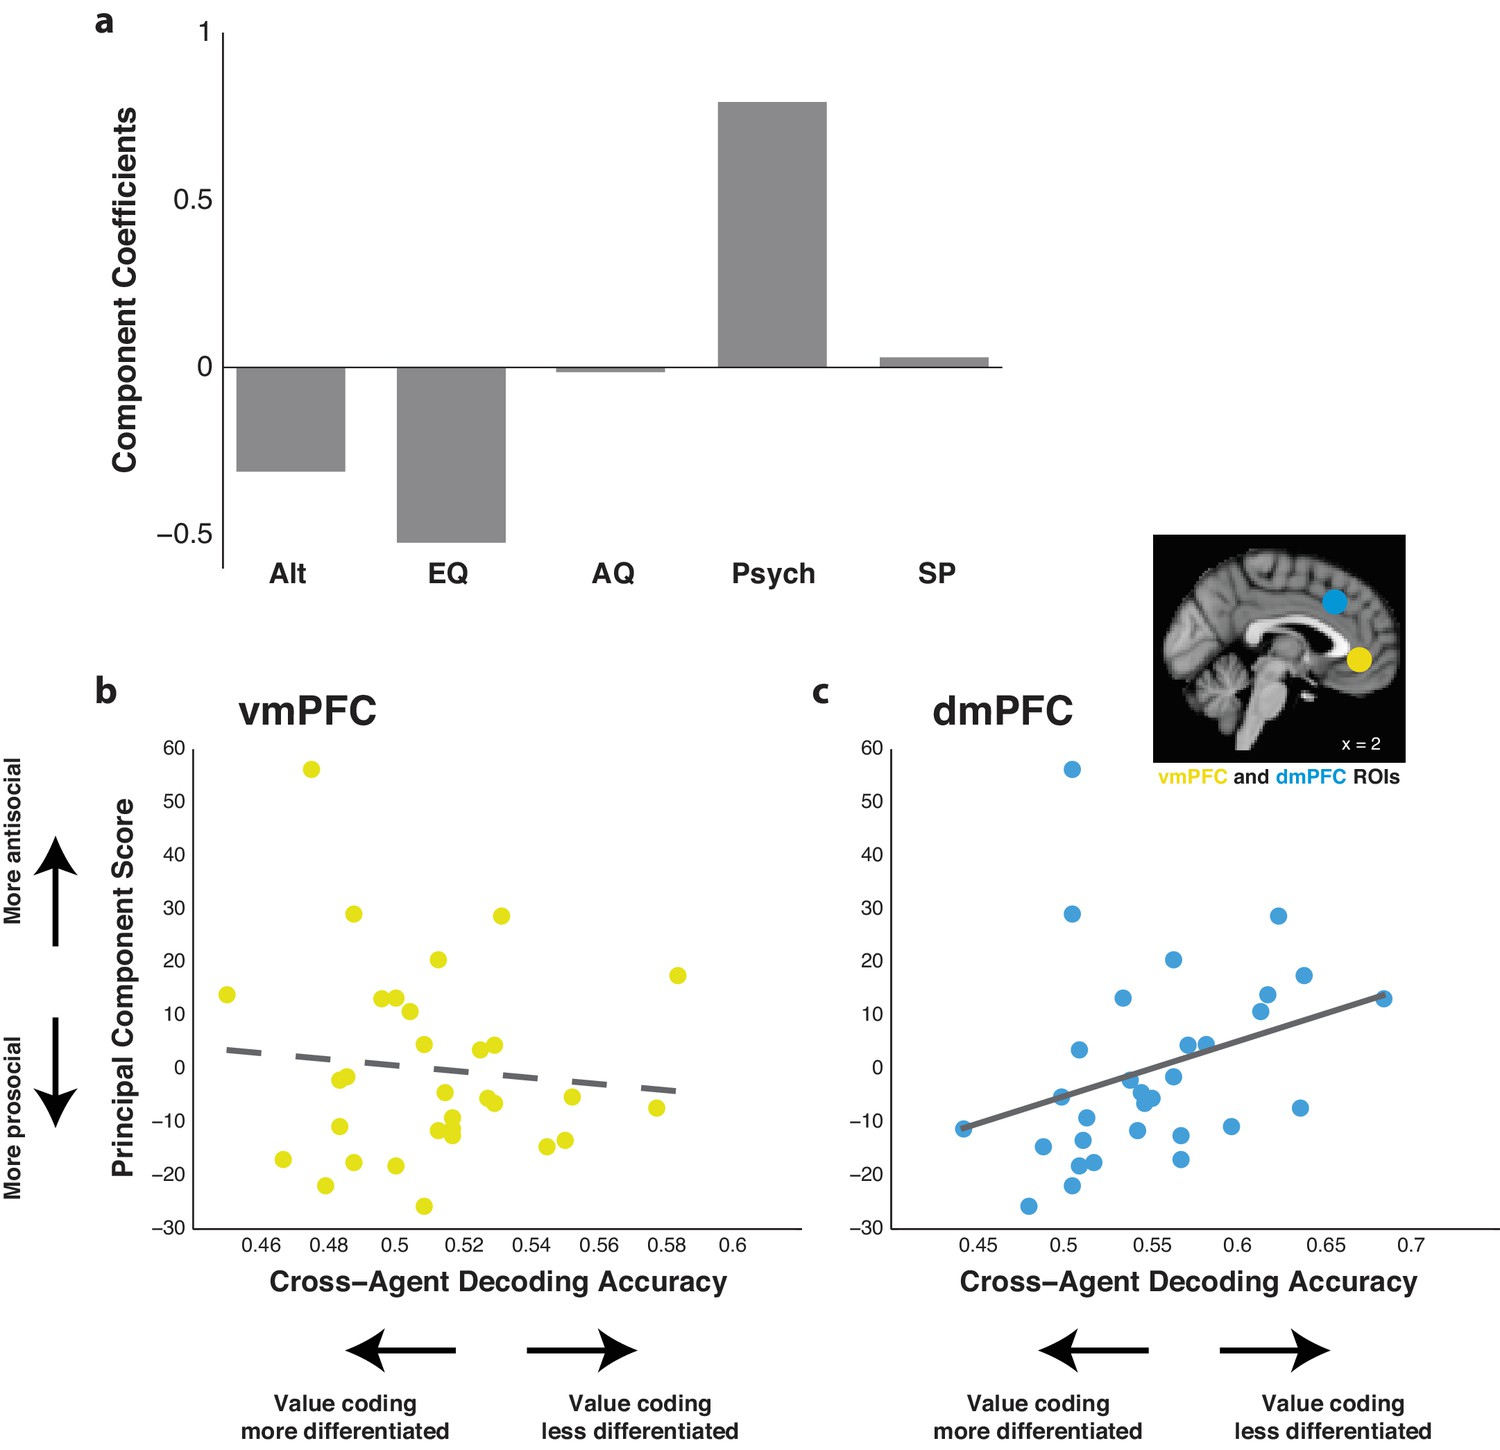
Agent cross-decoding of relative subjective value classifiers trained on dorsomedial prefrontal cortex (dmPFC) activity correlates with social attitudes.
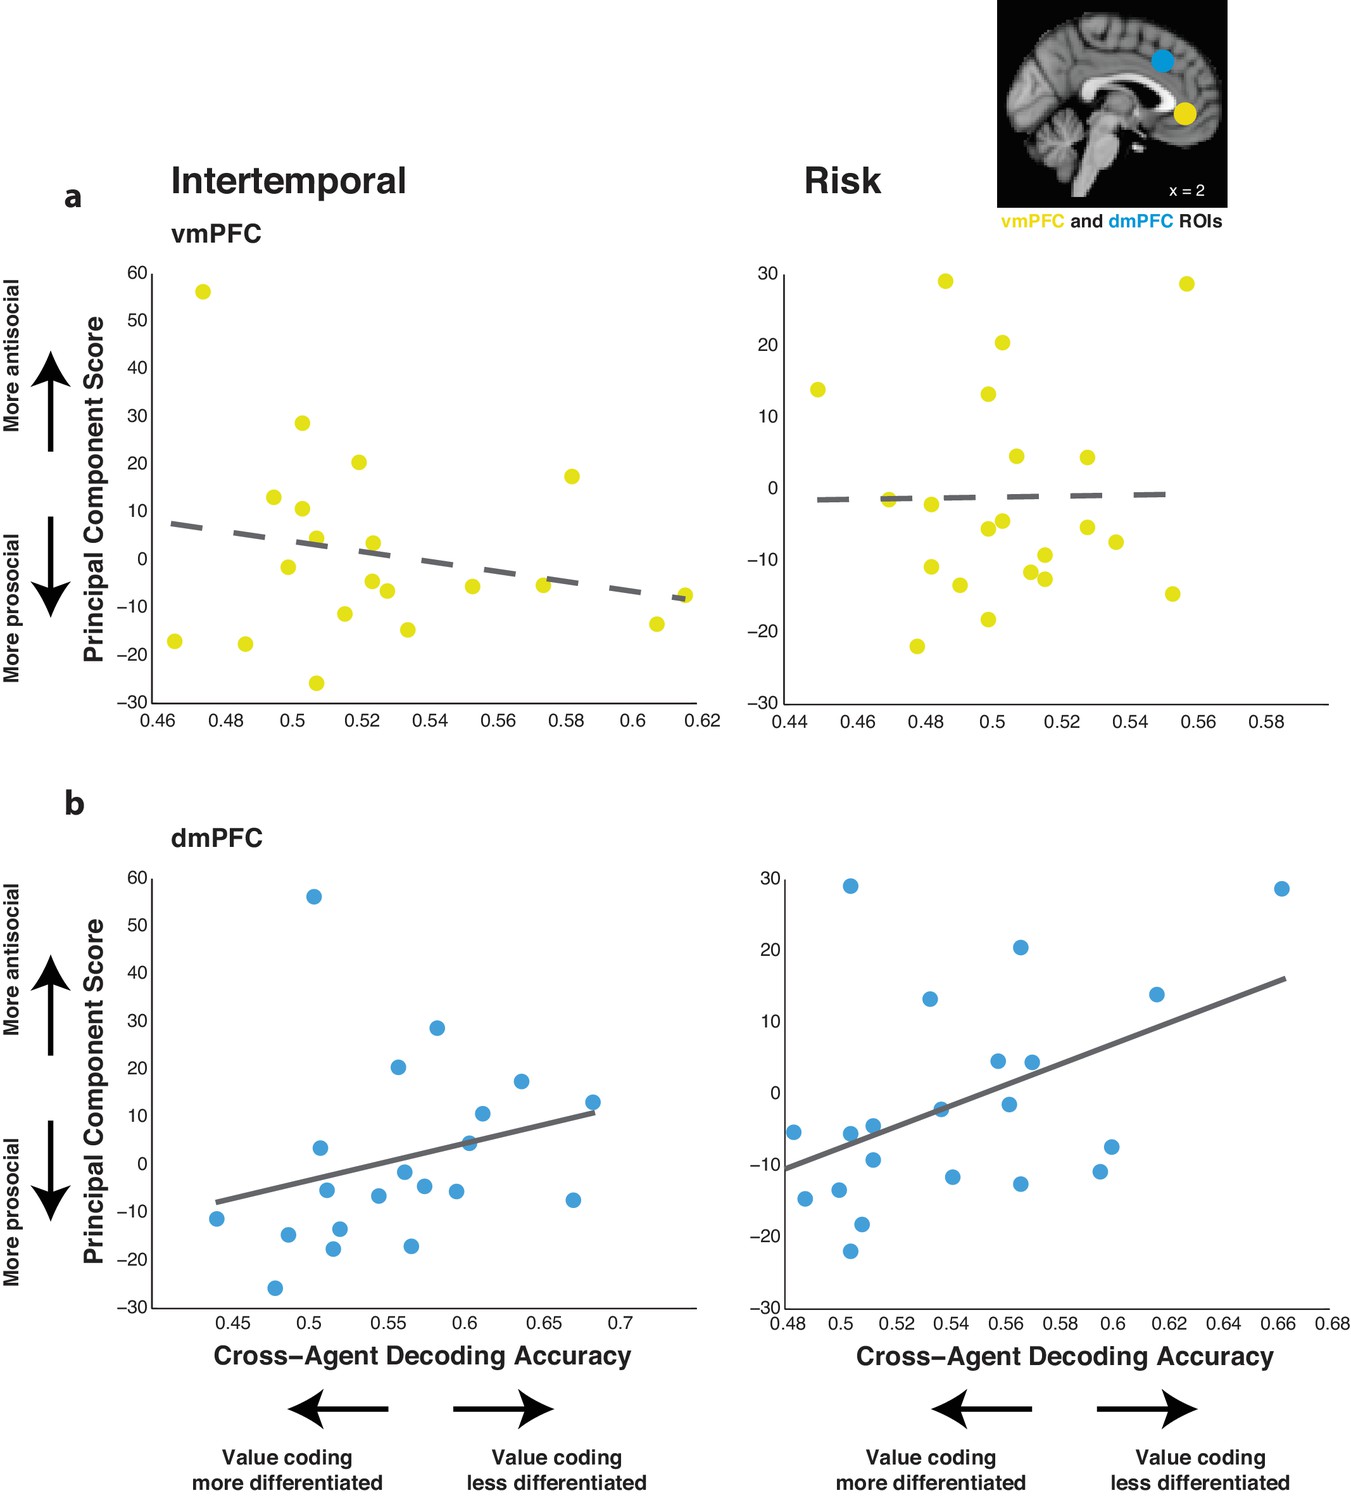
(a) Component coefficients of the first principal component score across self-reported measures for altruism (Alt), empathy quotient (EQ), autism quotient (AQ), psychopathy (Psych), and social phobia (SP). (b,c) Correlation between the first principal component score and the agent cross-decoding accuracy of relative subjective value of classifiers trained on data from a given ROI. For participants who completed both intertemporal and risky choice sessions, cross-decoding accuracy was averaged. Higher principal component scores indicate higher antisocial attitudes. Higher cross-decoding accuracy indicates that participants’ value codes for Self and Other trials were less differentiated. The ventromedial prefrontal cortex (vmPFC; b) did not yield a significant correlation, noted by the dotted trend line. However, the dmPFC (c) yielded a significant correlation, noted by the solid line (r = 0.403, p=0.025, Spearman’s correlation with significance verified via permutation test). Inset shows the anatomical location of the 8 mm spherical ROIs for the vmPFC (yellow) and dmPFC (blue). N = 31 participants for all correlations.
Figure 6—figure supplement 1
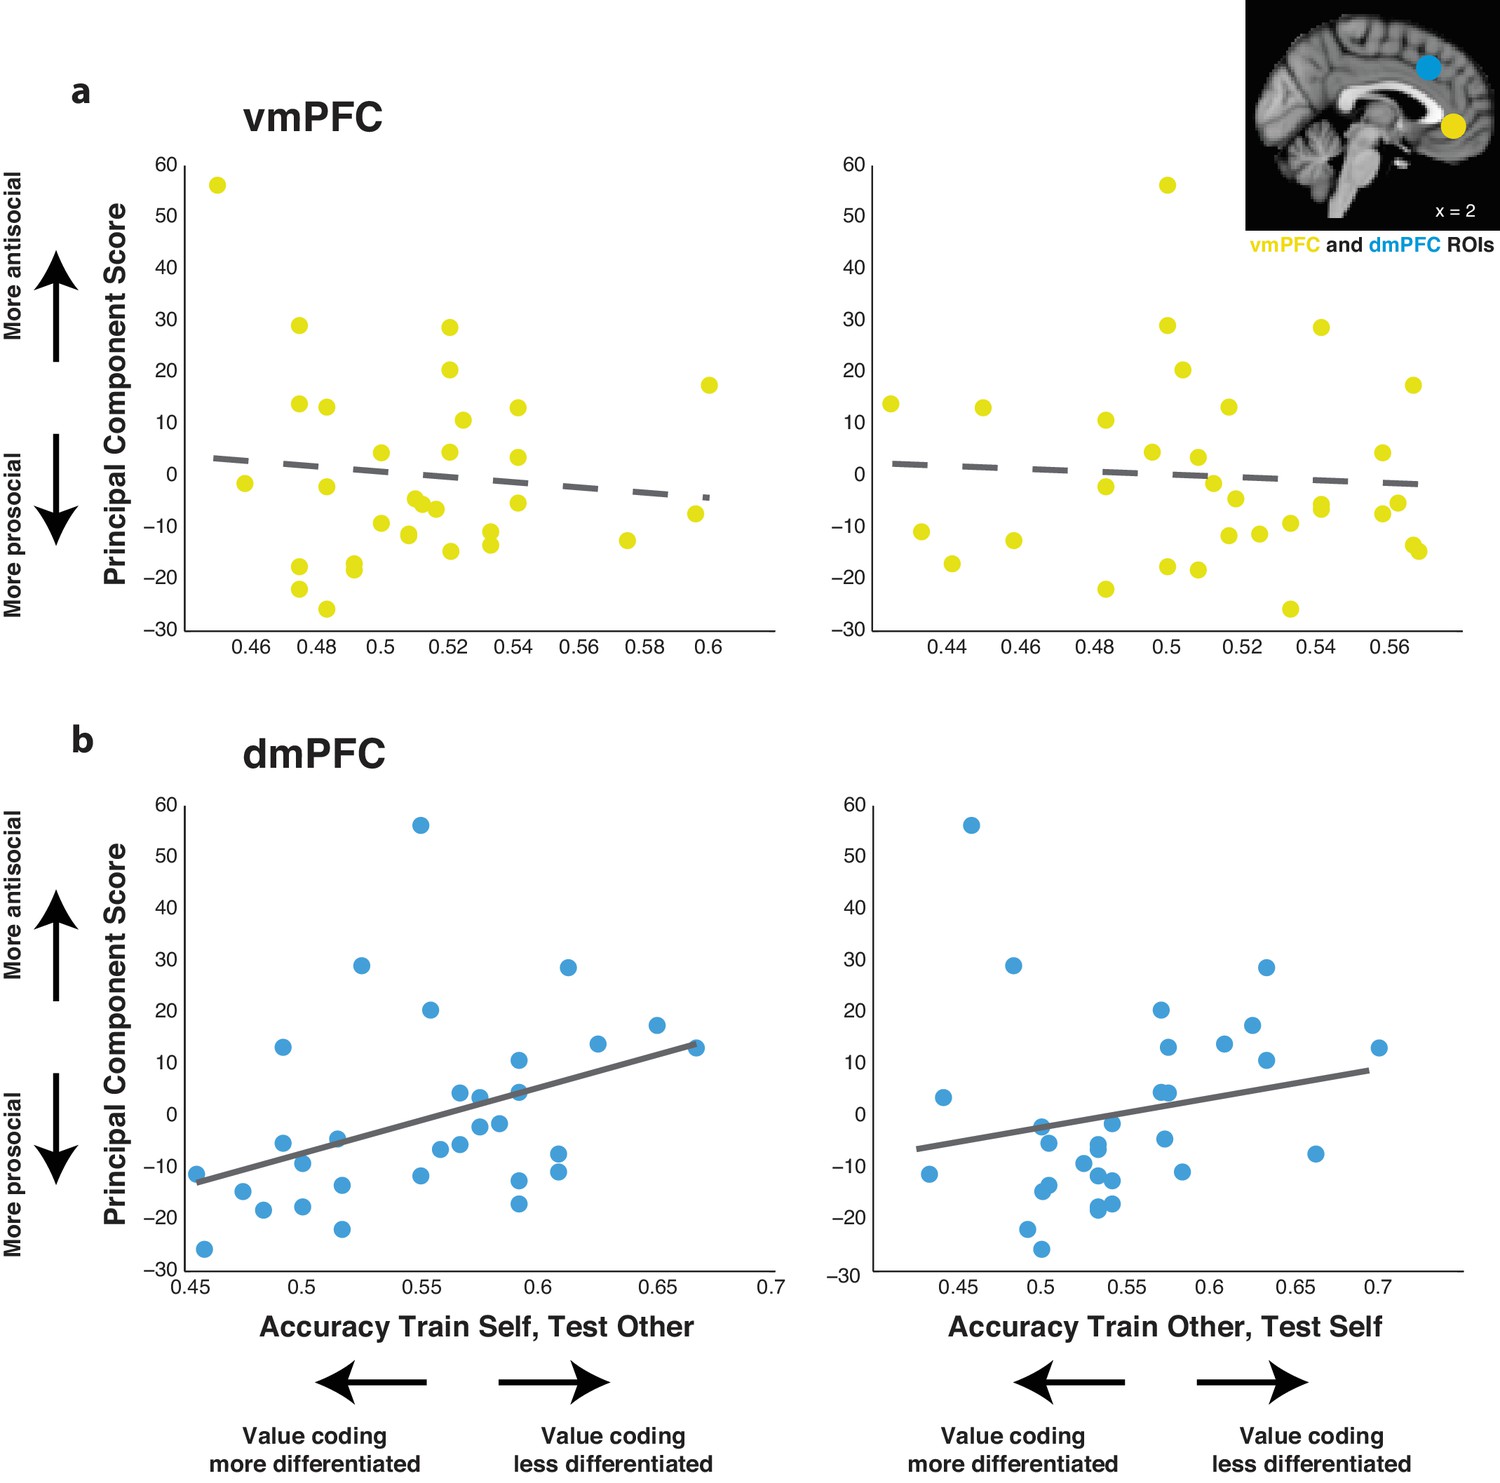
Social attitudes correlate with cross-decoding accuracy for both training on Self trials and testing on Other trials, and vice versa, in the dorsomedial prefrontal cortex (dmPFC).
Correlation between the first principal component score, corresponding to antisocial attitudes as determined by a battery of questionnaires, and the accuracy of a classifier trained on ventromedial prefrontal cortex (vmPFC; a) or dmPFC (b) activity to decode relative subjective value across agents. Training on Self trials and testing on Other trials is shown to the left, whereas training on Other trials and testing on Self trials is shown to the right. For participants who completed both intertemporal and risky choice sessions, cross-decoding accuracy was averaged. Higher principal component scores indicate higher antisocial attitudes. Higher cross-decoding accuracy indicates that participants’ value codes for Self and Other trials were less distinct. Inset shows the location of the spherical ROIs for the vmPFC (yellow) and dmPFC (blue), determined from previous studies. The dotted lines indicate that no correlations were observed, while the solid lines indicate that at a minimum a trend toward a correlation was observed (for train Self test Other r = 0.453, p=0.011; for train Other test Self r = 0.341, p=0.061, Spearman correlation). N = 31 participants for all correlations.
Figure 6—figure supplement 2
Agent cross-decoding of relative subjective value classifiers trained on dorsomedial prefrontal cortex (dmPFC) activity correlates with social attitudes separately for both the intertemporal and risky choice tasks.
(a,b) Correlation between the first principal component score and the agent cross-decoding accuracy of relative subjective value of classifiers trained on data from a given ROI for the intertemporal (left) and risky (right) choice task. Higher principal component scores indicate higher antisocial attitudes. Higher cross-decoding accuracy indicates that participants’ value codes for Self and Other trials were less distinct. The ventromedial prefrontal cortex (vmPFC; a) did not yield a significant correlation for either paradigm, noted by the dotted trend lines. However, the dmPFC (b) yielded a trend toward a correlation in both paradigms, noted by the solid lines (intertemporal r = 0.415, p=0.070; risk r = 0.423, p=0.056, Spearman correlation). Inset shows the anatomical location of the 8 mm spherical ROIs for the vmPFC (yellow) and dmPFC (blue). N = 20 participants for intertemporal choice, N = 21 participants for risky choice.
Author response image 1
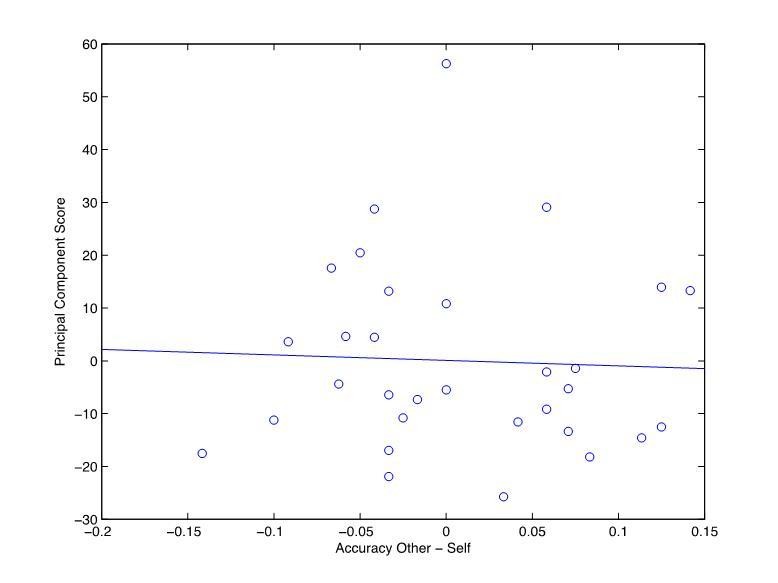
Correlation between dmPFC accuracy in Other trials minus Self trials and self-reported social attitudes principal component score.
Author response image 2
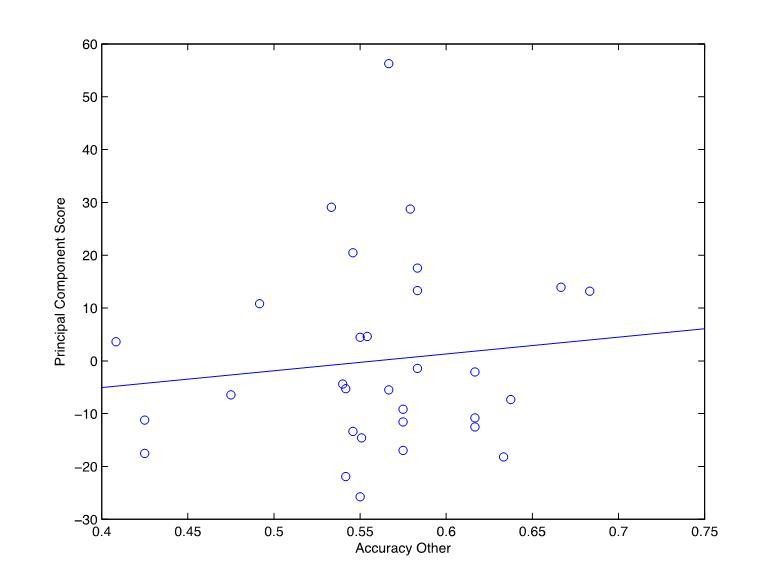
Correlation between dmPFC accuracy in Other trials and self-reported social attitudes principal component score.
Author response image 3
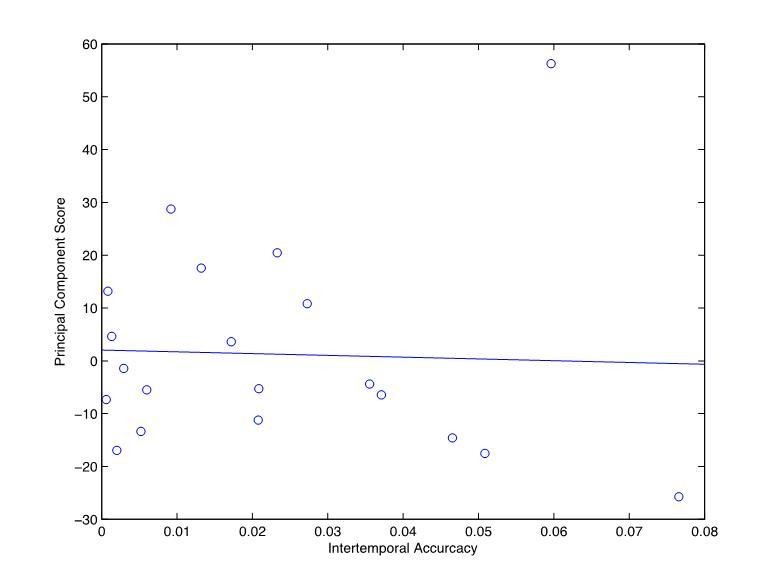
Correlation between correspondence of choice behavior with partner preferences and self-reported social attitudes principal component score for the intertemporal choice task.
Author response image 4

Correlation between correspondence of choice behavior with partner preferences and self-reported social attitudes principal component score for the risky choice task.
Additional files
-
Transparent reporting form
- https://doi.org/10.7554/eLife.44939.026
Download links
A two-part list of links to download the article, or parts of the article, in various formats.
Downloads (link to download the article as PDF)
Open citations (links to open the citations from this article in various online reference manager services)
Cite this article (links to download the citations from this article in formats compatible with various reference manager tools)
The dorsomedial prefrontal cortex computes task-invariant relative subjective value for self and other
eLife 8:e44939.
https://doi.org/10.7554/eLife.44939


