Selective attenuation of Ether-a-go-go related K+ currents by endogenous acetylcholine reduces spike-frequency adaptation and network correlation
- Case Western Reserve University, United States
Figures
Figure 1 with 3 supplements
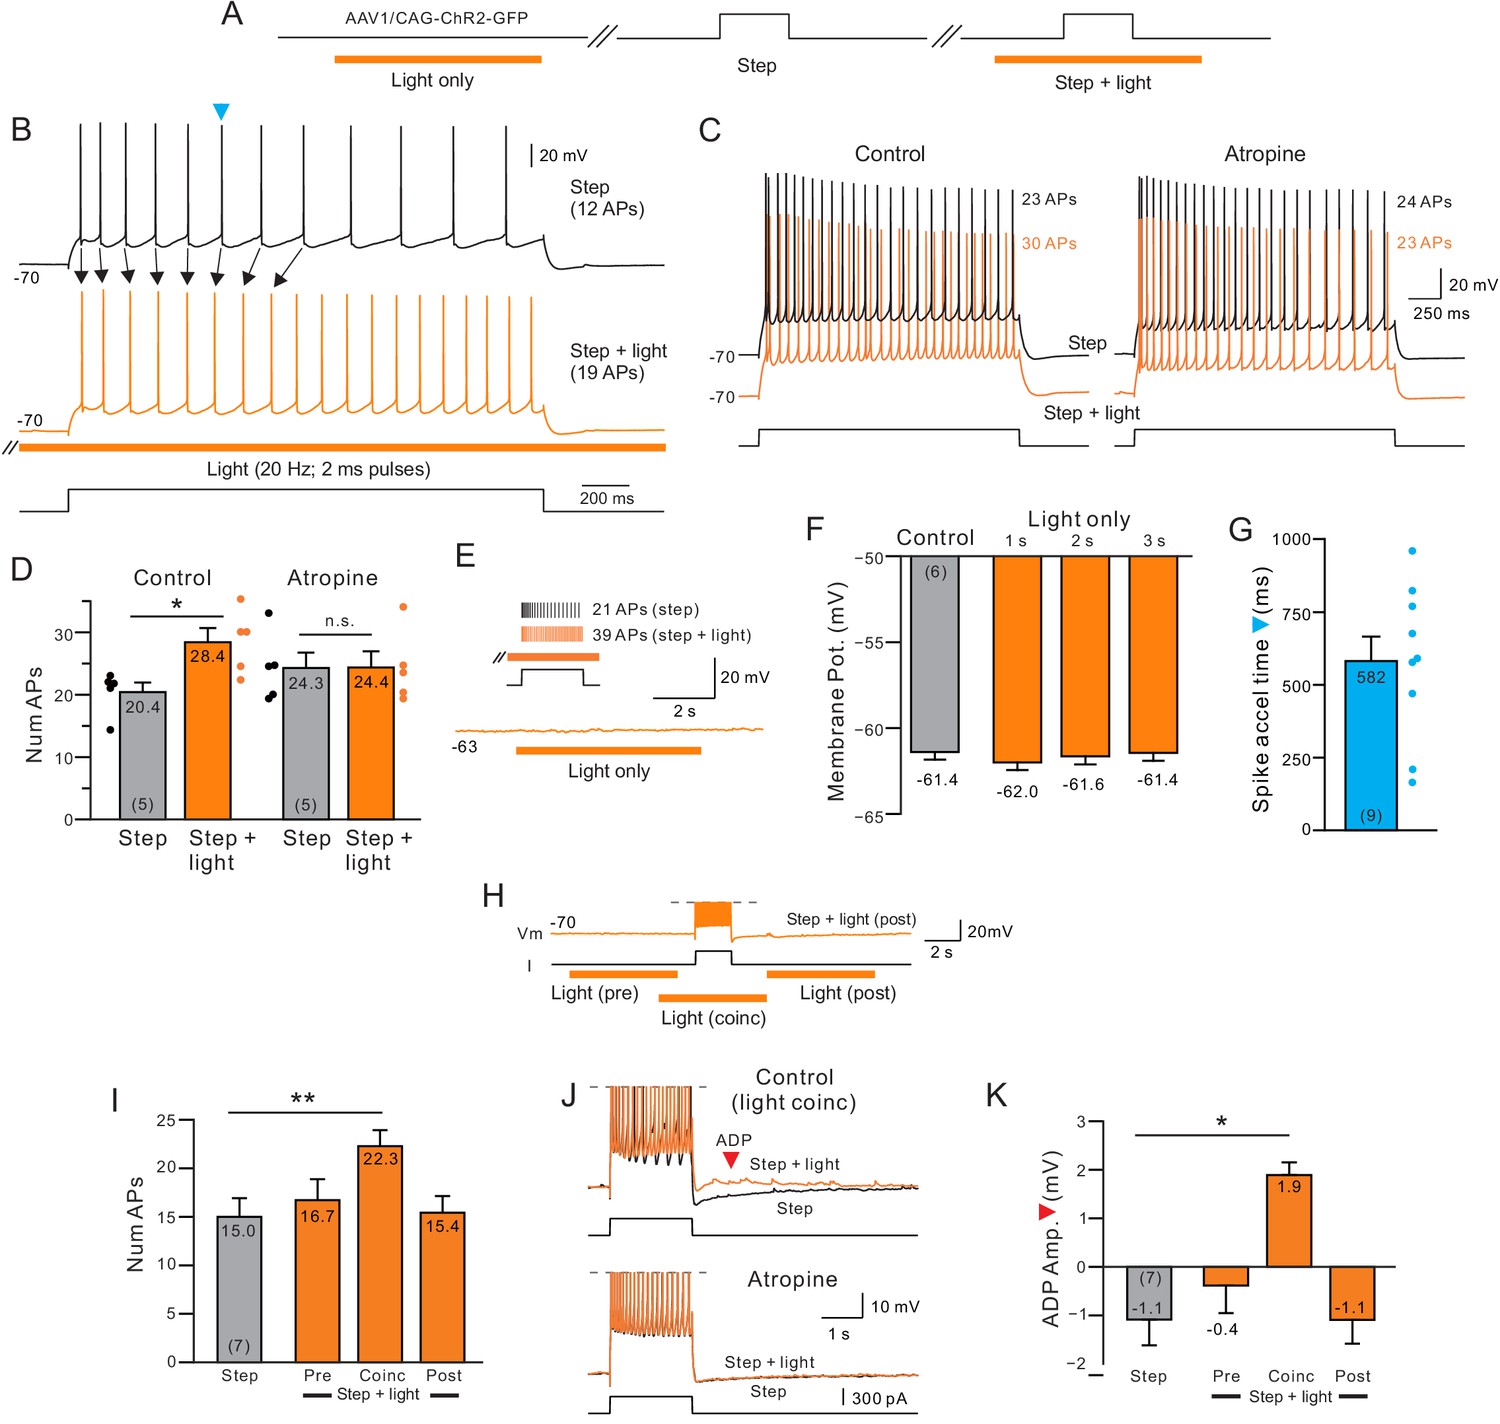
Delayed increase in intrinsic excitability following muscarinic receptor activation by endogenous acetylcholine.
(A) Diagram of experiment protocol; orange bar indicates timing of light pulses that trigger ACh release via ChR2. (B) Example step responses in control conditions (black trace) and when ACh was released 2 s before and during the step response (orange trace). Blue arrowhead indicates timing of first AP in the control step response that was accelerated when ACh was released (Quantified in G). (C) Blockade of muscarinic cholinergic receptors with 10 M atropine abolished the increase in excitability triggered by ACh release. Black traces acquired in control conditions; orange traces illustrate responses with coincident light stimulation to the same depolarizing step. (D) Summary of the average number of APs evoked by depolarizing steps in five experiments similar to C. *p=0.0106, T = 4.526; n.s., p=0.847, T = 0.206. paired t-test. (E) Example trace showing that ACh release in the absence of a depolarizing step does not modulate the membrane potential. Inset, in the same cell, pairing ACh release with depolarizing step increases the number of APs triggered. (F) Comparison of mean membrane potential in control conditions (black bar) and after different durations of light pulse trains only (orange bars; p>0.05; paired t-test). Experiments conducted on neurons in which coincident light trains increased the number of APs triggered by depolarizing steps. (G) Summary plot of the average time during similar step responses before an AP was accelerated (shorter latency for the Nth AP when ACh was released, compare B for example traces). (H) Example illustrating different light/step timing protocols. Response shown (orange trace) is from ‘post’ protocol. (I) Coincident ACh release is required to increase neuronal excitability. Plot of the number of APs evoked the same depolarizing step in control conditions (black bar) and when a 6 s light pulse train was applied 7 s before (Pre), 2 s before (Coinc) or 2 s after (Post) the depolarizing step. **p=0.00334, T = 5.8373; paired t-test, Bonferroni corrected. (J) Coincident ACh release and depolarizing step stimuli reveals an afterdepolarization potential (ADP; red arrowhead) that is abolished by 10 M atropine. Action potentials truncated. (K) Summary plot of the dependence of the ADP on coincident ACh release. Same light train/depolarizing step timing as G. *p=0.0219, T = 3.977; paired t-test, Bonferroni corrected. Plots are mean ± SEM unless noted throughout study.
Figure 1—figure supplement 1
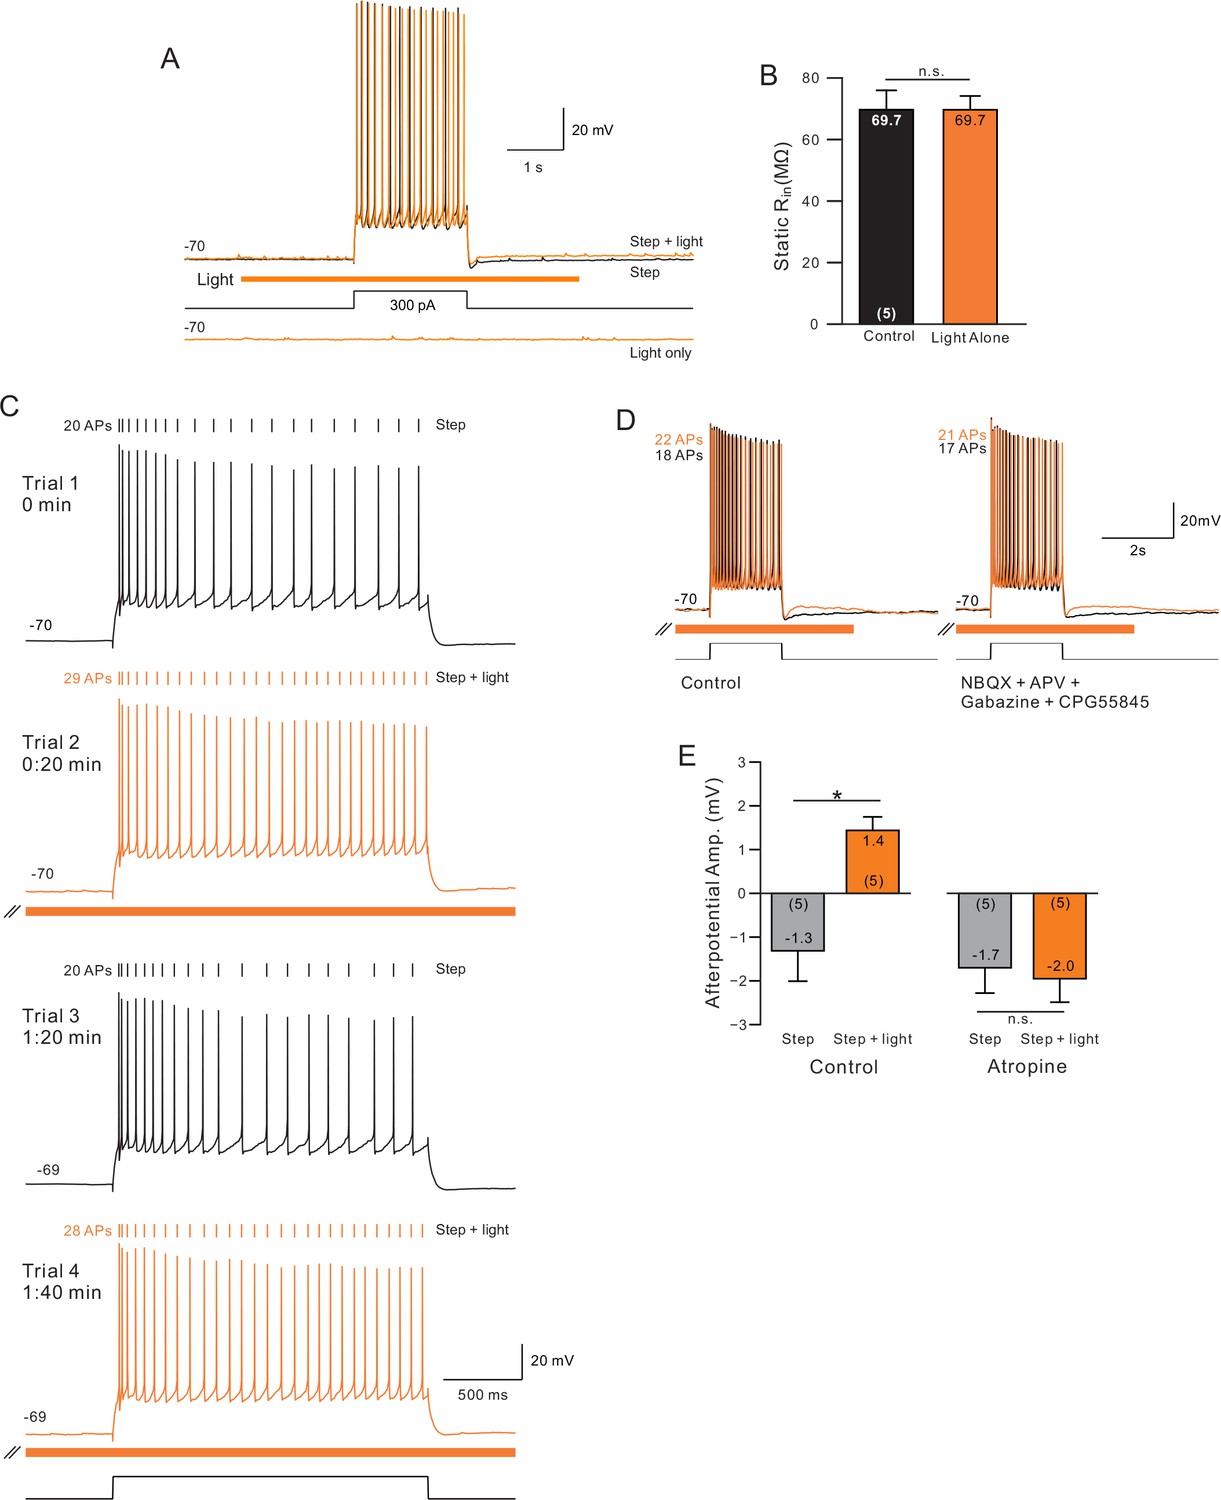
Control experiments for ChR2 stimulation.
(A) Superimposed traces showing step and step + light (top) and light-only (bottom) from one neuron. (B) By itself, ChR2 stimulation did not affect input resistance. (C) Demonstration rapid reversal of ChR2 enhancement of excitability (trial 3, second control episode). Subsequent ChR2 stim produced a similar enhancement in excitability (trial 4). (D) Increase in excitability and ADP responses were not affected by blockade of ionotropic glutamate and GABA-A/B receptors. (E) Blockade of mAChRs with atropine (10 uM) abolished afterdepolarization normally observed following pairing step + stimulation. *p<0.05.
Figure 1—figure supplement 2
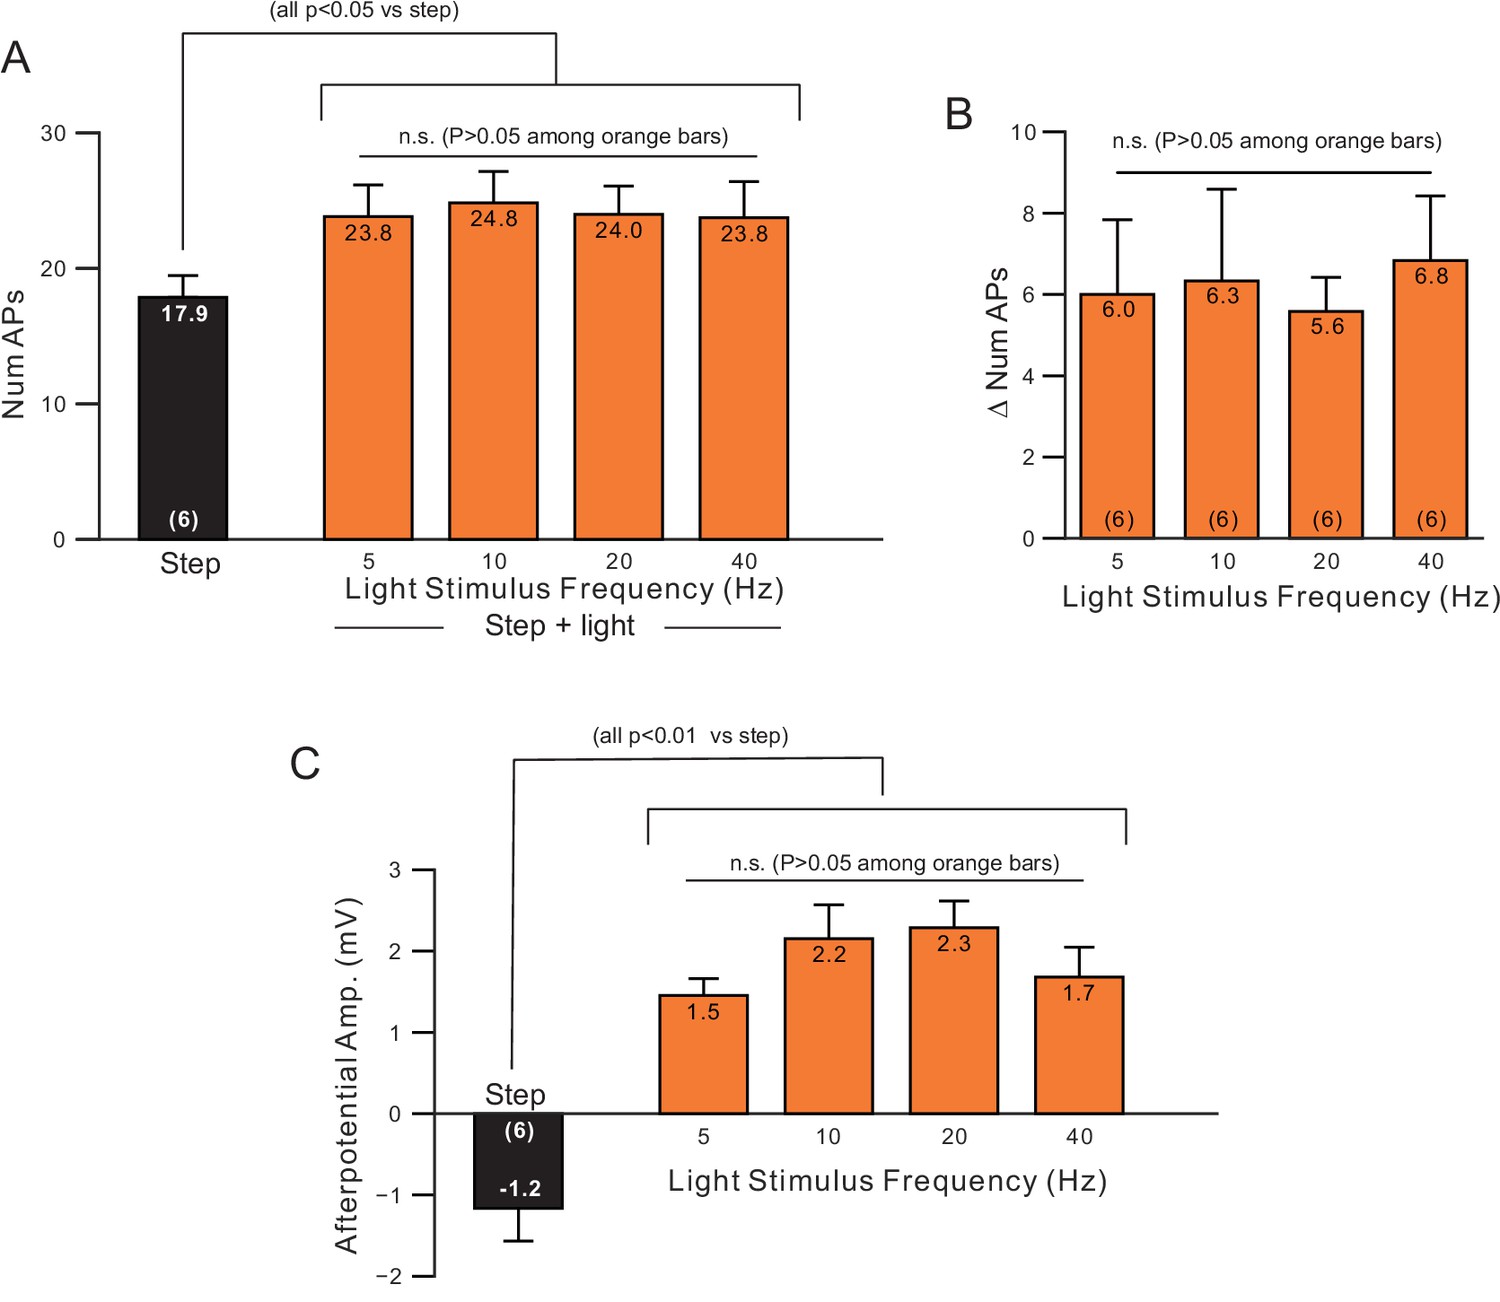
Minimal effect of changing light pulse frequency used to stimulate ChR2.
(A) Plot of number of APs in step only (black) and step + light conditions (orange) from the same neurons as light pulse frequency was varied from 5 to 40 Hz. (B) Plot of increase in number of APs (step plus light - step only) in the six experiments. (C) Plot of ADP amplitude versus light pulse frequencies in the same experiments.
Figure 1—figure supplement 3
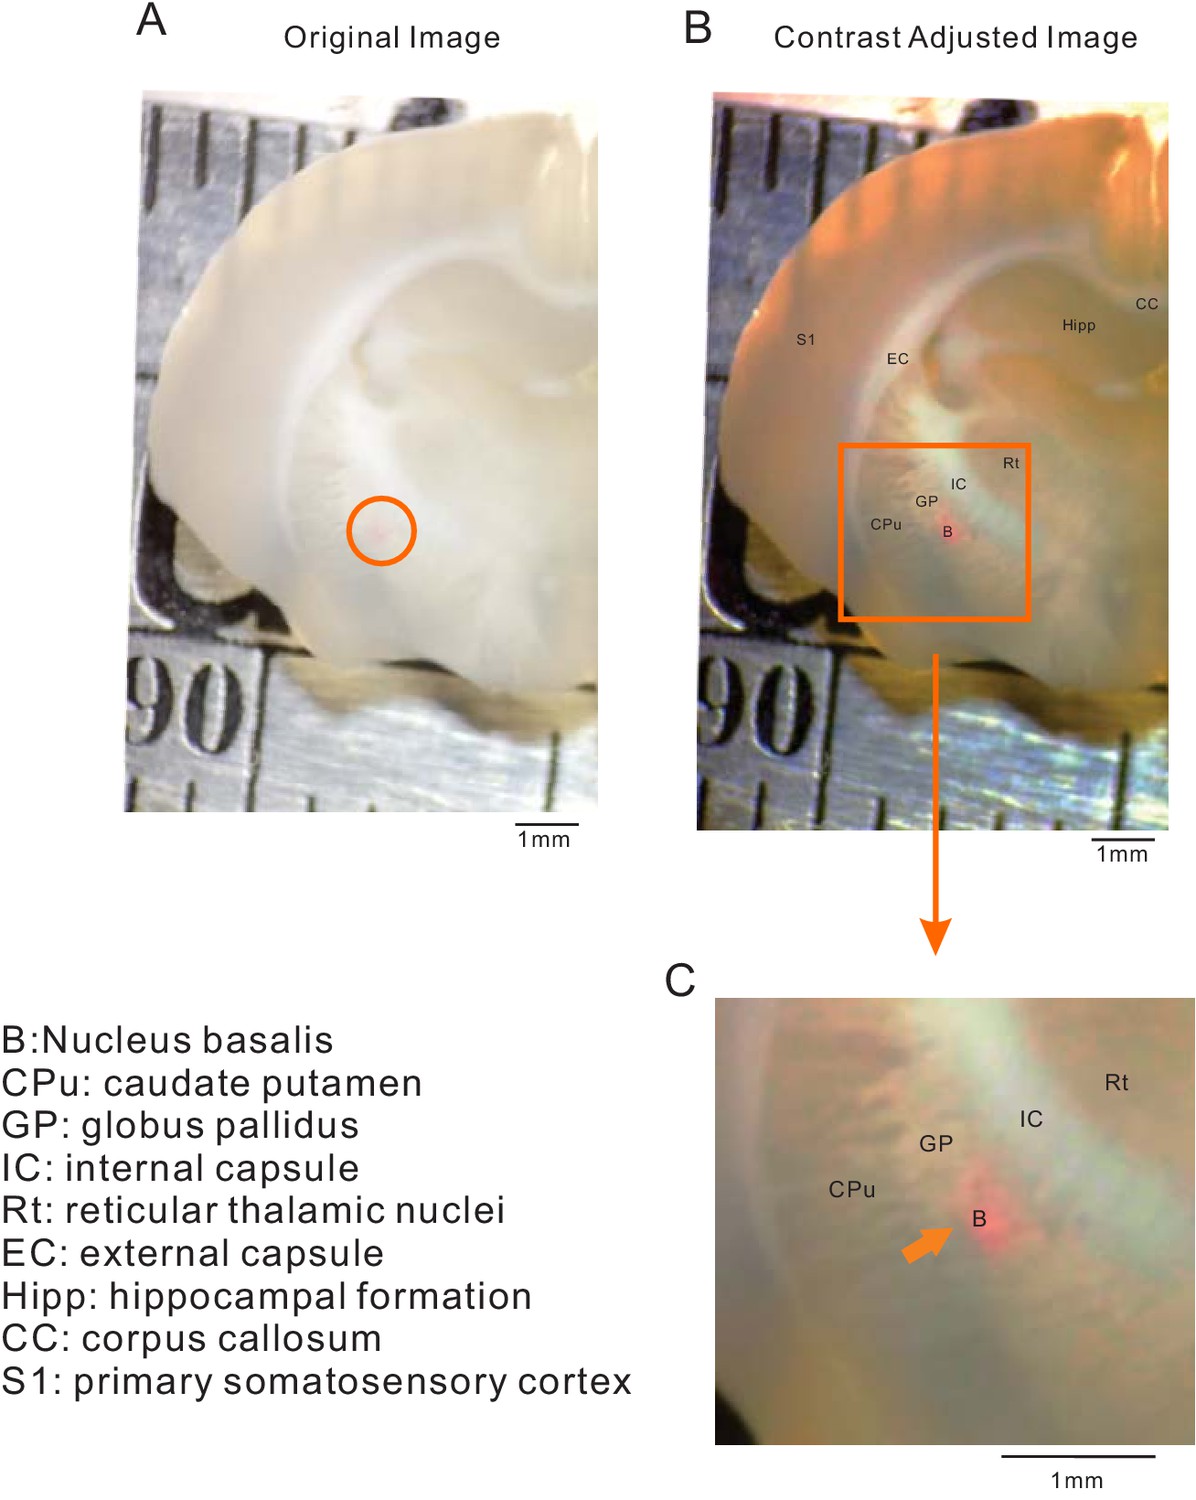
Calibration of stereotaxic coordinates used for AAV injections in NB.
(A) Raw low-power brightfield stereomicroscopic image of coronal brain section (P21 rat) with DiI (1 mM) injection site (interaural 7.28 mm; bregma −1.72 mm in Paxinos and Watson (2006). Contrasted-enhanced version of image shown in A with superposition of corresponding landmark annotations. (C) Enlargements of the boxed region in B centered on the NB (circled region in A). Anatomical landmark abbreviations defined to the left of panel C. Calibration bars are 1 mm in each image.
Figure 2 with 1 supplement
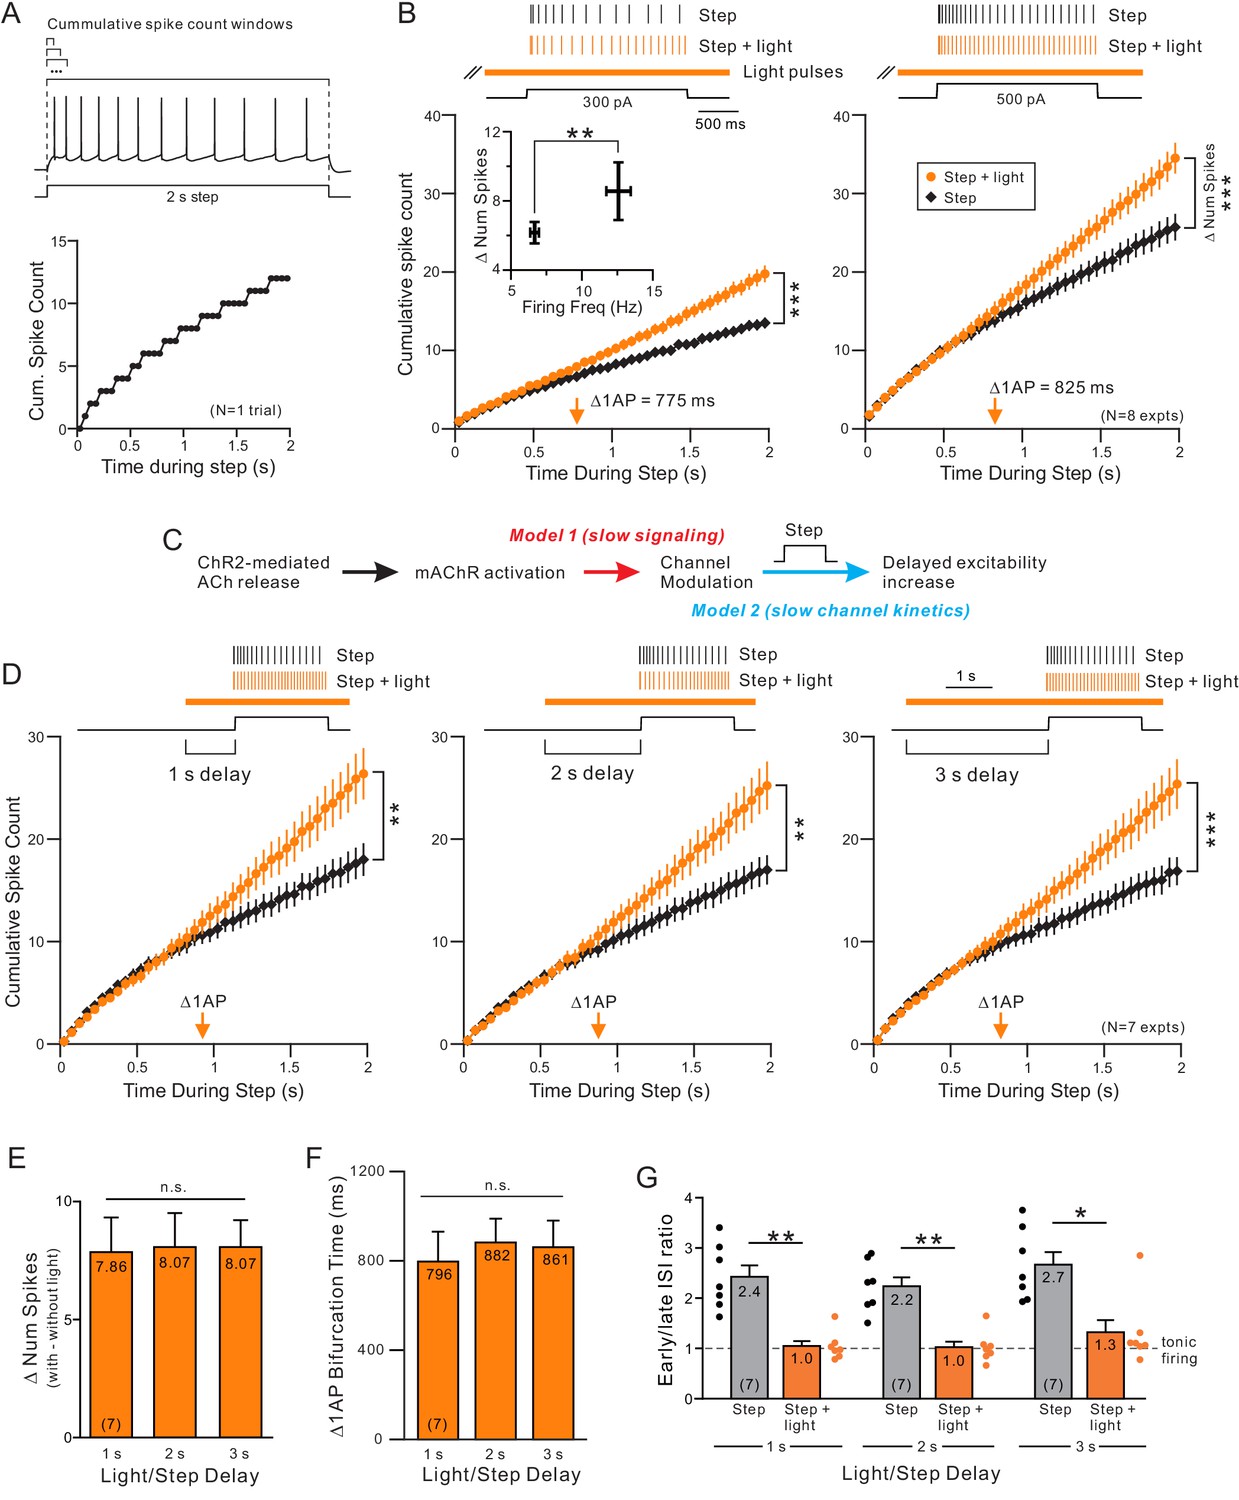
Endogenous ACh enhances excitability by attenuating a slow leak K+ current.
(A) Example step response illustrating increasing duration analysis windows (above trace) used to compute the cumulative spike count for that one response (bottom). (B) Coincident ACh increases neuronal excitability in response to different step amplitudes. Plot of the cumulative spike count across different durations of analysis windows for weak (left panel) and moderate (right panel) step amplitudes. Individual points represent mean ± SEM over eight experiments with typically three trials per experiment in control (black) and ACh release (orange, light pulse train initiated 2 s before step). Example spike discharges evoked by the same depolarizing step shown above plot with vertical lines indicating the timing of each AP relative to the step. The total number of APs evoked by the step (right-most points in summary plot) differed significantly in response to both weak and moderate step intensities; *** 300 pA steps (left); p=6.04E-5, T = 8.530; 500 pA steps (right): p=7.31E-6, T = 11.754; both paired t-test. Inset: The increase in number of spikes between step and step + light vs. firing frequency during step only. *p=0.0130, T = 3.304, paired t-test. Orange arrow near X axis indicates time within depolarizing step responses when ACh increased the average cumulative spike count by 1 AP. The same analysis format was used in B, D, and in subsequent figures. (C) Diagram illustrating two potential mechanisms to explain long delay before ACh enhances neuronal excitability. The critical signaling event triggered by muscarinic receptors could be slow (red text), resulting in the ~ 700–900 ms delay, or the delay could reflect slow intrinsic kinetics of the ionic channels modulated by ACh (blue text). (D) ACh-modulated increase in neuronal excitability does not reflect muscarinic receptor signaling time. Plot of cumulative spike count in control conditions and with coincident ACh release (as in B) in seven experiments in which the light pulse train began 1 s (left panel), 2 s (middle) or 3 s (right) before the depolarizing step. **p<0.01 in all three panels, paired t-test; 1 s delay: T = 4.60.5973, 2 s: T = 5.199, 3 s: T = 6.579. E-G, Summary of the seven experiments illustrated in D. (E) The increase in number of spikes from the step to step + light conditions (illustrated as number of spikes) was not significantly different between different delays (n.s. p>0.05, 1 s vs. 2 s: p=1, T = 0.235, 1 s vs. 3 s: p=1, T = 0.328, 2 s vs. 3 s: p=1, T = 0. Paired t-test, Bonferroni corrected). (F) Plot represents mean bifurcation time (time when the step and step + light cumulative spike count plots diverged by at least 1 AP) calculated separately in each experiment and then averaged. (Bifurcation times presented in B and D represent times when the ensemble average plots diverged by at least 1 AP. Both bifurcation time protocols typically yielded similar latency estimates.) (G) Mean ISI ratio that assesses spike frequency adaptation across conditions. ISI ratio was calculated by the ratio between the average of the last 2 ISIs and the average of the first 2 ISIs. ISIs were significantly reduced by light induced ACh release (step vs. step + light: ** 1 s: p=0.00140, T = 7.808; ** 2 s: p=0.00206, T = 7.277; *p=0.0167, T = 4.874; paired t-test, Bonferroni corrected). Within step + light conditions, all comparisons between delays were not significantly different (1 s vs. 2 s: p=1, T = 0.520; 1 s vs. 3 s: p=0.936, T = 1.620; 2 s vs. 3 s: p=0.798, T = 1.735; paired t-test, Bonferroni corrected).
Figure 2—figure supplement 1
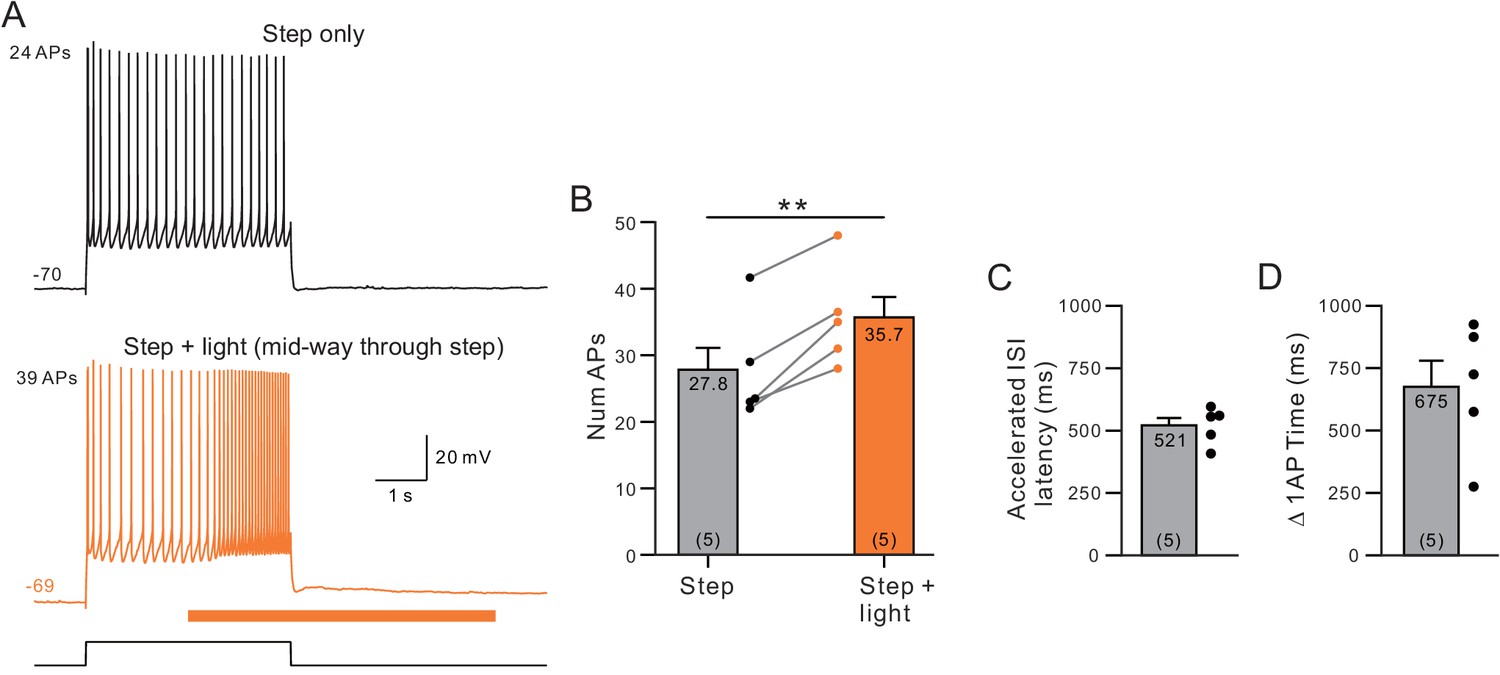
Estimation of muscarinic receptor signaling latency to attenuate ERG.
(A) Example control step response (top) and response when light stimulation was applied beginning 2 s into the 4 s step stimulus (orange, bottom). (B) Plot of the increase in number of APs evoked during the entire step stimulus. **p=0.0022, T = −7.01. (C) Plot of the latency to the inter-spike interval (ISI) that was shortened when ChR2 was stimulated with light (time indicated is from light onset to first spike within ISI). (D) Plot of the bifurcation time (when the cumulative spike count increased by 1 AP) in the same five experiments with ChR2 stimulation mid-way through 4 s duration depolarizing steps.
Figure 3
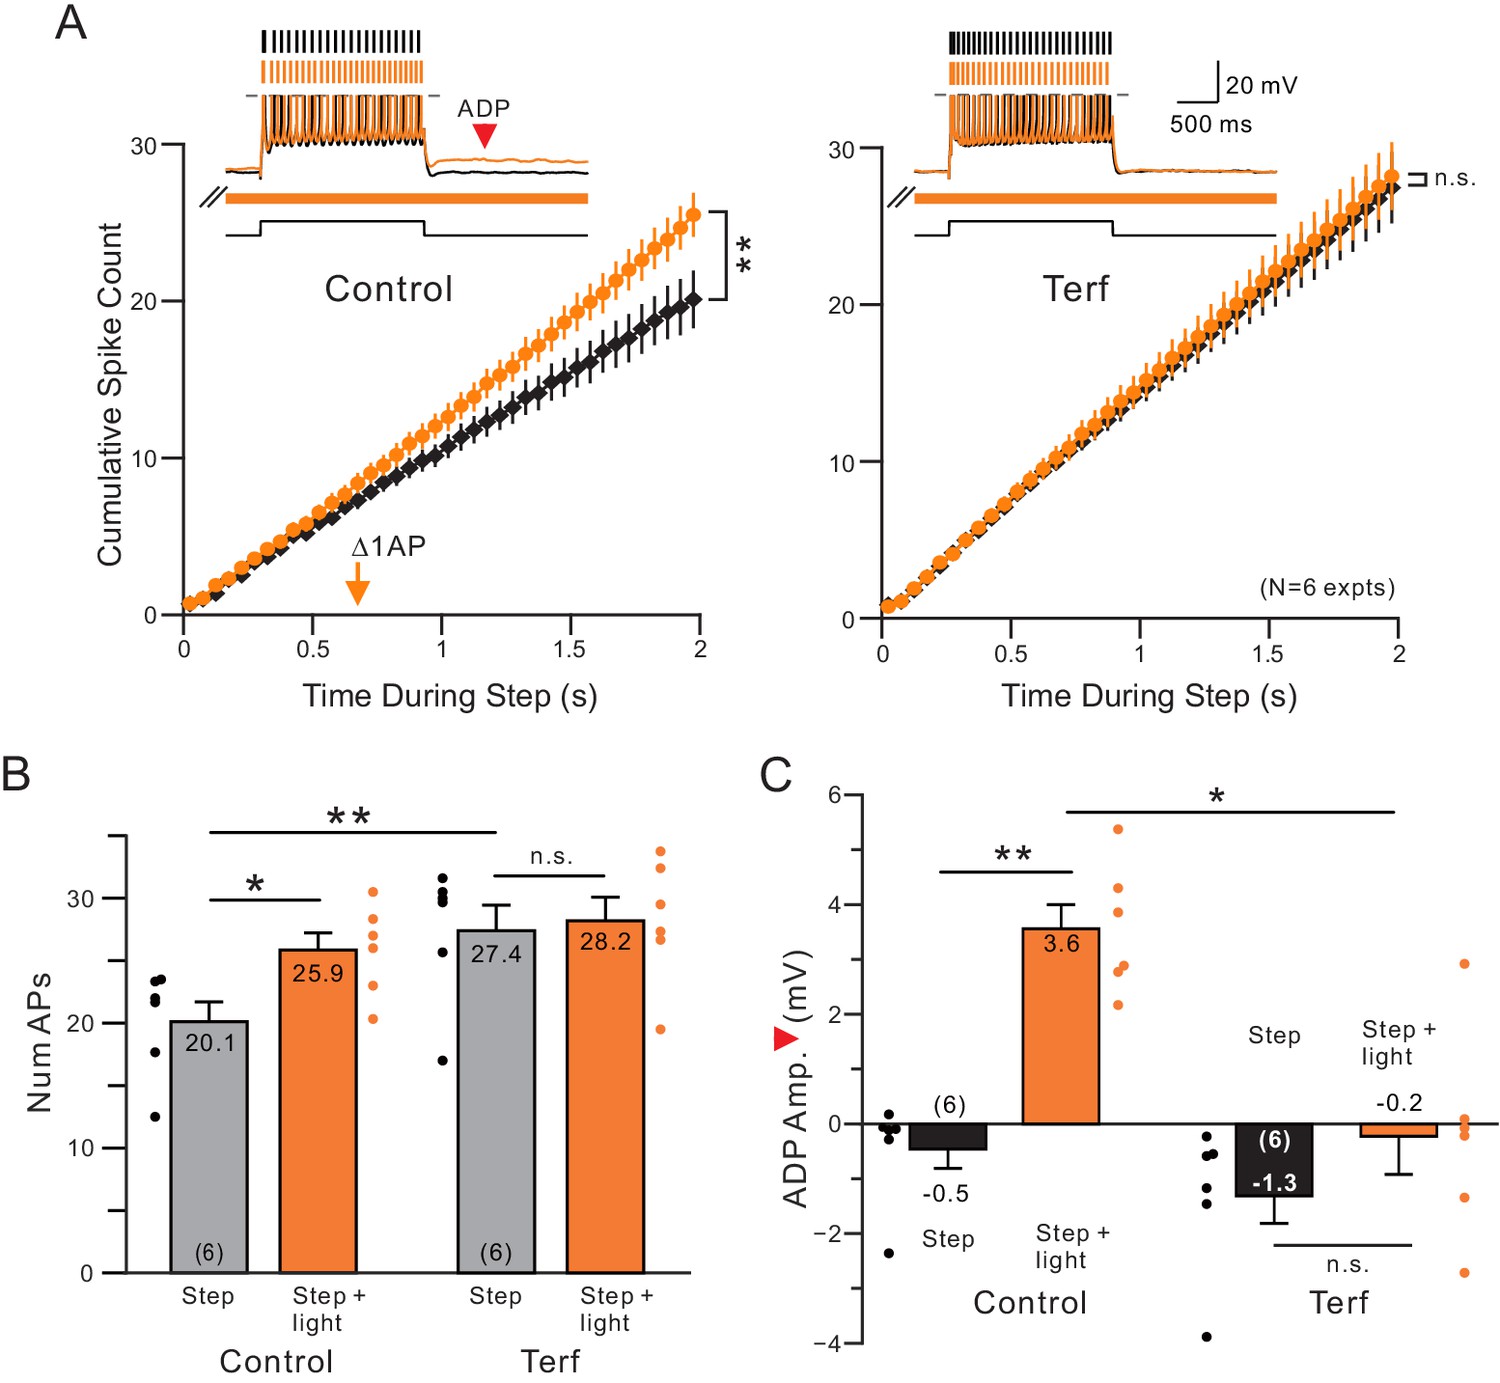
Terfanadine (10 M) abolished the increase in neuronal excitability normally observed following coincident ACh release.
(A) Control and Terf responses from the same neurons with identical light pulse trains timing in each condition. **p=0.00201, T = 5.884; n.s. p=0.254, T = 2.063. (B) Quantification of total number of APs across conditions. Total number of APs was increased upon ACh release (*p=0.0158, T = 4.719). This effect was blocked by application of terfenadine (n.s. p=1, T = 0.952). Application of Terfenadine significantly increased the total number of APs without light (step, Control vs. Terf: **p=0.00498, T = 6.141; all paired t-test, Bonferroni corrected). (C) plot of reduction in afterdepolarization response amplitude (indicated by red arrowhead in example Control step + light orange trace) by Terf. ** Control step vs step + light: p=0.00992, T = 5.257; n.s. Terf step vs step + light P=0.267, T = 2.107; * Control step + light vs Terf step + light: p=0.0142, T = 4.843; all paired t-tests, Bonferroni corrected.
Figure 4
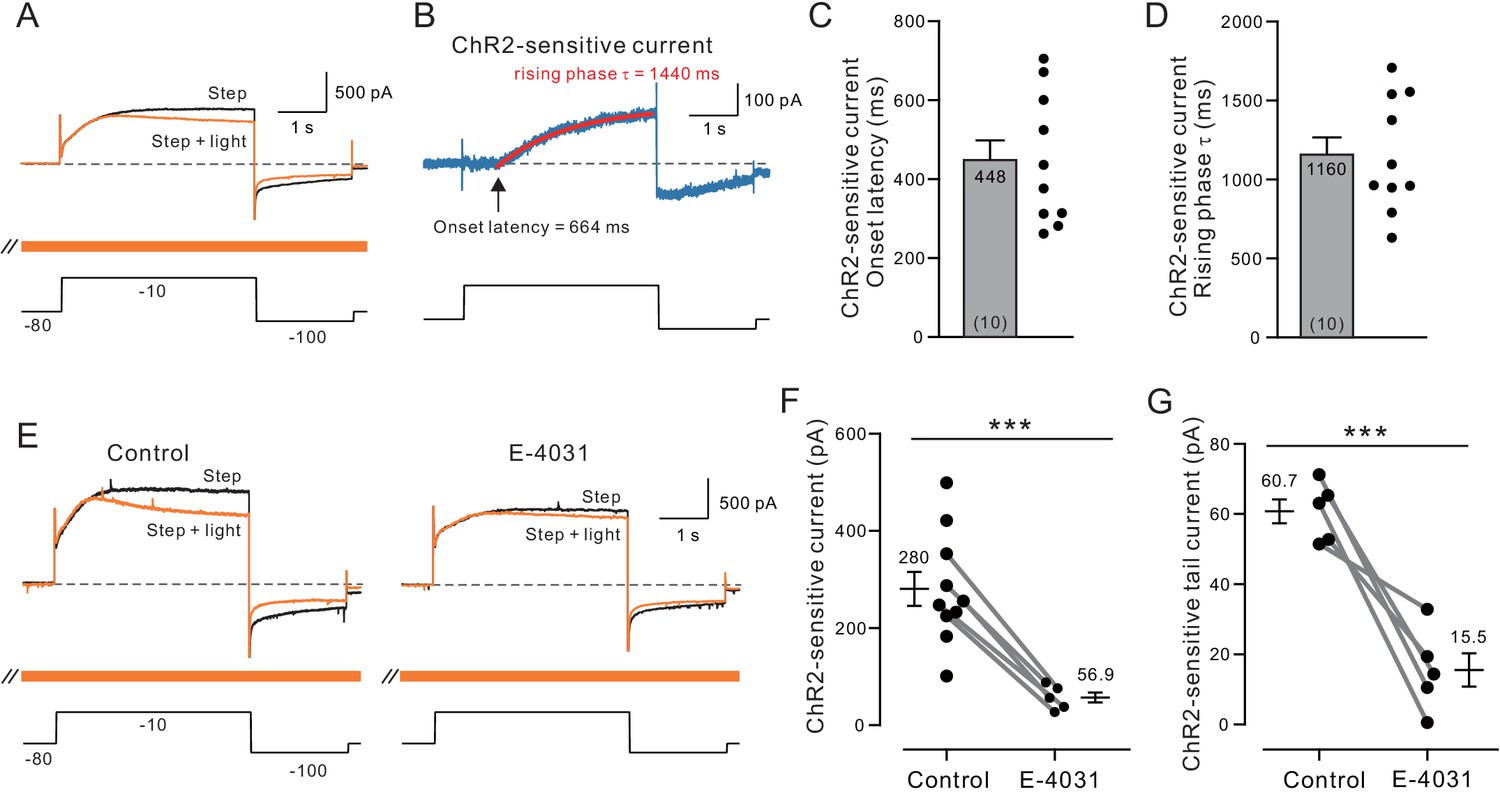
Voltage-clamp analysis of ACh-sensitive outward current.
(A) ChR2 stimulation with light selectively reduces a late-developing outward current. Black trace represents control response to step protocol without ChR2 stimulation; orange trace shows response when applied with ChR2 stimulation initiated 1.5 s before step to −10 mV and continued throughout step protocol (orange bar). (B) Subtraction of the two traces in A reveals outward current attenuated by ChR2 light stimulation. Single exponential fit superimposed in red; arrow indicates onset latency estimated from 0 crossing of exponential fit function. (C) Summary of onset latency of ACh-sensitive outward current in 10 experiments. (D) Summary of tau of exponential fits to subtracted current rising phase in the same 10 experiments. (E) ERG blocker E-4031 attenuates an overall outward current response and occludes most of the modulation by ChR2 light stimulation (different cell from A-B). (F) Summary of maximal ChR2-sensitive outward current in 10 experiments calculated as the mean of final 100 ms of step response to −10 mV in control conditions and five experiments that tested E-4031; solid lines indicate subset of control points tested in E-4031. ***p=0.0011, T = 4.175 (unpaired comparison including all Ns); p=0.00014, T = 14.211 (paired comparison of 5 cells tested in both control and E-4031 conditions). (G) Plot of reduction in tail component of the ChR2-sensitive current by E-4031. Tail current magnitude estimated by following the step to −100 mV. ***p=0.00581, T = 5.269, paired t-test. Membrane potentials indicated in A and E are corrected for the liquid junction potential. Capacitive transients truncated in current traces.
Figure 5 with 4 supplements
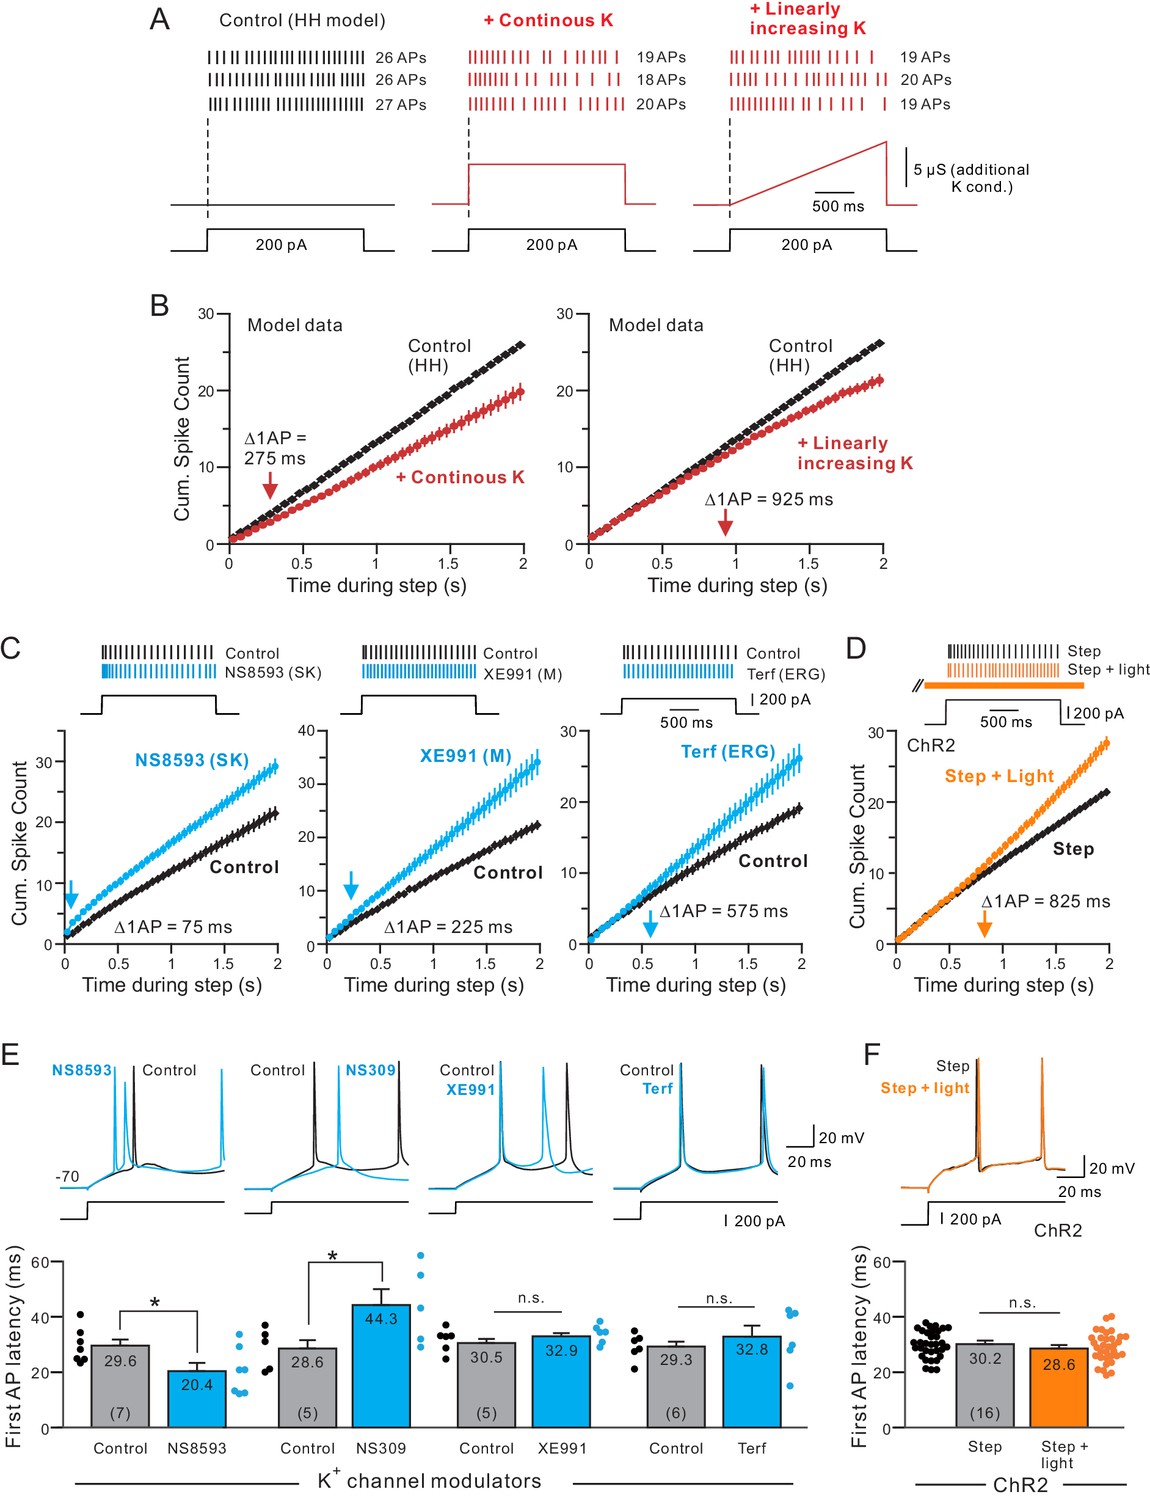
Different kinetics of K+ currents that mediate spike frequency adaptation in L5 neocortical pyramidal cells.
(A) Three spike discharge responses from simulations using a Hodgkin-Huxley conductance-based computer model (HH model; black traces in left panel; see Materials and methods for details). Other panels illustrate the change in spike pattern when an additional K+ conductance is introduced (red traces, middle: a step increase in K+ current that follows the current stimulus timing; right: a linearly increasing K+ conductance). (B) Including a linearly increasing K+ conductance triggers a delayed reduction in neuronal excitability (right panel) that occurs with a longer latency than a step increase in K+ conductance (left panel). The magnitudes of the added K+ conductances adjusted to generate similar total number of APs in response to a standardized step current stimulus. Bifurcation time indicated by red arrows near X axes indicate when reduction in excitability decreased the cumulative spike count by at least 1 AP. (C) Cumulative spike count plots demonstrating the diverse timing of when neuronal excitability increases following blockade of three different K+ currents (left panel: SK blocker NS8593, 10 M; middle: M blocker XE991, 10 M; right: ERG blocker terfenadine, 10 M). Bifurcation time, reflecting an increase in the cumulative spike count plot of at least 1 AP (blue arrows), is indicated within each panel. (D) Release of endogenous ACh using light pulse trains revealed a bifurcation time (825 ms) longer than any of the K+ channel blockers but closest to the bifurcation following blockade of ERG (575 ms). Depolarizing step amplitude adjusted to elicit ~ 20 APs in control conditions in each experiment in C-D. (E) Only drugs that blocked SK channels affected the latency to the initial AP in the step response. Bidirectional modulation of first spike latency by the SK blocker (NS8593) and SK activator (NS309, 5 M) while blockade of M current with XE991 or ERG with Terf had no effect on first spike latency. * (NS8593) p=0.0130, T = 3.489; * (NS309) p=0.0124, T = 4.324; n.s (XE991) p=0.350, T = 1.030; n.s. (Terf) p=0.364, T = 0.998; all paired t-tests. (F) Release of endogenous ACh had no effect on first spike latency (n.s.: p=0.151, T = 1.514; paired t-test). Experiments assaying bifurcation times and first-spike latency with Terf and XE991 used strong Ca2+ buffering (10 mM BAPTA) to attenuate SK-mediated effects. Parallel experiments using weak Ca2+ buffering and Rin compensation presented in Figure 5—figure supplements 1–2 associated with this figure.
Figure 5—figure supplement 1
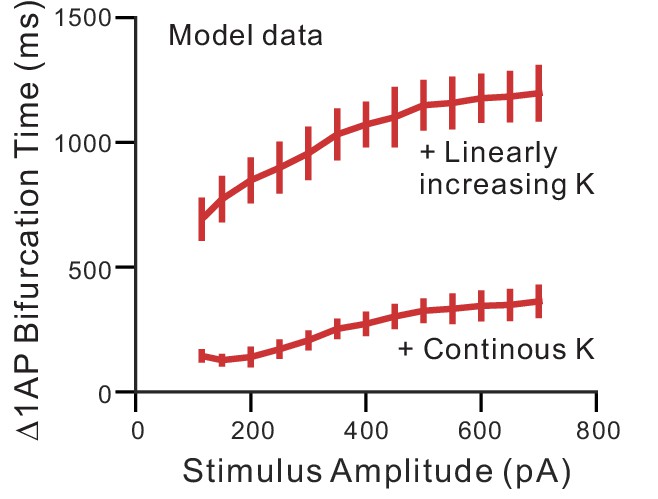
Bifurcation time using constant and linearly-increasing K+ currents in computer simulations.
Plot of the bifurcation time in simulation experiments similar to Figure 5B in response to different amplitudes of current stimuli. The bifurcation time was > 600 ms at each step amplitude when employing an ERG-like linearly-increasing K+ conductance and<400 ms when using a constant K+ current (‘Continuous’).
Figure 5—figure supplement 2
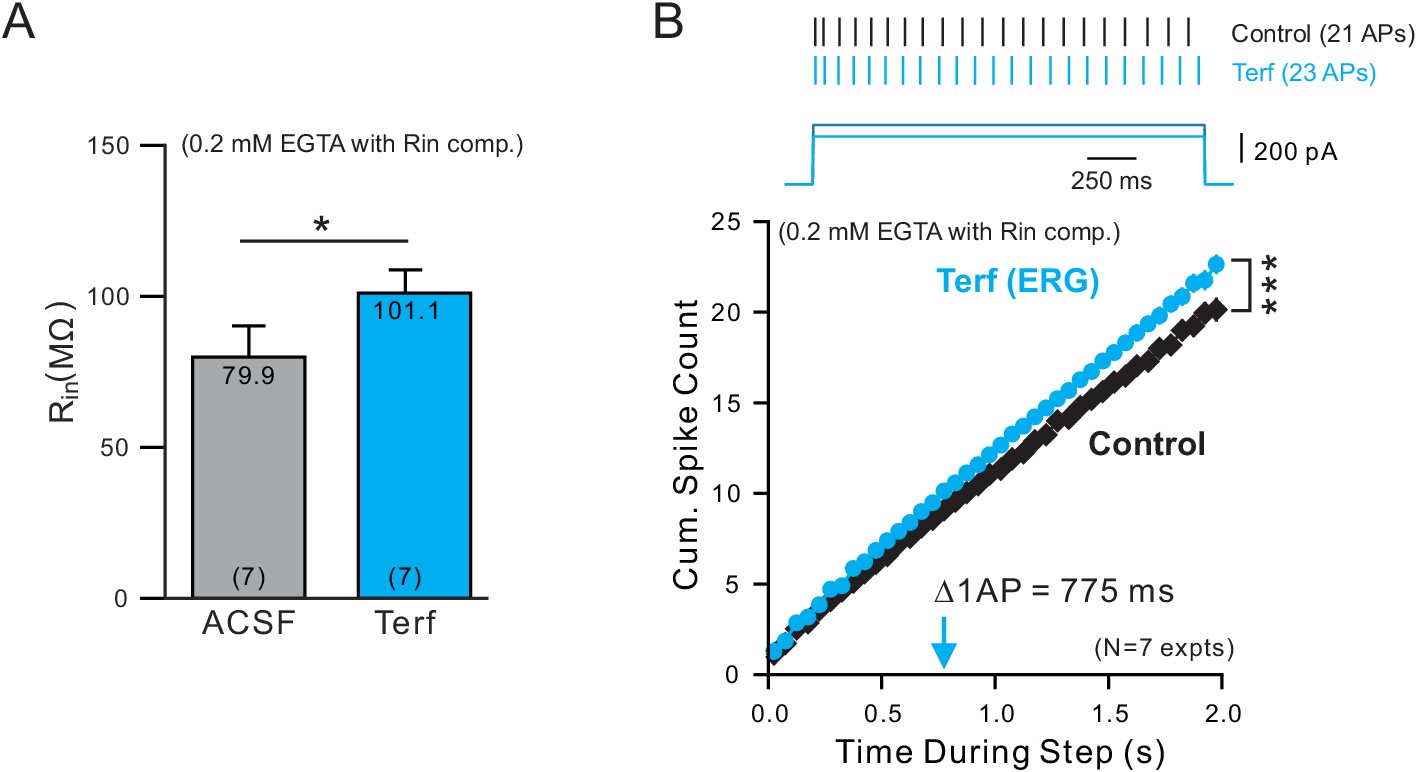
ERG-blocking experiments with low Ca buffering.
(A) Terfenadine increases input resistance (Rin) in experiments employing an internal solution with weak Ca2+ buffering (0.2 mM EGTA). (B) Similar delayed increase in excitability following blockade of ERG with Terf (same analysis protocol used in Figure 5C).
Figure 5—figure supplement 3
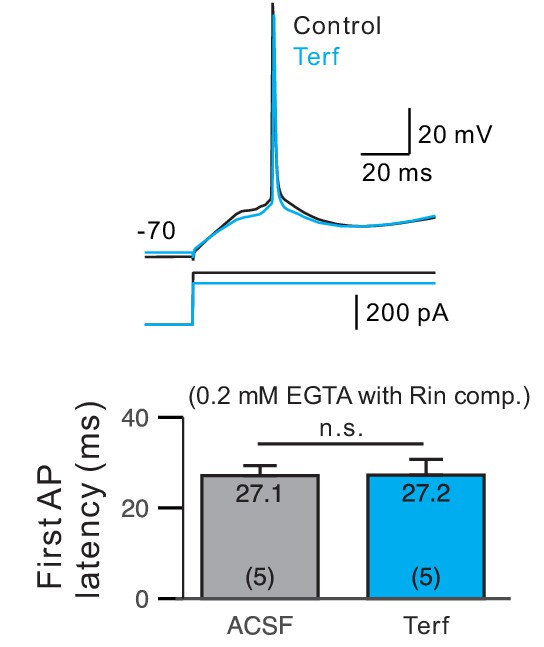
First spike latency was not affected by Terf in experiments with weak Ca2+ buffering.
Parallel analysis to results presented in Figure 5E but with 0.2 mM EGTA internal solutions. Rin compensated by decreasing current step amplitude was adjusted to compensate for the effect increased Rin measured in each cell.
Figure 5—figure supplement 4
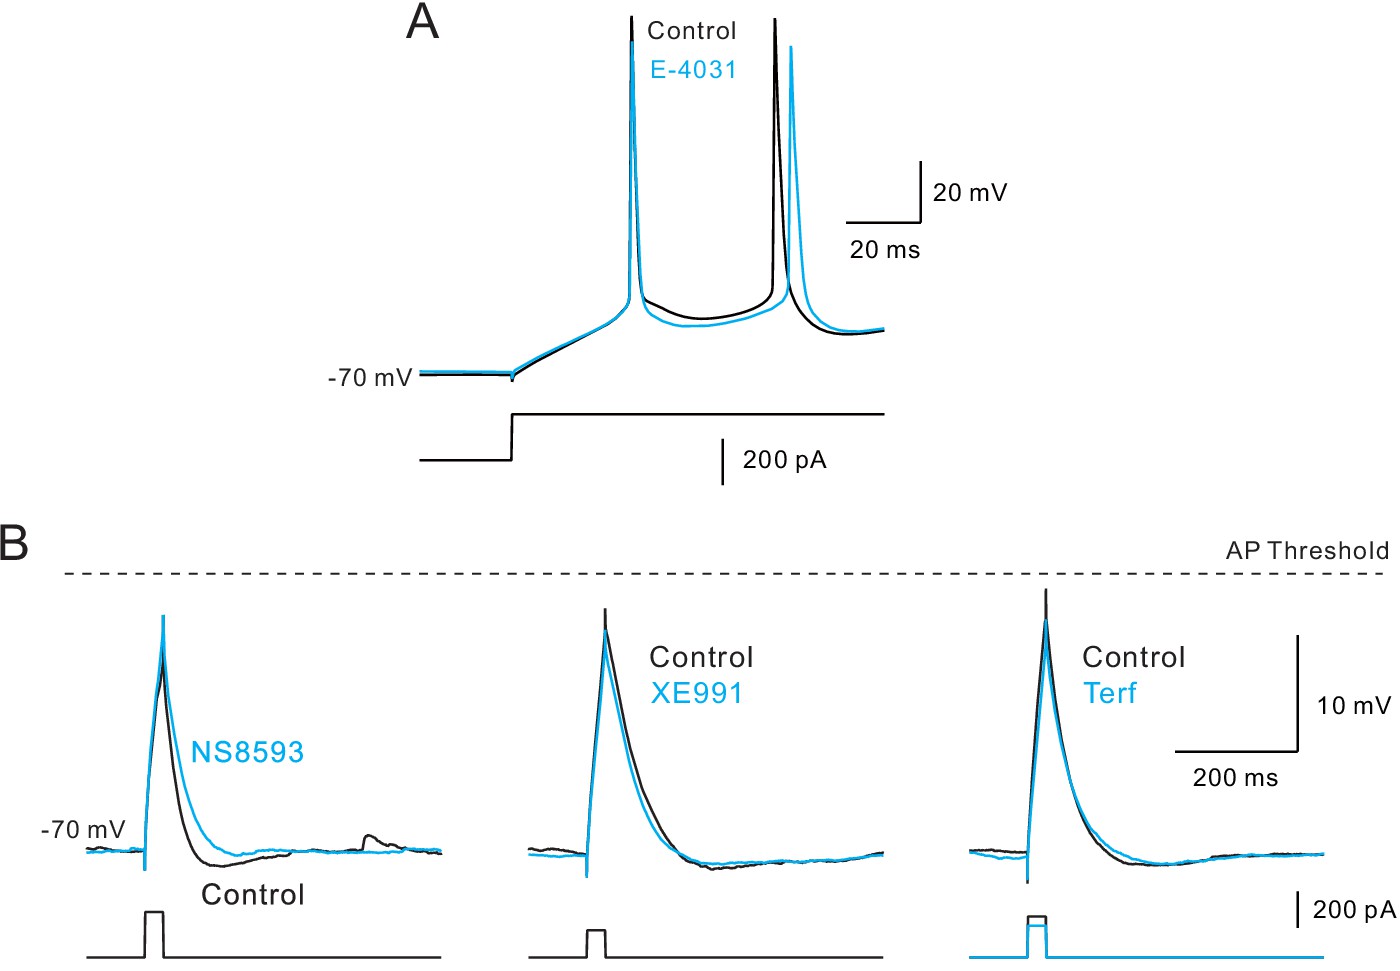
Additional control experiments related to first spike latency.
(A) First spike latency was unaffected by E-4031 (10 M; recording with the same 10 mM BAPTA internal). (B) Afterhyperpolarization following subthreshold depolarizations is selectively blocked by SK antagonist NS8593 (left) but not by M (XE991, middle) and ERG blockers (Terf, Rin compensated, right). All three recordings with 0.2 mM EGTA internal. Dashed horizontal line at AP threshold.
Figure 6 with 1 supplement
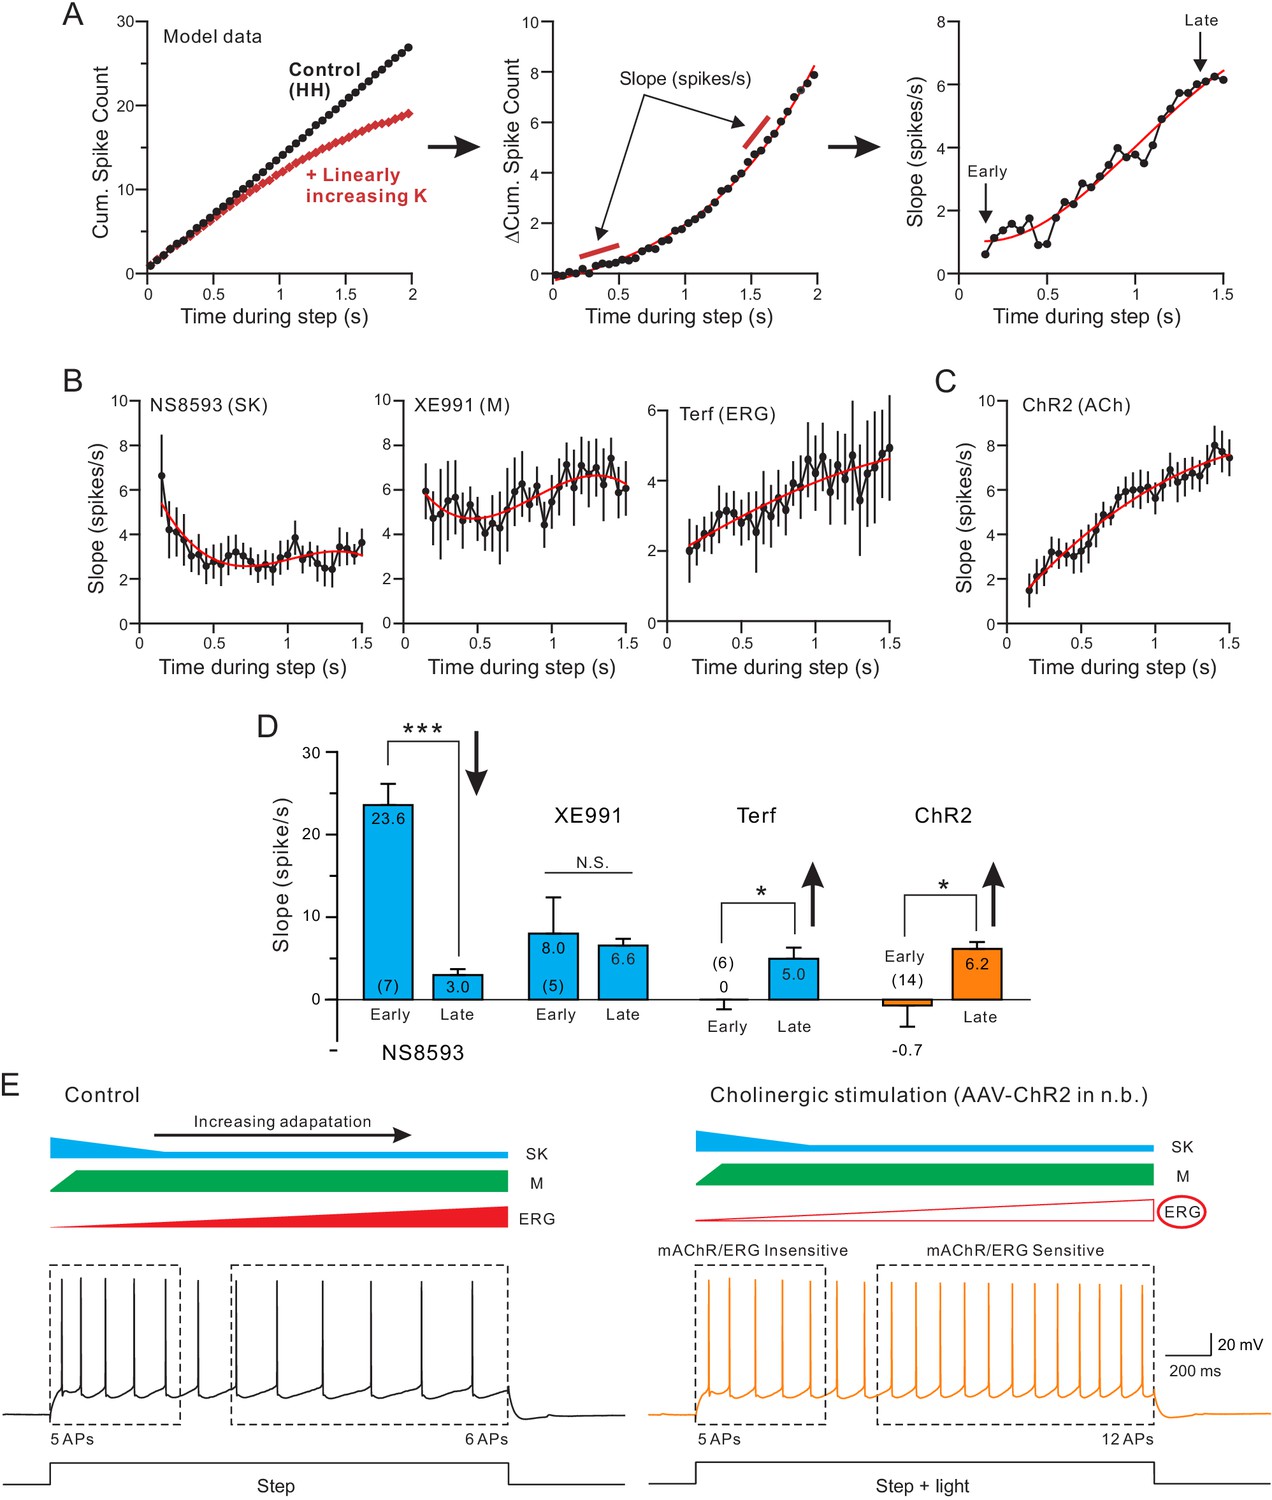
Both terfenadine and endogenous ACh reduce a current responsible for late-phase spike frequency adaptation.
(A) demonstration of method used to define kinetics of currents responsible for SFA. From a standard pair of cumulative spike count plots (left panel, responses from a computer simulation with and without a linearly-increasing K+ current), a difference cumulative spike count function is computed (middle panel). Finally, a series of slope estimates, representing the instantaneous rate of SFA, is generated at different times during the step response. Slopes at the ‘Early’ and the ‘Late’ phases of the response are quantified in D. (B) Estimates of the kinetics of SFA modulated by the same three K+ channel blockers assayed in Figure 5, revealing the declining functional effect of SK current (left panel) and the increasing functional effect of Terf-sensitive ERG current during the same type of 2 s duration depolarizing step responses. (C) Rate of SFA increases during step responses when endogenous ACh is released. (D) Summary of the initial and final rates of SFA. Blockade of SK channels with NS8593 decreased the rate of SFA: ***p=0.000249, T = 7.714, while both Terf and ChR2-mediated ACh release increase the rate of SFA: * Terf: p=0.0432, T = 2.692; * ChR2 p=0.0471, T = 2.192; XE991 n.s., p=0.923, T = 0.102; all paired t-tests. Experiments using Terf and XE991 were conducted using an internal solution with strong Ca2+ buffering (10 mM BAPTA) to attenuate SK-mediated effect. (E) Schematic diagram of the kinetics of the main K+ currents hypothesized to underlie SFA under control conditions (left: SK, blue; M, green; ERG, red) and following mAChR activation (right) with attenuated ERG and reduced late-phase SFA. The spiking response during the early phase of the step (left dashed box) was insensitive to mAChR modulation and was likely mediated by M or SK current. In contrast, neuronal excitability was selectively increased in the late phase (right dashed box), likely by mAChR-mediated attenuation of ERG. Intracellular responses duplicated from Figure 1B.
Figure 6—figure supplement 1
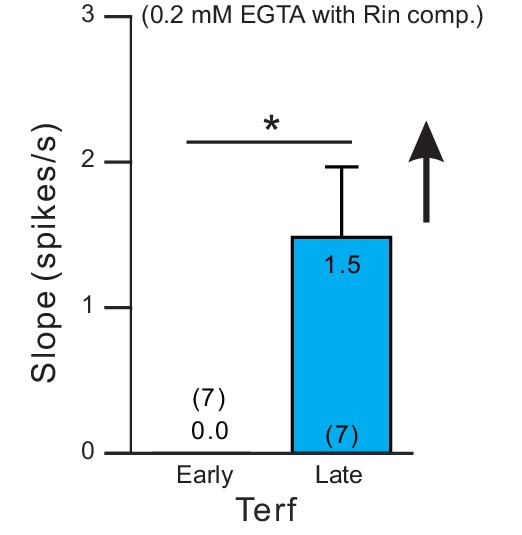
Rate of spike frequency adaptation was increased following ERG blockade with Terf in experiments with weak Ca2+ buffering.
Parallel experiment protocol used in Figure 6D but with 0.2 mM EGTA internal solutions (and Rin compensated). *p=0.0296, T = 2.838, paired t-test.
Figure 7 with 2 supplements
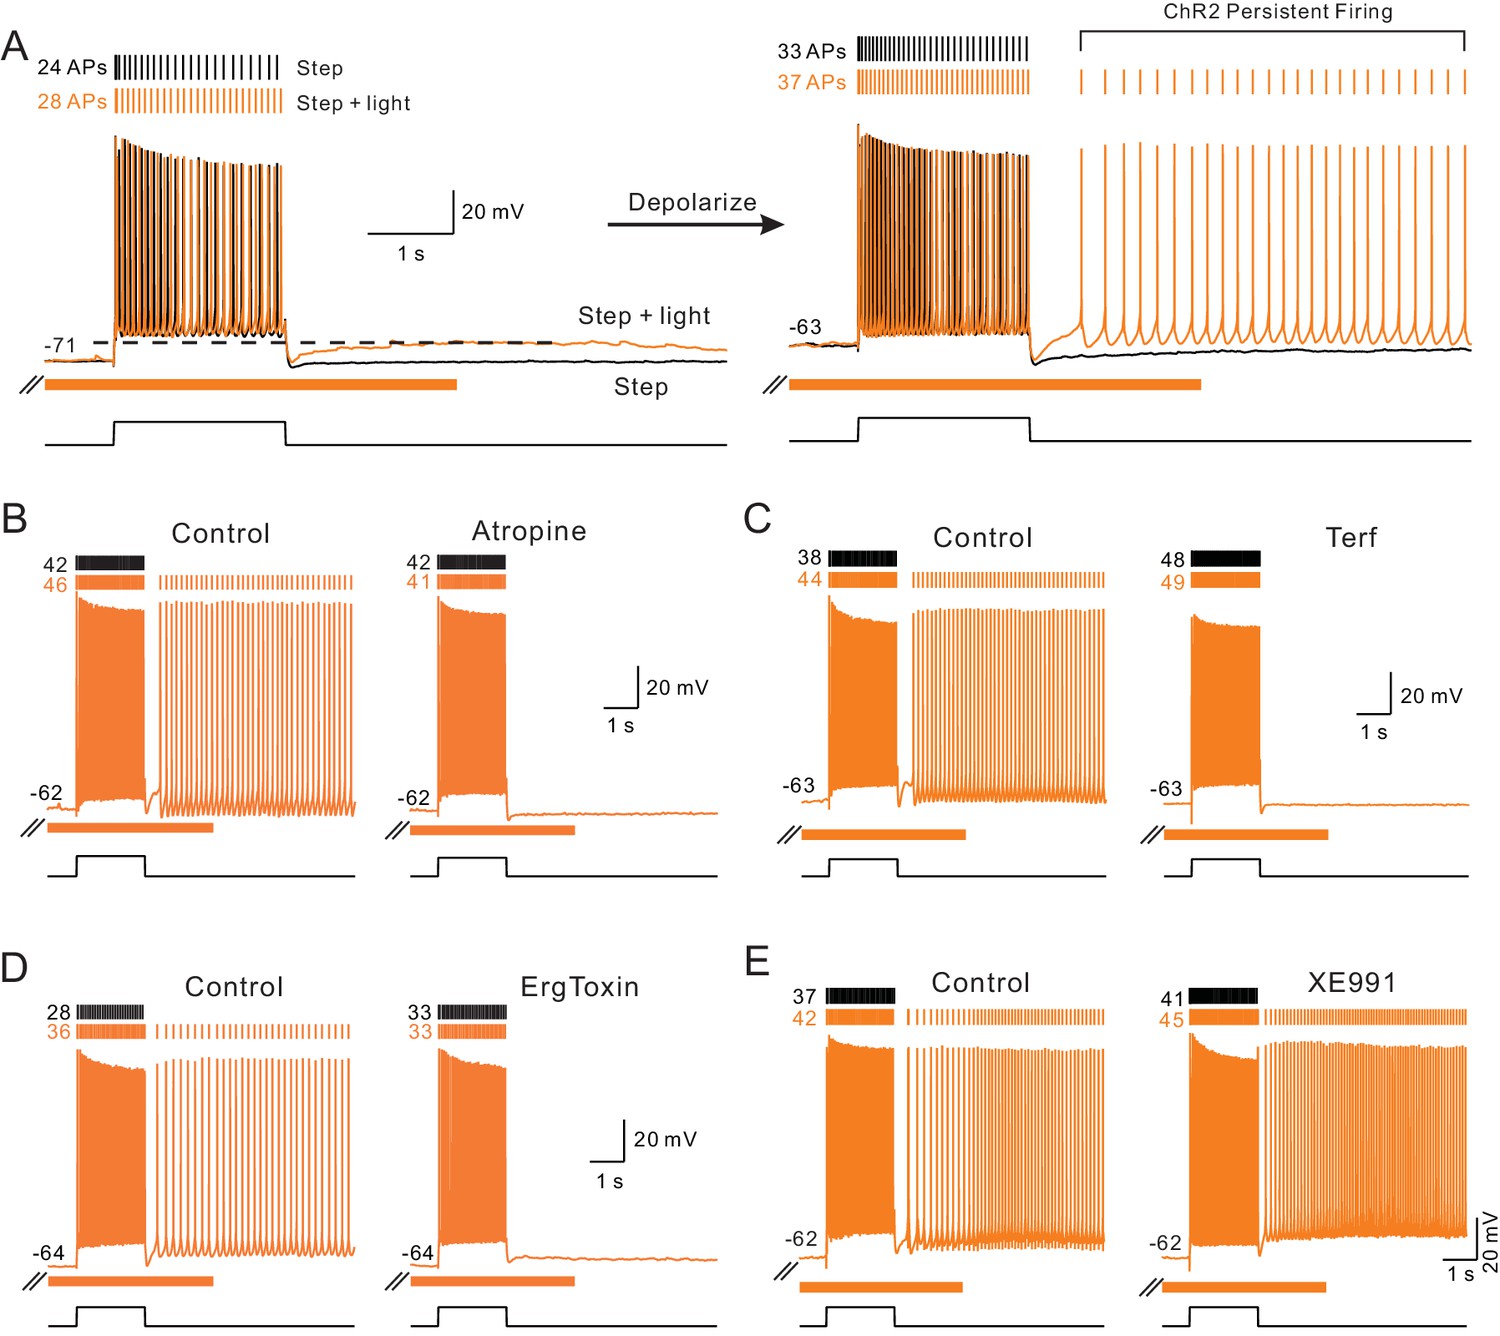
Endogenous ACh enables intrinsic persistent firing by decreasing ERG current.
(A) ChR2-evoked ACh release enables a long-duration afterdepolarization (ADP) following depolarizing steps that remained subthreshold when tested at ~−70 mV (orange trace in left panel). No ADP is evident in interleaved step-only trials (black trace). Depolarizing the same pyramidal cell by 8 mV allowed the post-step ADP to trigger persistent firing when ACh was released via ChR2 light stimulation (orange trace in right panel). (B) The muscarinic receptor antagonist atropine (10 M) abolishes ChR2-mediated persistent firing and the increase in the number of APs evoked during the step stimulus. (C) The ERG antagonist terfenadine (Terf, 10 M) abolishes ChR2-mediated persistent firing. (D) Persistent firing mediated by ChR2 stimulation also was abolished by ErgToxin1 (50 nM). (E) XE991 (10 M), an M current antagonist, does not block ChR2-mediated persistent firing.
Figure 7—figure supplement 1
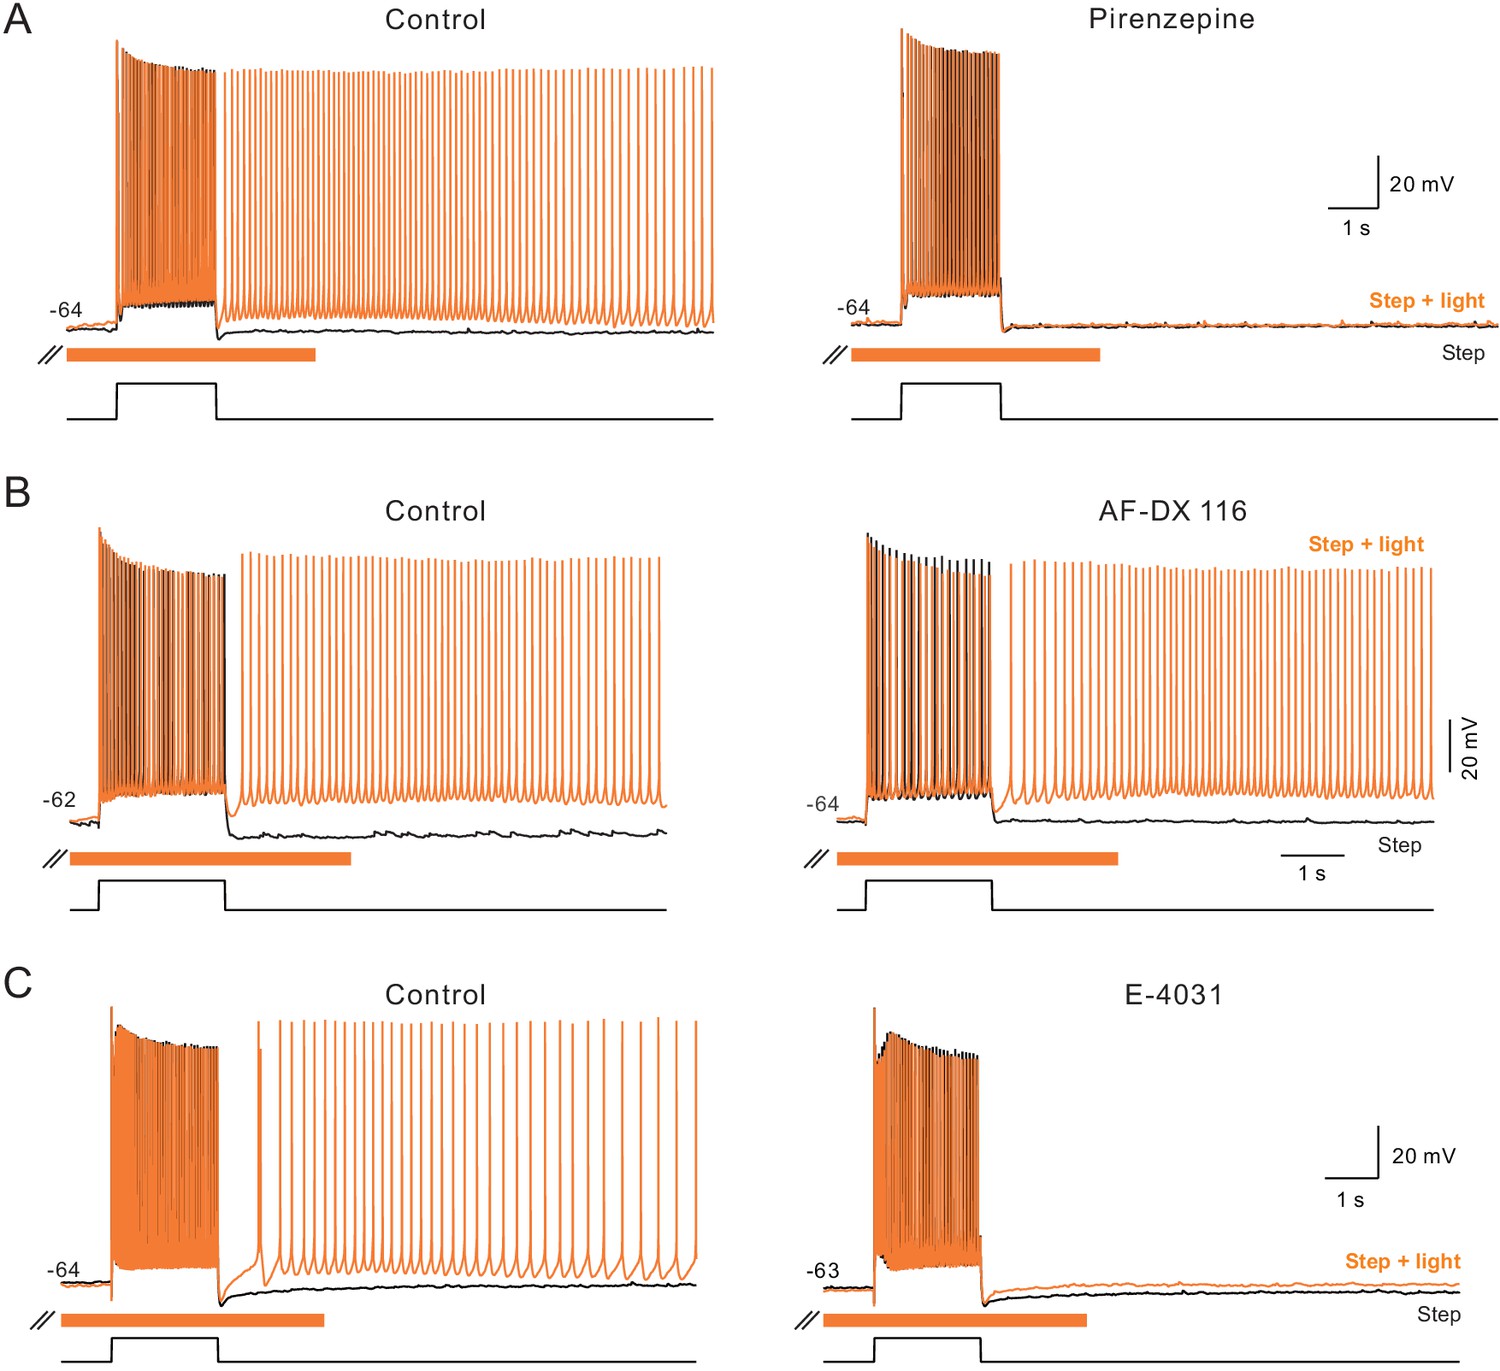
Additional pharmacological properties of ChR2-mediated persistent activity.
(A) The m1-class muscarinic receptor antagonist pirenzepine (10 M) abolished persistent activity triggered by step + light. Both step only and step + light responses superimposed in control and pirenzepine panels. (B) The m2-class muscarinic receptor antagonist AF-DX 116 (10 M) failed to block ChR2-mediated persistent firing. (C) The ERG antagonist E-4031 (10 M) blocked ChR2-mediated persistent activity. Example records typical of N = 3 experiments with each antagonist.
Figure 7—figure supplement 2
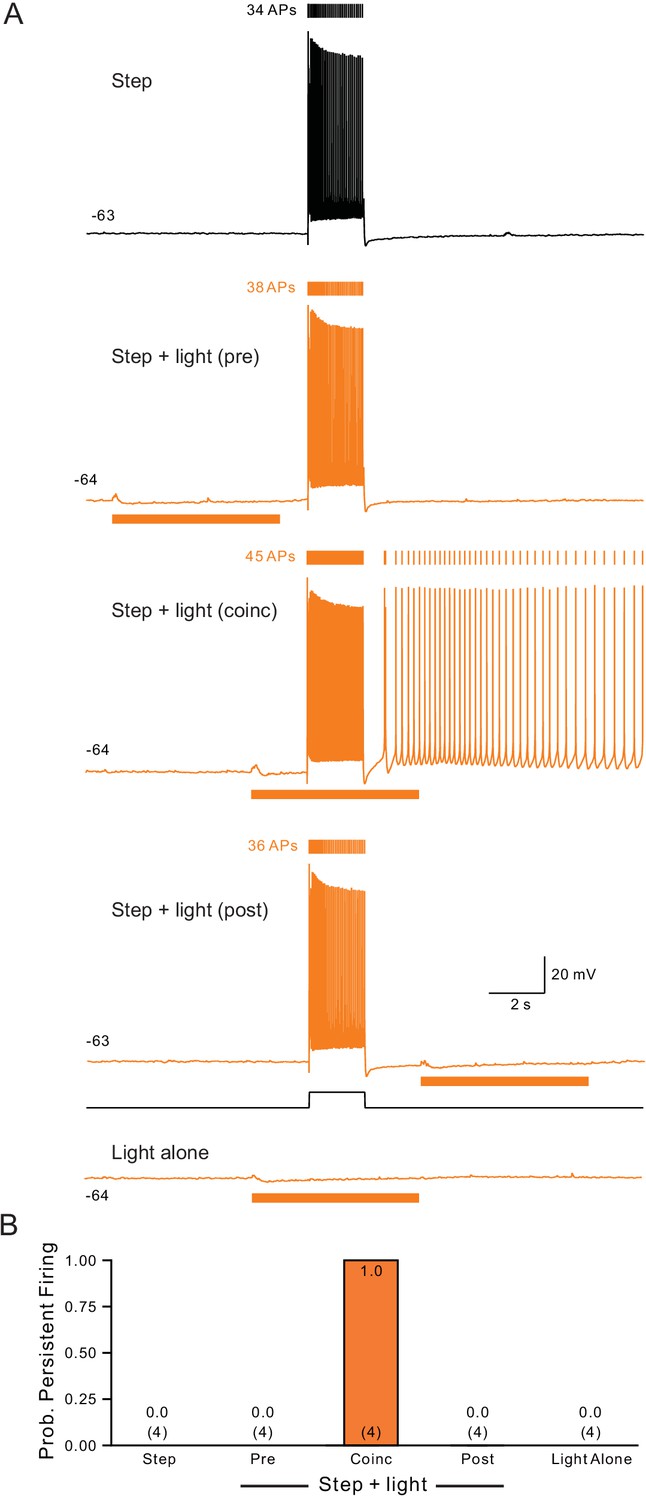
Persistent activity requires coincident step depolarization and ChR2 light stimulation.
(A) Light timing assayed using the same protocol illustrated in Figure 1H while holding neurons at ~−63 mV. Bottom trace from episode with light stimulus applied without depolarizing step. (B) Summary plot of the probability of persistent firing under five conditions illustrated in A tested in 4 cells.
Figure 8 with 1 supplement
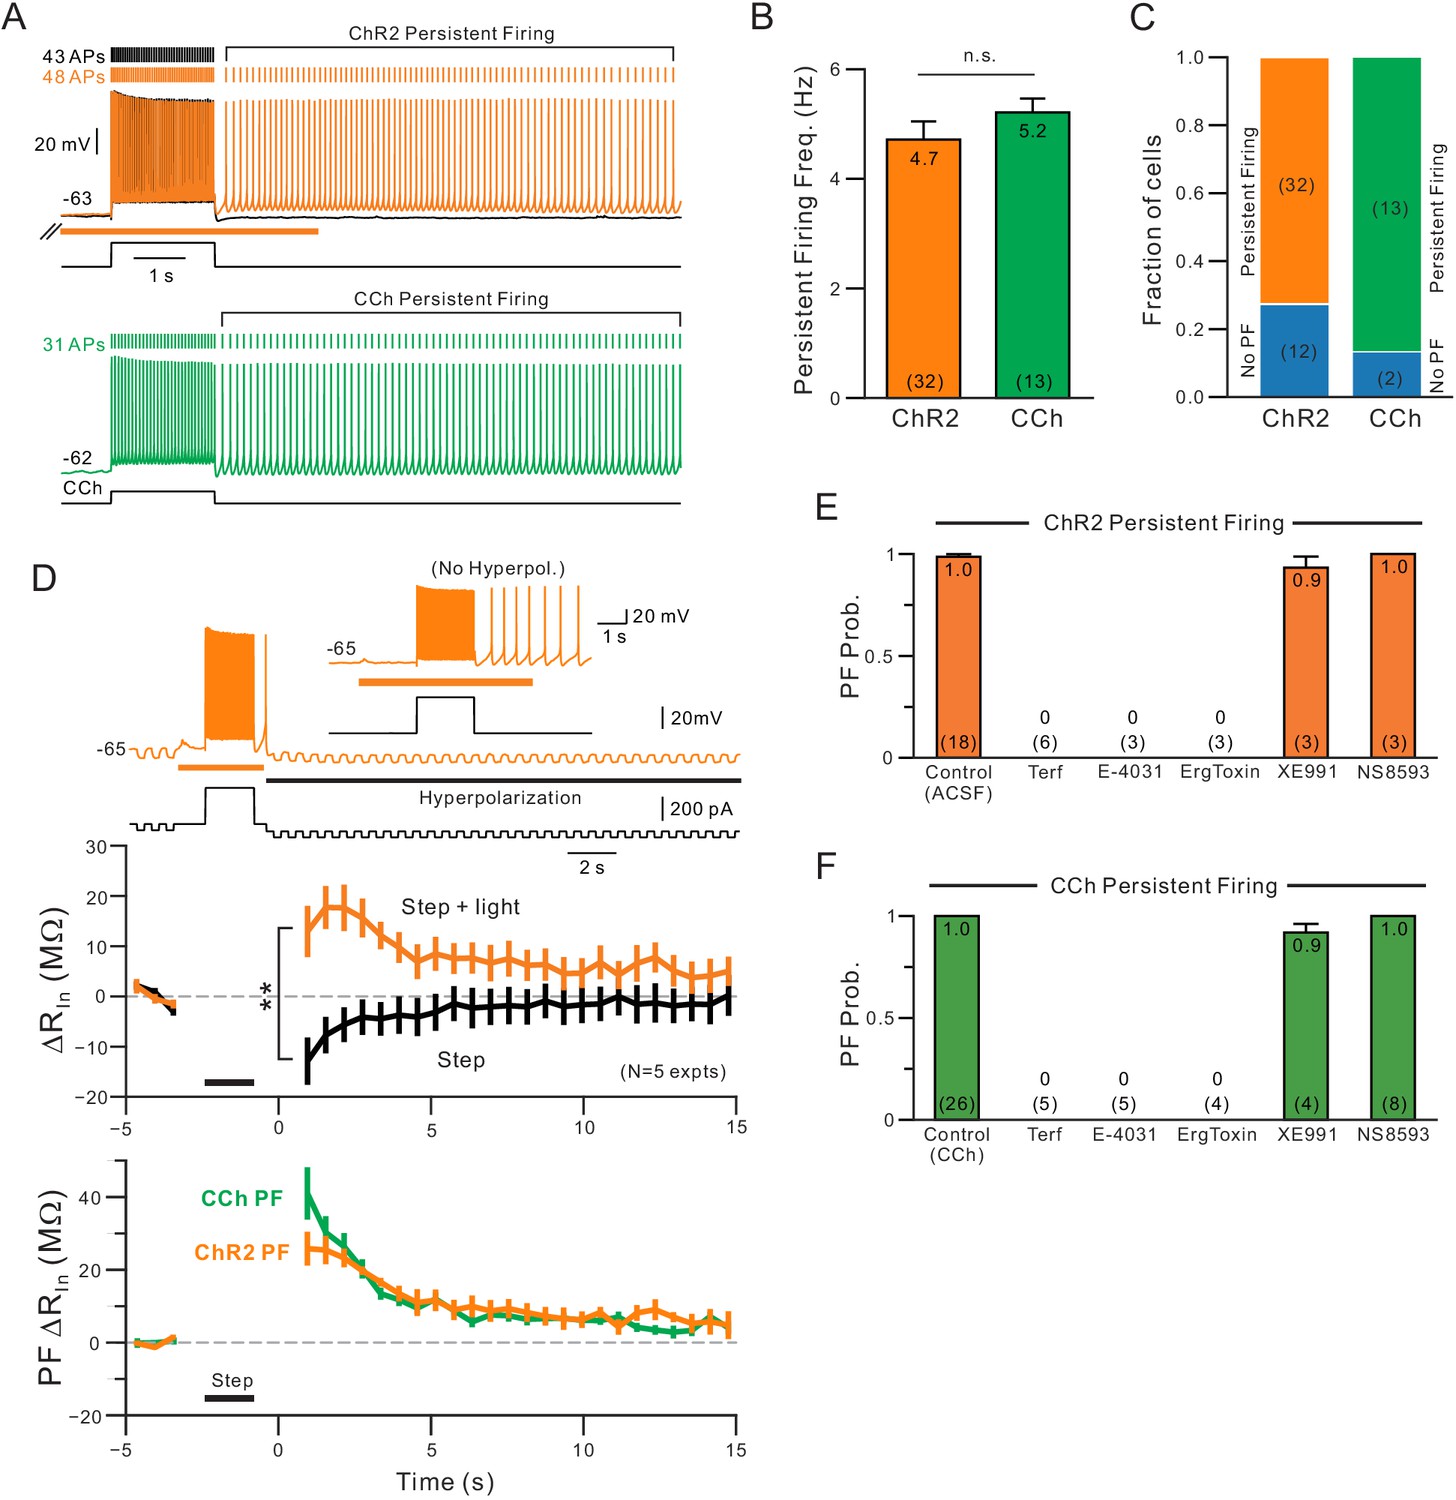
Comparison of persistent firing properties and pharmacology with endogenous ACh release and bath application of carbachol.
(A) Comparison of persistent firing evoked by depolarizing steps combined with ChR2-mediated ACh release (orange trace, top) and with bath application of carbachol (CCh, 2 M, green, bottom trace). Responses from different cells but at same vertical and time scales. (B) Summary of average persistent firing frequency computed over 9 s with ChR2-mediated ACh release (orange) and bath CCh (green). (C) Summary of proportion of pyramidal cells tested with ChR2 stimulation that had persistent firing at ~−63 mV (left) and with bath CCh at the same membrane potential (right). (D) Endogenous ACh-mediated persistent firing is associated with an increase in input resistance. Top traces illustrate protocol used to assay input resistance, adopted from a related study (Cui and Strowbridge, 2018), where persistent firing that would normally occur is suppressed by hyperpolarizing the membrane potential; example response from the same neuron without added post-stimulus hyperpolarization shown in inset. Middle plots show summary of input resistance change from pre-stimulus levels at each time step in control conditions (step-only, black plot) and following ACh release (step + light, orange plot). Immediately following the depolarizing stimulus, input resistance decreased relative to baseline in control while it increased when ACh was present. **p=0.00752, T = 4.994, paired t-test. Calibration routine used to establish baseline input resistance at different membrane potentials was shown in the supplement for this figure. Bottom, plot of persistent firing associated increase in input resistance in ChR2 stimulation experiments (orange plot, difference between orange and black plots in middle panel) and bath CCh experiments (green plot, difference in input resistance plots before and after CCh application). Timing of 2 s depolarizing step indicated by black horizontal line in middle and bottom panels. (E) Summary of probability of triggering persistent firing in ChR2 experiments following treatment with ERG blockers (terfenadine, E-4031 and ErgToxin1) and antagonists for other K+ channels (XE991 for M current and NS8593 for SK channels). (F) Parallel summary plot for experiments conducted with bath CCh (and without ChR2 stimulation). Experiments summarized in (E-F) were conducted on a subset of experiments where depolarizing step stimuli triggered persistent firing under baseline conditions (either with ChR2 light stimulation or bath CCh).
Figure 8—figure supplement 1
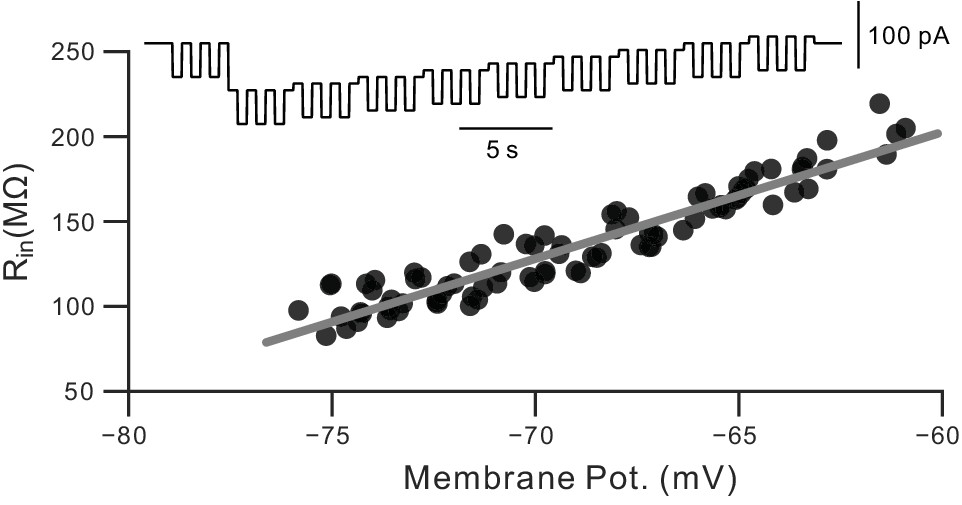
Calibration for dynamic Rin measurements.
Example results from a calibration procedure used to estimate the voltage dependence of Rin in pyramidal cells. See Materials and methods and Cui and Strowbridge (2018) for details.
Figure 9 with 1 supplement
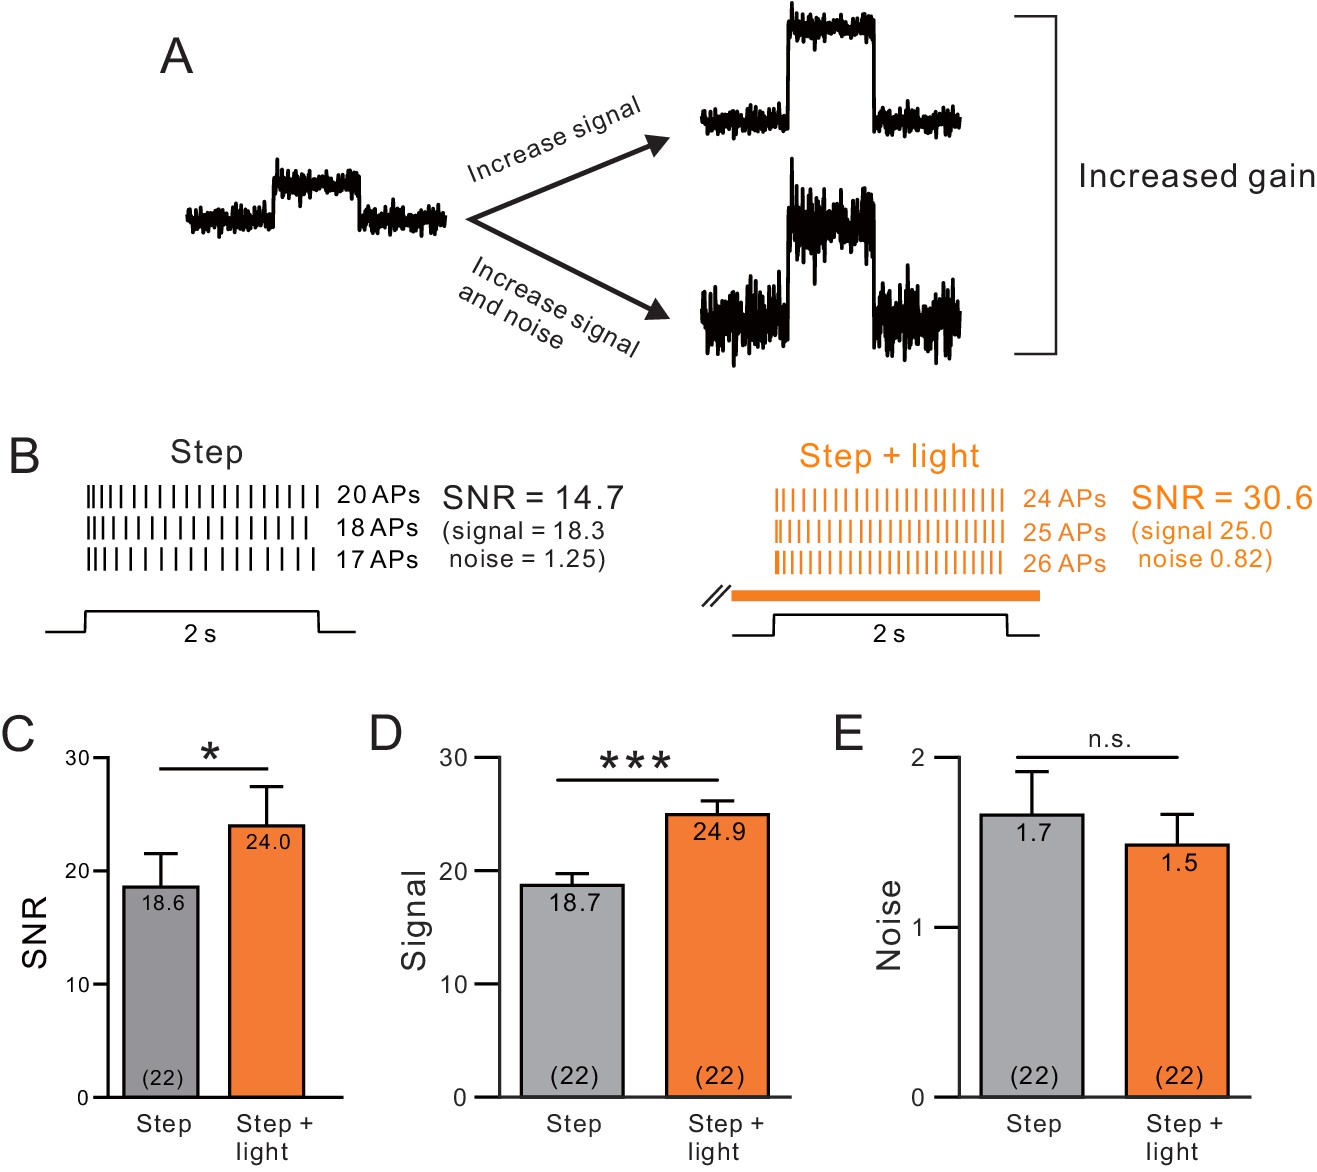
A, Endogenous ACh enhances signal-to-noise ratios by selectively increasing the signal component.
(A) Diagram of gain enhancement with (top) and without (bottom) a corresponding increase in SNR. (B) An example cell showing average spiking responses and signal-to-noise ratio (SNR) were increased by light stimulated ACh release. (C) Summary of SNR estimates from 22 ChR2-stimulated cells. ChR2 mediated ACh release significantly increased SNR (* ChR2 step vs. step + light: p=0.0343, T = 2.263). Isolating the signal (D) and noise (E, SD of spike count) components revealed a selective enhancement of the signal (mean spike count). *** P (signal) = 2.25E-9; T = 9.914; P (noise) = 0.360; T = 0.935; both paired t-tests.
Figure 9—figure supplement 1
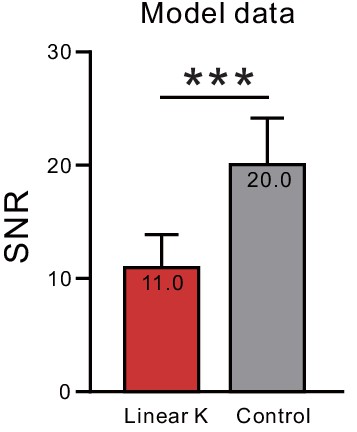
Reduction in signal-to-noise ratios with ERG-like K+ currents in a computational network model.
Parallel analysis to that presented in Figure 9C but employing simulated neurons with or without a linear K+ current that approximates ERG functional effects in pyramidal cells. ***p<1E-6, T = 22.369).
Figure 10 with 1 supplement
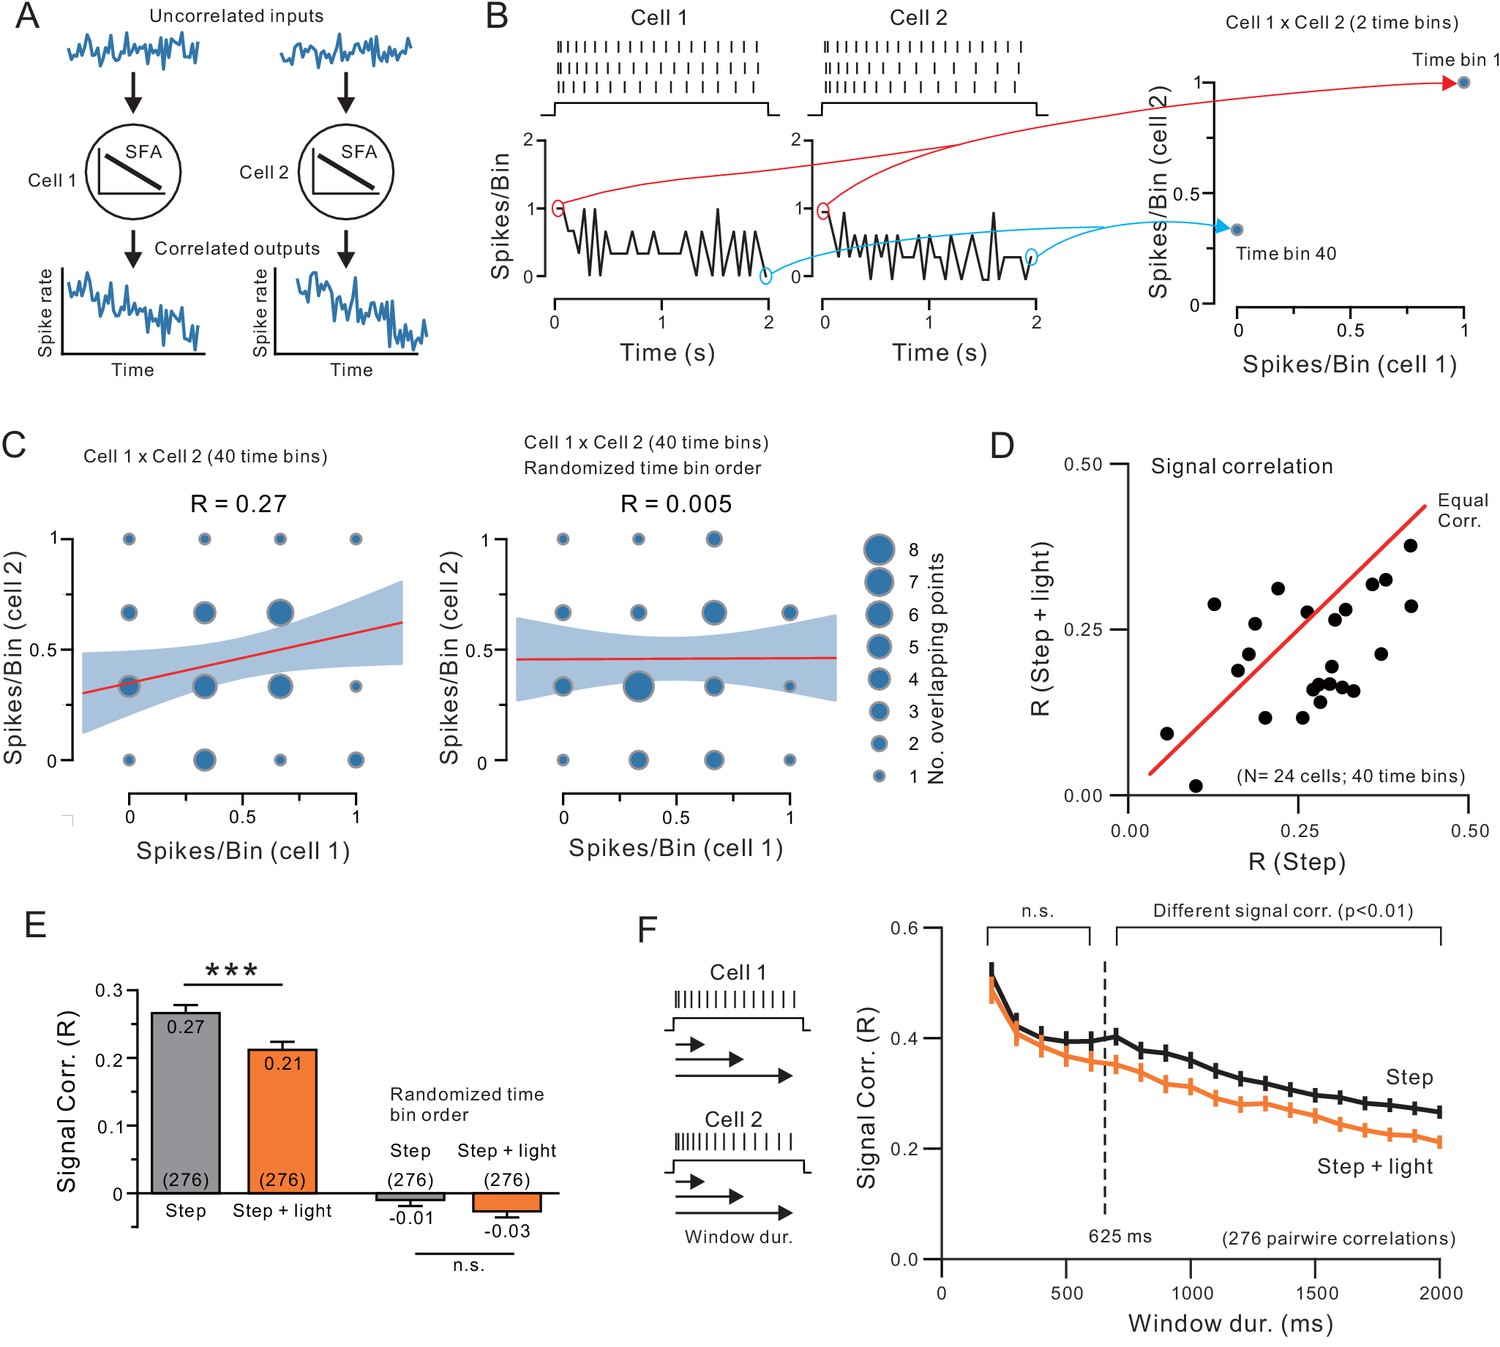
Endogenous ACh reduces signal correlation by modulating intrinsic conductances.
(A) Diagram illustrating how similar SFA can force two neurons to have correlated output discharges. (B) Example spiking responses to depolarizing steps recorded in two neocortical pyramidal cells and plots of spike count per 50 ms time bin (left). Plot on right illustrates partial correlation matrix computed from only two time bins (the first and last) from the example discharges. (C) Signal correlation was calculated by computing the Pearson’s correlation (R) between spike counts in all 40 time bins in each pair of neurons (left; linear regression and 95%ile confidence interval superimposed on correlation matrix). No signal correlation is generated in the same two-cell example comparison when time bin order is randomized (right). (D) Plot of signal correlation under control and ACh-stimulation in 24 experiments. Equal correlation levels indicated by red diagonal line. (E) Summary plot of signal correlation from all pairwise comparisons possible within virtual network of 24 neurons. ChR2 light stimulation significantly reduced signal correlation; ***p<0.0002, T = 3.932, paired t-test. Randomizing the time bin order abolished the signal correlation present in both control and ChR2 light stimulation conditions. (F) Plot of signal correlation vs. response duration in control (grey) and ACh-stimulated conditions (orange). Same dataset as E. Corresponding pairs of control and ACh-stimulated points differ significantly at response durations > 625 ms; at 650 ms: p=0.00224, T = 3.085, paired t-test. Diagram illustrating analysis protocol shown on left.
Figure 10—figure supplement 1

Computation models incorporating an ERG-like K+ conductance that increases during depolarizing step responses reproduces changes in signal correlation.
(A) Simulations performed analyzing different window durations with linear K included (red plot) and with no additional ERG-like linear K current (black plot). Inclusion of linear K current had no effect on the signal correlation apparent in short-duration responses (<500 ms) but decreased response correlation in longer duration responses (at 500 ms: p=1.922E-8, T = 5.624, two sample t-test). (B) Plot of signal correlations vs. depolarizing step amplitudes in model simulations with (red plot) and without a linear K current (black plot). All corresponding pairs of points statistically different, p<0.01; at 700 pA (highest amp): p<1E-6, T = 50.242, paired t-test. Error bars represent SD.
Additional files
-
Transparent reporting form
- https://doi.org/10.7554/eLife.44954.026
Download links
A two-part list of links to download the article, or parts of the article, in various formats.
Downloads (link to download the article as PDF)
Open citations (links to open the citations from this article in various online reference manager services)
Cite this article (links to download the citations from this article in formats compatible with various reference manager tools)
Selective attenuation of Ether-a-go-go related K+ currents by endogenous acetylcholine reduces spike-frequency adaptation and network correlation
eLife 8:e44954.
https://doi.org/10.7554/eLife.44954


