Reduced metabolism supports hypoxic flight in the high-flying bar-headed goose (Anser indicus)
- NASA Johnson Space Center, United States
- University of British Columbia, Canada
- University of Texas at Austin, United States
- University of Exeter, United Kingdom
Figures
Figure 1 with 2 supplements

CO2 production versus heart rate in FiO2=0.21 (black), FiO2=0.105 (blue), and FiO2=0.07 (red).
Normoxia and moderate hypoxia data from this study shown in (A), inset shows expansion of data at rest. N=7 birds for all data, n=89 sessions for rest in normoxia, n=113 flights in normoxia, n=54 sessions for rest in moderate hypoxia, n=74 flights in moderate hypoxia, n=13 flights in severe hypoxia (note that only one bird flew consistently in severe hypoxia), n=29 sessions for rest in severe hypoxia. In (B) oxygen consumption versus heart rate for bar-headed geese from three studies, Hawkes et al. (2011) (running, filled triangles), Ward et al. (2002) (open circles are flight and open triangles are walking), and the present study (filled circles are flight data, filled squares are rest). Note that values for the current study have been calculated from values, assuming an RER=1.
Figure 1—figure supplement 1
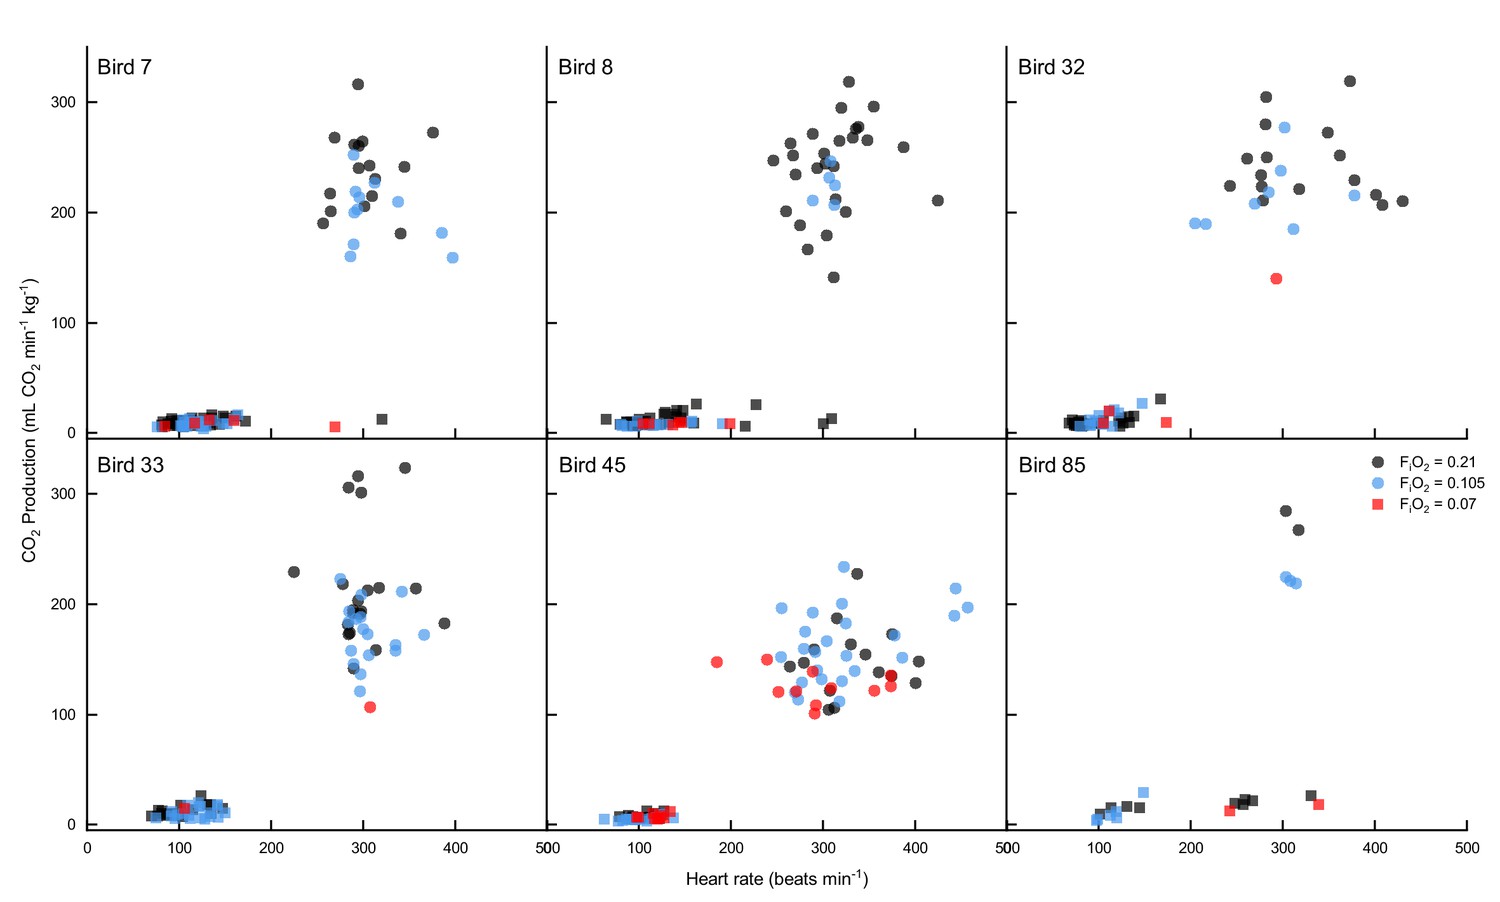
CO2 production versus heart rate for rest and preflight (squares), as well as steady-state flight (circles) separated by individual birds in FiO2 = 0.21 (black), FiO2 = 0.105 (blue), and FiO2 = 0.07 (red).
https://doi.org/10.7554/eLife.44986.005
Figure 1—figure supplement 2
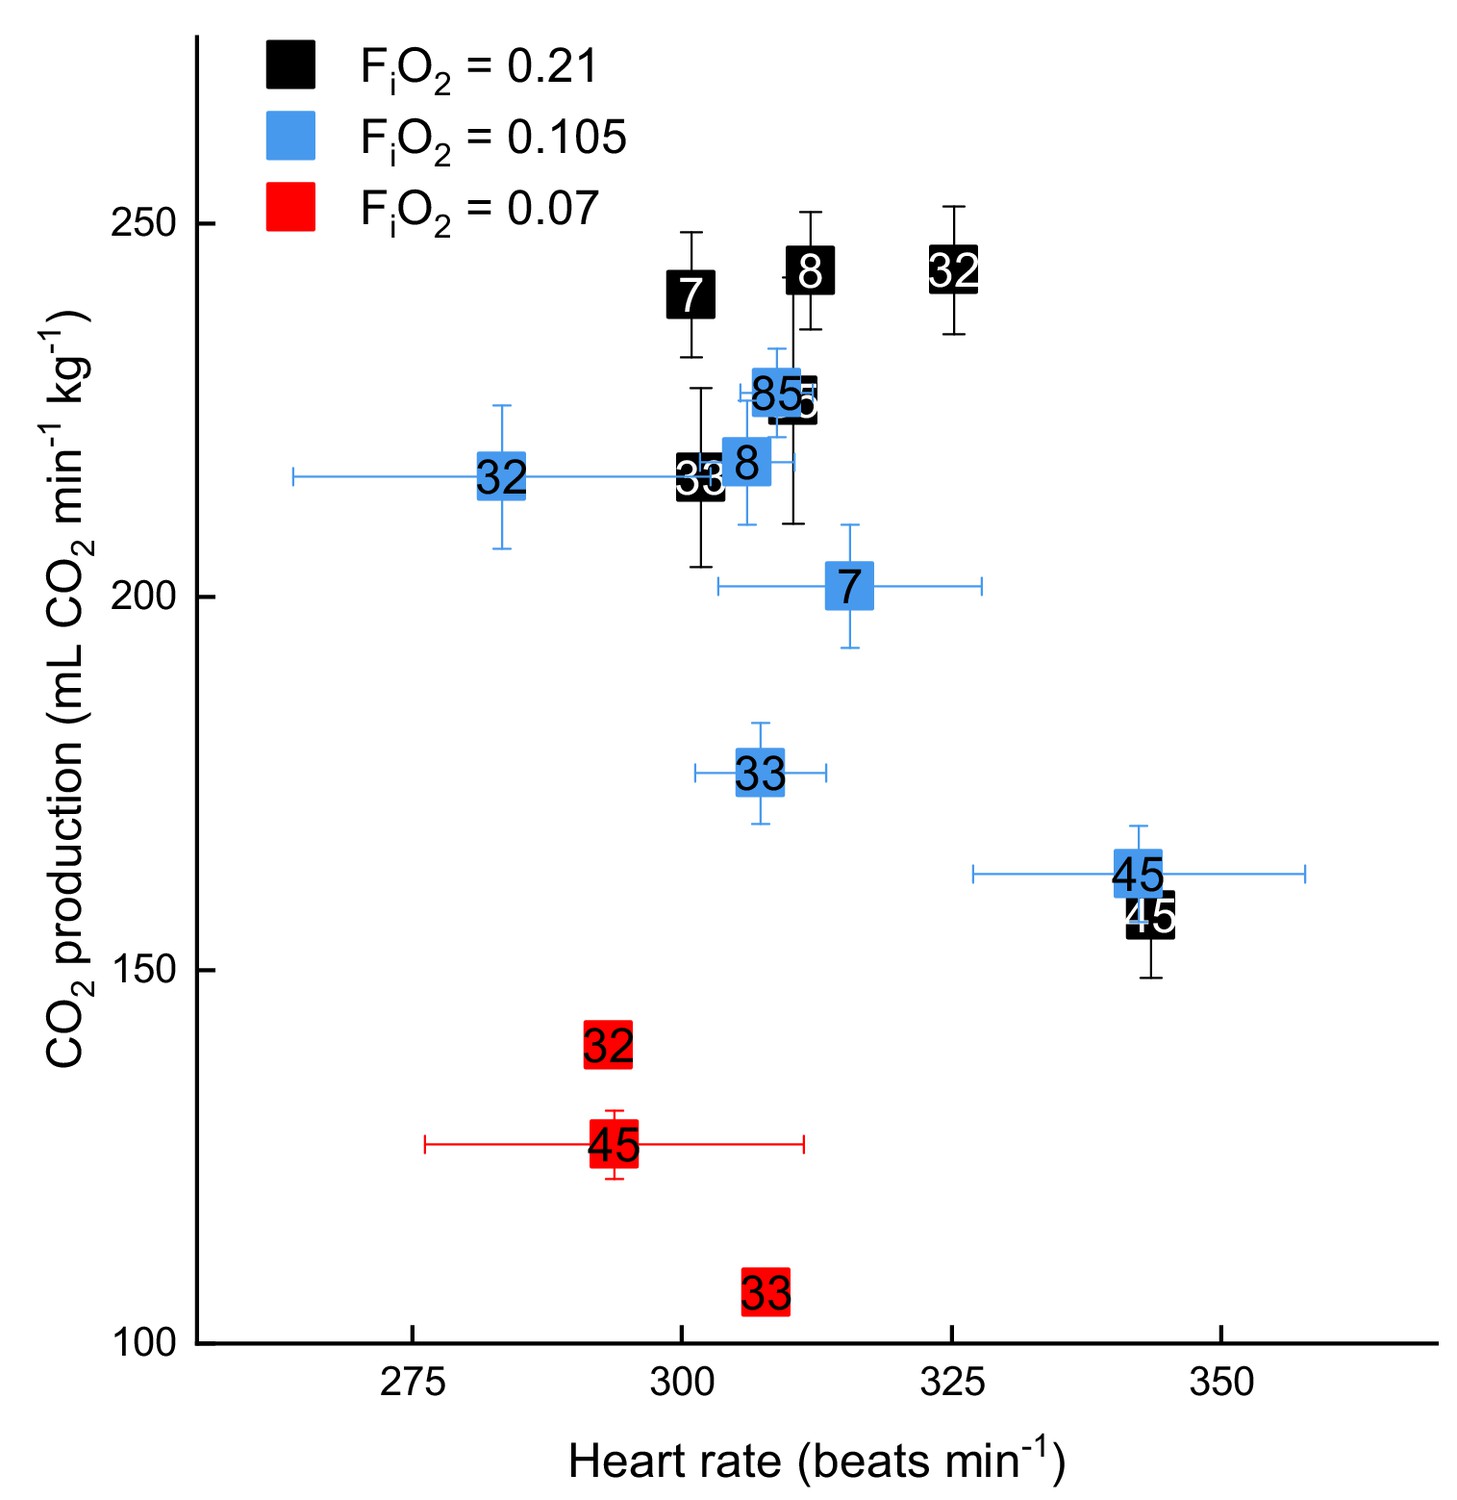
Means and standard errors in CO2 production and heart rate are plotted for flight data of individual birds, indicated by bird number.
https://doi.org/10.7554/eLife.44986.006
Figure 2
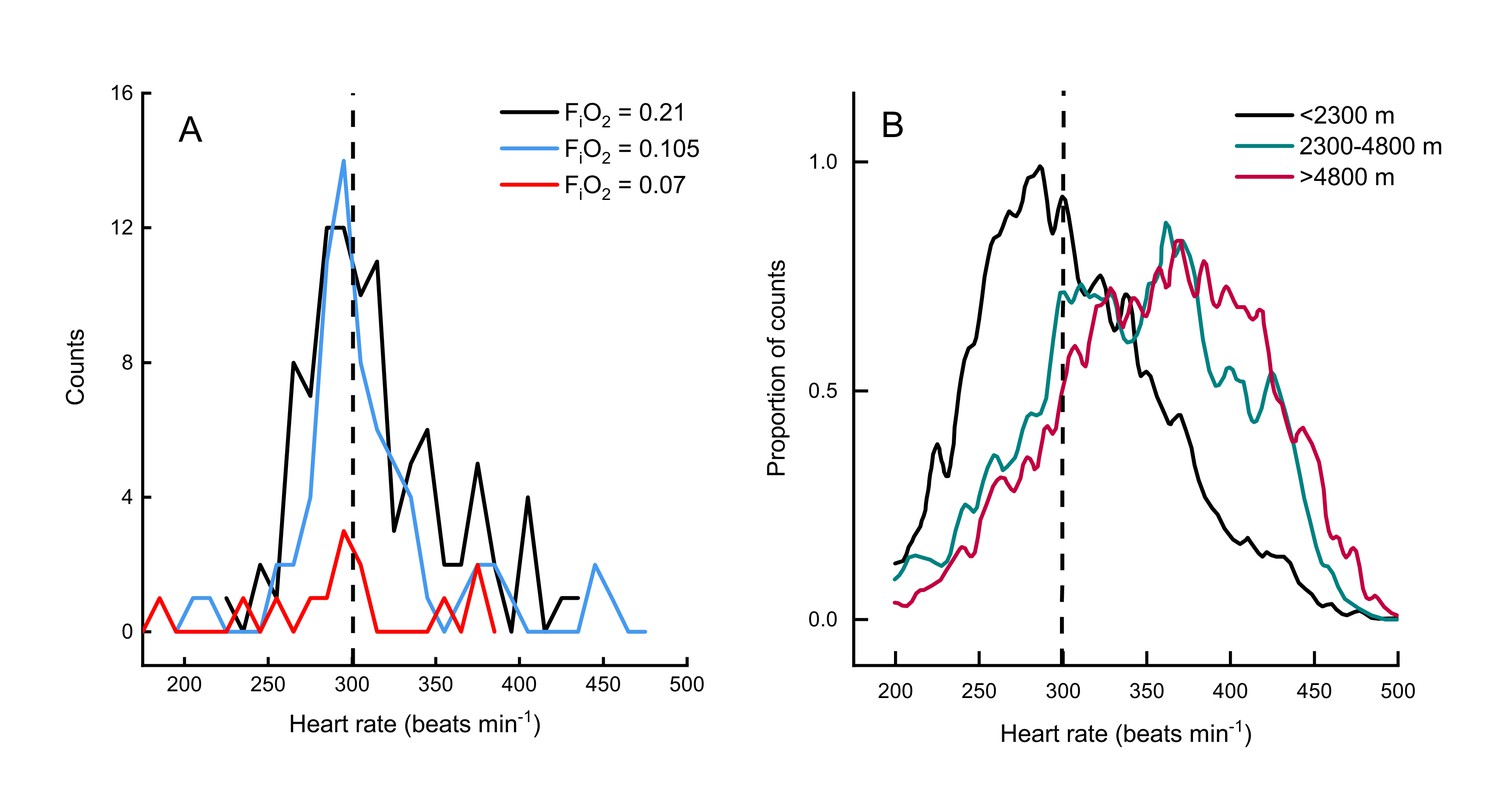
Heart rate during flights of bar-headed geese.
Line histogram distribution of heart rate measurements during flight for the present study (A) and measurements taken from wild, migrating birds by Bishop et al. (2015) (B). Dashed line shown to indicate 300 beats per minute in each plot (for aid in visual comparison only). Note that only one bird flew consistently in severe hypoxia (red trace in panel A).
Figure 3
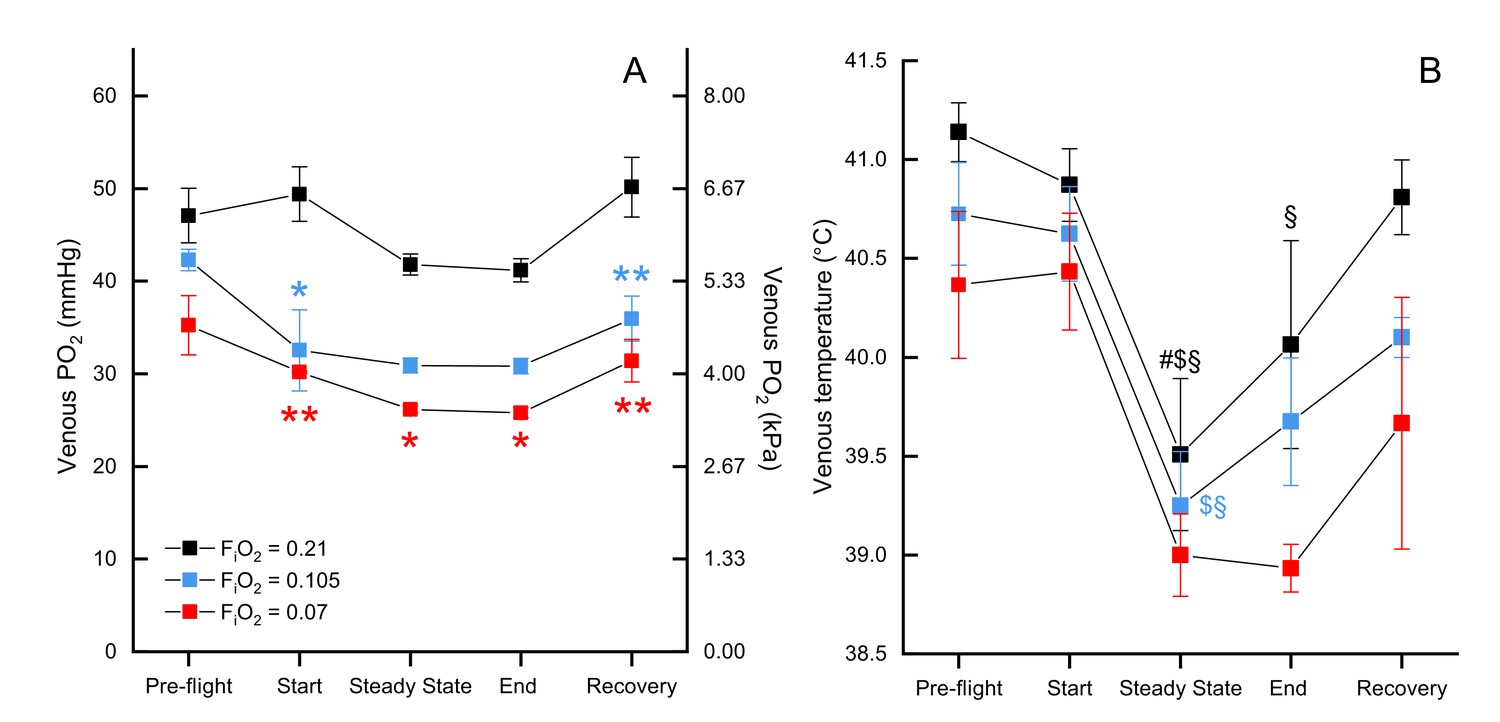
Mixed venous and temperature during flight.
Mixed venous (A) and temperature (B) in FiO2=0.21 (black, n=4 birds, 13 flights), FiO2=0.105 (blue, n=2 birds, 6 flights), and FiO2=0.07 (red, n=1 bird, 3 flights). Time points shown along x-axis: 'pre-flight' is steady state before flight begins, 'start' at the start of the flight, 'steady state' is steady state in flight, 'end' at the end of the flight, 'recovery' is steady state after the bird lands. Asterisks indicate significant difference from normoxia (* indicates p<0.05; ** indicates p<0.01; *** indicates p<0.001, § indicates difference from pre-flight value, # indicates difference from recovery value, and $ indicates difference from start value).
Figure 4
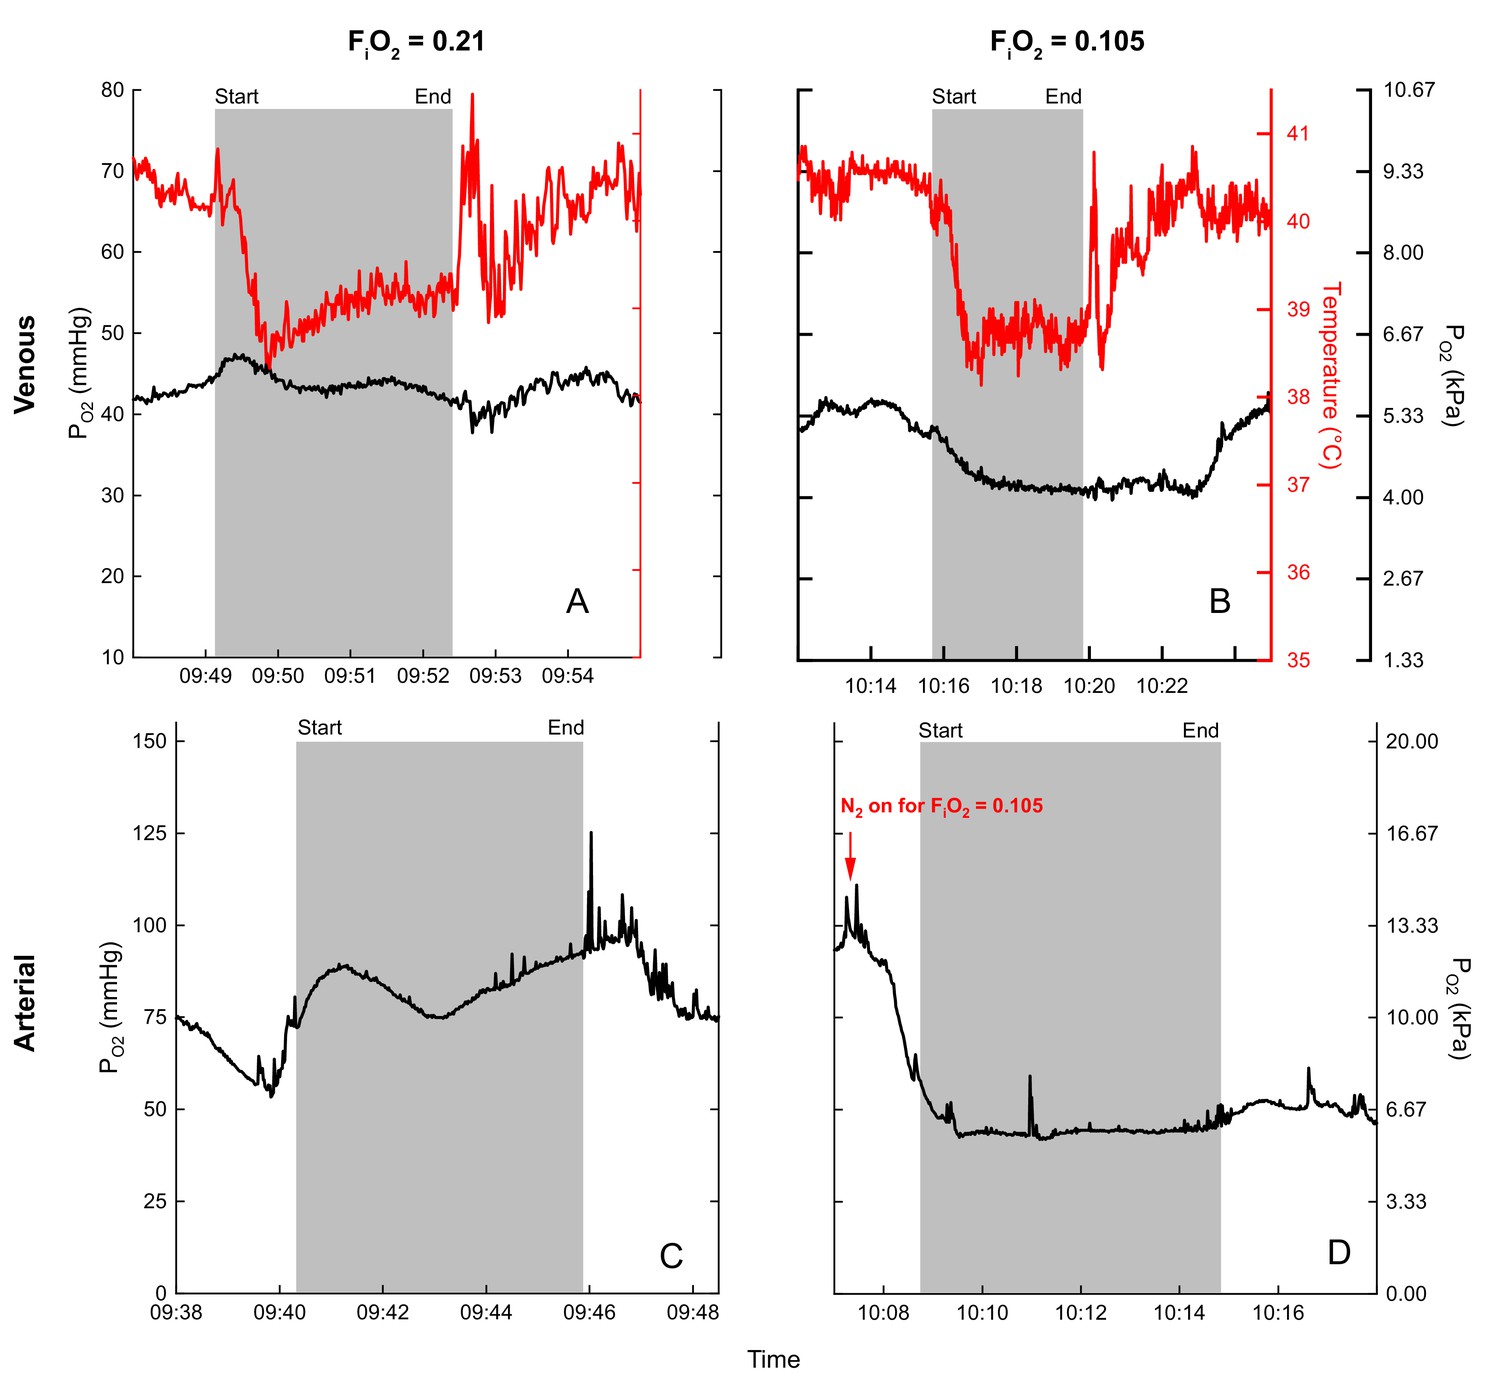
Examples of blood (black) and temperature (red) recordings during flight (gray shaded area) in normoxia (venous (A), arterial (C)) and hypoxia (venous (B), arterial (D)) for bird 45.
Flight duration of (A) 3.3 minutes, (B) 4.2 minutes, (C) 5.7 minutes, and (D) 5.5 minutes.
Figure 5 with 1 supplement
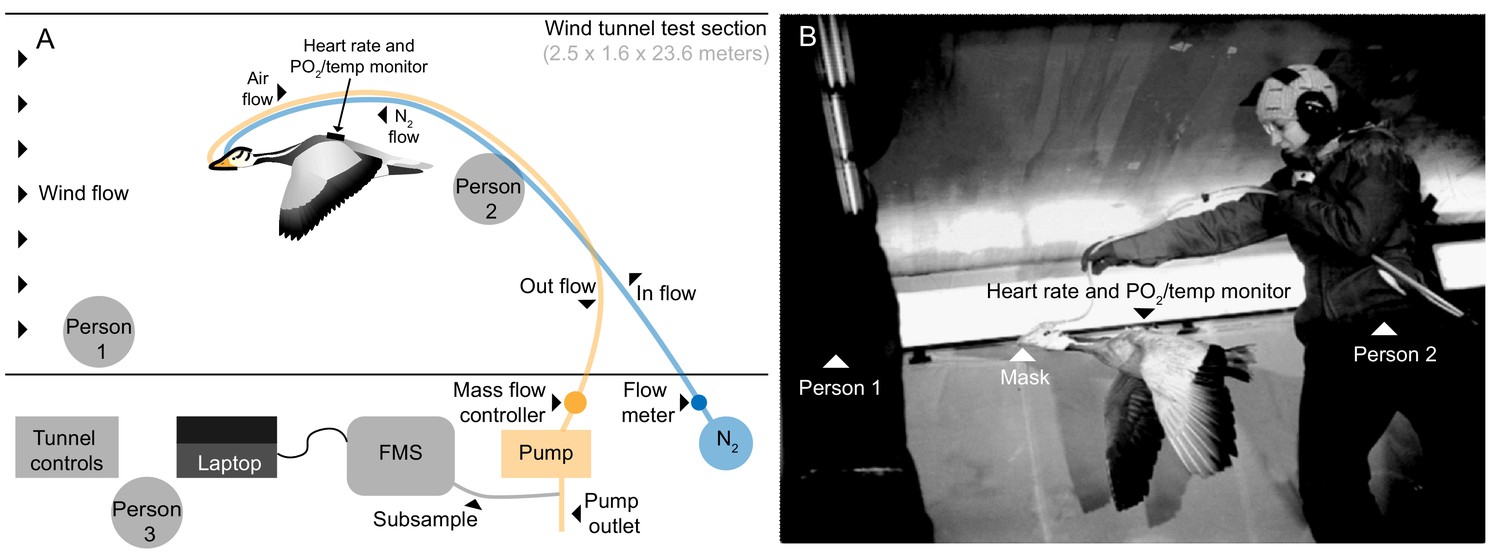
Flight tunnel experimental set up.
(A) Schematic and (B) photo showing the set up in the wind tunnel. The goose flew in center of wind tunnel test section while person one encouraged flight and person two supported tubing. Tubes ran from mask out of the tunnel, one introducing a calibrated amount of dry nitrogen into the mask, and the other pulling from the mask by way of an air pump. A subsample of the outflow was pulled into the field metabolic system (FMS). Person three operated the tunnel and equipment.
Figure 5—figure supplement 1

Flight training with goose and foster parent (JUM) on a motor scooter, undertaken as the wind tunnel was undergoing repair at the time of fledging.
Photo credit: K. Kuker.
Videos
Video 1
Flight training with goose and foster parent (JUM) on a motor scooter, undertaken as the wind tunnel was undergoing repair at the time of fledging.
https://doi.org/10.7554/eLife.44986.010
Video 2
Goose flying in tunnel during FiO2 = 0.105 experiment.
Person one can be seen to the left of the screen, person two supported the tubes, and person three operated the experimental hardware and wind tunnel. Filmed at 125 frames per second, shown here at 7.5 frames per second playback. Video credit: J. Whale.
Tables
Table 1
Compiled flight, respiratory, and cardiovascular data from all three O2 levels tested during rest (sitting bird, often asleep), pre-flight (standing bird just before flight), and steady-state flight (steady-state determined by CO2 production).
Values are mean ± SEM. Asterisks indicate significant difference from normoxia (linear mixed model ANOVA; * indicates p<0.05; ** indicates p<0.01; *** indicates p<0.001).
| Normoxia 0.21 FiO2 | Moderate hypoxia 0.105 FiO2 | Severe hypoxia 0.07 FiO2 | |
|---|---|---|---|
| Flight length (sec) Mean ± se (range) | 195 ± 12 (55−663) | 174 ± 14 (54−826) | 139 ± 29** (60−468) |
| n Birds | 7 | 6 | 3 |
| n Flights | 113 | 74 | 13 |
| Wingbeat frequency (Hz) | 4.97 ± 0.27 | 4.91 ± 0.28 | (-) |
| Rest: | |||
| (ml O2 min−1 kg−1) | 12.5 ± 0.4 | (-) | (-) |
| (ml CO2 min−1 kg−1) | 10.1 ± 0.5 | 7.9 ± 0.5 | 9.1 ± 0.7 |
| RER | 0.80 ± 0.02 | (-) | (-) |
| Heart rate (bpm) | 126.4 ± 7.4 | 108.1 ± 4.1 | 149.2 ± 24** |
| CO2 pulse (ml CO2 beat−1 kg−1) | 0.085 ± 0.003 | 0.074 ± 0.003 | 0.068 ± 0.005 |
| Pre-flight: | |||
| (ml O2 min−1 kg−1) | 16.0 ± 0.6 | (-) | (-) |
| (ml CO2 min−1 kg−1) | 13.6 ± 0.6 | 10.0 ± 0.7 | 9.69 ± 1.9 |
| RER | 0.86 ± 0.02 | (-) | (-) |
| Heart rate (bpm) | 114.2 ± 2.9 | 120.8 ± 3.5 | 117.0 ± 7.9 |
| CO2 pulse (ml CO2 beat−1 kg−1) | 0.11 ± 0.004 | 0.081 ± 0.006 | 0.071 ± 0.016 |
| Flight: | |||
| (ml O2 min−1 kg−1) | 222.6 ± 3.5 | (-) | (-) |
| (ml CO2 min−1 kg−1) | 222.2 ± 4.9 | 186.8 ± 4.2*** | 126.1 ± 4.3*** |
| RER | 0.99 ± 0.01 | (-) | (-) |
| Heart rate (bpm) | 313.3 ± 4.1 | 312.1 ± 6.7 | 329.0 ± 14.3 |
| CO2 pulse (ml CO2 beat−1 kg−1) | 0.72 ± 0.02 | 0.61 ± 0.02*** | 0.45 ± 0.04*** |
Additional files
-
Supplementary file 1
Physiological measurements from bird 45 only.
Values are mean ± SEM. Asterisks indicate significant difference from normoxia (ANOVA; * indicates p<0.05; ** indicates p<0.01; *** indicates p<0.001).
- https://doi.org/10.7554/eLife.44986.014
-
Supplementary file 2
Mixed venous and metabolic data collected from the subset of flights during which mixed venous was measured.
Values are mean ± SEM. Asterisks indicate significant difference from normoxia (linear mixed model ANOVA; * indicates p<0.05; ** indicates p<0.01; *** indicates p<0.001).
- https://doi.org/10.7554/eLife.44986.015
-
Supplementary file 3
Arterial and metabolic data collected from the subset of flights during which arterial was measured (therefore bird 45 only).
Values are mean ± SEM. Asterisks indicate significant difference from normoxia (ANOVA; * indicates p<0.05; ** indicates p<0.01; *** indicates p<0.001).
- https://doi.org/10.7554/eLife.44986.016
-
Supplementary file 4
Kinematic variables reported as mean ± SEM for four bar-headed geese flown from 12.5 ms−1 to 15.0 ms−1 in normoxia (FiO2 = 0.21) and moderate hypoxia (FiO2 = 0.105).
Data in this table are from a separate unpublished study on the same birds as the primary study. Each mean is the average of 40 wingbeat values. Asterisks (*) indicate statistically significant comparisons between normoxia and moderate hypoxia in a mixed model analysis after posthoc application of the false discovery rate. Frequency is calculated as the inverse of the entire wingbeat duration, not in terms of the upstroke or downstroke alone.
- https://doi.org/10.7554/eLife.44986.017
-
Transparent reporting form
- https://doi.org/10.7554/eLife.44986.018
Download links
A two-part list of links to download the article, or parts of the article, in various formats.
Downloads (link to download the article as PDF)
Open citations (links to open the citations from this article in various online reference manager services)
Cite this article (links to download the citations from this article in formats compatible with various reference manager tools)
Reduced metabolism supports hypoxic flight in the high-flying bar-headed goose (Anser indicus)
eLife 8:e44986.
https://doi.org/10.7554/eLife.44986


