Ventrolateral periaqueductal gray neurons prioritize threat probability over fear output
- Boston College, United States
Figures
Figure 1 with 6 supplements
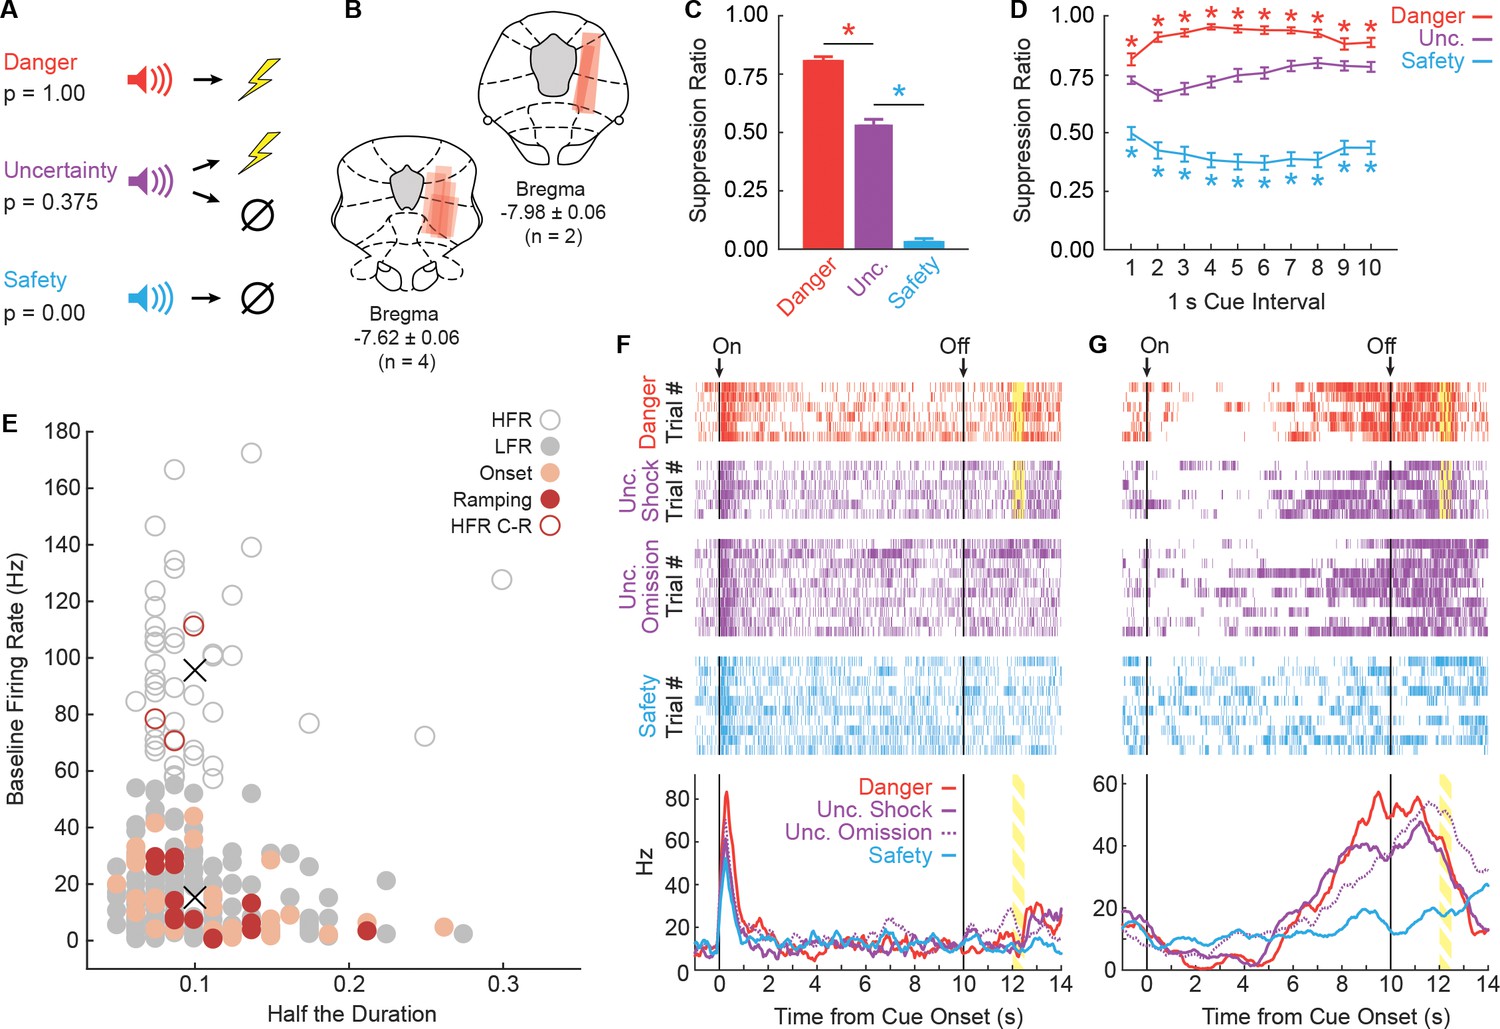
Fear discrimination, histology and vlPAG single-unit activity.
(A) Pavlovian fear discrimination consisted of three cues, each predicting a unique probability of foot shock: danger, p=1.00 (red); uncertainty, p=0.375 (purple); and safety, p=0.00 (blue). (B) Microelectrode bundle placements for all rats (n = 6) and all neurons (n = 245) during recording sessions are represented by red bars. (C) Mean + SEM suppression ratio during the entire 10 s cue for danger, uncertainty, and safety trials is shown for all sessions in which single-units were recorded (n = 88). Discrimination was observed for each cue pair (danger vs. uncertainty, t87 = 12.36, p=7.44×10⁻²¹, red asterisk; uncertainty vs. safety, t87 = 20.85, p=3.50×10⁻³⁵, blue asterisk). (D) Mean ± SEM suppression ratio during each 1 s interval of 10 s cue presentation for danger, uncertainty, and safety trials is shown (n = 88). Discrimination was observed during every interval for each cue pair (danger vs. uncertainty, all t87 >3.00, all p<0.005 [Bonferroni correction for 10 tests], red asterisks; uncertainty vs. safety, all t87 >7.00, all p<0.005, blue asterisks). (E) Scatterplot comparing half the duration of the waveform (x axis) to baseline firing rate (y axis) in all recorded neurons (n = 245). Clustering revealed two populations based on baseline firing rate (High Firing Rate (HFR), open circles; Low Firing Rate (LFR), solid gray circles). X symbols indicate cluster centroids. Onset neurons (n = 29, peach), Ramping neurons (n = 14, maroon) and HFR cue-responsive neurons (n = 3, maroon outline) are indicated. (F and G) Representative single-units from the (F) Onset population and (G) Ramping population. Cue onset (On) and offset (Off) indicated by vertical black lines. Shock delivery indicated by yellow bars. Trial-by-trial firing (top four raster plots), as well as mean firing (bottom, line graphs) are shown for each neuron. Each raster tick represents a spike and each row of spikes reflects one trial [danger (n = 6), uncertainty shock (n = 6), uncertainty omission (n = 10), safety (n = 10)]. The bottom row of spikes in each raster plot corresponds to the first cue trial, subsequent trials are above. Line graphs: Mean firing rate (Hz) across all trials for each cue was constructed using 100 ms bins and smoothed, cue boundaries and shock visualization maintained from raster plots above.
Figure 1—figure supplement 1

Fear discrimination measured by nose poke rate.
(A) Mean + SEM nose poke during baseline (open bars) and cue (filled bars) plotted for each trial type, for all 88 recording sessions. Asterisks indicate a significant difference between baseline and cue (paired samples t-test, p<0.05). Baseline nose poke rates did not differ between trial types and rats showed significant reductions in poking to danger and uncertainty, but not safety. (B) Relationship between suppression ratio and nose poke rate for each cue (3) and session (88) is shown. The two measures were significantly correlated, particularly for danger and uncertainty. (C) Mean ± SEM nose poke rate shown for each trial type and number (danger 6, uncertainty-shock 6, uncertainty-omission 10 and safety 10). Nose poke patterns were stable across the discrimination session. (D) Mean ± SEM nose poke rate shown in 1 s bins across the cue period for each trial type (4). Overall patterns mimicked those in A, but now temporal changes were apparent. Uncertainty and danger showed similar decreases in poking at cue onset, diverged, then converged as shock drew closer. Nose poking returned to base line rates within approximately 4 s of shock delivery.
Figure 1—figure supplement 2
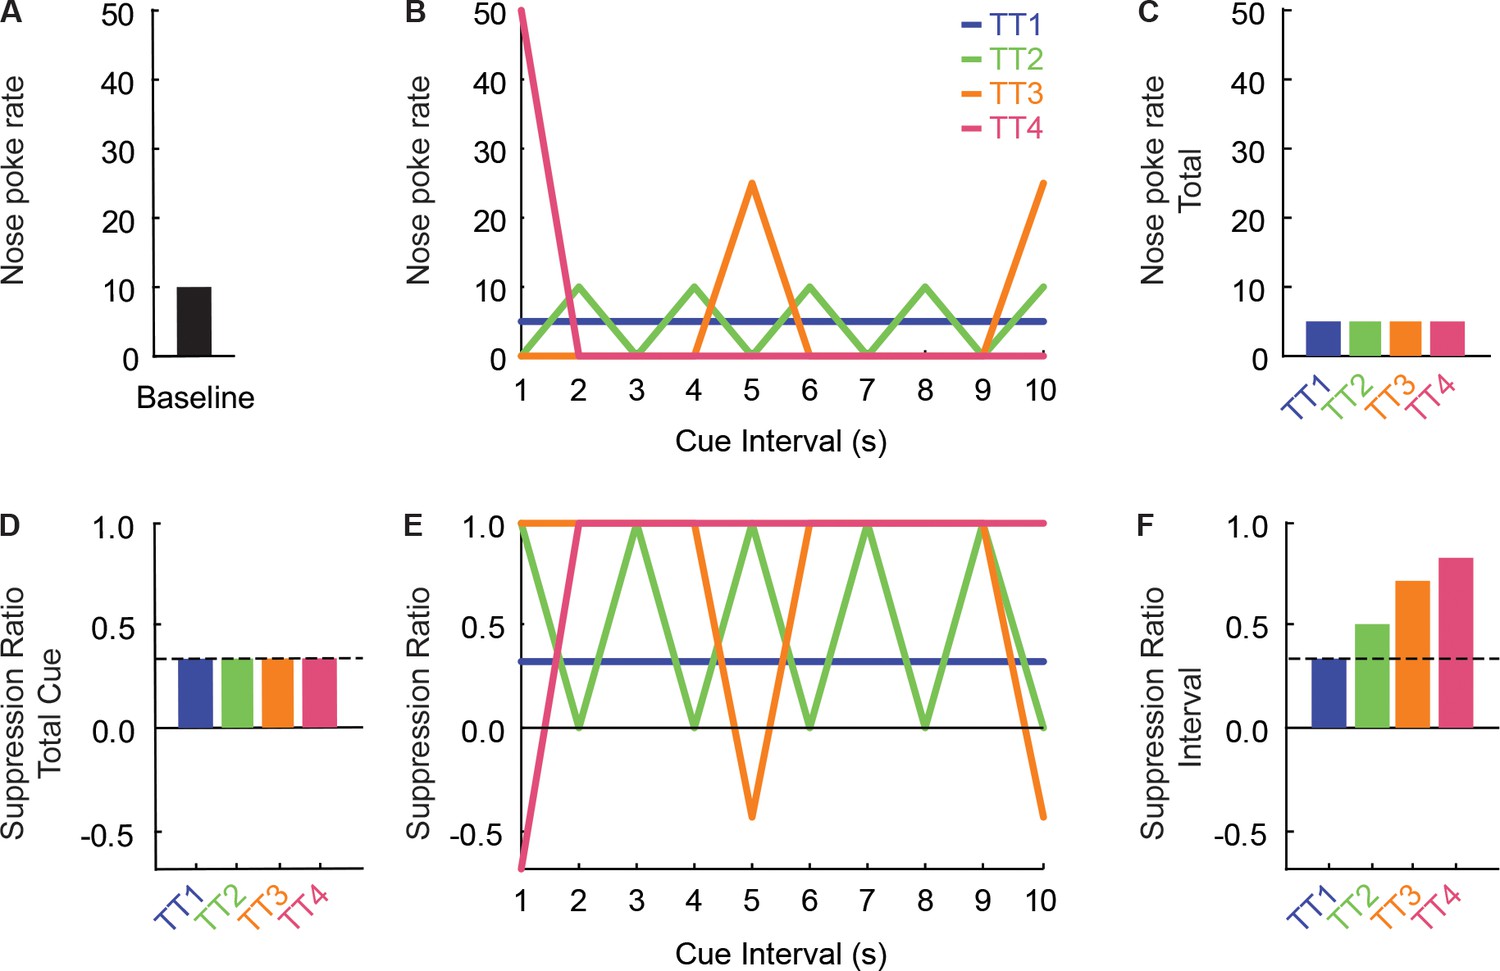
Imperfectly distributed nose poking inflates interval suppression ratios.
In this study, and others from our lab, we consistently find that calculating suppression ratios in short intervals inflates suppression ratios. Here we use hypothetical nose poke data from four trial types to account for this finding. (A) For all trial types, the baseline nose poke rate is 10 (pokes/unit time). (B) Nose poke rate during each 1 s interval of the 10 s cue is shown for the four trial types. In trial type 1 (blue), nose poking is perfectly distributed across all ten intervals (five pokes/unit time). In trial type 2 (green), nose poking alternates between 0 pokes/unit time and 10 pokes/unit time every 1 s interval. In trial type 3 (orange), nose poking spikes to 25 pokes/unit time in two intervals, but is zero in all other intervals. In trial type 4 (pink), nose poking is confined to a single interval (50 pokes/unit time). (C) These four trial types produce equivalent levels of nose poking when rate over the total cue is considered (five pokes/unit time). (D) As expected, calculation of a suppression ratio for the total cue produces identical ratios for each trial type (suppression ratio = 0.333). (E) Calculation of a suppression ratio for each interval, for each trial type, mirrors the pattern of nose poking. The suppression ratio calculation is designed for maximal sensitivity in detecting decreases in poking. A suppression ratio of 1.0 is found [(10-0) / (10 + 0) = 1.0] when no poke occurs in an interval. Extreme increases in poking (Trial Type 4, First Interval) are not weighted equivalently to extreme decreases, yielding suppression ratios that fall well short of −1.0 [(10-50) / (10 + 50) = −0.667]. (F) Calculating a suppression ratio for each interval, then averaging the 10 intervals, only produces a ratio equivalent to the total cue if nose poke rates are perfectly distributed across the entire 10 s cue (as in Trial Type 1, suppression ratio = 0.333). Of course, the natural nose poking behavior of a rat will never match this fixed schedule. As nose poking becomes imperfectly distributed over the 10 s cue, the mean suppression ratio across all intervals increases [TT4 (0.83) > TT3 (0.71) > TT2 (0.50)]. For this reason, suppression ratios calculated in short time intervals (F) produce inflated suppression ratios compared to the total cue (D). However, inflation is uniform for danger, uncertainty and safety trials, making suppression ratios in short intervals valuable for detected relative differences in suppression ratios.
Figure 1—figure supplement 3
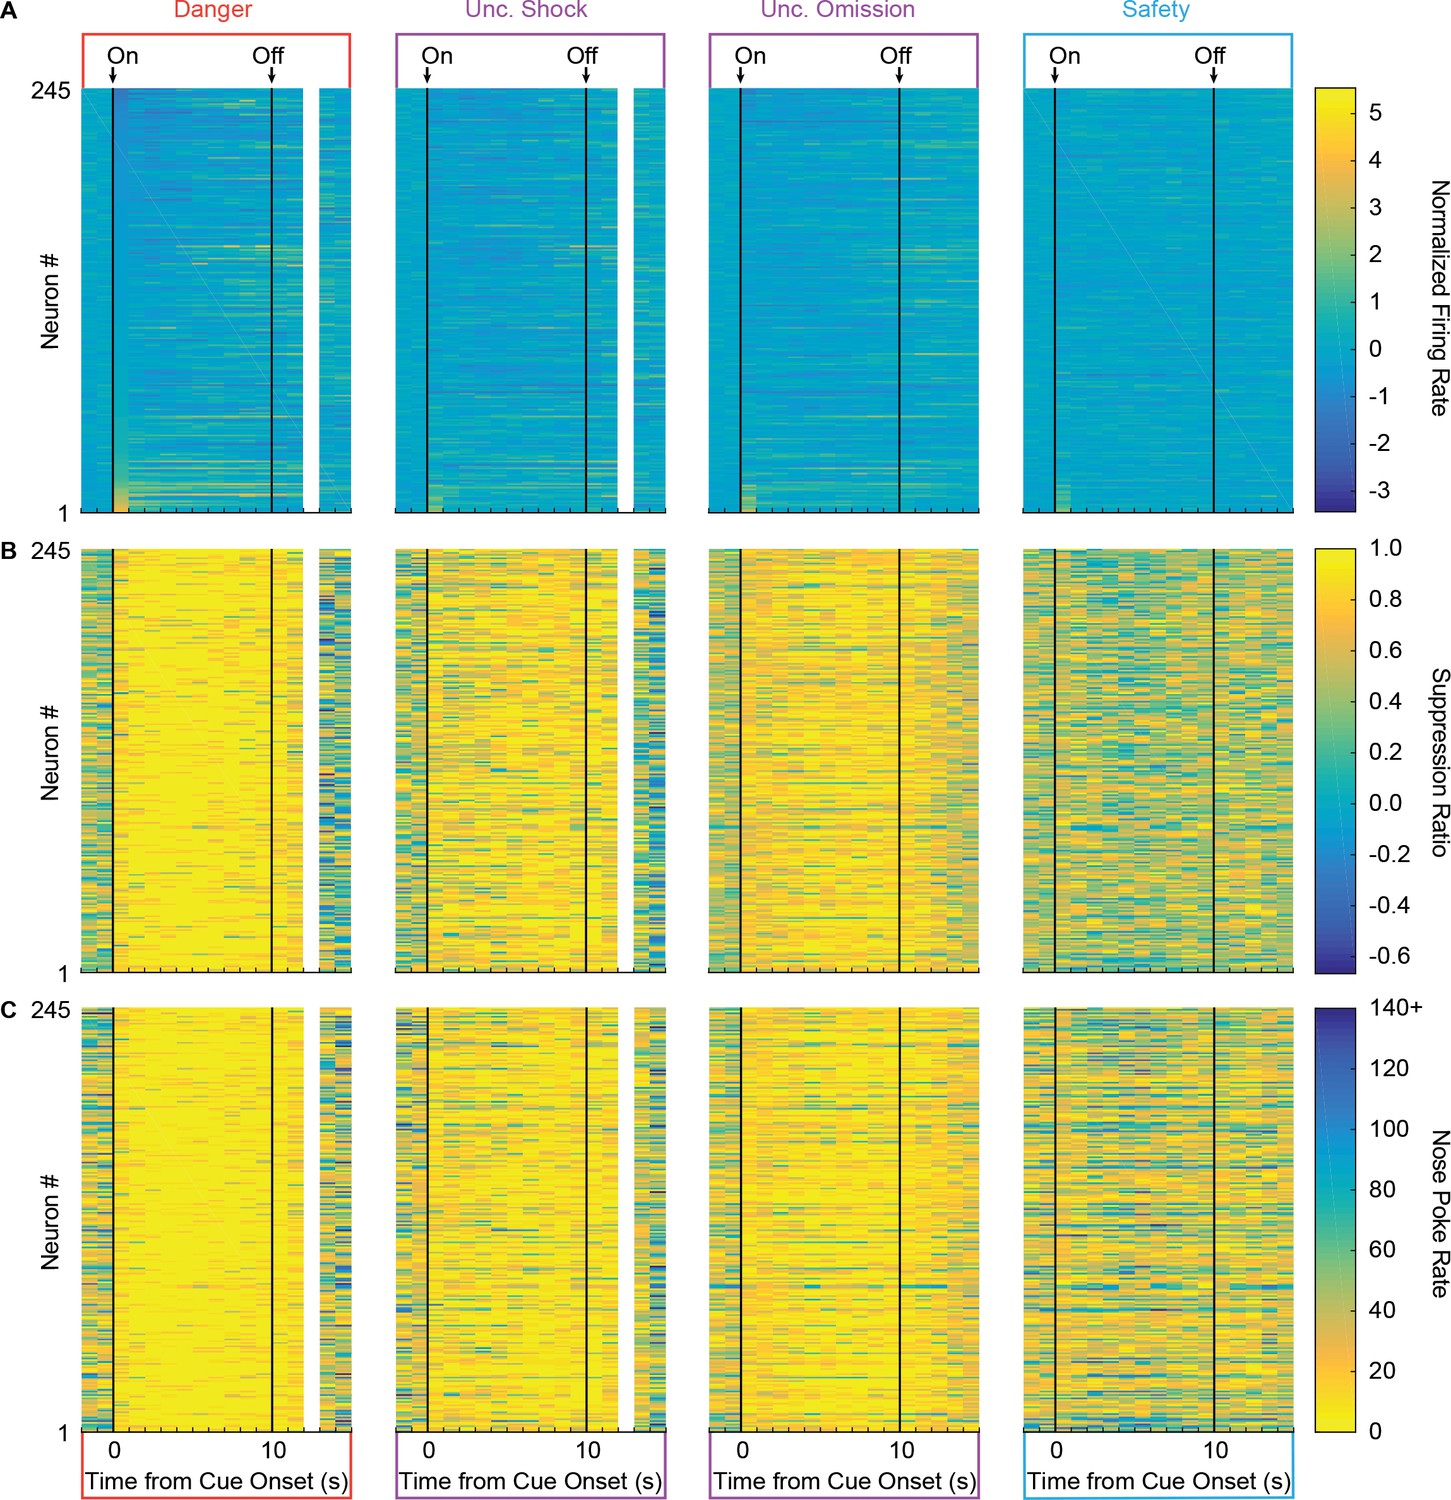
Firing and behavior for every recorded neuron.
(A) A heat plot for normalized firing rate in 1 s intervals is shown for each neuron (y axis, n = 245) prior to and following cue onset for each trial type (danger, uncertainty shock, uncertainty omission and safety). Color scale for normalized firing rate is shown to the right; yellow indicates high firing and blue low firing. Firing rate during foot shock period could have been contaminated by noise artifact and is not shown. (B) An identical heat plot is made for suppression ratio; yellow indicates high suppression ratio and high fear, whereas dark blue indicates low suppression ratio and low fear. (C) Heat plot for nose poke rate; yellow indicates low nose poke rates and dark blue indicates high nose poke rates. Order of neurons 1–245 maintained for A, B and C. Note the virtually identical patterns of behavior obtained with suppression ratio and nose poke rate.
Figure 1—figure supplement 4
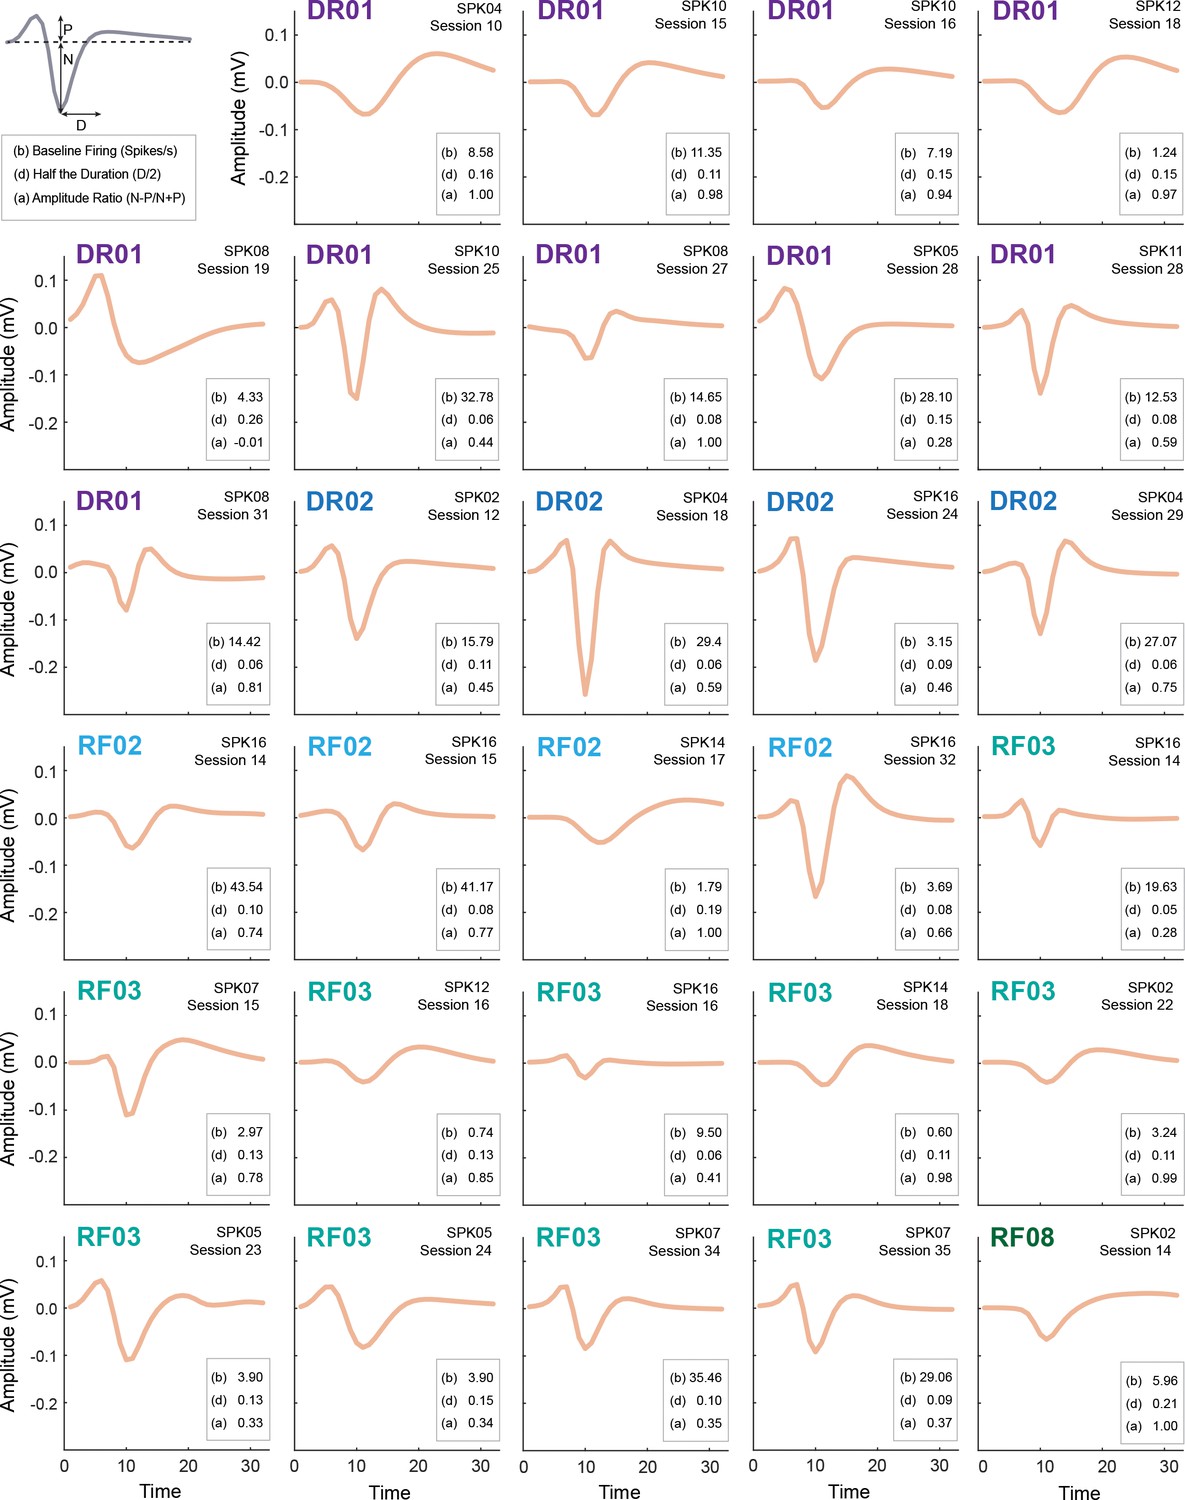
Waveform and firing characteristics of Onset neurons.
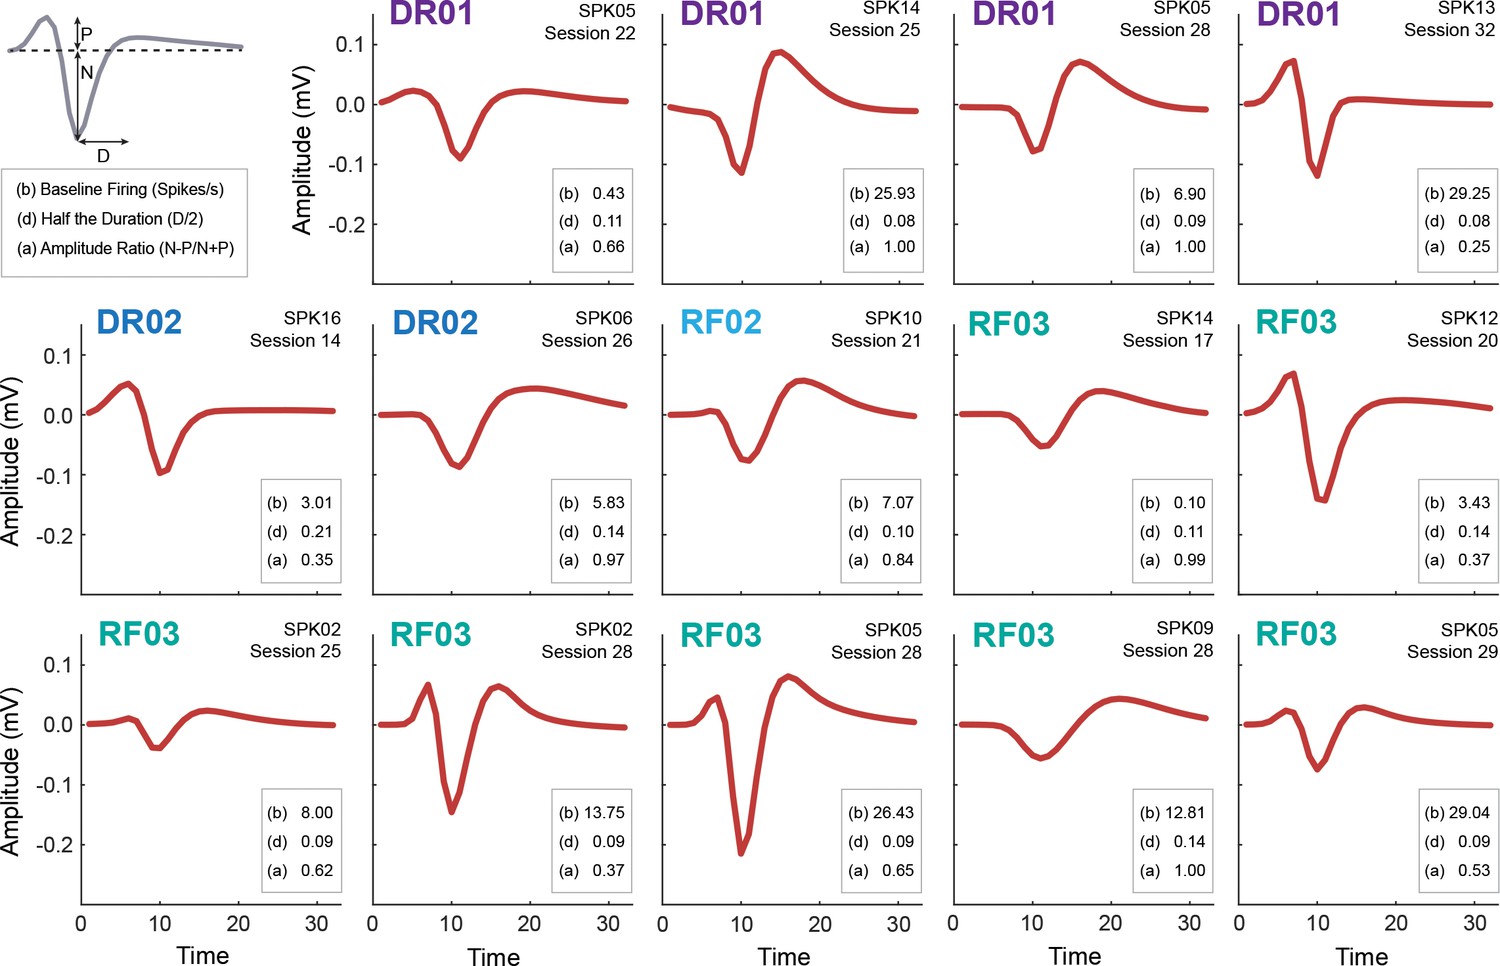
Mean waveform (mV x time) is shown for each Onset neuron (n = 29, waveform color is peach as in Figure 1E). For each neuron, the baseline firing rate (b), half the duration (d) and amplitude ratio (a) are provided. The waveform properties used to determine half the duration (D) and the properties contributing to the amplitude ratio (N and P) are demonstrated in the top left. The individual the neuron was obtained from is shown in the upper left, animal identity is color coded. The spike number, indicating the channel on which the neuron was recorded, and the behavior session # are shown in the top right. We performed a correlation analysis to determine if the waveform shape of each neuron was more correlated with waveform from the same individual, vs. the other individuals. R2 values were determined for each waveform pair (n = 28), then a two-tailed t-test (p<0.05, uncorrected) was performed comparing the R2 values from the same individual or all others. Only three neurons from one individual, RF03 (SPK05/Session 23, SPK07/Session 34 and SPK07/Session 35), were found to have waveforms that were more similar to neurons from that individual than others. However, any correction on this p value (28 tests were performed for each waveform) resulted in no neuron achieving significance. Further, only two of these neurons (SPK07/Session 34 and SPK07/Session 35) showed cue activity patterns that resembled one another. Removal of one or both of these waveforms did not impact any statistical result.
Figure 1—figure supplement 5
High firing cue-responsive units.
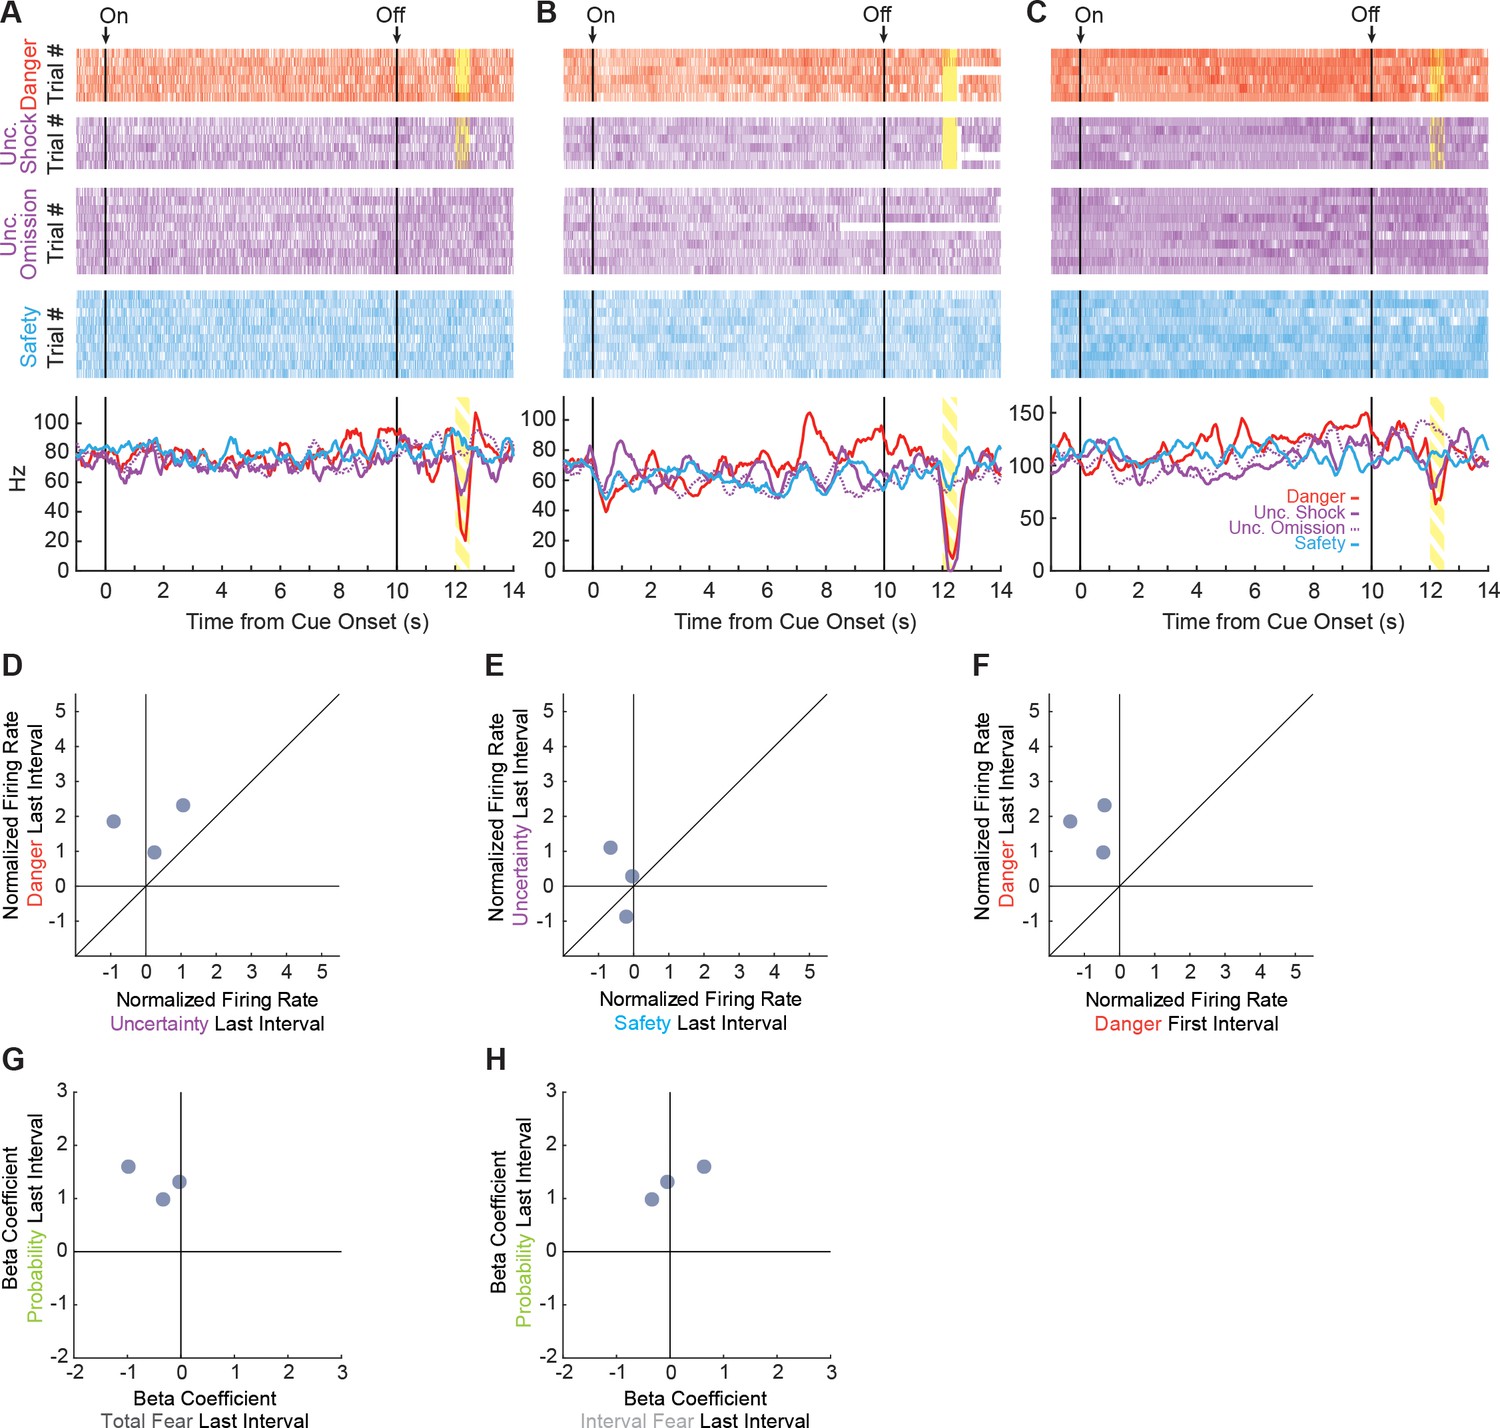
K-means cluster analysis revealed three neurons in the High Firing Rate cluster that were responsive to at least one cue during the last 1 s interval. Trial-by-trial firing (top four raster plots) and mean firing (bottom, line graphs) are shown for each neuron (A, B and C) and each trial type (danger, red; uncertainty shock/omission (dashed), purple; and safety, blue). Each raster tick represents a spike and each row of spikes reflects one trial [danger (n = 6), uncertainty shock (n = 6), uncertainty omission (n = 10) and safety (n = 10)]. The bottom row of spikes in each raster plot corresponds to the first cue trial, subsequent trials are above. Bottom: Mean firing rate (Hz) across all trials for each cue was constructed using 100 ms bins and smoothed, cue boundaries and shock visualization maintained from the raster plots above. Each neuron showed maximal firing to danger in the last 1 s cue interval. We visualized single-unit firing of the three HFR units to danger vs. uncertainty (D), uncertainty vs. safety (E) and danger first interval vs. danger last interval (F) as in Figure 4. We also visualized single-unit beta coefficients for total fear vs. probability (G) and interval fear vs. probability (H) as in Figure 5. HFR cue-responsive units signaled threat probability.
Figure 1—figure supplement 6
Waveform and firing characteristics of Ramping neurons.
Mean waveform (mV x time) is shown for each Ramping neuron (n = 14, waveform color maroon as in Figure 1E). For each neuron, the baseline firing rate (b), half the duration (d) and amplitude ratio (a) are provided. The waveform properties used to determine half the duration (D) and the properties contributing to the amplitude ratio (N and P) are demonstrated in the top left inset. The individual the neuron was obtained from is shown in the upper left, with identity color coded. The spike number, indicating the channel on which the neuron was recorded, and the behavior session # are shown in the top right. We performed a correlation analysis to determine if the waveform shape of each Ramping neuron was more correlated with waveform shapes from the same individual, vs. the other individuals. R2 values were determined for each neuron pair (n = 13), then a two-tailed t-test (p<0.05, uncorrected) was performed comparing the R2 values from the same individual or all others. No waveform shape was more similar to those obtained from the same individual compared to those obtained from others.
Figure 2 with 2 supplements

vlPAG neurons are responsive to cue onset or ramp over cue presentation.
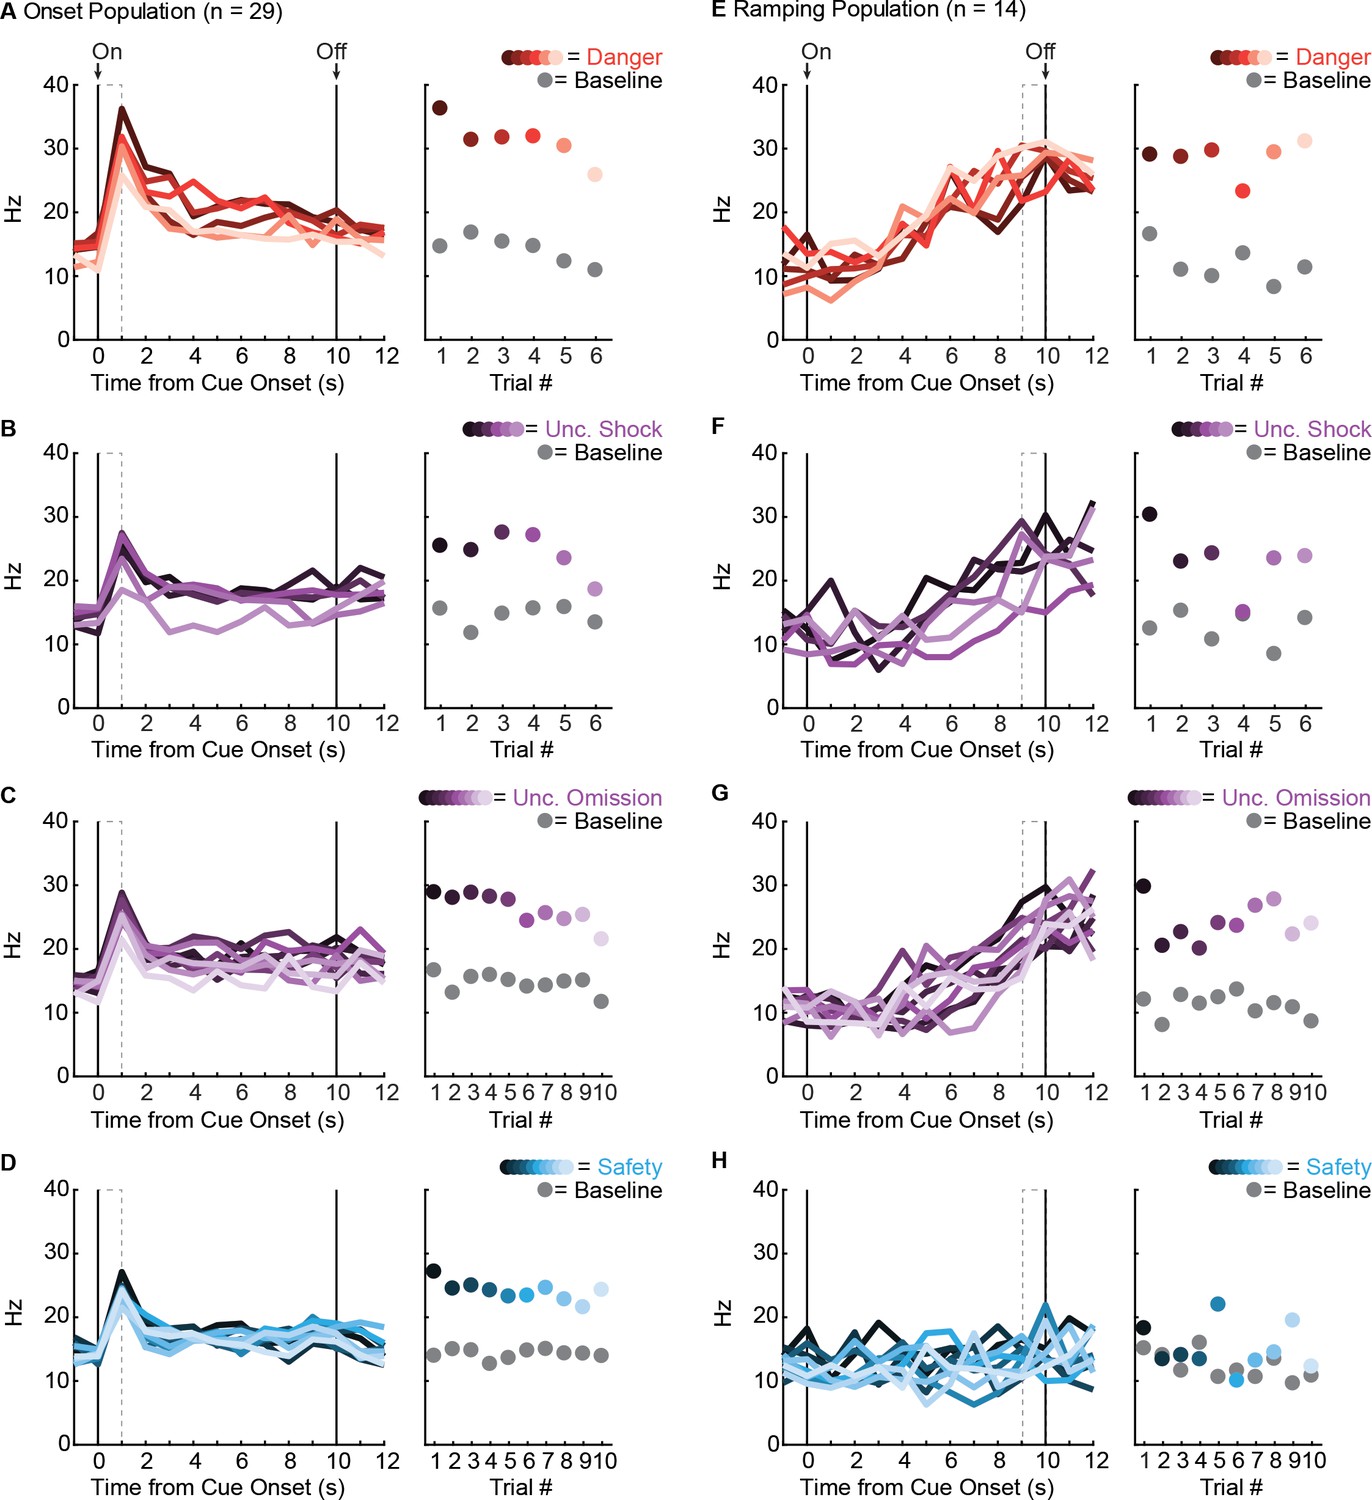
(A) Mean, Z-score normalized firing to danger (red), uncertainty (purple) and safety (blue) is shown for the 1 s pre-cue period and the 10 s cue period for the Onset population (n = 29). Cue onset (On) and offset (Off) are indicated by vertical black lines. (B) Mean + SEM, Z-score normalized firing during the first, 1 s cue interval (left) and the last, 1 s cue interval (right), is shown for each cue. Differential firing was observed for danger vs. uncertainty (t28 = 4.54, p=9.70×10⁻⁴, red asterisk) but not for uncertainty vs. safety (t28 = 1.37, p=0.18), in the first interval. No differences were observed for danger vs. uncertainty (t28 = 1.69, p=0.10) or uncertainty vs. safety, (t28 = 0.60, p=0.55) in the last interval. (C) Normalized firing for the Ramping population (n = 14) plotted as in A. (D) First and last interval firing for the Ramping population (n = 14) plotted as in B. Differential firing was not observed for danger vs. uncertainty (t13 = 0.62, p=0.55) or uncertainty vs. safety (t13 = 0.24, p=0.82), in the first interval. By contrast, differential firing was observed for danger vs. uncertainty (t13 = 3.17, p=7.41×10⁻³, red asterisk) and uncertainty vs. safety (t13 = 8.26, p=2.00×10⁻⁶, blue asterisk), in the last interval. (E) A t-test comparing danger (red) and uncertainty (purple) population firing to safety in a 1 s window was slid across the 10 s cue in 100 ms increments. P value of t-test reported on y axis. Dotted line indicates p=0.05. Inset: Mean + SEM change in firing rate from the first window of activity departed from safety to the last interval, is shown for danger (red) and uncertainty (purple). ns = no significance of a paired t-test.
Figure 2—figure supplement 1
Trial by trial firing for Onset and Ramping populations.
(A, left) Raw firing rate (Hz) for the Onset population (n = 29) is shown across cue presentation for each of the six danger trials. Trials are color-coded from dark (first trial) to light (last trial) with ‘On’ indicating cue onset and ‘Off’ indicating cue offset. (A, right) Population mean firing rate is shown for the first 1 s cue interval (dashed box in A), for each trial. Color scheme maintained from (A, left). Population mean baseline firing (2 s prior to cue presentation) is shown for each individual trial (gray circles). Identical plots using unique color schemes (uncertainty, purple and safety, blue) were made for each trial type: (B) uncertainty shock, (C) uncertainty omission and (D) safety. Note that increased cue firing over baseline tended to be highest on trial 1, but was observed for every individual trial for all cues. A nearly identical set of plots were made for the Ramping population (n = 14, E - H), only now population mean firing rate for each trial (right) is shown for the last 1 s interval of the cue (dashed box on left). Increased cue firing over baseline was consistently observed on danger and uncertainty trials, but not safety trials. Firing patterns observed for the mean of all trials (Figure 2A), (C) were observed at the single trial level for Onset and Ramping populations.
Figure 2—figure supplement 2
Nose poke cessation is insufficient to drive activity of Onset and Ramping neurons.
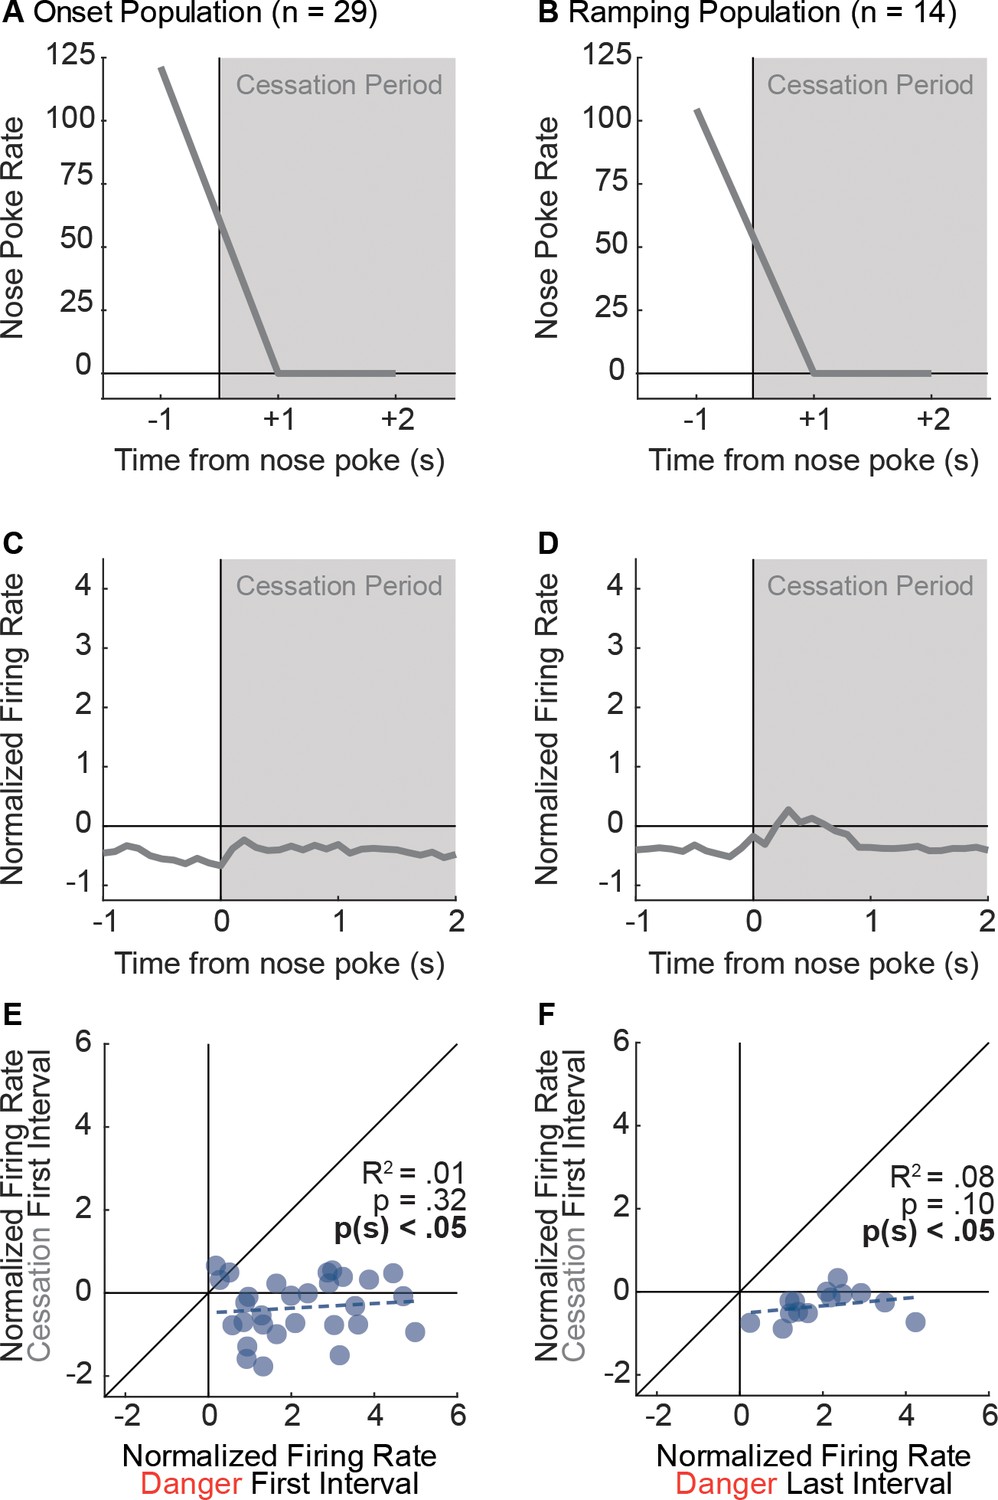
We identified ITI periods during which a nose poke was followed by at least a 2 s cessation period. Mean nose poke rate during the 1 s interval of the poke (−1) and two, 1 s no-poke intervals (+1 and+2) are shown for (A) Onset units and (B) Ramping units (cessation period in gray). If phasic firing to danger by Onset neurons was driven by nose poke cessation, then greater activity should have been observed to nose poke suppression. By definition, nose poke cessation is complete (suppression ratio = 1.00), whereas mean suppression ratio to danger was high, but incomplete (0.83). (C) Onset neurons were nearly unresponsive to nose poke cessation. (D) Ramping neurons were only weakly responsive. Comparison of single-unit firing to danger (Onset, first interval; Ramping, last interval) and nose poke suppression (first interval) revealed no correlation and an overwhelming bias towards greater firing to danger for (E) Onset neurons (R2 = 0.01, p=0.32, p(sign)=1.62×10⁻⁶) and (F) Ramping neurons (R2 = 0.08, p=0.10, p(sign)=1.22×10⁻⁴). Firing of Onset and Ramping neurons was not the result of nose poke suppression, or nose poking itself.
Figure 3
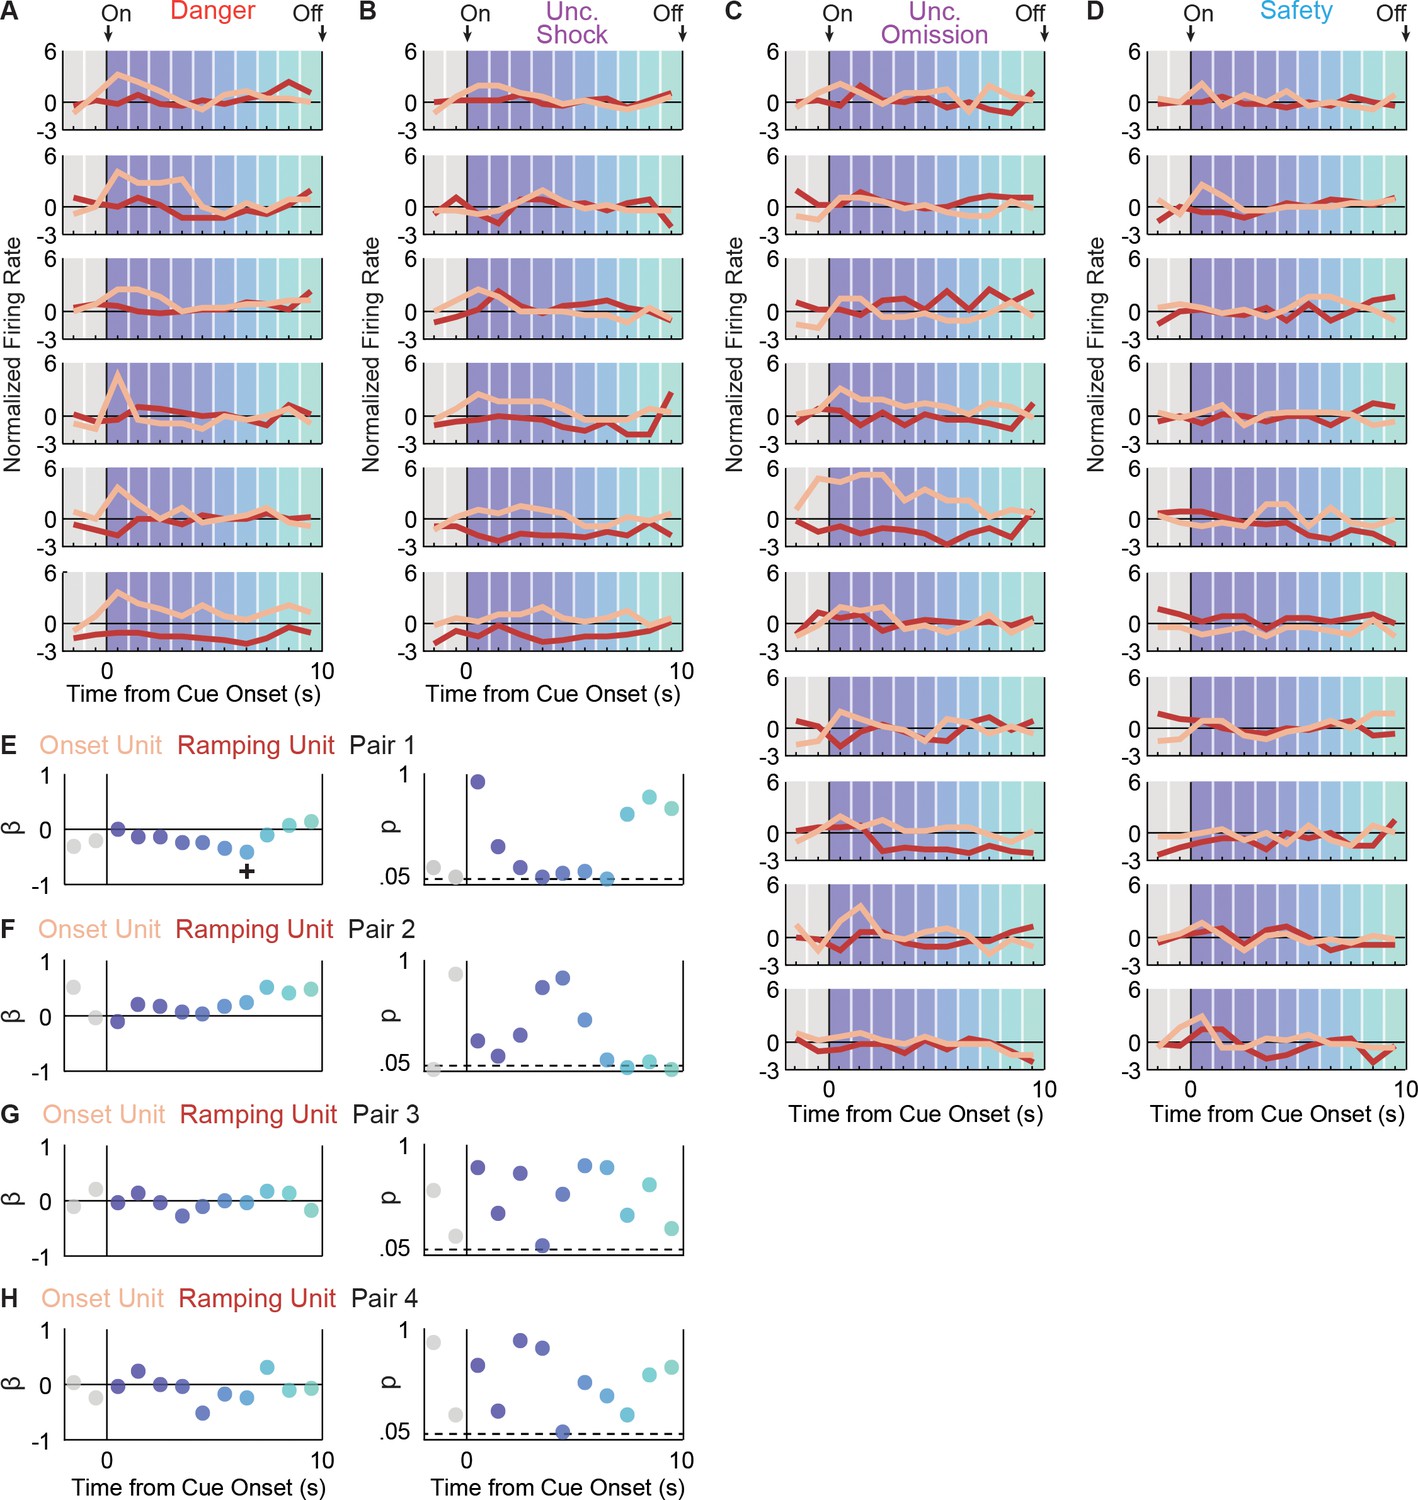
Onset and Ramping single-unit activity are independent.
Activity was simultaneously recorded for a Ramping (maroon) and Onset (peach) unit in four separate sessions (four pairs). For Pair 1, activity is shown for each trial type: (A) danger, (B) uncertainty shock, (C) uncertainty omission, and (D) safety. Single-unit regression was performed for each interval. The primary regression output was a beta coefficient (β) and a p value (p) for: (E) pair 1, (F) pair 2, (G) pair three and (H) pair 4. A significant (p<0.05), negative β was only found for one interval, for one neuron pair (pair 1, interval indicated by +).
Figure 4
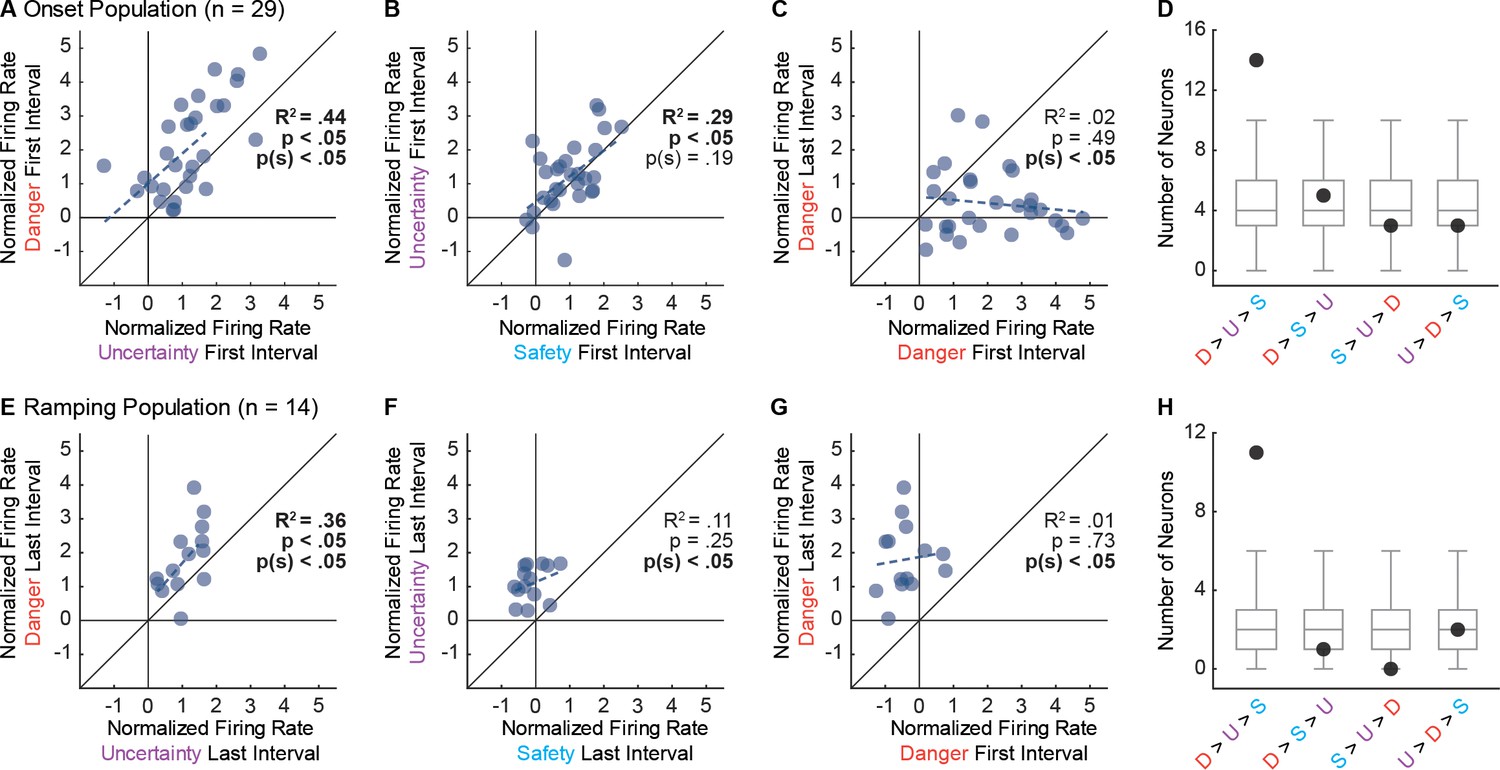
Single-unit biases in Onset and Ramping populations.
(A) Normalized firing to uncertainty (purple) vs. danger (red) during the first, 1 s cue interval is plotted for all Onset neurons (n = 29). Trendline, the square of the Pearson correlation coefficient (R2) with associated p value (p), and sign test p value p(s) are shown for each plot. (B) Normalized firing to safety (blue) vs. uncertainty (purple) during the first, 1 s cue interval is plotted for Onset neurons (n = 29). (C) Normalized firing to danger in the first, 1 s cue interval vs. the last, 1 s cue interval is plotted for Onset neurons (n = 29). (D) Number of observed neurons (closed circle) vs shuffled distribution (median, 25th percentile, 75th percentile, lowest/highest non-outliers) shown for four most common firing patterns: danger > uncertainty > safety, danger > safety > uncertainty, safety > uncertainty > danger, and uncertainty > danger > safety. (E) Normalized firing to uncertainty (purple) vs. danger (red) during the last, 1 s cue interval is plotted for Ramping neurons (n = 14). (F) Normalized firing to safety (blue) vs. uncertainty (purple) during the last, 1 s cue interval is plotted for Ramping neurons (n = 14). (G) Normalized firing to danger in the first, 1 s cue interval vs. the last, 1 s cue interval is plotted for Ramping neurons (n = 14). (H) Number of observed neurons vs shuffled distribution reported as in D.
Figure 5 with 2 supplements
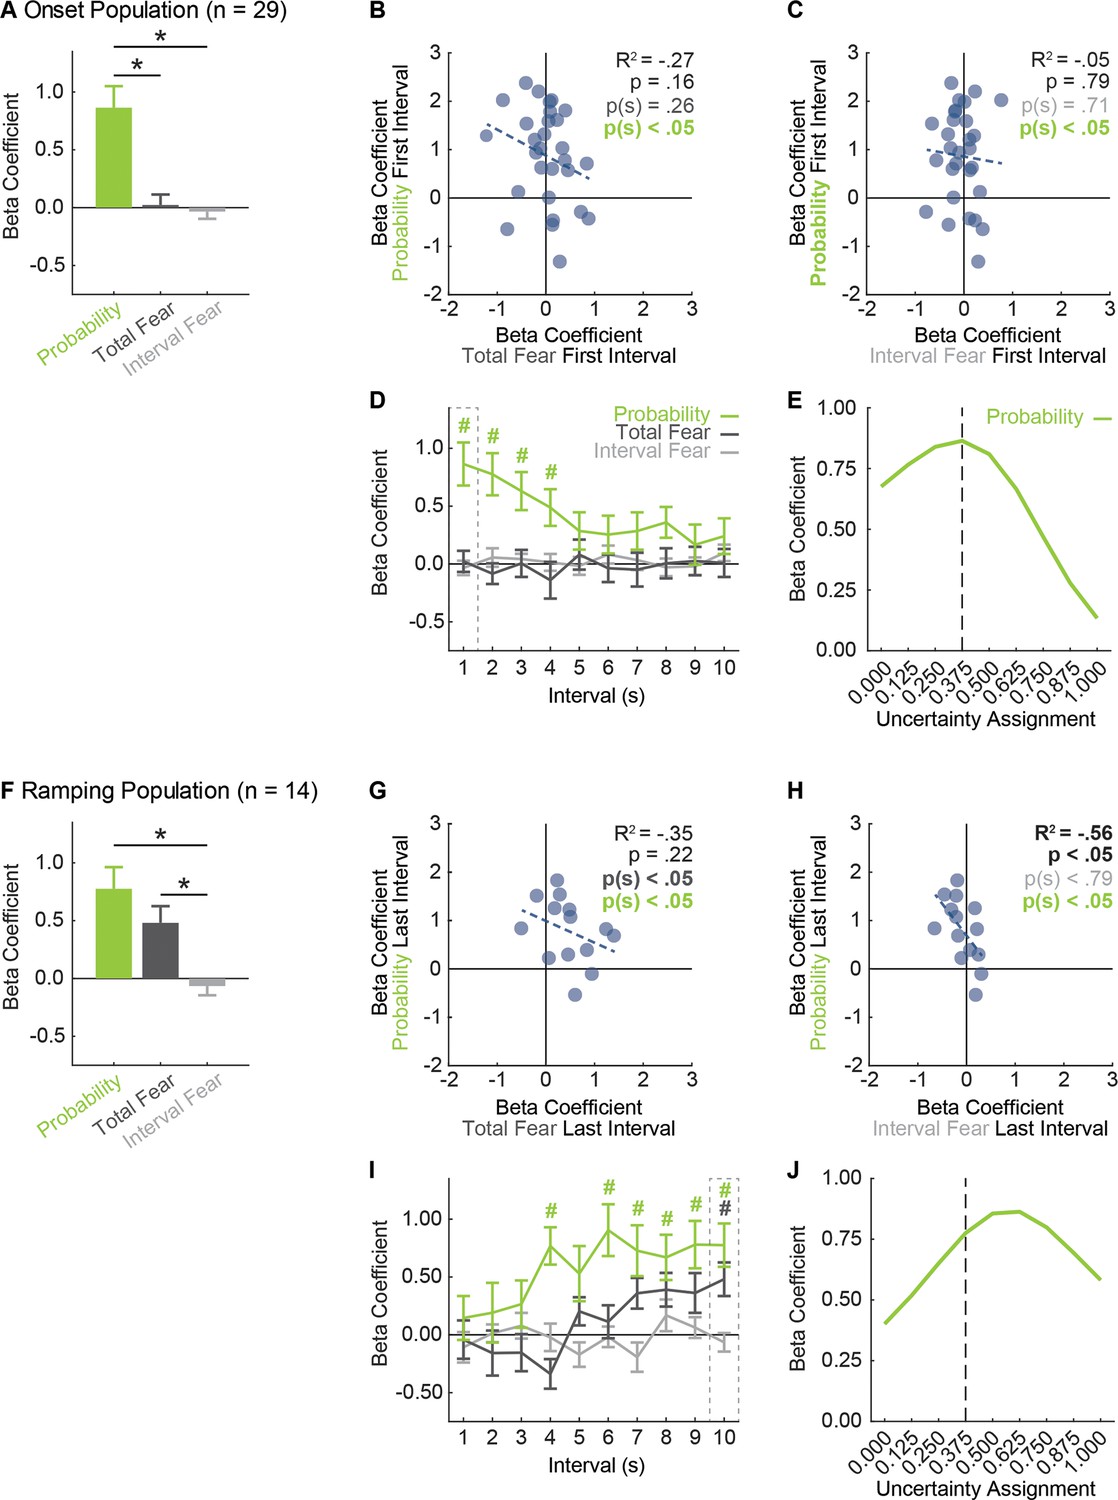
vlPAG neurons prioritize threat probability over fear output.
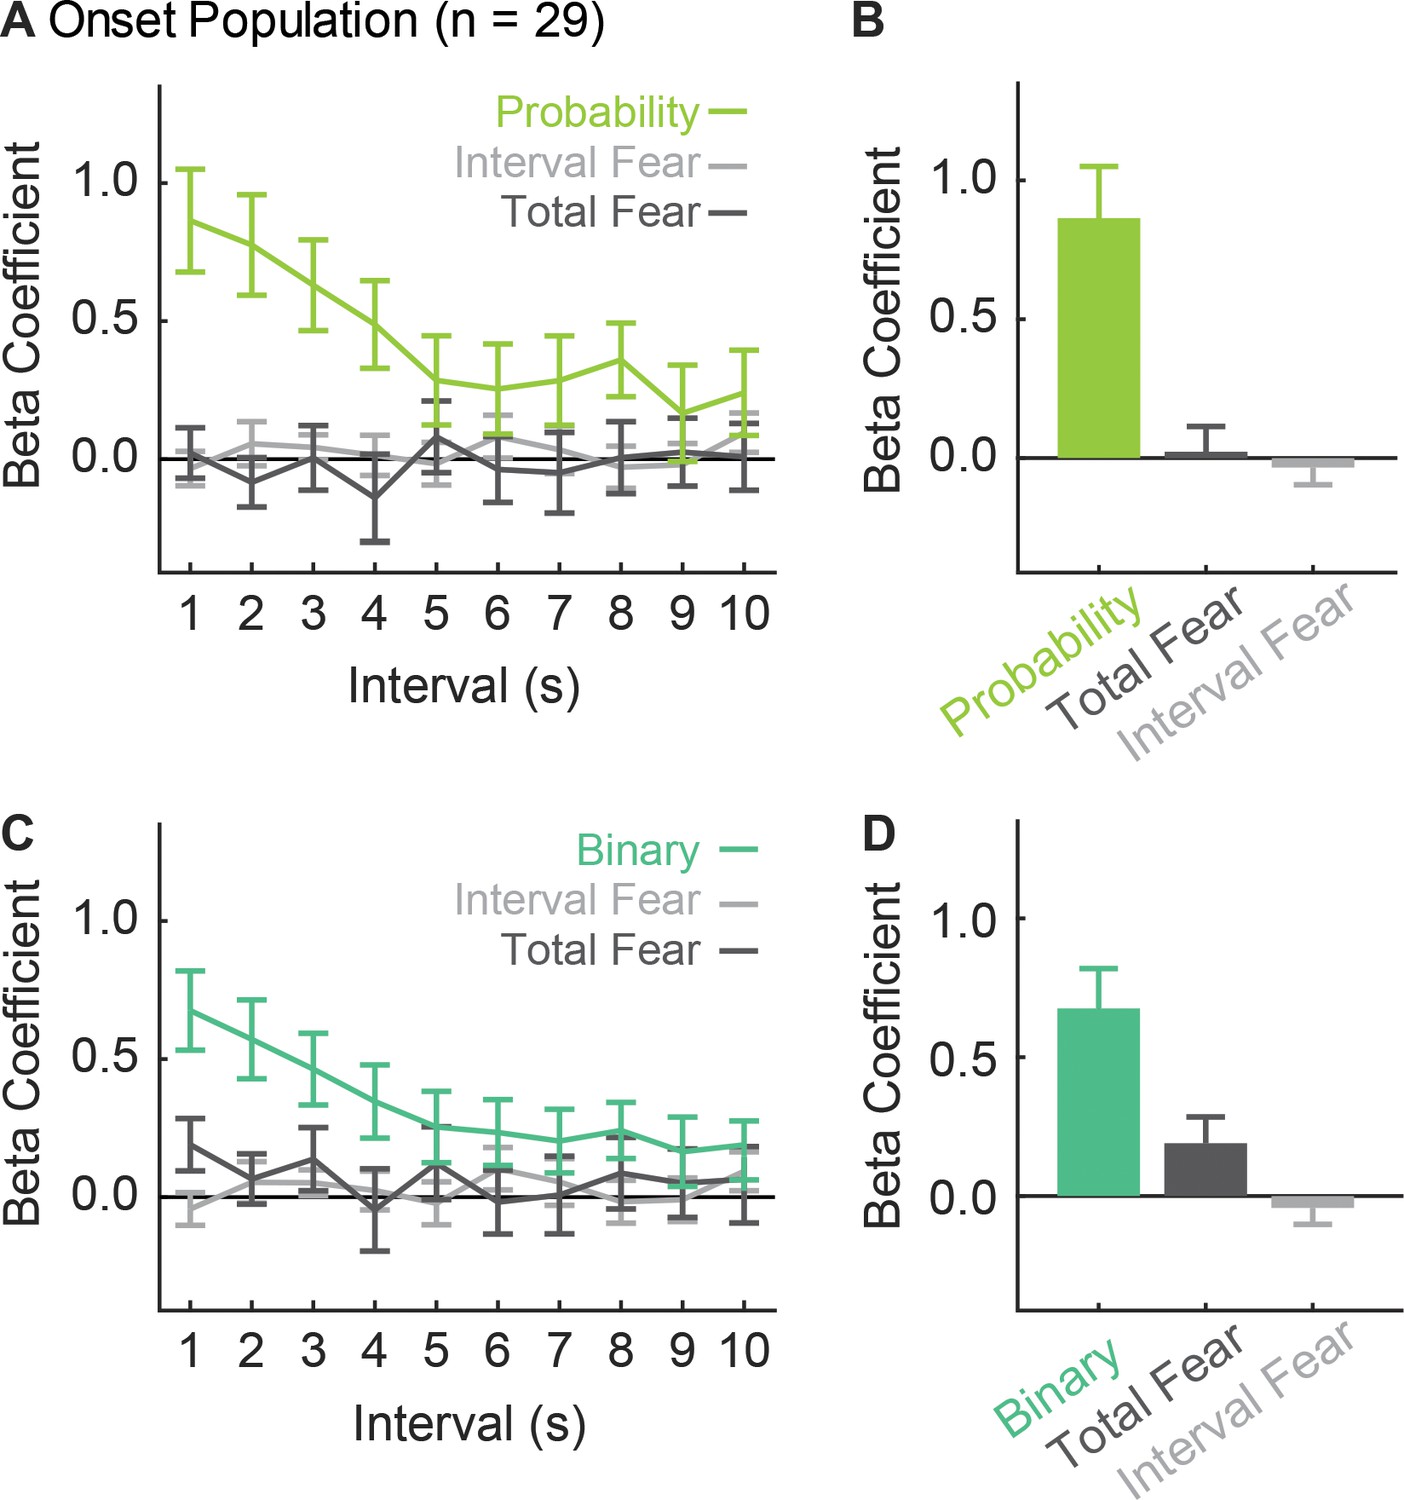
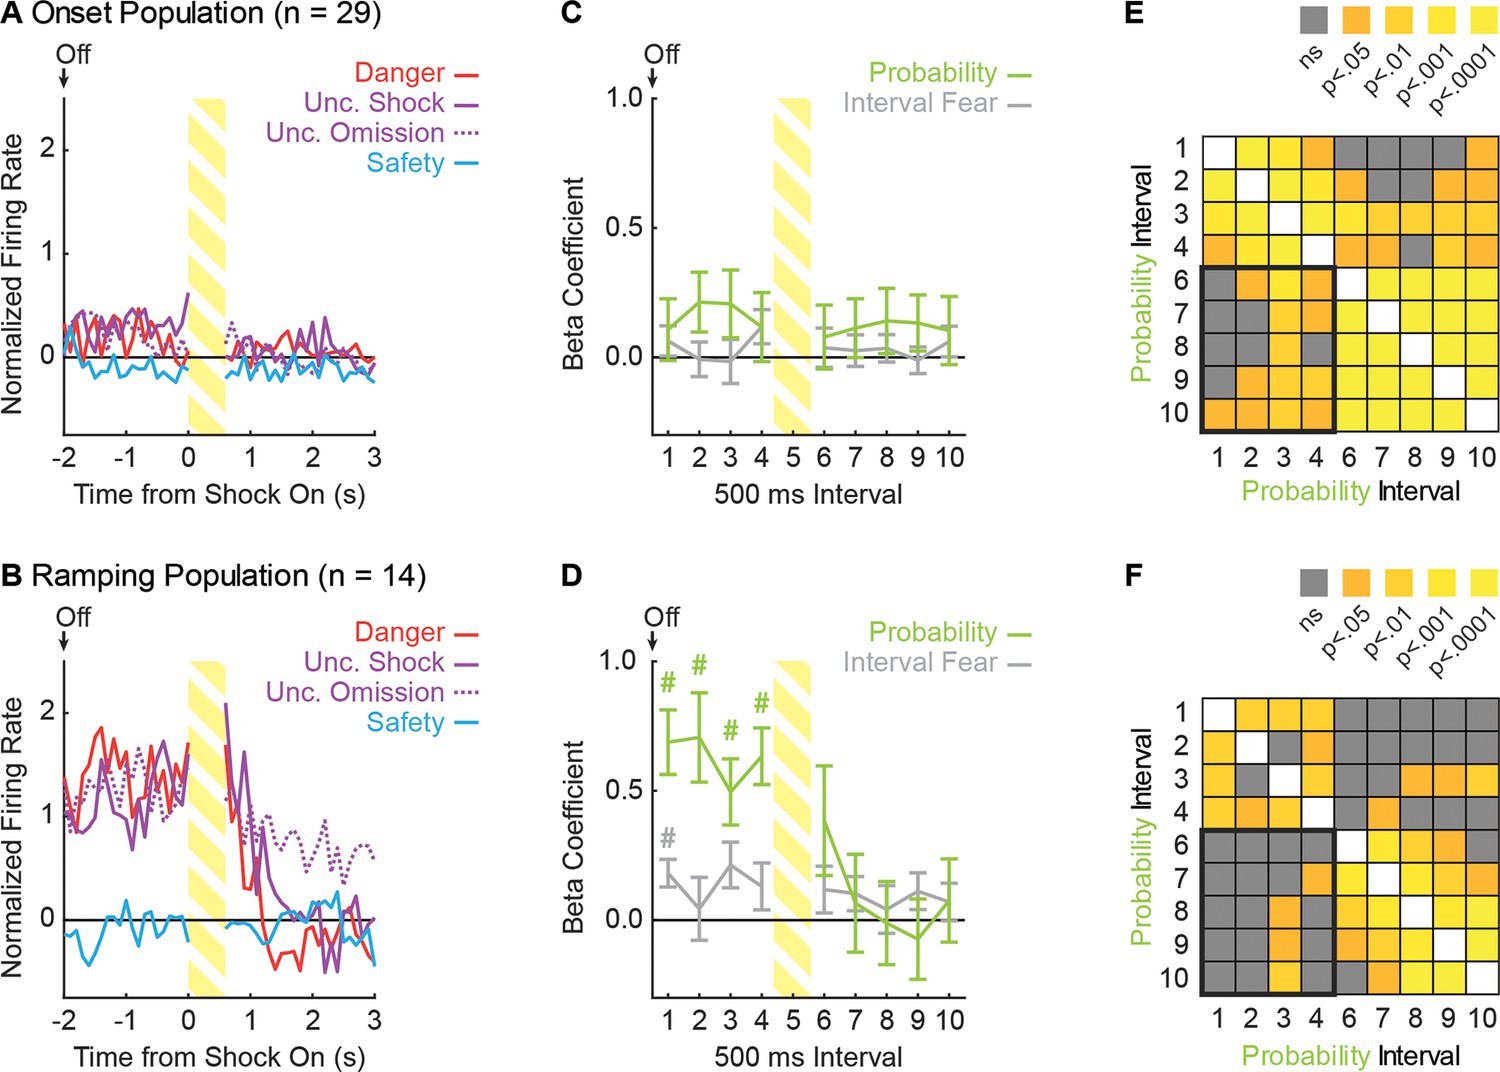
(A) Mean + SEM beta coefficient is shown for each regressor, during the first, 1 s cue interval, for the Onset population (n = 29): probability (green), total fear (dark gray) and interval fear (light gray). Beta coefficient for probability was significantly greater than either measure of fear (probability vs. total fear, t28 = 3.75, p=8.01×10⁻⁴; probability vs. interval fear, t28 = 4.57, p=8.90×10⁻⁵). *paired samples t-test, p<0.05. (B) Beta coefficient for total fear (dark gray) vs. probability (green) during the first, 1 s cue interval is plotted for all Onset neurons (n = 29). Trendline, the square of the Pearson correlation coefficient (R2) with associated p value, and sign test p value comparing each regressor to zero is shown. (C) Beta coefficient for interval fear (light gray) vs. probability (green) during the first, 1 s cue interval is plotted for all Onset neurons (n = 29). Sign test result for probability is identical to B. (D) Mean ± SEM beta coefficient is shown for each regressor, during each 1 s cue interval, for the Onset population (n = 29). Dash outlined box indicates interval analyzed in (A). #single-sample t-test comparison to zero, p<0.005 (Bonferroni correction for 10 tests), color indicates regressor compared to zero. (E) Mean beta coefficient for probability is shown for the each of nine uncertainty assignments for the Onset population (n = 29). Dashed line indicates the actual foot shock probability associated with uncertainty (0.375). (F) Mean + SEM beta coefficient is shown for each regressor, during the last, 1 s cue interval, for the Ramping population (n = 14). Beta coefficients for probability and total fear were significantly greater than interval fear (probability vs. interval fear, t13 = 3.61, p=3.20×10⁻³; total fear vs. interval fear, t13 = 4.68, p=4.34×10⁻⁴), but did not differ from one another (t13 = 1.11, p=0.29). *paired samples t-test, p<0.05. (G) Beta coefficient for total fear (dark gray) vs. probability (green) during the last, 1 s cue interval is plotted for Ramping neurons (n = 14). (H) Beta coefficient for interval fear (light gray) vs. probability (green) during the last, 1 s cue interval is plotted for Ramping neurons (n = 14). Sign test result for probability is identical to F. (I) Mean ± SEM beta coefficient is shown for each regressor, during each 1 s cue interval, for the Ramping population (n = 14). Dash outlined box indicates interval analyzed in (E). #single-sample t-test comparison to zero, p<0.005 (Bonferroni correction for 10 tests), color indicates regressor compared to zero. (J) Mean beta coefficient for probability is shown for the each of nine uncertainty assignments for the Ramping population (n = 14). Dashed line indicates the actual foot shock probability associated with uncertainty (0.375).
Figure 5—figure supplement 1
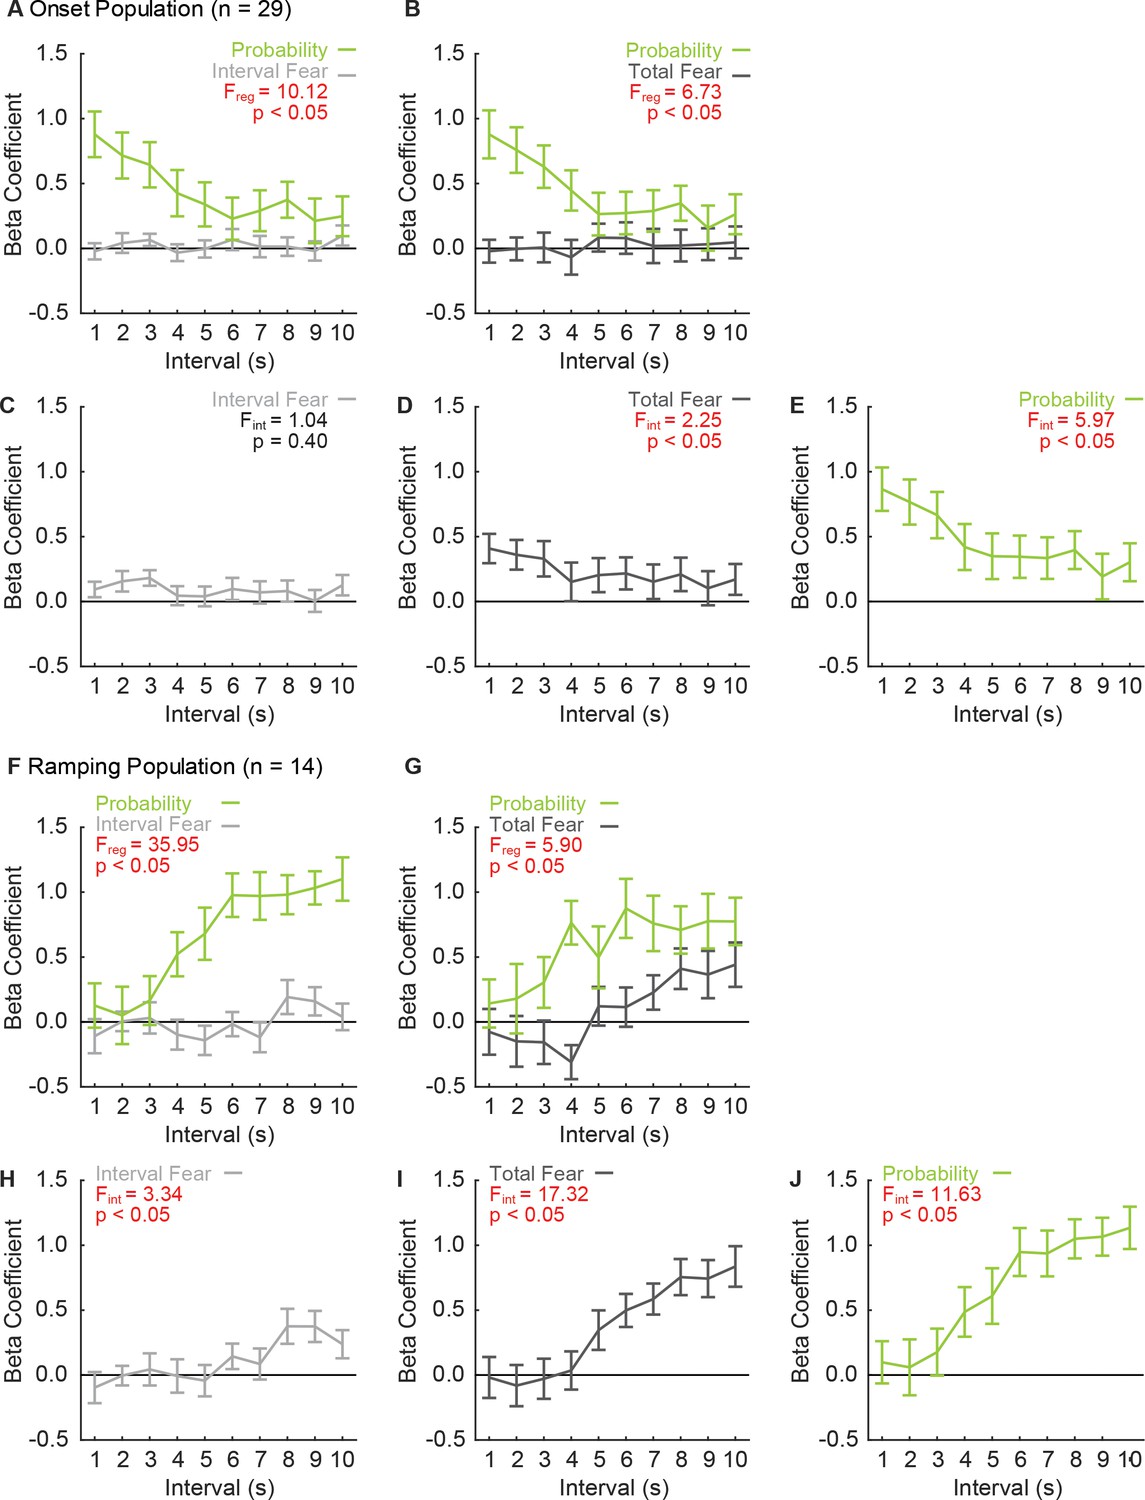
Onset and Ramping single-units prioritize threat probability irrespective of regressor combination.
Linear regression was performed for Onset neurons (n = 29) exactly as described in the manuscript, but using different regressor combinations: (A) probability and total fear, (B) probability and interval fear, (C) interval fear only, (D) total fear only and (E) probability only. Beta coefficients are plotted as mean ± SEM (probability, green; total fear, dark gray; and interval fear, light gray). Linear regression was performed for Ramping neurons (n = 14), using identical regressor combinations (F - J). F statistic and p value shown for main effect of regressor in multiple regressor analyses (A, B, F, G), F and p shown for main effect of interval in single regressor analyses.
Figure 5—figure supplement 2
Onset single-unit activity is better captured by threat probability than a binary output.
We compared (A and B) regression as performed in manuscript to (C and D) regression performed with a binary regressor (danger = 1.000, uncertainty and safety = 0.000). Beta coefficients are plotted as mean ± SEM (probability green; binary, teal; total fear, dark gray; interval fear, light gray). Separate regression is performed to avoid multicollinearity; the probability and binary regressors are highly correlated (R2 = 0.77). ANOVA for beta coefficients using analysis (probability vs. binary), regressor and interval as factors found an analysis x regressor x interval interaction (F18,504 = 2.51, p=5.89×10⁻⁴). ANOVA for only the first 1 s interval found an analysis x regressor interaction (F2,56 = 7.80, p=1.03×10⁻³). The activity of vlPAG single-units was better captured by the regressor that reflected the actual foot shock probability (uncertainty = 0.375) over a regressor that equated uncertainty to safety (uncertainty = 0.000).
Figure 6
Ramping neurons signal threat probability until shock delivery.
(A) Mean normalized firing to danger (red), uncertainty shock (purple, solid line), uncertainty omission (purple, dashed line) and safety (blue) is shown for the 5 s post-cue period for the Onset population (n = 29). Cue offset (Off) is indicated by the arrow, shock indicated by striped yellow bar. (B) Mean normalized firing is shown for the Ramping population (n = 14), as in A. (C) Mean ± SEM beta coefficient is shown for each regressor, over the 5 s post-cue interval, for the Onset population (n = 29): probability (green) and interval fear (light gray). (D) Mean ± SEM beta coefficient is shown for each regressor, over the 5 s post-cue interval, for the Ramping population (n = 14). #single-sample t-test comparison to zero, p<0.005 (Bonferroni correction for 10 tests), and color indicates regressor compared to zero. (E) A correlation matrix was constructed for the 29 Onset neurons using the probability beta coefficient from the four delay and five post-shock intervals. The p value of the Pearson correlation coefficient is plotted for each interval compared (legend shown next to figure). (F) A correlation matrix was constructed for the 14 Ramping neurons as in E.
Tables
Key resources table
| Reagent type (species) or resource | Designation | Source or reference | Identifier | Additional information |
|---|---|---|---|---|
| Antibody | Anti-Tryptophan Hydroxylase Raised in Sheep | Sigma | Cat # T8575 | [1:1000] in 0.05M PBS |
| Antibody | Biotinylated Anti-Sheep Raised in Rabbit | Vector Labs | Cat # PK-6106 | [1:200] in 0.05M PBS |
| Chemical compound, drug | Normal Rabbit Serum | Vector Labs | Cat # PK-6106 | 1% in 0.05M PBS |
| Chemical compound, drug | Avidin | Vector Labs | Cat # PK-6106 | [1:200] in0.05M PBS |
| Chemical compound, drug | Biotin | Vector Labs | Cat # PK-6106 | [1:200] in 0.05M PBS |
| Chemical compound, drug | NovaRED Perioxidase (HRP) Substrate Kit | Vector Labs | Cat # SK-4800 | 18 drops (1), 12 drops (2), 12 drops (3) and 12 drops H2O2 solution in DI H2O. |
| Chemical compound, drug | Triton | Sigma | Cat # T8787 | |
| Chemical compound, drug | Hydrogen Peroxide | Sigma | Cat # 216763 | |
| Chemical compound, drug | Paraformaldehyde | Sigma | Cat # P6148 | |
| Chemical compound, drug | Sucrose | Fisher Scientific | Cat # S5 | |
| Chemical compound, drug | Sodium Chloride | Fisher Scientific | Cat # S 640 | |
| Chemical compound, drug | Histoprep100% Reagent Alcohol | Fisher Scientific | Cat # HC800 | |
| Chemical compound, drug | Histoprep 95% Reagent Alcohol | Fisher Scientific | Cat # HC1300 | |
| Chemical compound, drug | Histoclear II | Fisher Scientific | Cat # 5089990150 | |
| Chemical compound, drug | Omnimount | Fisher Scientific | Cat # 5089990146 | |
| Chemical compound, drug | 10% Neutral Buffered Formalin | Fisher Scientific | Cat # 22899402 | |
| Chemical compound, drug | Potassium Phosphate Monobasic | Fisher Scientific | Cat # P285 | |
| Chemical compound, drug | Potassium Phosphate Dibasic | Fisher Scientific | Cat # P288 | |
| Software, algorithm | MED PC-IV | Med Associates | RRID:SCR_012156 | |
| Software, algorithm | OmniPlex | Plexon | ||
| Software, algorithm | Offline Sorter V6 | Plexon | RRID:SCR_000012 | |
| Software, algorithm | NeuroExplorer | Plexon | RRID:SCR_001818 | |
| Software, algorithm | MATLAB | Mathworks | RRID:SCR_001622 | |
| Software, algorithm | Statistica | StatSoft | RRID:SCR_014213 | |
| Software, algorithm | SPSS | IBM | RRID:SCR_002865 | |
| Software, algorithm | Adobe Illustrator | Adobe | RRID:SCR_010279 | |
| Software, algorithm | Adobe Photoshop | Adobe | RRID:SCR_014199 | |
| Other | Plexon standard commutator | Plexon | Cat # 50122 | |
| Other | Plexon head stage cable – Metal Mesh | Plexon | Cat # 91809–017 | |
| Other | Plexon head stage | Plexon | Cat # 40684–020 | |
| Other | Omnetics connector | Omnetics Corporation | Cat # A79042-001 | |
| Other | Green board - Moveable Array | San Francisco Circuits | Cat # PCB | |
| Other | Stainless Steel ground wire | AM Systems | Cat # 791400 | |
| Other | Formvar Insulated Nichrome Wire | AM Systems | Cat # 761500 | |
| Other | Dustless Precision Pellets | Bio-Serv | Cat # F0021 |
Additional files
-
Transparent reporting form
- https://doi.org/10.7554/eLife.45013.019
Download links
A two-part list of links to download the article, or parts of the article, in various formats.
Downloads (link to download the article as PDF)
Open citations (links to open the citations from this article in various online reference manager services)
Cite this article (links to download the citations from this article in formats compatible with various reference manager tools)
Ventrolateral periaqueductal gray neurons prioritize threat probability over fear output
eLife 8:e45013.
https://doi.org/10.7554/eLife.45013


