Heterogeneity in surface sensing suggests a division of labor in Pseudomonas aeruginosa populations
- University of Washington, United States
- University of California, Los Angeles, United States
- University of Science and Technology of China, China
- Tianjin University, China
- Tokushima University Graduate School, Japan
- University of Nevada, United States
- Shenzhen Institutes of Advanced Technology, Chinese Academy of Sciences, China
- South China Agricultural University, China
Figures
Figure 1 with 9 supplements
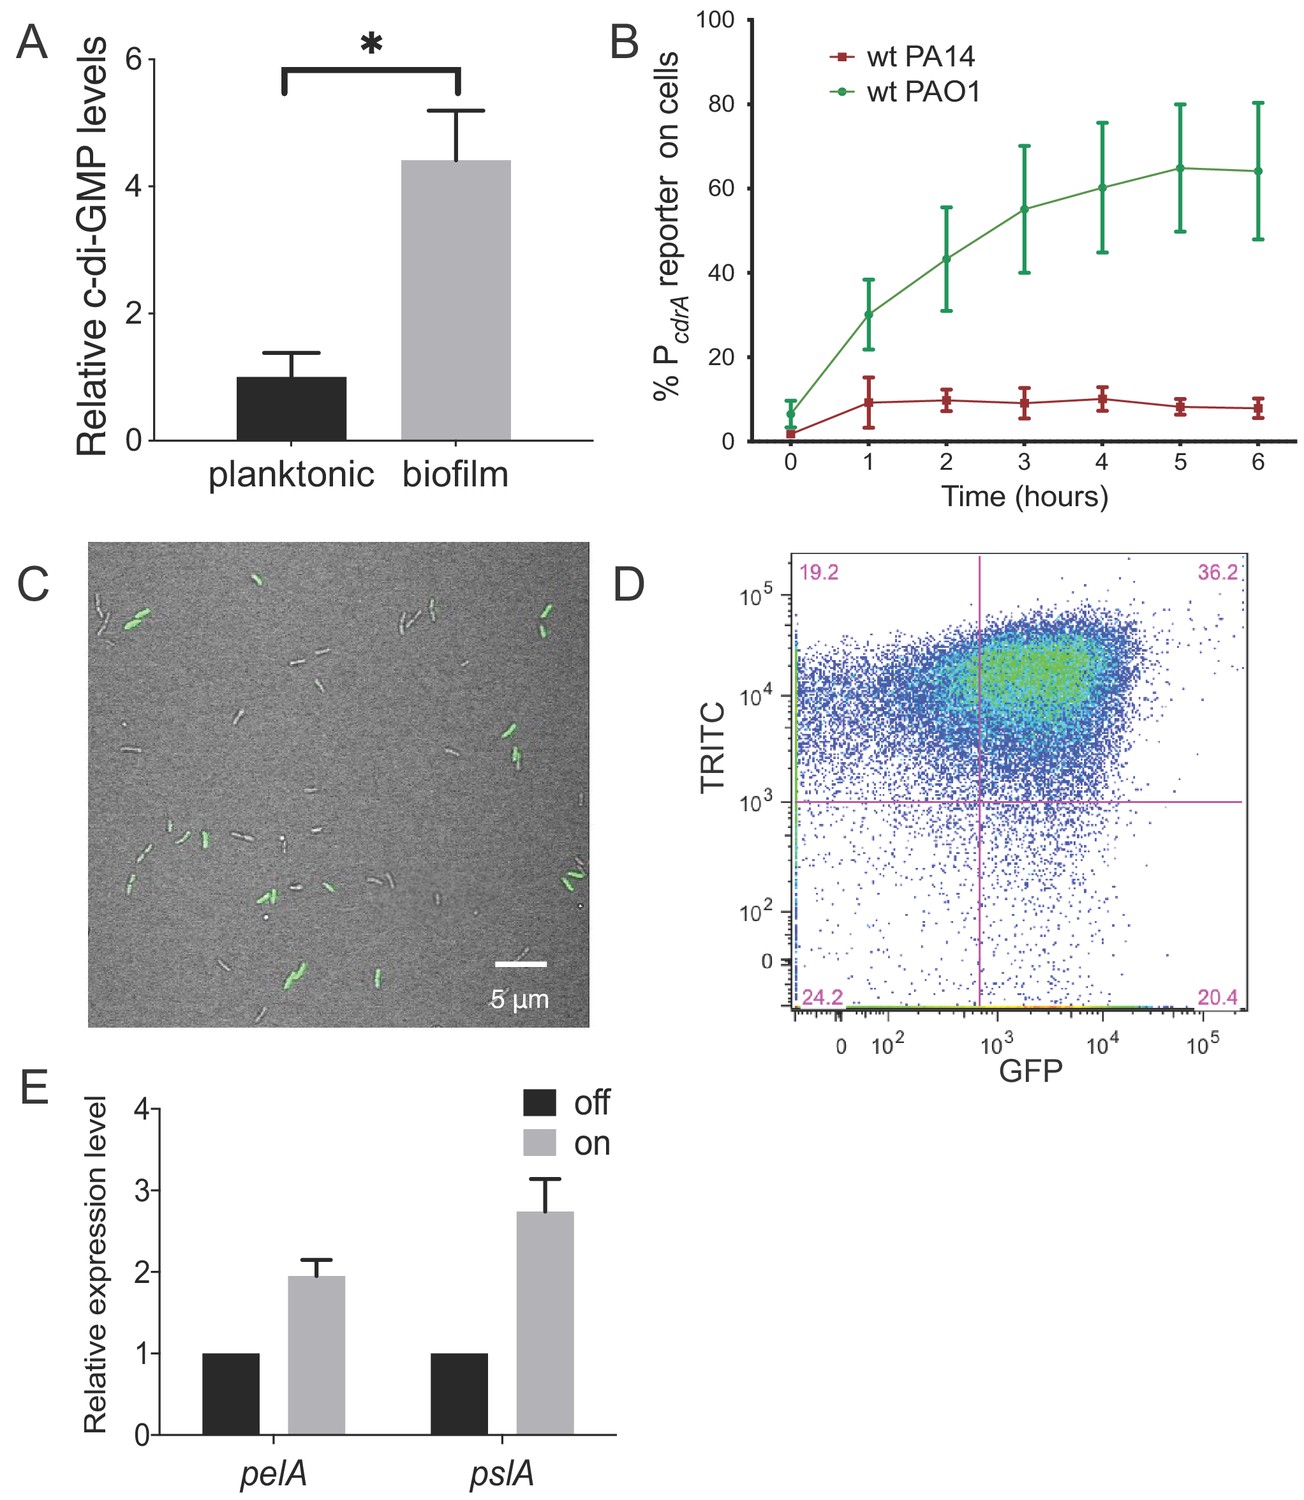
Heterogeneity in cellular levels of c-di-GMP during early P. aeruginosa biofilm formation.
(A) c-di-GMP levels are elevated rapidly upon association of P. aeruginosa PAO1 cells with a surface. Relative levels of intracellular c-di-GMP in wild type PAO1 cells grown either planktonically or after 4 hr of attachment to a silicone tube. Values are normalized to the average concentration of c-di-GMP in planktonic cells, in pmol c-di-GMP/mg total protein as determined by LC-MS/MS, and presented as mean and SD. *p<0.05 by T-test, N = 3. Figure 1—figure supplement 1 shows the Pel polysaccharide operon is transcriptionally activated almost 10-fold compared to planktonic cells within 30 min of surface attachment. (B) Two commonly studied P. aeruginosa lab strains, PAO1 and PA14, differentially activate the c-di-GMP reporter during surface sensing. Wild type PAO1 or PA14 cells harboring the c-di-GMP reporter (pPcdrA::gfpASV) were grown to mid-log phase in planktonic culture, then inoculated into a flow cell and supplied with 1% LB medium. Surface attached cells were imaged immediately after inoculation (time 0 hr), and hourly for 12 hr. The c-di-GMP reporter is activated in a subset of wild type PAO1 cells within 1 hr of surface attachment and remains activated in approximately 60% of PAO1 cells during the first 6 hr of attachment. In PA14, the c-di-GMP reporter is activated in a smaller proportion of attached cells compared to PAO1. Data points are mean percentage of reporter activated cells from each time point across at least three biological replicates, with standard deviation. Figure 1—figure supplement 4 shows an additional c-di-GMP responsive transcriptional reporter (using the siaA promoter) is also responsive to Wsp-dependent changes in cellular levels of c-di-GMP. (C) Wild type PAO1 cells display heterogeneity in c-di-GMP reporter activity after 6 hr of surface attachment. Confocal microscopy image of wild type PAO1 PcdrA::gfpASV grown in 1% LB after 6 hr of surface attachment during a time course flow cell experiment. Bright field (gray) and GFP (green) channels are merged. Wild type PAO1 PcdrA::gfpASV was grown in 1% LB and imaged by CSLM. Figure 1—figure supplement 2 shows additional representative timecourse images of PAO1. (D) Psl exopolysaccharide production is enriched in the population of cells with high c-di-GMP. Representative scatterplot of reporter activity versus Psl lectin binding in wild type PAO1 harboring the pPcdrA::gfpASV reporter grown for four hours in LB before surface attached cells were harvested, stained with the lectin, washed, and counted by flow cytometry. (E) Subpopulations of PAO1 cells with high and low c-di-GMP reporter activity are physiologically distinct. Cells with higher c-di-GMP reporter activity have increased expression of Pel and Psl biosynthetic machinery genes. After 4 hr of attachment to glass, wild type PAO1 cells were separated by flow-assisted cell sorting (FACS) into a population of cells with high (on) and low (off) c-di-GMP reporter activity, then qRT-PCR was performed to quantify expression of Pel and Psl exopolysaccharide biosynthesis genes. Levels of expression of Pel or Psl mRNA were normalized to the off population. *p<0.05 by T-test, N = 3 biological replicates. Figure 1—figure supplement 3 shows controls for validating the protocol to monitor pPcdrA::gfpASV by flow cytometry. Figure 1—source data 2 shows by flow cytometry that Psl and Pel polysaccharide production is highest in cells with high pPcdrA::gfpASV reporter activity.
-
Figure 1—source data 1
Raw data for fluorescence intensities.
- https://cdn.elifesciences.org/articles/45084/elife-45084-fig1-data1-v3.xlsx
-
Figure 1—source data 2
Distributions of median fluorescence intensity values of PAO1 WT pPcdrA::gfpASV cells obtained via bootstrap sampling.
Calculated median values from the experimental distributions and 95% confidence intervals of the bootstrap distributions are overlaid on top of the bootstrap distribution probability plot. Data groups are statistically significantly different from each other if their confidence intervals do not overlap.
- https://cdn.elifesciences.org/articles/45084/elife-45084-fig1-data2-v3.xlsx
Figure 1—figure supplement 1
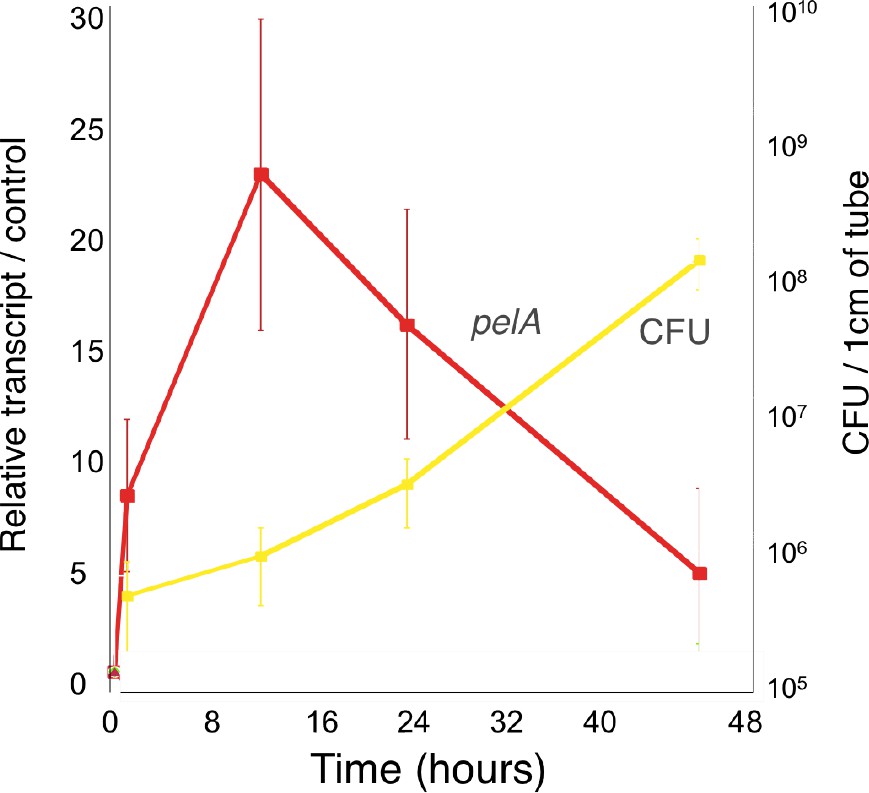
The c-di-GMP-regulated promoter of the Pel polysaccharide operon is transcriptionally activated almost 10-fold compared to planktonic cells within 30 min of attachment of PAO1 to a silicone tube.
qRT-PCR was performed to detect pelA transcript levels in silicone tube biofilm cells compared to planktonic cells (red). Biofilm transcript levels were normalized to planktonic levels at each time point. Colony forming units (CFU) of biofilm attached cells is plotted in yellow at each time point.
Figure 1—figure supplement 2
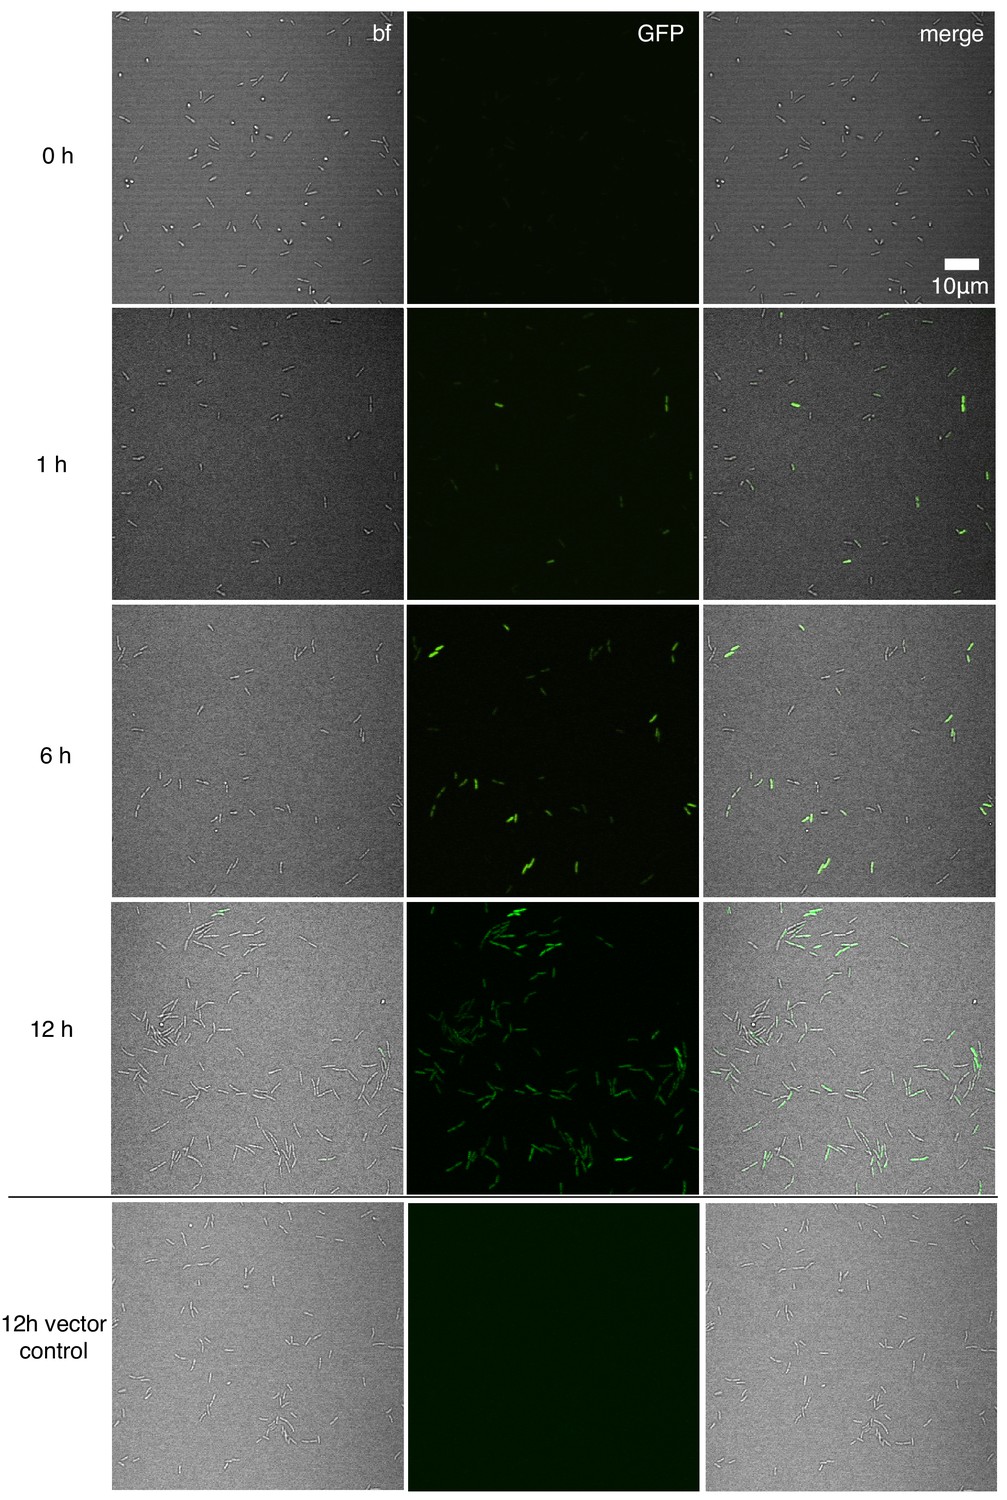
Representative time course images showing the c-di-GMP reporter (PcdrA::gfpASV) transitioning from inactive upon initial attachment of wild type PAO1 (0 hr) to active in a subpopulation of cells between 1 and 12 hr during a flow cell experiment.
A strain harboring the vector control, which encoded gfpASV, but lacks the PcdrA promoter was imaged alongside each reporter strain (in the appropriate genetic background) to confirm that GFP fluorescence was not due to random expression from the plasmid. Wild type PAO1 PcdrA::gfpASV was grown in 1% LB and imaged by CSLM. bf = bright field, merge = bright field and GFP channels combined.
Figure 1—figure supplement 3
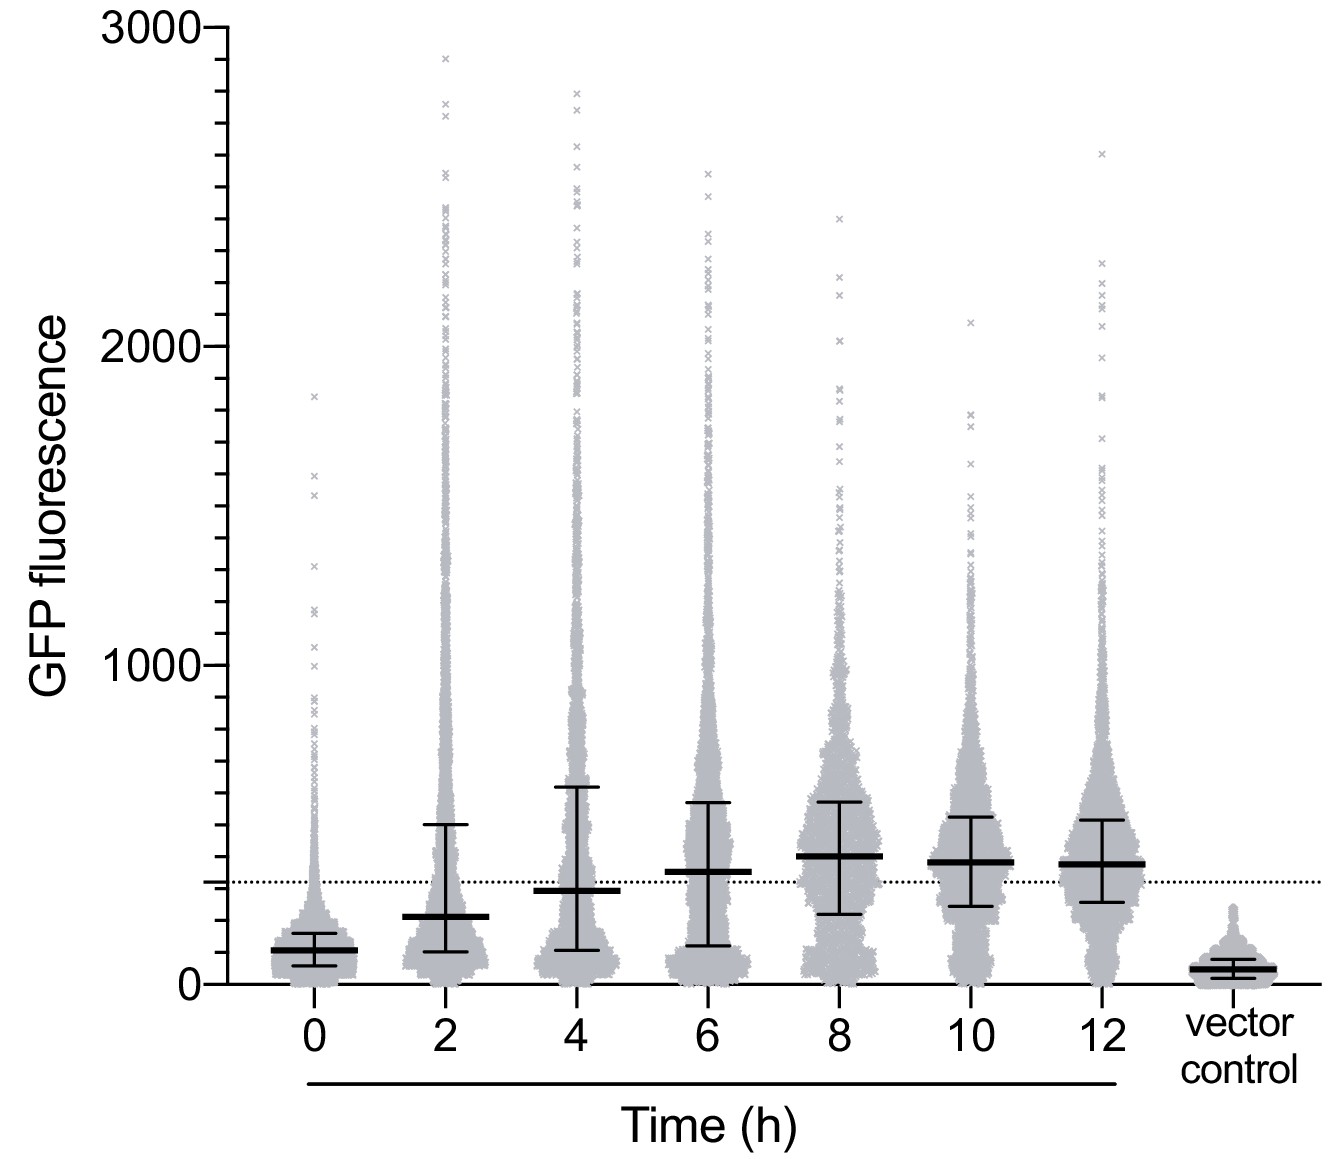
Fluorescence intensities of individual wild type PAO1 pPcdrA::gfpASV cells imaged over 12 hr following surface attachment in a flow cell experiment (n ≥ 3 experiments per time point).
Each dot represents background-subtracted fluorescence intensity of a single cell. The median and interquartile range is overlaid onto each time point. The dotted line depicts the cut-off for ‘on’ vs. ‘off’ cells used throughout the study, which reliably categorizes all promotor-less vector control cells as ‘off’.
Figure 1—figure supplement 4

P-values for Kruskal-Wallis test for comparing medians observed in Figure 1—figure supplement 3, followed by Tukey’s post-test for multiple comparisons.
Figure 1—figure supplement 5
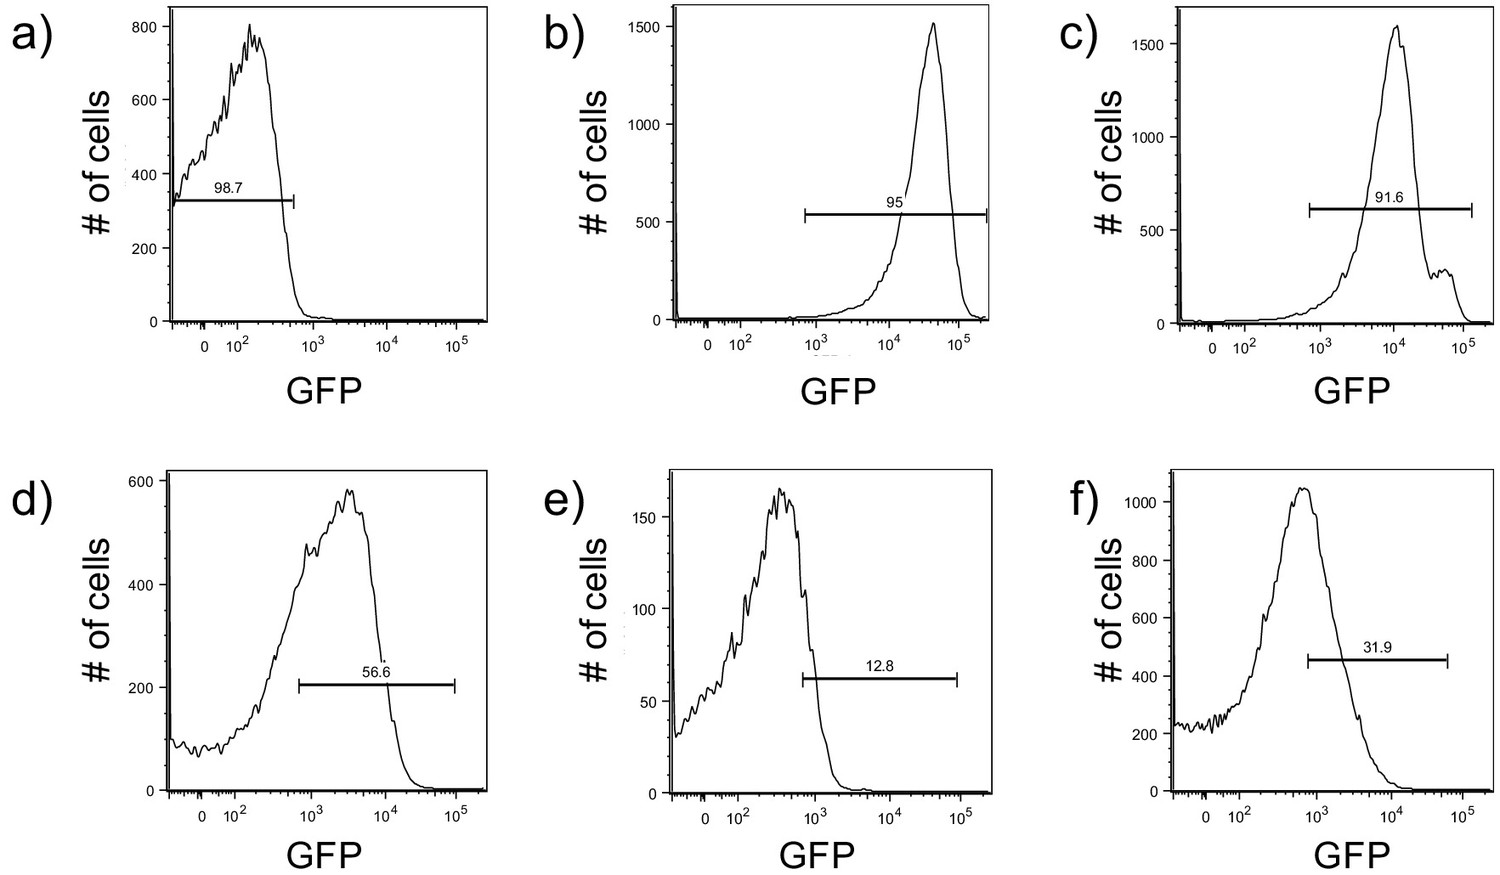
Development of a protocol to monitor pPcdrA::gfpASV using an LSRII flow cytometer.
Brackets indicate gates for ‘on’ (GFP above 1.7 × 10² RFU) or ‘off’ (GFP below 1.7 × 10² RFU) reporter cells and the number above the bracket indicates the percentage of cells that fall within that gate. (a) Wild type PAO1 cells were used to determine the background level of fluorescence on the BD Aria III for GFP measurements. The population of cells falls below 103 RFU. (b) A P. aeruginosa strain constitutively expressing stable GFP (PAO1 Tn7::P(A1/04/03)::GFPmut) was used to determine gating for cells with high GFP, with the population ranging from 103 to 105 RFU. (c) Surface grown PAO1 ΔwspFΔpelΔpsl harboring the pPcdrA::gfpASV was used to validate the gate for collection of cells with high reporter activity (103 to 105 RFU; 91.6% of the population). (d) Example of gating for reporter ‘on’ cells from wild type PAO1 pPcdrA::gfpASV cells that had been attached to glass in LB medium for 4 hr. Approximately 56.6% of the population falls into the reporter ‘on’ population. (e) Example of gating for ‘on’ cells from wild type PA14 pPcdrA::gfpASV cells that had been attached to glass in LB medium for 4 hr prior to FACS sorting. Approximately 12.8% of the population falls into the reporter ‘on’ population. (f) Example of gating for ‘on’ cells from wild type PA14 pPcdrA::gfpASV cells that had been attached to glass in Jensen’s media (a condition in which Pel is more abundantly produced than in LB) for 4 hr. Approximately 31.9% of the population falls into the reporter ‘on’ population.
Figure 1—figure supplement 6
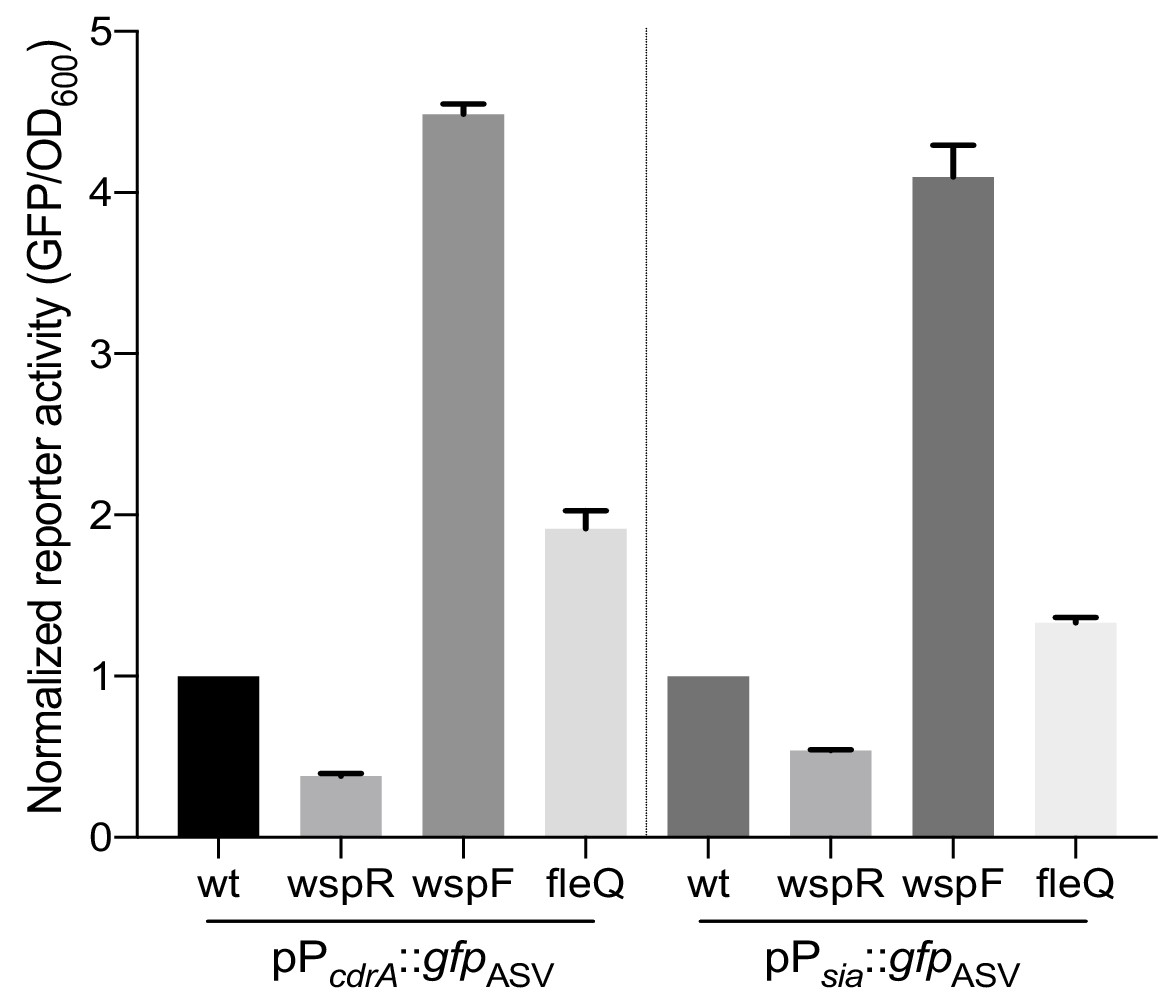
The siaA promoter, regulated by c-di-GMP binding to FleQ, is responsive to Wsp-dependent changes in cellular levels of c-di-GMP.
Wild type PAO1 and PAO1 mutants harboring the pPsiaA::gfp reporter (or the pPcdrA::gfp reporter as controls) were grown for 20 hr on an LB agar surface with 100 μg/mL gentamycin, resuspended in PBS, and their GFP fluorescence and absorbance at OD600 was measured immediately in a spectrophotometer. Data are normalized to reporter activity of the wild type PAO1 strain. Asterisk indicates a statistically significant difference in pPsiaA::gfp reporter activity relative to wild type PAO1 (p<0.05, N = 6, ANOVA with post-hoc Dunnett).
Figure 1—figure supplement 7
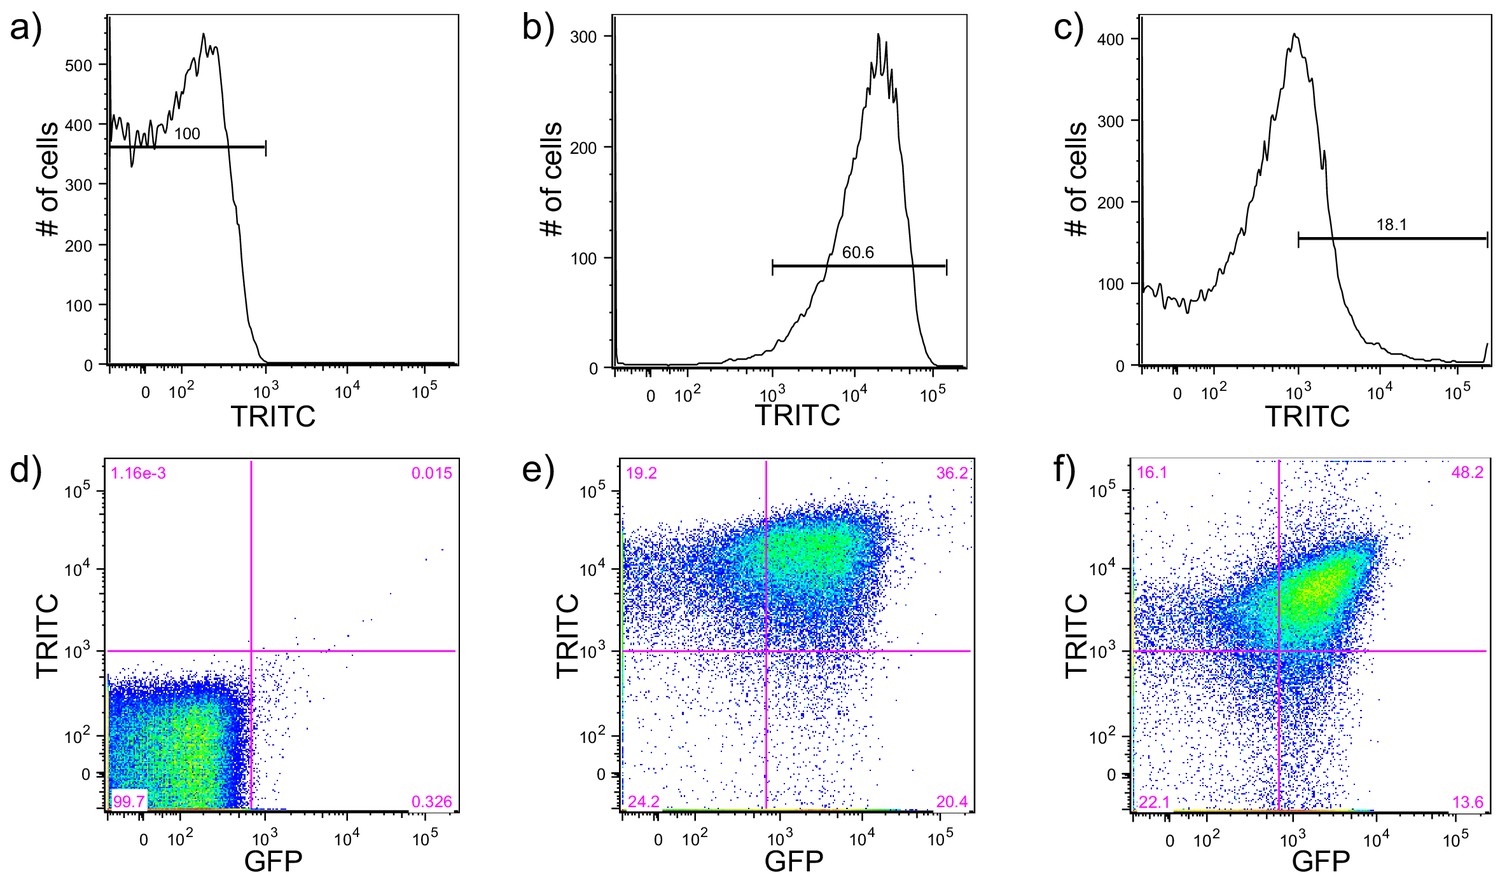
Psl and Pel polysaccharide production is highest in cells with high c-di-GMP as measured by the pPcdrA::gfpASV reporter.
Brackets indicate gates for polysaccharide-producing, TRITC lectin bound cells (TRITC above 103 RFU) or cells without lectin bound (TRITC below 103 RFU) on an LSR II flow cytometer and numbers above the brackets indicate the percentage of total cells that fall within the gate. (a) Determination of the background level of TRITC autofluorescence in wild type PAO1 that had not been stained with a TRITC-conjugated lectin. (b) Determination of the a high level of TRITC-conjugated Psl-specific lectin binding in PAO1 PBAD-psl grown in shaken liquid culture for 4 hr with 1% arabinose before staining with the TRITC-HHA lectin and extensive washing. Approximately 60% of the cells have TRITC-HHA lectin bound to their surface. (c) Determination of the a high level of TRITC-conjugated Pel-specific lectin binding in PAO1 PBAD-pel grown in shaken liquid culture for 4 hr with 1% arabinose before staining with the TRITC-WFL lectin and extensive washing. Approximately 18.1% of the cells have TRITC-HHA lectin bound to their surface. (d) A scatterplot of pPcdrA::gfpASV reporter activity (GFP) on the x axis and Psl production (as measured by binding of TRITC-HHA lectin to the cell surface) demonstrating the specificity of GFP and TRITC gating in a negative control condition. Wild type PAO1 cells that do not contain the reporter and had not been stained with lectin mostly fall into the lower left quadrant of ‘off’ GFP and no TRITC-lectin binding. The purple numbers in each quadrant represent the percentage of the total population that falls within that quadrant. Quadrants were drawn based on gating of pPcdrA::gfpASV reporter activity ‘on’ vs. ‘off’ and lectin bound vs. unbound. (e) Psl polysaccharide production is enriched in the population of cells with high c-di-GMP. Representative scatterplot of reporter activity versus Psl lectin binding in wild type PAO1 harboring the pPcdrA::gfpASV reporter grown for four hours in LB before surface attached cells were harvested, lectin stained, washed, and counted by flow cytometry. (f) Pel polysaccharide production is enriched in the population of cells with high c-di-GMP. Representative scatterplot of reporter activity versus Pel lectin binding in wild type PA14 harboring the pPcdrA::gfpASV reporter grown for four hours in Jensen’s minimal media plus glucose before surface attached cells were harvested, lectin stained, washed, and counted by flow cytometry.
Figure 1—figure supplement 8
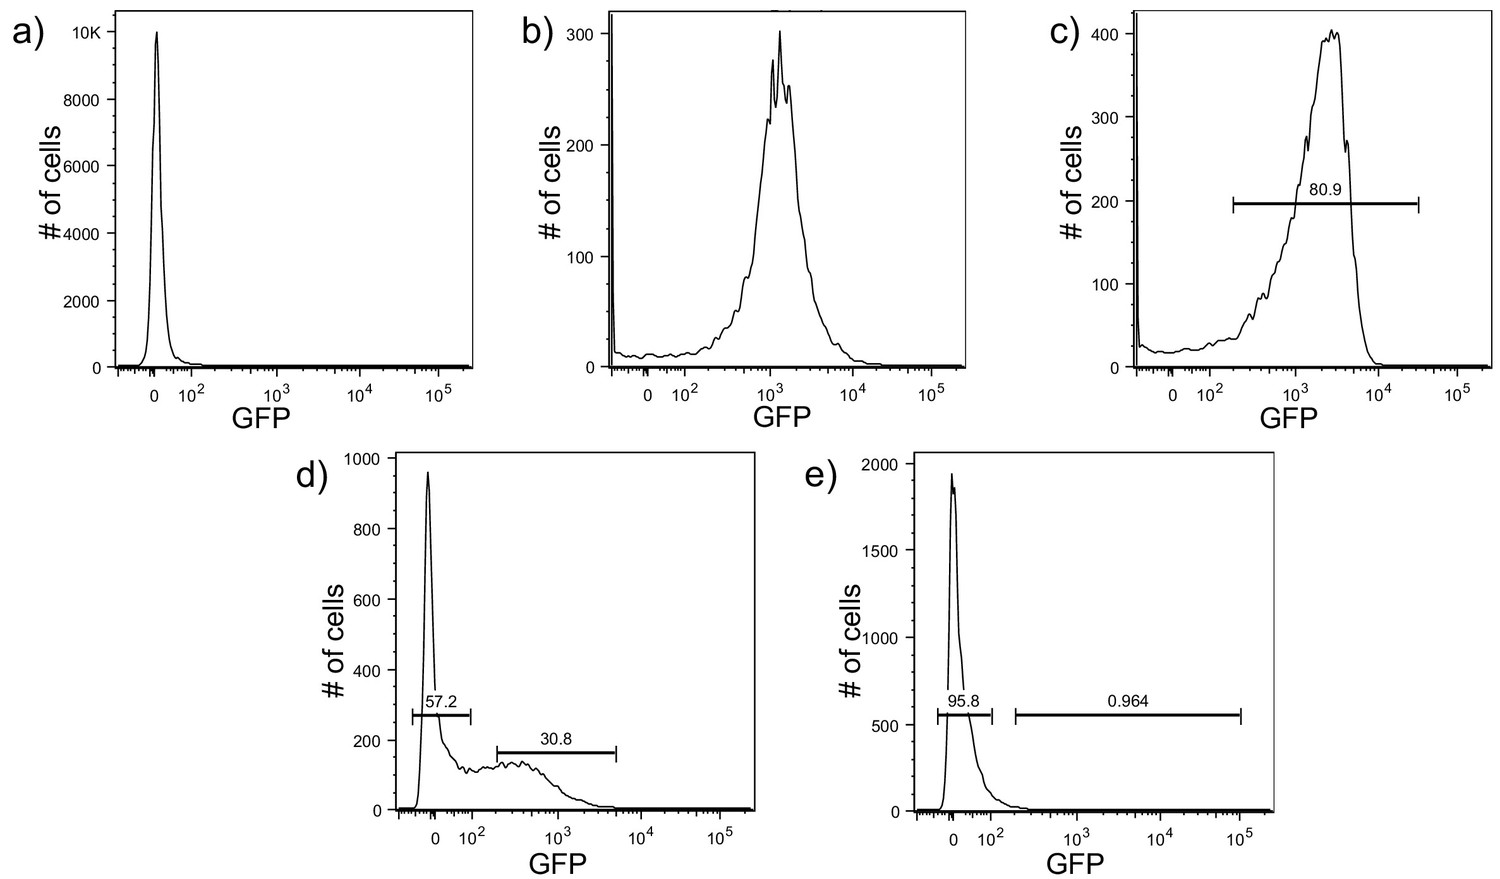
Development of a protocol to sort biofilm cells by pPcdrA::gfpASV using flow assisted cell sorting (FACS).
Brackets indicate gates for ‘on’ (GFP above 1.1 × 10² RFU) or ‘off’ (GFP below 102 RFU) reporter cells on a BD Aria III flow cytometer and the number above the bracket indicates the percentage of cells that fall within that gate. (a) Wild type PAO1 cells were used to determine the background level of fluorescence on the BD Aria III for GFP measurements. The population of cells centers around zero RFU. (b) A P. aeruginosa strain constitutively expressing stable GFP (PAO1 Tn7::P(A1/04/03)::GFPmut) was used to determine gating for cells with high GFP, with the population centering around 103 RFU. (c) PAO1 ΔwspFΔpelΔpsl harboring the pPcdrA::gfpASV was used to draw a gate for collection of cells with high reporter activity (80% of the population). (d) Example of gating for reporter ‘off’ and ‘on’ cells from wild type PAO1 pPcdrA::gfpASV cells that had been grown on a surface for 4 hr prior to FACS sorting. Approximately 30% of the population falls into the reporter ‘on’ population. A gap was left between the sorted ‘off’ and ‘on’ populations to increase the stringency of the sorting. (e) Example of the ‘off’ and ‘on’ gates drawn on wild type PAO1 pPcdrA::gfpASV cells that were grown planktonically to mid-log, demonstrating that the surface dependent nature of PcdrA reporter activity can be detected by flow cytometry.
Figure 1—figure supplement 9
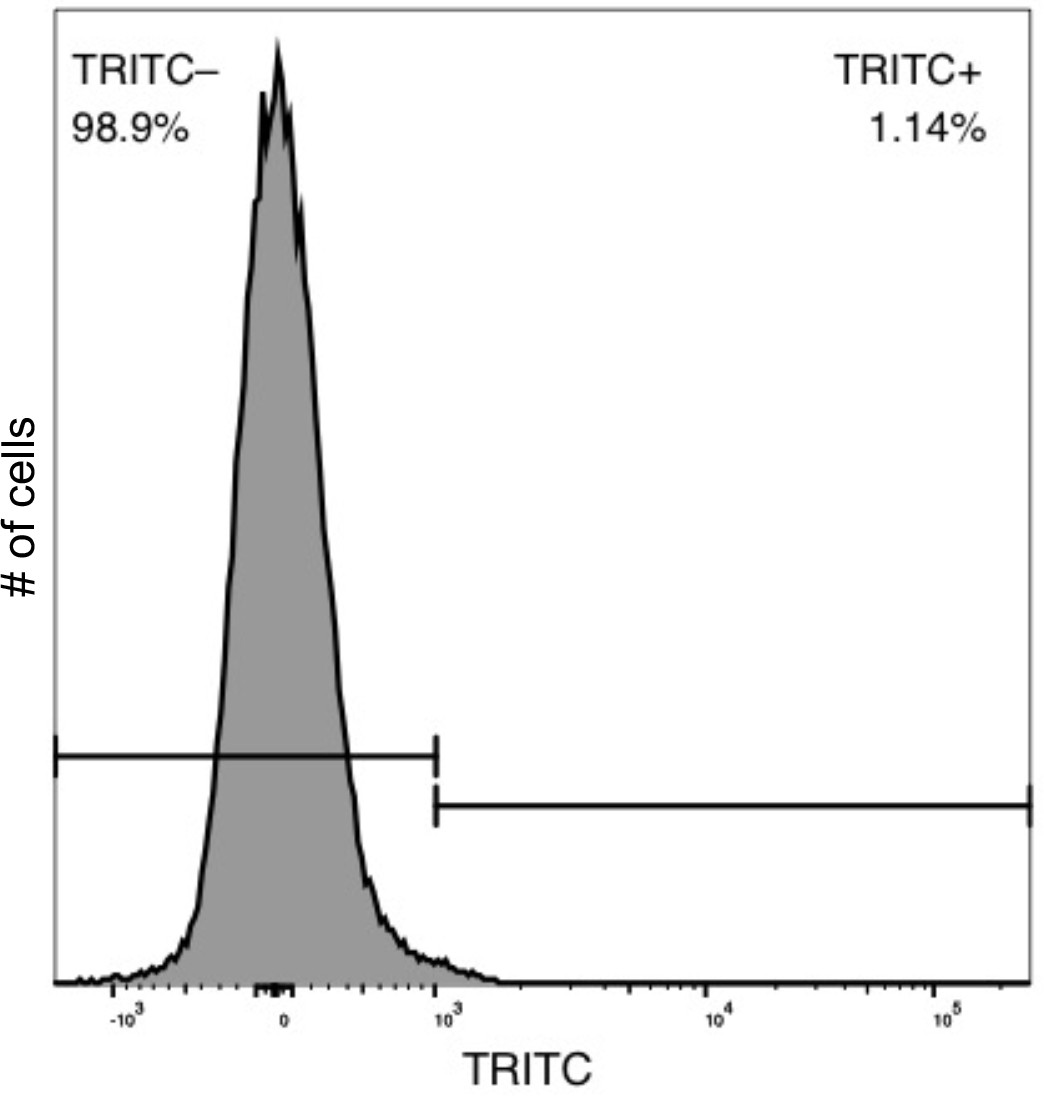
Flow cytometry control depicting the specificity of TRITC-HHA lectin for Psl.
A strain that does not produce Psl, PAO1 ΔwspF Δpel Δpsl, was grown for four hours in LB before cells were harvested, lectin stained, washed, and counted by flow cytometry. Using the same gates as determined in Figure 1—figure supplements 8b 1.14% of cells were misclassified as producing Psl.
Figure 2 with 5 supplements
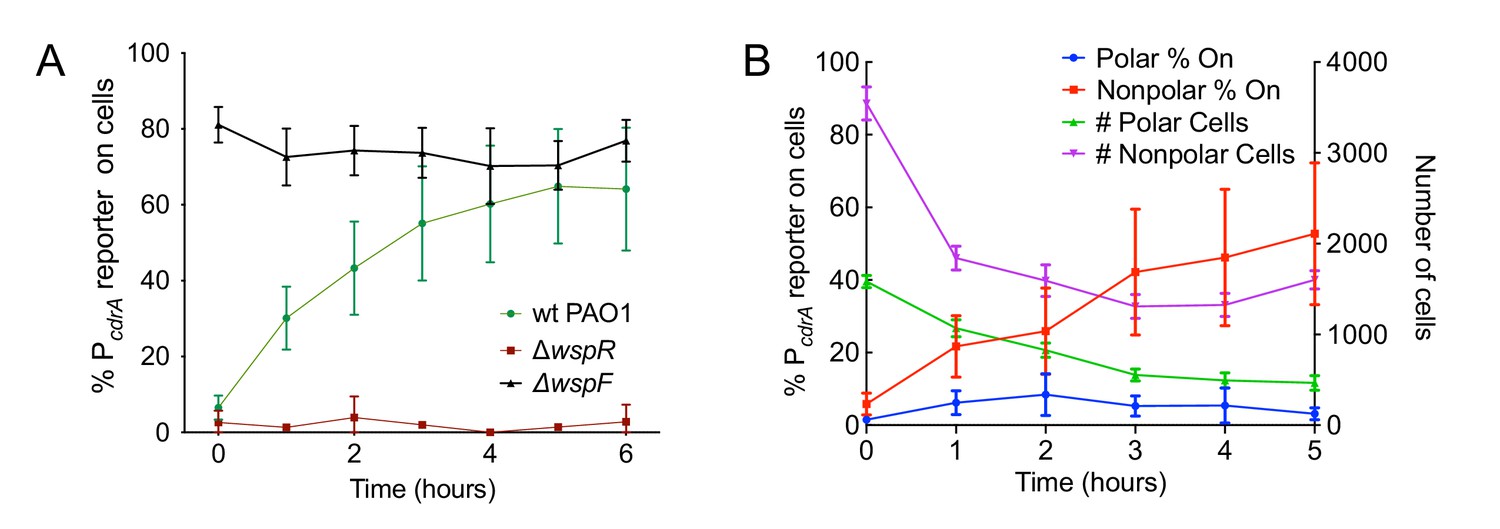
The Wsp system generates heterogeneity in cellular levels of c-di-GMP during early P. aeruginosa biofilm formation.
(A) The Wsp system is required for activation of the pPcdrA::gfpASV reporter during surface sensing. Six hour time course plot of the average percentage of surface-attached cells from either wild type PAO1 (green), PAO1 ΔwspR (red), or PAO1 ΔwspF (black) in which the pPcdrA::gfpASV reporter had turned ‘on’ at each hour. Cells were identified as ‘on’ if their average GFP fluorescence was greater than twice the average background GFP fluorescence of the image. Error bars = standard deviation. N ≥ 3 biological replicates. See Figure 2—figure supplement 1 for the same timecourse using mutants in the Pil-Chp surface sensing system. Figure 2—figure supplement 2 shows representative images from Figure 2A. Figure 2—figure supplement 3 shows that complementing the wspR mutant restores wild type levels of reporter activity. Figure 2—figure supplement 4 shows that the lab strain PA14 also displays Wsp-dependent c-di-GMP heterogeneity. Figure 2—figure supplement 5 shows that PA5017 (Pch) is not required for heterogeneity during surface sensing. (B) Laterally attached cells have higher c-di-GMP levels than polarly attached cells. Five hour time course plot depicting, on the left axis, the percentage of pPcdrA::gfpASV reporter ‘on’ cells that were either polarly (blue) or laterally (red) attached to the surface of a glass coverslip in a flow cell at each hour. The right axis depicts the total number of polar (green) and laterally attached (purple) cells at each time point. Cells were identified as pPcdrA:gfpASV reporter ‘on’ if their average GFP fluorescence was greater than 321 fluorescence units. Error bars = standard deviation. N = 4 biological replicates.
Figure 2—figure supplement 1
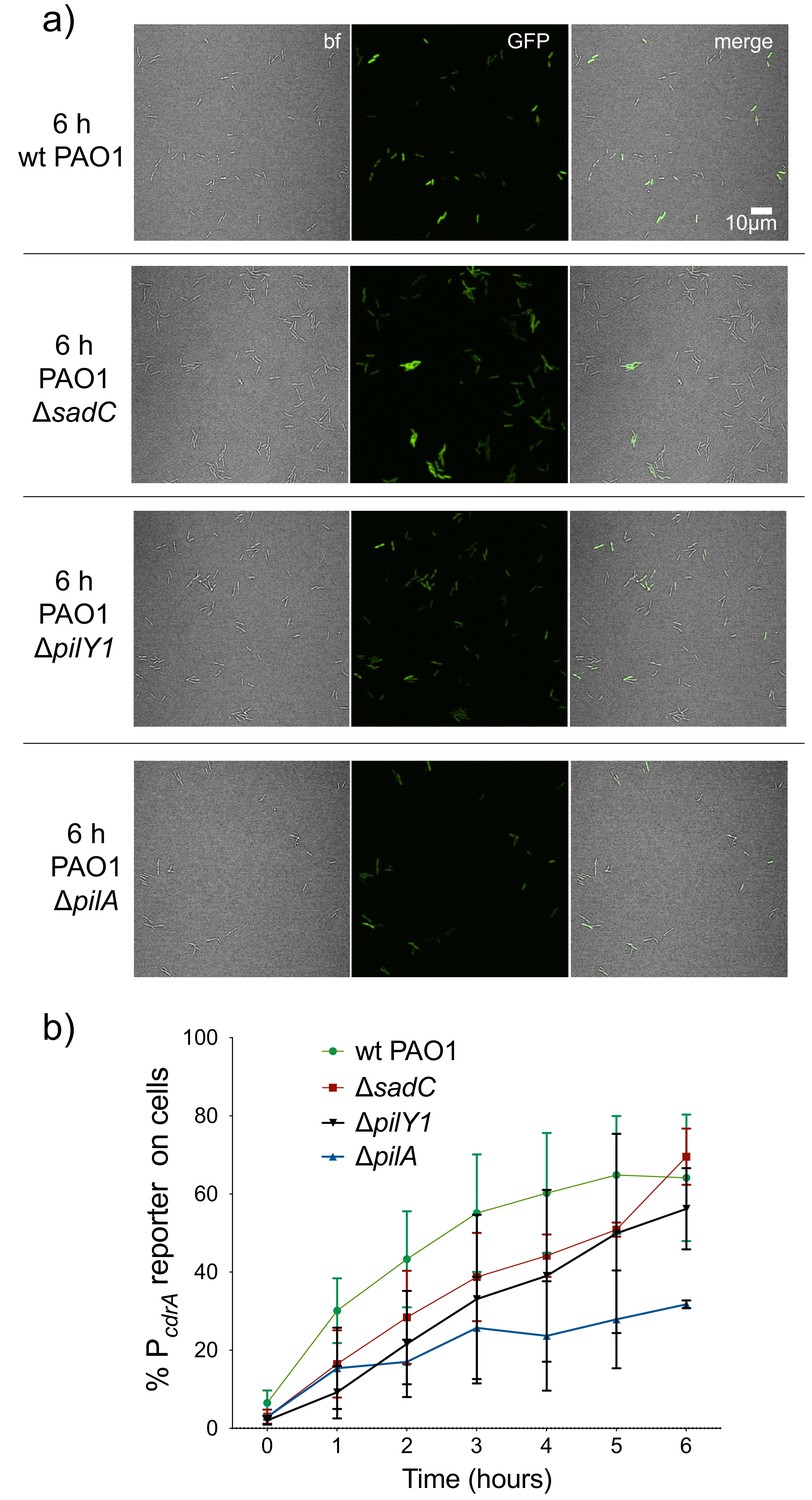
Mutants predicted to inactivate the Pil-Chp surface sensing system largely retain pPcdrA::gfpASV reporter activity during the first six hours of surface sensing.
(a) Representative images from wild type PAO1, PAO1 ΔsadC, PAO1 ΔpilY1, and PAO1 ΔpilA after 6 hr of surface attachment. bf = bright field, merge = bright field and GFP channels combined. (b) Six hour time course plot of the average percentage of cells from either wild type PAO1 (green), PAO1 ΔsadC (red), PAO1 ΔpilY1 (black), or PAO1 ΔpilA (blue) in which the pPcdrA::gfpASV reporter had turned ‘on’ at each hour. PAO1 ΔpilA is significantly different from wild type PAO1 from 2 to 6 hr (T-test, p<0.05). Cells were identified as ‘on’ if their average GFP fluorescence was greater than twice the average background GFP fluorescence of the image. Plotted values are the mean of at least three biological replicates and error bars are standard deviation.
Figure 2—figure supplement 2
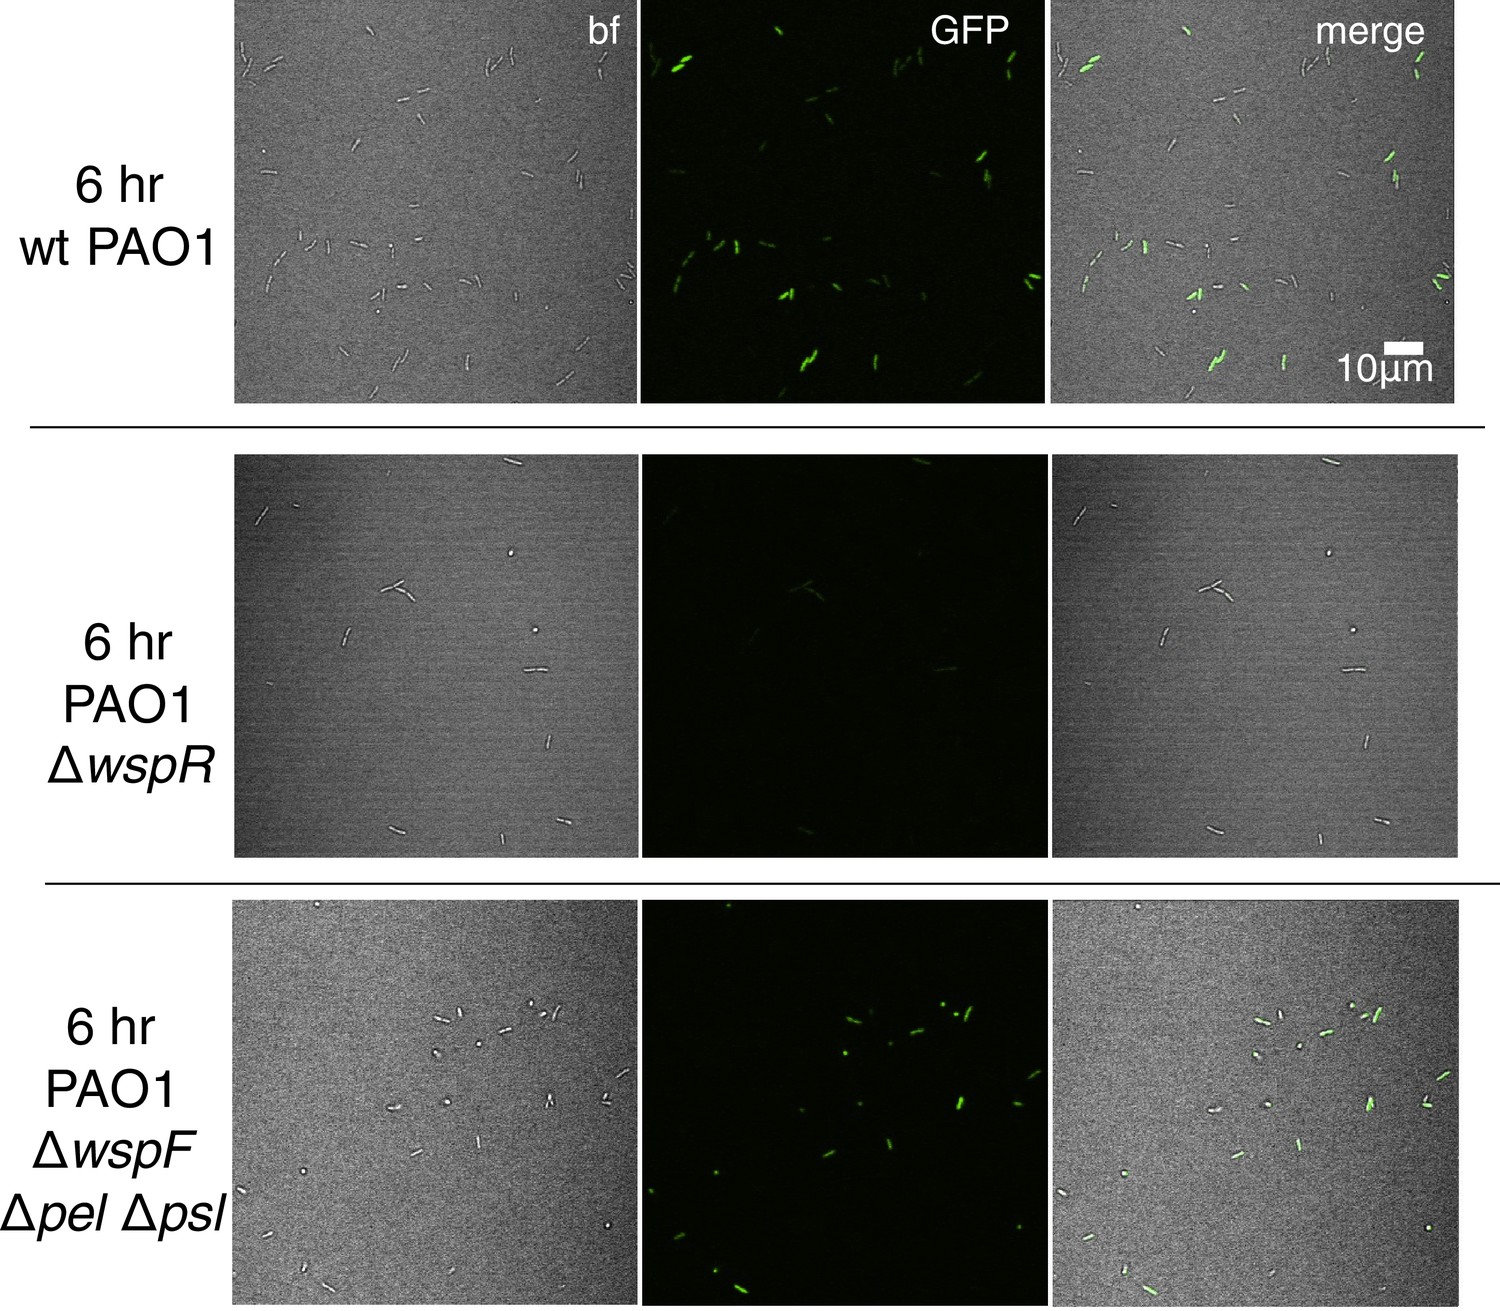
The pPcdrA::gfpASV reporter is sensitive to Wsp-dependent variation in c-di-GMP during surface sensing.
Representative images from wild type PAO1, PAO1 ΔwspR, and PAO1 ΔwspFΔpelCΔpslD after 6 hr of surface attachment. bf = bright field, merge = bright field and GFP channels combined.
Figure 2—figure supplement 3
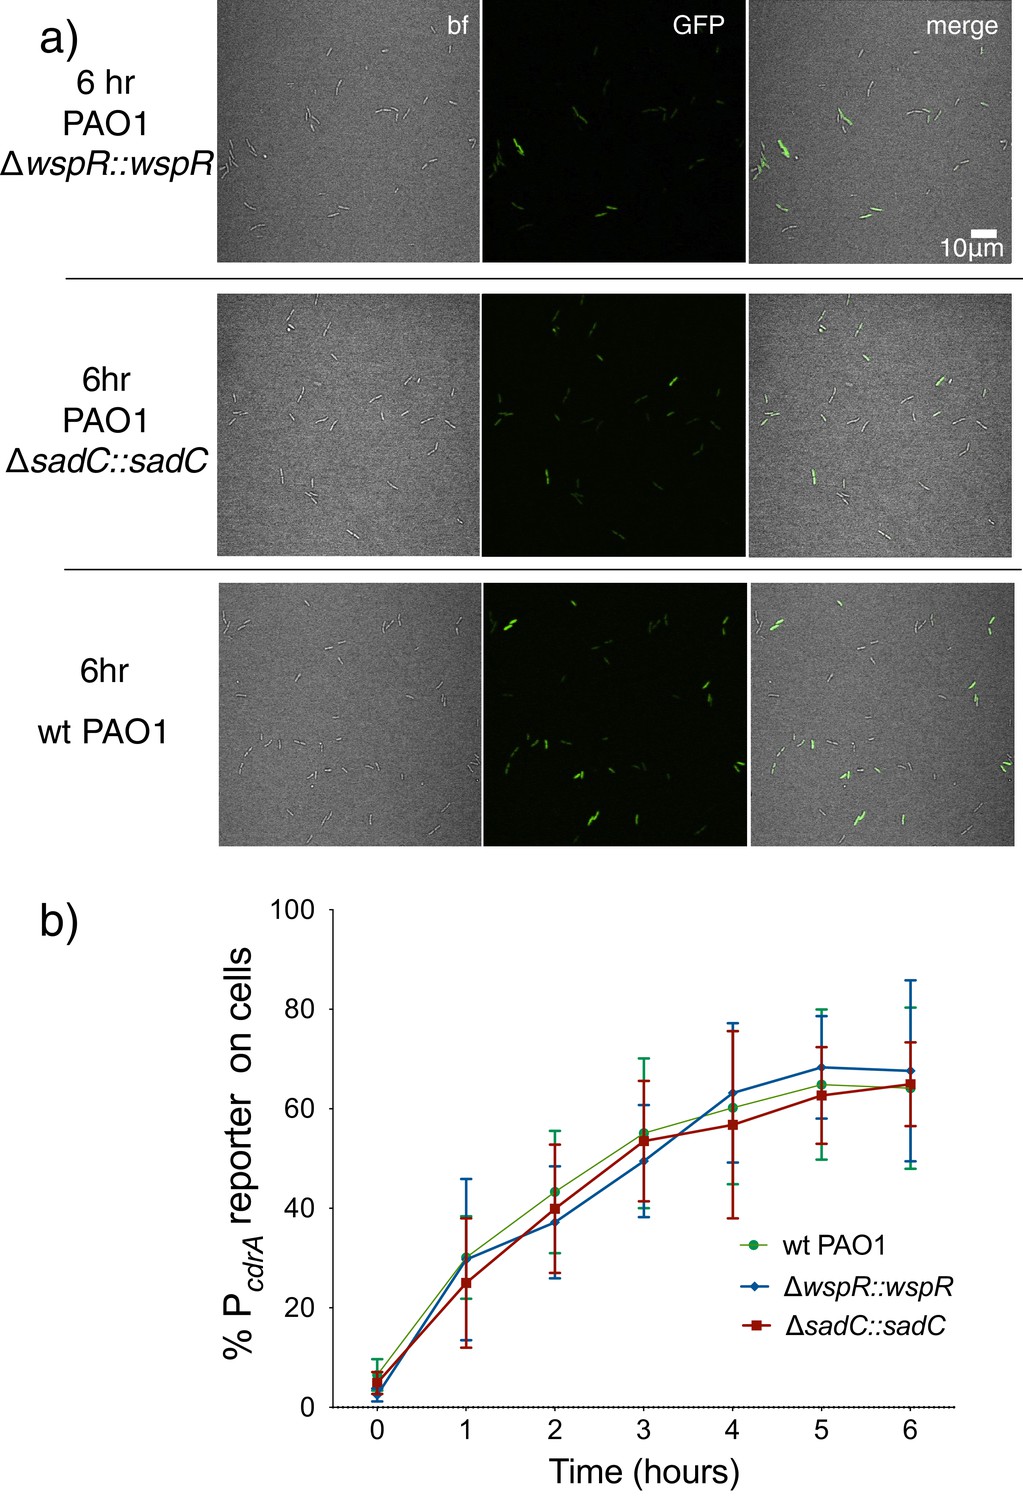
Complemented diguanylate cyclase mutants display wild type levels of PcdrA::gfpASV reporter activity.
PAO1 ΔwspR and PAO1 ΔsadC were complemented at a neutral site on the chromosome under control of their native promoters. (a) Representative images from wild type PAO1, PAO1 ΔwspR attCTX::wspR (ΔwspR::wspR), and PAO1 ΔsadC Tn7::sadC (PAO1 ΔsadC::sadC) after 6 hr of surface attachment. bf = bright field, merge = bright field and GFP channels combined. (b) Six hour time course plot of the average percentage of cells from either wild type PAO1 (green), PAO1 ΔwspR attCTX::wspR (blue), or PAO1 ΔsadC Tn7::sadC in which the pPcdrA::gfpASV reporter had turned ‘on’ at each hour. Cells were identified as ‘on’ if their average GFP fluorescence was greater than twice the average background GFP fluorescence of the image. Error bars = standard deviation, n ≥ 3 biological replicates.
Figure 2—figure supplement 4
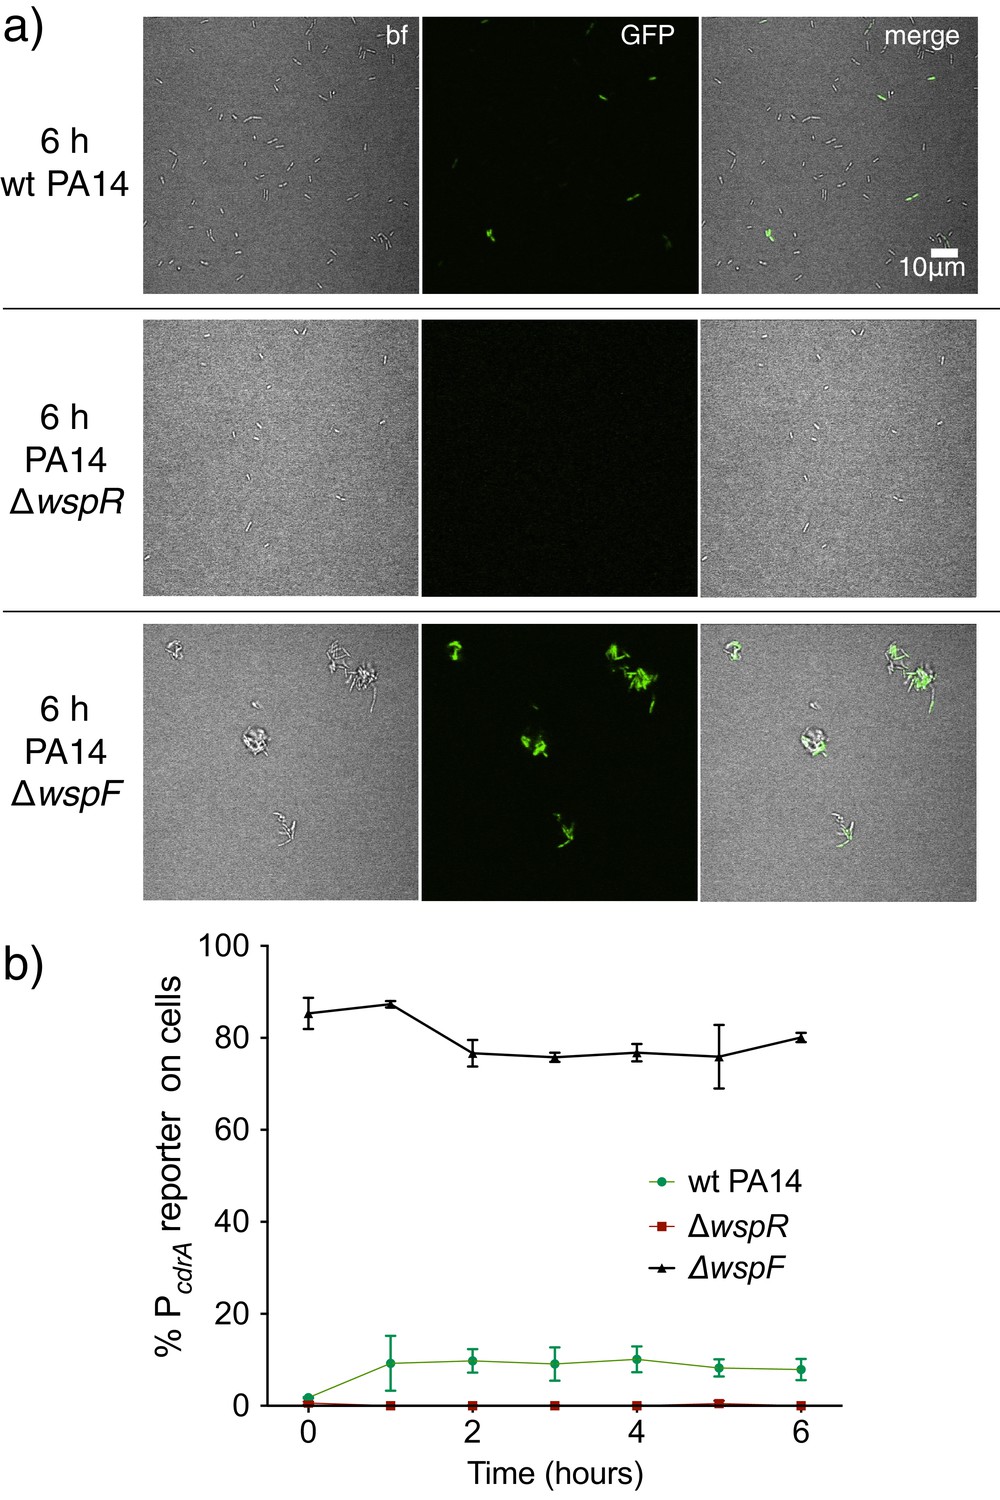
Activity of the pPcdrA::gfpASV reporter in strain PA14 is dependent on the Wsp system.
(a) Representative images from wild type PA14, PA14 ΔwspR, and PA14 ΔwspF after 6 hr of surface attachment. bf = bright field, merge = bright field and GFP channels combined. (b) Six hour time course plot of the average percentage of cells from either wild type PA14 (green), PA14 ΔwspR (red), or PA14 ΔwspF (black) in which the pPcdrA::gfpASV reporter had turned ‘on’ at each hour. Cells were identified as ‘on’ if their average GFP fluorescence was greater than twice the average background GFP fluorescence of the image. Error bars = standard deviation, n ≥ 3 biological replicates.
Figure 2—figure supplement 5
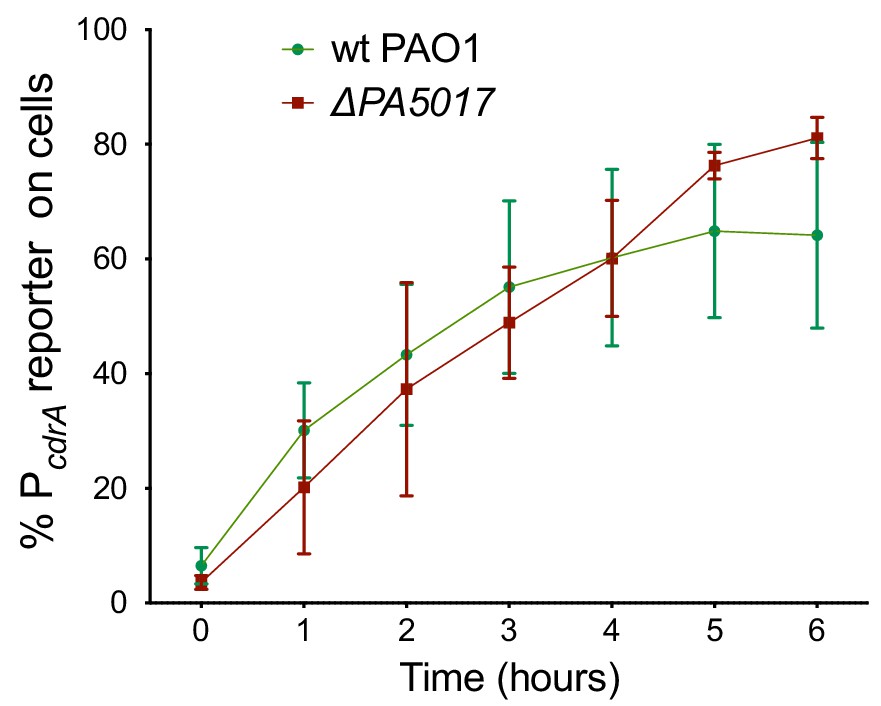
A mutation in PA5017 (also referred to as pch or dipA) does not impact the heterogeneity observed in surface sensing.
Figure 3 with 1 supplement
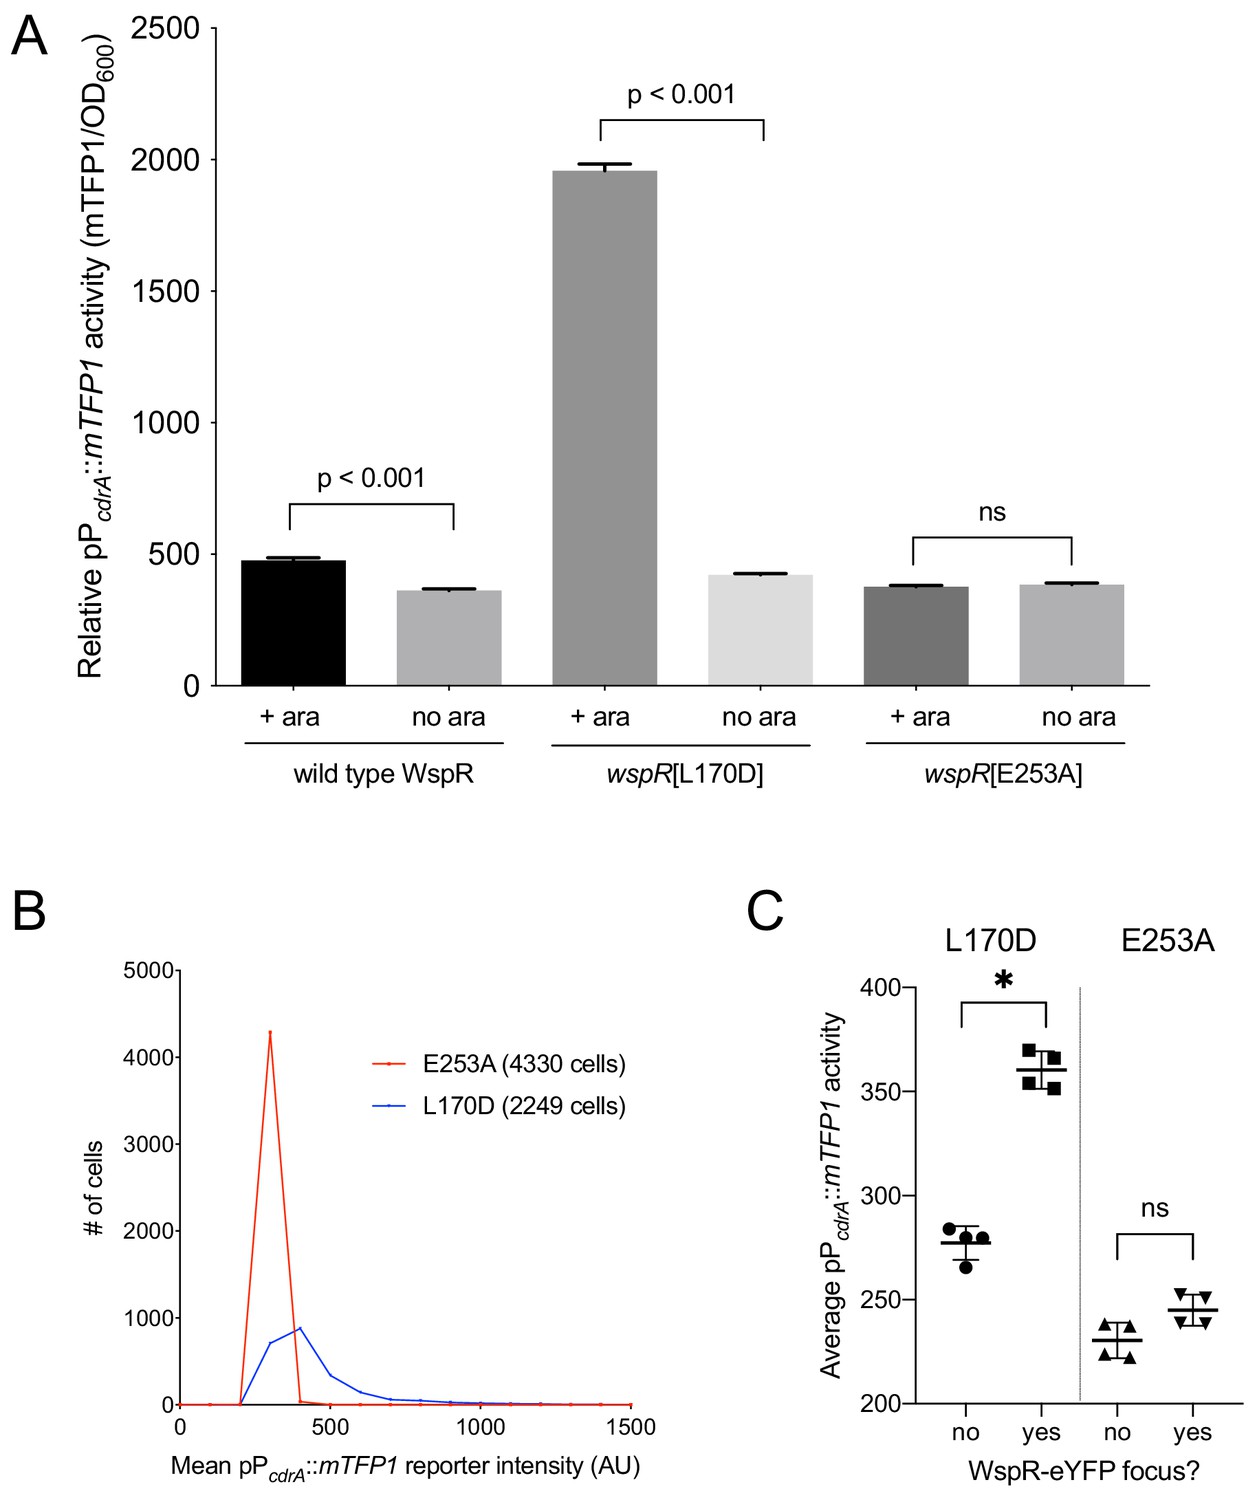
Activity of the pPcdrA::mTFP1 reporter is dependent on the ability of WspR to produce c-di-GMP.
(A) The pPcdrA::mTFP1 reporter is active in surface grown cells with functional, arabinose-inducible alleles of WspR when arabinose is added to the media. Wild type WspR represents the strain PAO1 ΔwspR attCTX::wspR-eYFP. wspR[L170D] represents the strain PAO1 ΔwspR attCTX::wspR[L170D]-eYFP, which produces large subcellular clusters of WspR and grows as rugose small colonies on LB with 1% arabinose, a phenotype that is indicative of high intracellular c-di-GMP. wspR[E253A] represents the strain PAO1 ΔwspR attCTX::wspR[L170D]-eYFP cells, which forms large subcellular WspR clusters, but does not produce c-di-GMP via WspR due to the point mutation located in its active site. Cells were grown on LB agar plates with 100 μg/mL gentamicin, and in the presence or absence of 1% arabinose. Cells were resuspended in PBS and mTFP1 fluorescence and OD600 were measured. Relative pPcdrA::mTFP1 reporter activity is the level of mTFP1 fluorescence normalized to OD600. Asterisk indicates statistical significance by Student’s t-test (p<0.001) in six technical replicates. Error bars = standard deviation. (B) The pPcdrA::mTFP1 reporter displays heterogeneity in a strain with a functional WspR (wspR[L170D]) and is consistently dark in a strain with inactive WspR. Histogram displaying the distribution of average cellular levels of mTFP1 fluorescence from expression of the pPcdrA::mTFP1 reporter in either the PAO1 ΔwspR attCTX::wspR[L170D]-eYFP (blue) or PAO1 ΔwspR attCTX::wspR[E253A]-eYFP (red) backgrounds. (C) Cells with subcellular clusters of functional WspR have higher levels of c-di-GMP reporter activity than cells without a WspR focus or cells without a functional WspR. L170D refers to a point mutant in WspR that forms large subcellular clusters and retains diguanylate cyclase activity: WspR[L170D]-eYFP in the strain PAO1 ΔwspR attCTX::wspR[L170D]-eYFP. E253A refers to a point mutant in WspR that forms large subcellular clusters but does not retain diguanylate cyclase activity: WspR[E253A]-eYFP in the strain PAO1 ΔwspR attCTX::wspR[E253A]-eYFP. Asterisk indicates statistical significance by Student’s t-test (p<0.001) in four replicates, n.s. = not significant. Error bars = standard deviation. See Figure 3—figure supplement 1 for a representative image of WspR[L170D]-eYFP foci.
-
Figure 3—source data 1
Figure 3B source data.
- https://cdn.elifesciences.org/articles/45084/elife-45084-fig3-data1-v3.xlsx
Figure 3—figure supplement 1
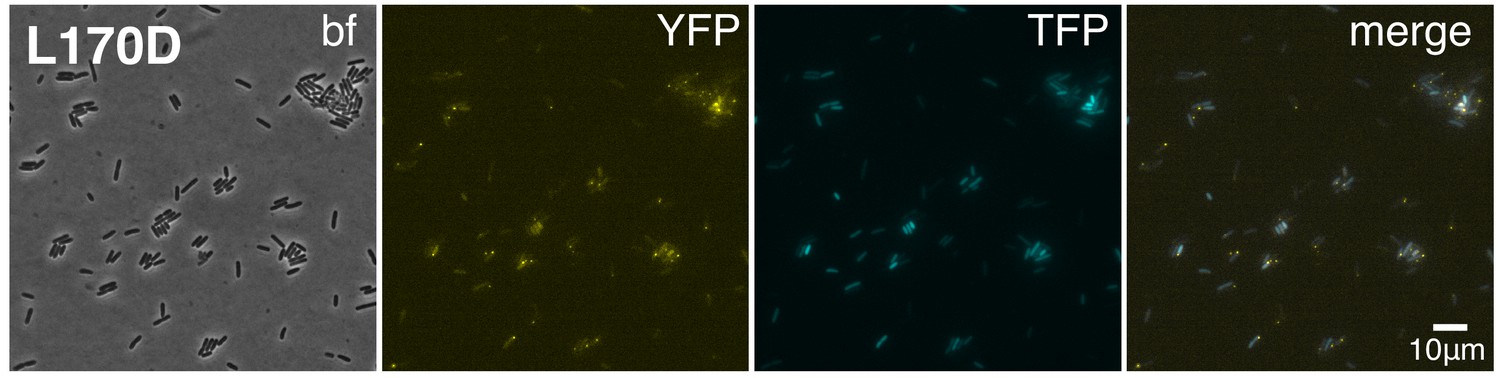
A representative image despicting subcellular foci of WspR[L170D]-eYFP in cells with high pPcdrA::mTFP1 reporter activity.
Cells with visible subcellulars clusters of WspR[L170D]-eYFP (strain PAO1 ΔwspR attCTX::wspR[L170D]-eYFP) also have high levels of c-di-GMP reporter activity. bf, bright field; YFP, wspR-YFP foci; mTFP1 = pPcdrA::mTFP1 activity; and merge, merged YFP and TFP channels. PAO1 ΔwspR attCTX::wspR[L170D]-eYFP cells harboring the pPcdrA::mTFP1 reporter were grown on LB agar plates with 1% arabinose and 100 μg/mL gentamicin, then spotted onto an agar pad and imaged immediately.
Figure 4 with 1 supplement
Multigenerational c-di-GMP levels within populations of surface-attached wild type PAO1 cells are inversely correlated with surface motility and detachment.
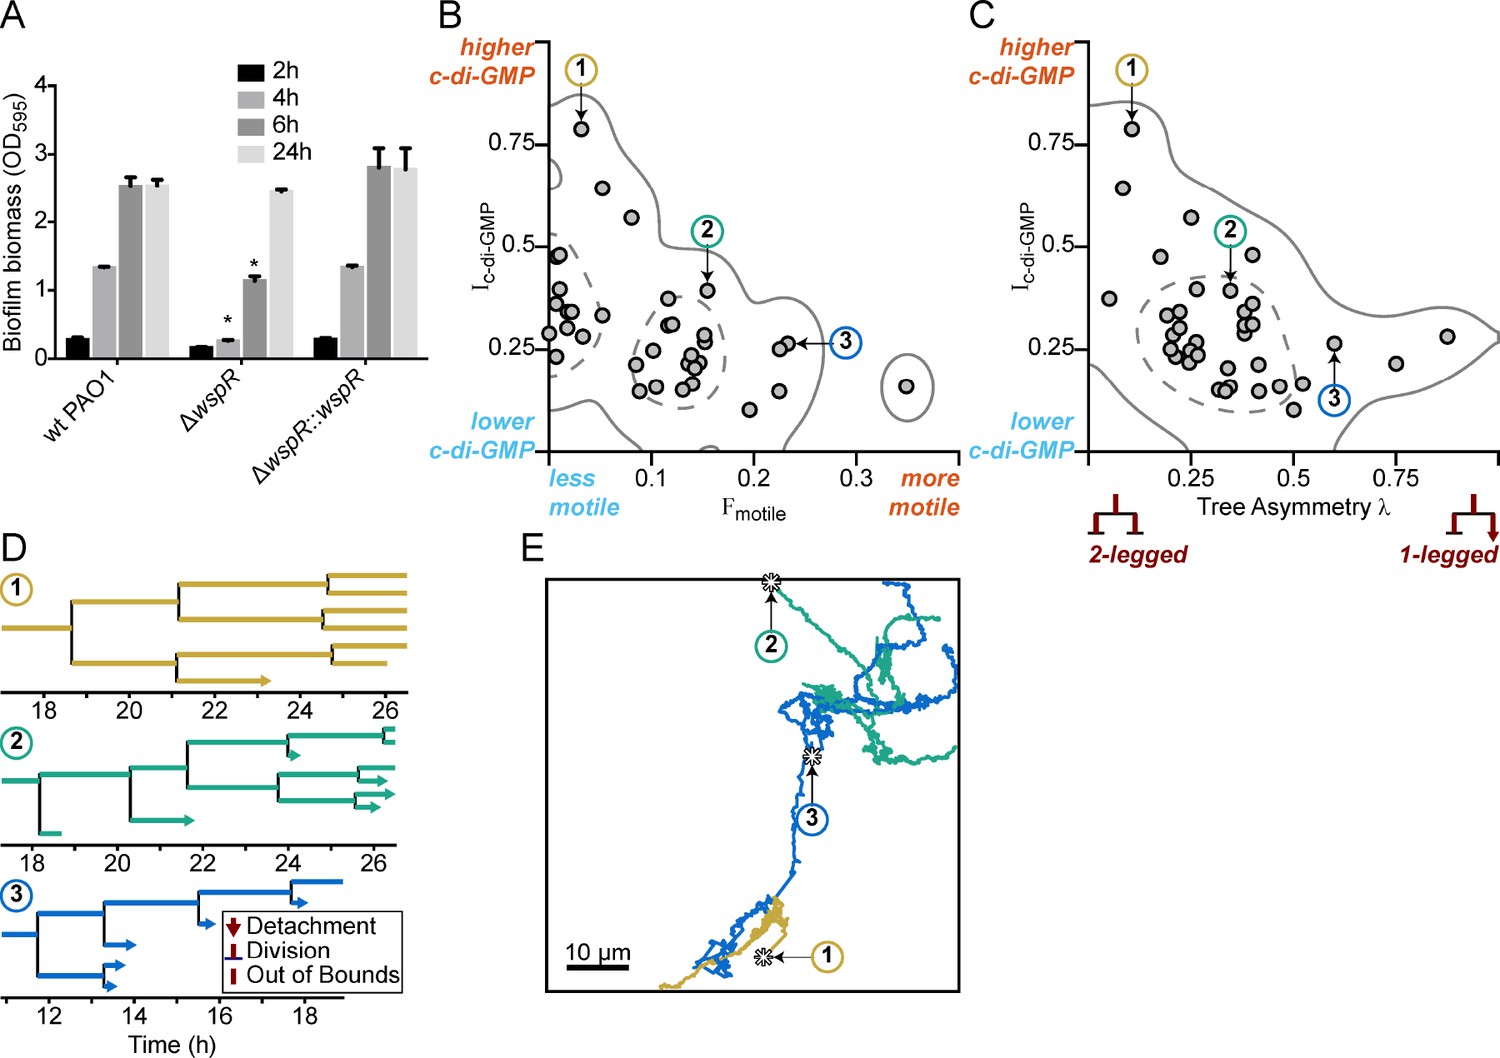
(A) The Wsp surface sensing system is involved in the early stages of biofilm formation in PAO1. Static biofilm assay performed in wild type PAO1, a single deletion mutant of wspR, and the PAO1 ΔwspR mutant complemented with wspR. Between 4 and 6 hr, PAO1 ΔwspR shows a defect in surface attachment and biofilm formation relative to the wild type. However, after 24 hr, PAO1 ΔwspR formed equal biofilm biomass compared to wild type. Plotted values are the mean of 6 technical replicates and error is standard deviation. Asterisk indicates a statistically significant change in biomass relative to wild type PAO1 at each time point (Student’s t test; p<0.05). (B) Plot of Ic-di-GMP vs Fmotile for individual wild type PAO1 families. Ic-di-GMP is the relative normalized c-di-GMP reporter intensity averaged across all members of a family. Fmotile is the fraction of time that cells in a family are motile (specifically surface translational motility). Each circle represents an individual family (N = 35) with at least four tracked generations. Solid lines represent the 95% probability bounds and dashed lines represent the 50% probability bounds, calculated via kernel density estimation. Spearman correlation: ρ = −0.53, p=0.0012. (C) Plot of Ic-di-GMP vs tree asymmetry λ for individual wild type PAO1 families. Colored numbers indicate the same three families from (B) and (D). Tree asymmetry λ quantifies the detachment behavior of family trees as follows. λ = 0 corresponds to ideal trees with purely ‘two-legged’ division-branching, when both daughter cells remain attached to the surface. λ = 1 corresponds to ideal trees with purely ‘one-legged’ division-branching when one daughter cell detaches or travels outside the field of view. Points here are the same families as in (B). Solid lines represent the 95% probability bounds and dashed lines represent the 50% probability bounds, calculated via kernel density estimation. Spearman correlation: ρ = −0.45, p=0.0068. (D) Family trees of the same three representative wild type PAO1 families indicated in (B) and (C). Time 0 hr is the start of the dataset recording. Lengths of horizontal lines on the plots are proportional to time spent in each generation. Horizontal lines that end with arrows are detachment events, lines that intersect with a vertical line are division events, and lines that end without a marker are out-of-bound events where we lose track of the bacterium (moving out of the field of view or reaching the end of the recording; represented as moving outside the XYT limits of the dataset boundaries). Vertical lines are arbitrarily spaced to show all the descendants. Colors represent the families in (B) and (C). (E) Spatial trajectories of the three representative families. Asterisks (*) represent the initial location of the founder cell. Scale bar 10 μm. The families are color coded as in the previous panels.
-
Figure 4—source data 1
MATLAB data for WT and ΔwspR families.
- https://cdn.elifesciences.org/articles/45084/elife-45084-fig4-data1-v3.zip
Figure 4—figure supplement 1
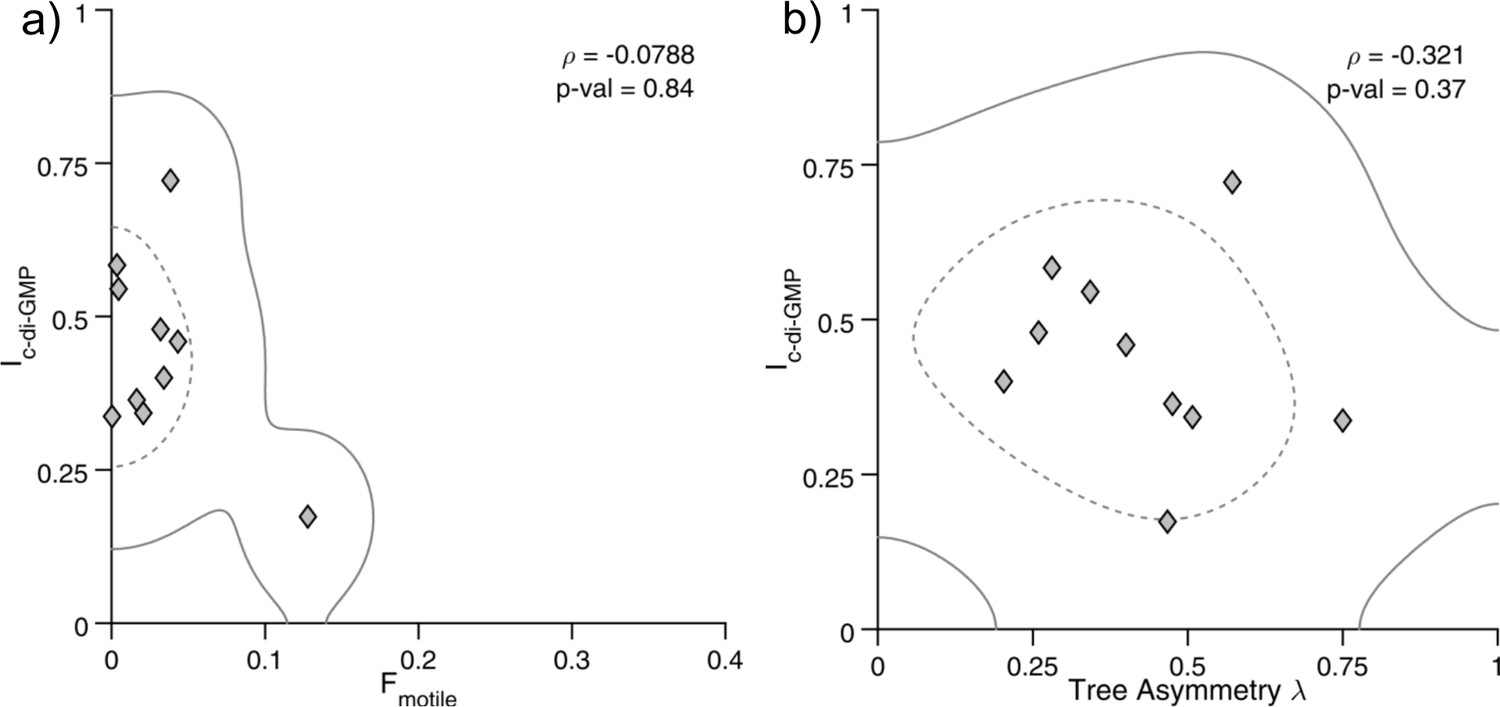
The ΔwspR mutant does not have correlations between c-di-GMP, surface motility, and detachment.
(A) Plot of Ic-di-GMP vs Fmotile for individual ΔwspR families. Each marker represents an individual family (N = 10) with at least four tracked generations. Solid (dashed) lines represent the 95% (50%) probability bounds calculated via kernel density estimation. Spearman correlation: ρ = −0.078, p=0.84. (B) Plot of Ic-di-GMP vs tree asymmetry λ for the same families as in (A). Spearman correlation: ρ = −0.32, p=0.37.
Figure 5 with 3 supplements
Optogenetic control of c-di-GMP production drastically affects family architecture and surface motility.
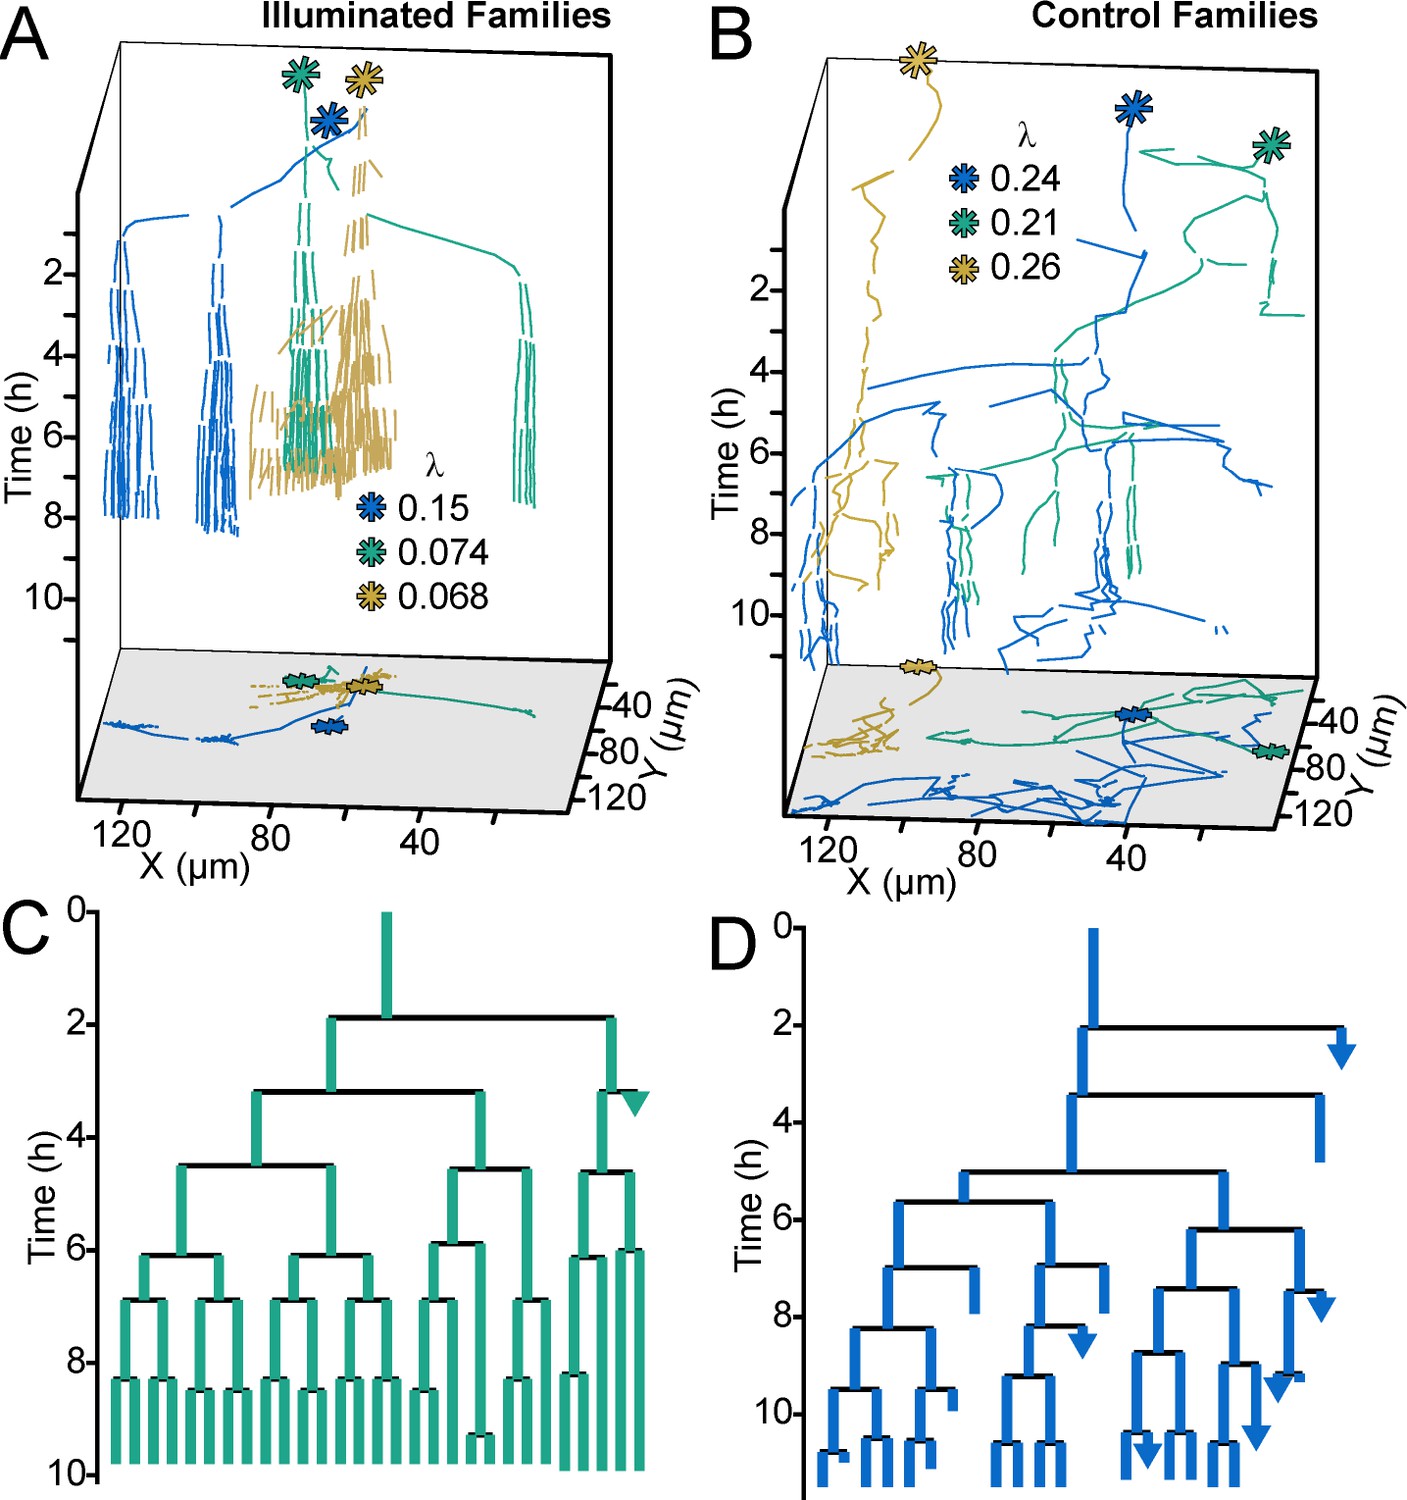
(A,B) Spatiotemporal plot of 3 illuminated families (A) and three control families (B). The individual cell tracks in the 3D plot are projected onto the XY plane as spatial trajectories. As in Figure 4, λ is a measure of tree asymmetry, with higher values indicating more cells traveling outside the field of view or detaching. In A, the illuminated families tend to be sessile, as expected for cells with high c-di-GMP. In B, control cells are more motile than the illuminated cells in A. (C,D) Family trees of a single corresponding family in (A) and (B), where the color corresponds to the same family. Illuminated cells (C) tend to stay adhered across multiple generations, whereas control cells (D) display more surface motility and detachments. See Video 1 for a representative video of the optogenetic reporter experiment. Figure 5—figure supplement 1 is a control experiment showing that c-di-GMP levels increase in response to red light intensity in the optogenetic reporter strain. Figure 5—figure supplement 2 shows a schematic of the ATIM apparatus. See Figure 5—figure supplement 3 for the data from Figure 5 overlayed onto Figure 4C, showing that ptogenetic-controlled families follow the trend of family behavior observed in wt PAO1 cells.
-
Figure 5—source data 1
MATLAB data for optogenetic and WT families.
- https://cdn.elifesciences.org/articles/45084/elife-45084-fig5-data1-v3.zip
Figure 5—figure supplement 1
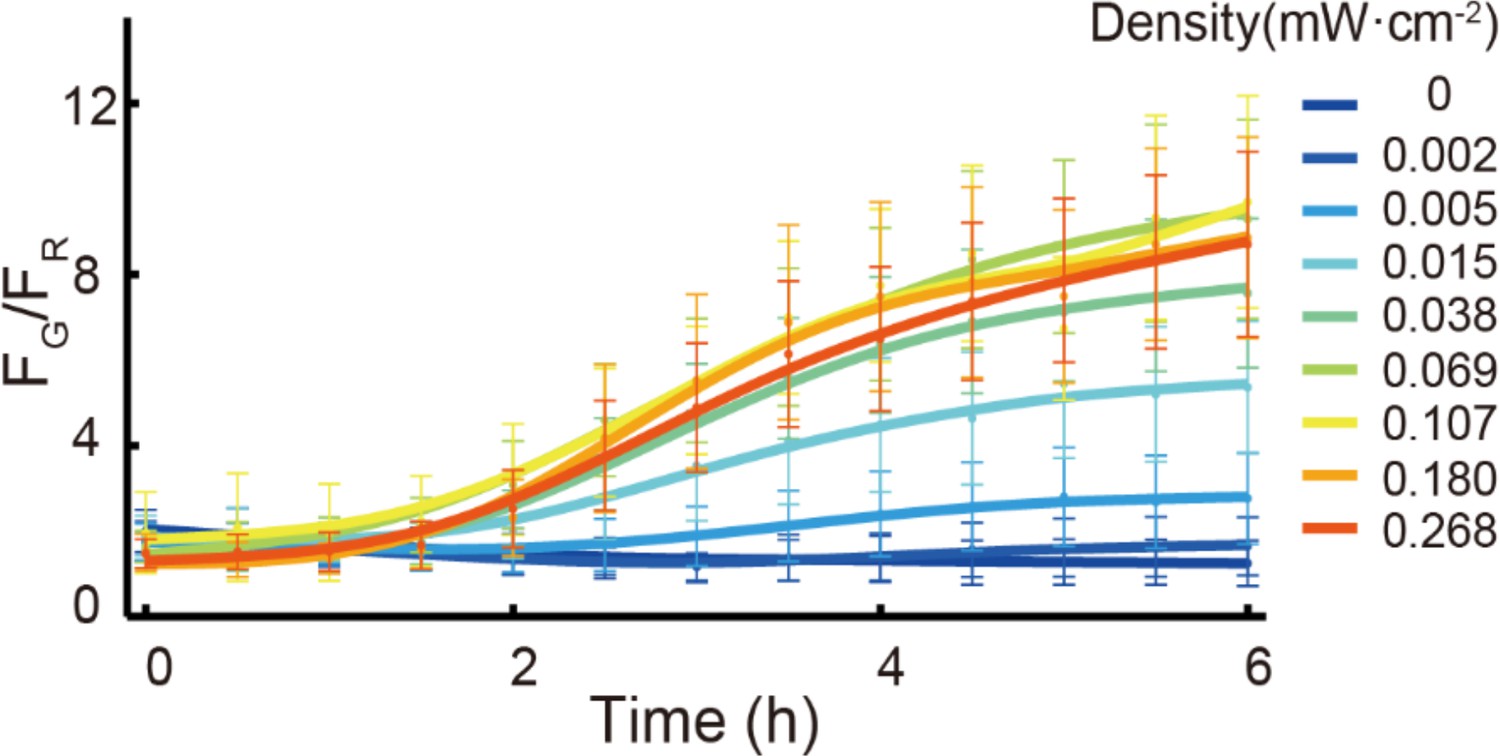
Activity of the c-di-GMP reporter of PAO1-bphS-PcdrA-GFP-mCherry was dependent on red-light intensity.
FG/FR refers to the ratio of GFP fluorescence (reporter activity) over mCherry fluorescence (constitutive fluorescence). Density refers to the intensity of red light illumination. The strains PAO1-bphS -PcdrA-GFP-mCherry were grown on an agar pad surface with red light illumination at a range of intensities. We found that c-di-GMP levels had increased approximately 2-fold at 6 hr when strains were illuminated at 0.015 mW/cm2. Error bars represent standard deviation.
Figure 5—figure supplement 2
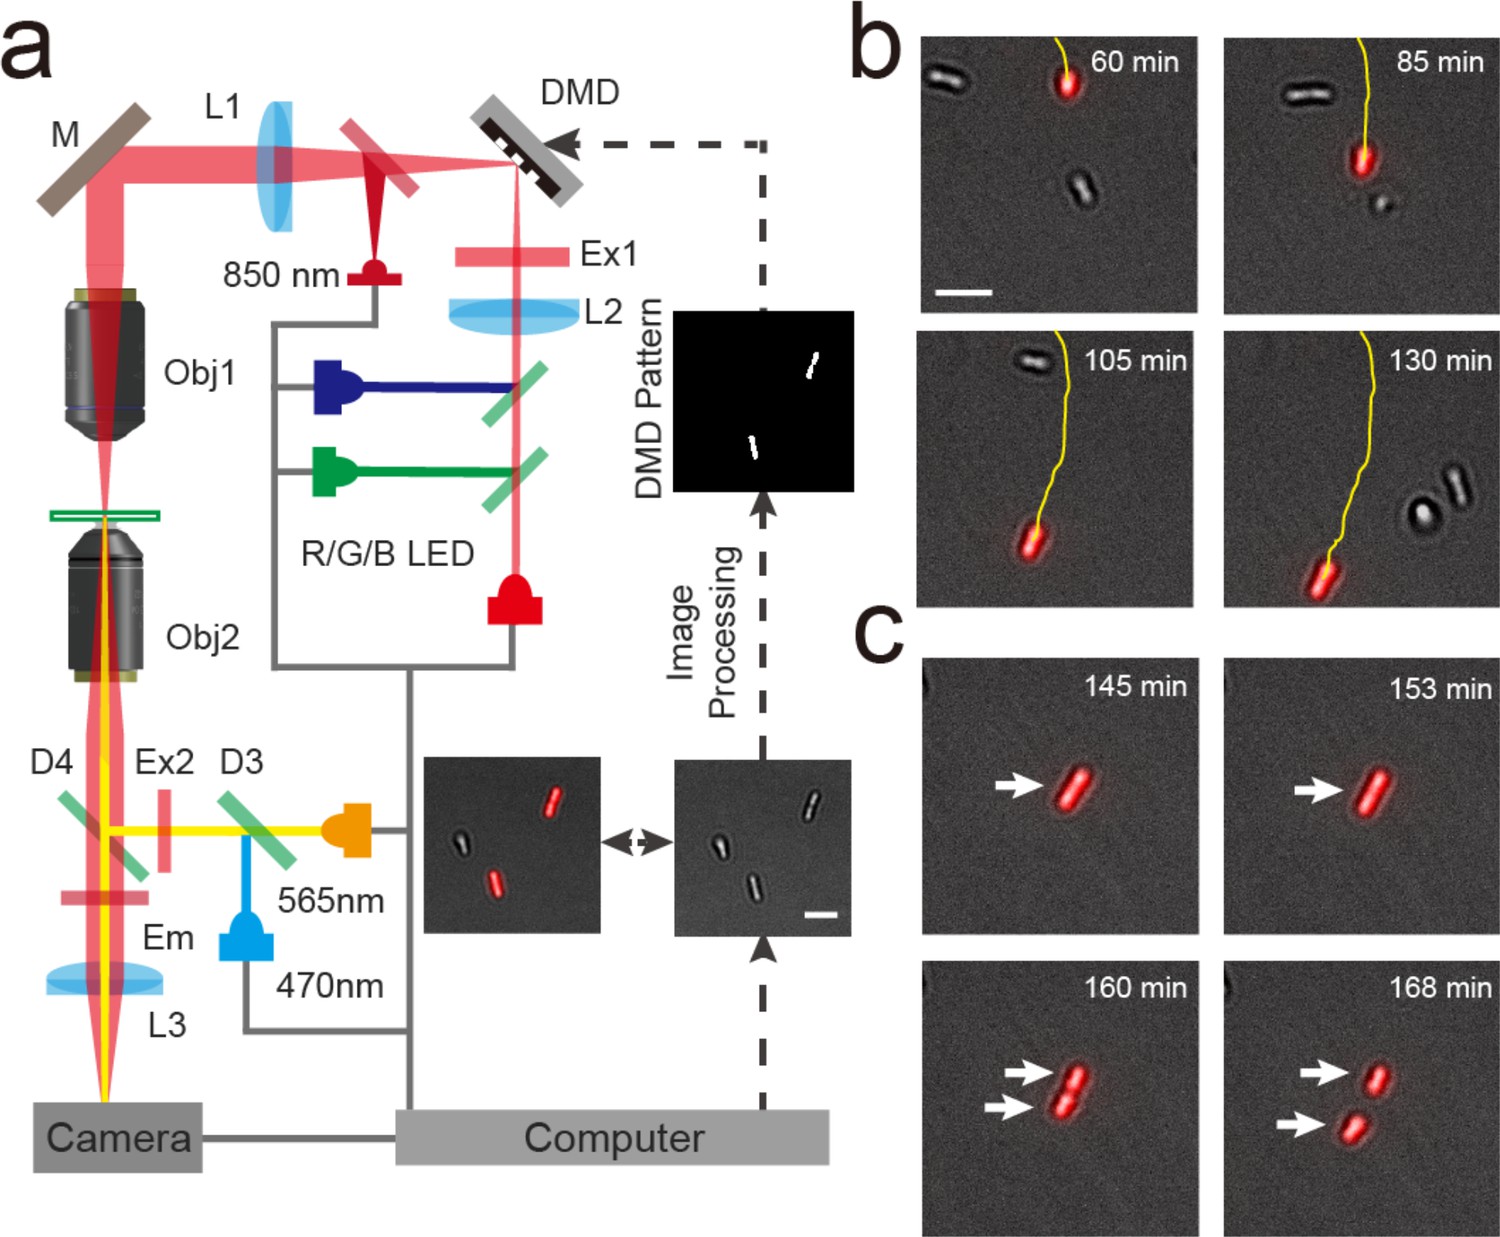
Using Adaptive Tracking Illumination Microscopy (ATIM) to exactly illuminate single P. aeruginosa cells on surface.
(a) Schematic drawing of the ATI system. A high-throughput bacterial tracking algorithm was employed for analyzing cells’ behavior in real time and the information was immediately fed back to an adaptive microscope equipped with a digital micromirror device (DMD). (b) Example depicting one cell of interest being tracked and projected in real time. (c) The feedback illumination can generate projected patterns to exactly follow the daughter cells after the tracked cell divides. Scale bar for all images is 5 μm.
Figure 5—figure supplement 3
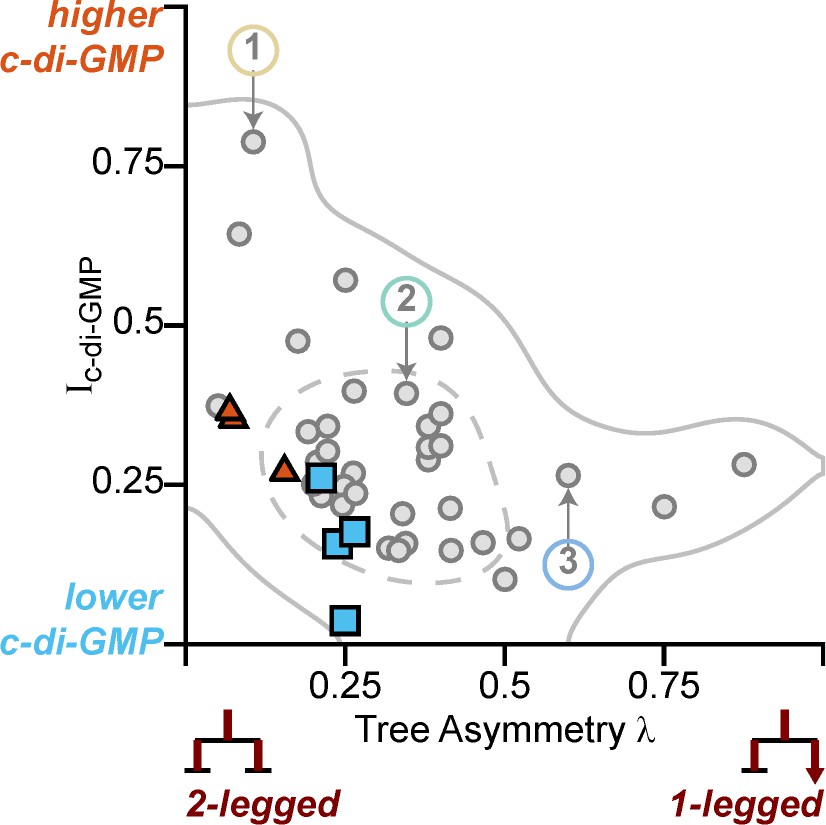
Optogenetic-controlled families follow the trend of family behavior observed in wt PAO1 cells, with illuminated families resembling the high c-di-GMP matrix producers and control families resembling low c-di-GMP surface explorers.
Families plotted in Figure 5 (plus one additional control family) are plotted on top of Figure 4C (Ic-di-GMP vs λ). Red triangles and blue triangles represent the illuminated and control families, respectively, while the original data from Figure 4C is grayed out. Illuminated families have higher Ic-di-GMP and lower λ than the control families.
Videos
Video 1
Single cells are precisely illuminated by ATIM via in situ analysis and tracking of bacteria.
The left panel shows the merged images of gfpASV and mCherry fluorescence microscopy images over time. The right panel shows the merged images of red LED projected patterns and bright field images corresponding to the left panel. The fluorescence intensity of gfpASV in the illuminated cells and their offspring (colored red in right panel) is significantly increased after using ATI for 460 mins. In contrast, the gfpASV fluorescence intensity of the un-illuminated cells remains low and these cells remain motile.
Tables
Key resources table
| Reagent type (species) or resource | Designation | Source or reference | Identifiers | Additional information |
|---|---|---|---|---|
| Strain, strain background (Pseudomonas aeruginosa) | PAO1 | PMID: 111024 | The version of PAO1 used in this study can be obtained from Matthew Parsek's laboratory. | |
| Recombinant DNA reagent | pPcdrA::gfpASV | PMID: 22582064 | ||
| Recombinant DNA reagent | PAO1 attCTX::bphS attMiniTn7:: mCherry pPcdrA::gfpASV | This study | NA | This strain can be obtained from Fan Jin's laboratory. |
| Commercial assay or kit | QuikChange Lightning Site-Directed Mutagenesis Kit | Agilent Technologies | 210519 | |
| Commercial assay or kit | Gateway BP Clonase II Enzyme mix | ThermoFisher Scientific | 11789020 | |
| Commercial assay or kit | LR Clonase II Plus enzyme | ThermoFisher Scientific | 12538120 | |
| Commercial assay or kit | QIAquick gel extraction kit | Qiagen | 28115 | |
| Commercial assay or kit | QIAquick PCR purification kit | Qiagen | 28104 | |
| Commercial assay or kit | Antarctic phosphatase | New England BioLabs | M0289S | |
| Commercial assay or kit | TRIzol LS | ThermoFisher Scientific | 10296010 | |
| Commercial assay or kit | RQ1 RNase-Free DNase | Promega | M6101 | |
| Commercial assay or kit | iTaq Universal SYBR Green One-Step kit | Bio-rad | 172–5150 | |
| Chemical compound, drug | TRITC Conjugated Wisteria floribunda lectin | EY laboratories | R-3101–1 | |
| Chemical compound, drug | TRITC Conjugated Hippeastrum hybrid Lectin (Amaryllis) | EY laboratories | R-8008–1 | |
| Software, algorithm | Volocity Image Analysis Software | Quorum Technologies Inc | Version 6.00 | |
| Software, algorithm | NIS-Elements AR | Nikon | Version 4.00 | |
| Software, algorithm | MATLAB code for tracking experiments | This study | Version R2015a | The code and datasets are available to download as source data files associated with Figures 1, 4 and 5. |
| Software, algorithm | Statistics and Machine Learning Toolbox for MATLAB | MathWorks | Version R2015a | |
| Other | Flow cell for time course experiments | University of Iowa Machine Shop | Standard dimension flow cell | Flow cell dimensions: 5 mm x 35 mm x 1 mm |
| Other | Flow cell for cell tracking experiments | PMID: 18770573 | Standard dimension flow cell | This flow cell can be ordered from Department of Systems Biology, Technical University of Denmark. |
Table 1
Strains, primers, and plasmids used in this study.
| Reference | ||
|---|---|---|
| P. aeruginosa strains | ||
| PAO1 | wild-type | Holloway et al., 1979 |
| PA14 | wild-type | Rahme et al., 1997 |
| PAO1ΔwspF | markerless, in frame deletion of WspF | Hickman et al., 2005 |
| PAO1ΔwspFΔpelAΔpslBCD | markerless, in frame deletions of WspF, PelA, and PslBCD genes | Rybtke et al., 2012 |
| PAO1ΔwspR | markerless, in frame deletion of WspR | Hickman, 2005 |
| PAO1ΔpilY1 | markerless, in frame deletion of PilY1 | this study |
| PAO1ΔsadC | markerless, in frame deletion of SadC | Irie et al., 2012 |
| PAO1ΔpilA | markerless, in frame deletion of PilA | Shrout et al., 2006 |
| PAO1ΔdipA | markerless, in frame deletion of DipA | this study |
| PAO1ΔwspR attCTX::PwspA::wspR | PAO1ΔwspR complemented with WspR under control of the Wsp operon promoter and including intergenic region upstream of WspR | Gift from Yasuhiko Irie |
| PAO1ΔsadC attCTX::sadC | PAO1ΔsadC complemented with SadC under control of its native promoter | Gift from Yasuhiko Irie |
| MPAO1 attTn7::P(A1/04/03)::GFPmut | wild type MPAO1 constitutively expressive stable GFP | this sudy |
| PA14 ΔwspF | markerless, in frame deletion of WspF | Gift from Caroline Harwood |
| PA14 ΔwspR | markerless, in frame deletion of WspR | Gift from Caroline Harwood |
| PAO1ΔwspR attCTX::PBAD-wspR-eYFP | markerless, in frame deletion of WspR with arabinose-inducible, C-terminally eYFP-tagged wild type WspR allele | Huangyutitham et al., 2013 |
| PAO1ΔwspR attCTX::PBAD-wspR[L170D]-eYFP | markerless, in frame deletion of WspR with arabinose-inducible, C-terminally eYFP-tagged WspR[L170D] allele | Huangyutitham et al., 2013 |
| PAO1ΔwspR attCTX::PBAD-wspR[E253A]-eYFP | markerless, in frame deletion of WspR with arabinose-inducible, C-terminally eYFP-tagged WspR[E253A] allele | Huangyutitham et al., 2013 |
| P. aeruginosa reporter strains | ||
| PAO1 pMH489 | Rybtke et al., 2012 | |
| PAO1 pPcdrA::gfpASV | Rybtke et al., 2012 | |
| PAO1 pPsiaA::gfpASV | this study | |
| PA14 pMH489 | this study | |
| PA14 pPcdrA::gfpASV | this study | |
| PAO1ΔwspF pMH489 | this study | |
| PAO1ΔwspF pPcdrA::gfpASV | this study | |
| PAO1ΔwspF pPsiaA::gfp | this study | |
| PAO1ΔwspFΔpelCΔpslD pMH489 | this study | |
| PAO1ΔwspFΔpelCΔpslD pPcdrA::gfpASV | this study | |
| PAO1ΔwspR pMH489 | this study | |
| PAO1ΔwspR pPcdrA::gfpASV | this study | |
| PAO1ΔwspR pPsiaA::gfp | this study | |
| PAO1ΔpilY1 pMH489 | this study | |
| PAO1ΔpilY1 pPcdrA::gfpASV | this study | |
| PAO1ΔsadC pMH489 | this study | |
| PAO1ΔsadC pPcdrA::gfpASV | this study | |
| PAO1ΔpilA pMH489 | this study | |
| PAO1ΔpilA pPcdrA::gfpASV | this study | |
| PAO1ΔdipA pMH489 | this study | |
| PAO1ΔdipA pPcdrA::gfpASV | this study | |
| PAO1ΔwspR attCTX::PwspA::wspR pMH489 | this study | |
| PAO1ΔwspR attCTX::PwspA::wspR pPcdrA::gfpASV | this study | |
| PAO1ΔsadC att::sadC pMH489 | this study | |
| PAO1ΔsadC att::sadC pPcdrA::gfpASV | this study | |
| PA14 ΔwspF pMH489 | this study | |
| PA14 ΔwspF pPcdrA::gfpASV | this study | |
| PA14 ΔwspR pMH489 | this study | |
| PA14 ΔwspR pPcdrA::gfpASV | this study | |
| PAO1ΔwspR attCTX::PBAD-wspR-eYFP pPcdrA::mTFP1 | this study | |
| PAO1ΔwspR attCTX::PBAD-wspR[L170D]-eYFP pPcdrA::mTFP1 | this study | |
| PAO1ΔwspR attCTX::PBAD-wspR[E253A]-eYFP pPcdrA::mTFP1 | this study | |
| PAO1 attCTX:: bphS attMiniTn7::mCherry pPcdrA::gfpASV | this study | |
| PAO1 attMiniTn7:: mCherry pPcdrA::gfpASV | this study | |
| E. coli strains | ||
| E. coli S17.1 pENTRPEX18Gm::ΔpilY1 | conjugation proficient E. coli harboring pilY1 deletion allele | Gift from Joe Harrison |
| E. coli S17.1 pENTRPEX18Gm::ΔdipA | conjugation proficient E. coli harboring dipA deletion allele | Gift from Joe Harrison |
| E. coli DH5α pUC18-miniTn7T2-PcdrA-RBSg10L-gfpAGA | source of PcdrA-RBSg10L | this study |
| E. coli DH5α pBBR1MCS5- PcdrA::RBSg10L::mTFP1 | referred to as ‘pPcdrA::mTFP1’ | this study |
| E. coli DH5α pPsiaA::gfp | plasmid-based, fluorescent siaA transcriptional reporter | this study |
| Primers | ||
| PAO1pilY1-SEQ-F | CTACTACGAGACCAATAGCGTC | this study |
| PAO1pilY1-SEQ-R | GTCGATGTCCACCAGGTTCTTC | this study |
| PAO1dipA-SEQ-F | GATACGCTTAACTTGGGCCCTG | this study |
| PAO1dipA-SEQ-R | CTTTTCTTGGTGAGGATTTCAGAAC | this study |
| PA14wspR-SEQ-F | GCTTCCTCACCATCGCCC | this study |
| PA14wspR-SEQ-R | CAGGTCGTCCAGGGTTTCC | this study |
| PA14wspF-SEQ-F | CTCACGGTGCGTGAGCTG | this study |
| PA14wspF-SEQ-R | GGTCCTGGAGGATCACCG | this study |
| SacI – PcdrA - F | GGGGAGCTC GTATGGAAGGTTCCTTGGCGG | this study |
| SOE-PcdrA-RBSg10L - R | ctcctcgcccttgctcaccat GGATATATCTCCTTCTTAAAG | this study |
| mTFP1 - F | atggtgagcaagggcgaggag | this study |
| KpnI - mTFP1 – R | GGGGTACC ttacttgtacagctcgtcc | this study |
| BamH1-Psia-F | GGG GGATCC GGCAGCGGCAACCGCCTCTG | this study |
| SiaA-BamH1-R | CCC GGATCC CAACCCCCAGTTCGCCGCCAT | this study |
| M13F(−21) | TGTAAAACGACGGCCAGT | GeneWiz |
| M13R | CAGGAAACAGCTATGAC | GeneWiz |
| ampR-F-qPCR | GCG CCA TCC CTT CAT CG | Colvin et al., 2011 |
| ampR-R-qPCR | GAT GTC GAC GCG GTT GTT G | Colvin et al., 2011 |
| pslA-F-qPCR | AAG ATC AAG AAA CGC GTG GAA T | Colvin et al., 2011 |
| pslA-R-qPCR | TGT AGA GGT CGA ACC ACA CCG | Colvin et al., 2011 |
| pelA-F-qPCR | CCT TCA GCC ATC CGT TCT TCT | Colvin et al., 2011 |
| pelA-R-qPCR | TCG CGT ACG AAG TCG ACC TT | Colvin et al., 2011 |
| rplU-F-qPCR | CGC AGT GAT TGT TAC CGG TG | Colvin et al., 2011 |
| rplU-R-qPCR | AGG CCT GAA TGC CGG TGA TC | Colvin et al., 2011 |
| OBT268 | GGGGACAACTTTTGTATACAAAGTTGTACTATAGAGGGACAAACTCAAGGTCATTCGCAAGAGTGGCCTTTATGATTGACCTTCTTCCGG TTAATACGACCGGGATAACTCCACTTGAGACGTGAAAAAAGAGGAGTA TTCATGCGTAAAGGAGAAGAACTTTTCACTGGAG | This study |
| OBT269 | GGGGACAAGTTTGTACAAAAAAGCA GGCTCGGCTTATTTGTATAGTTCATCCATGCCATGTGTAATC | This study |
| OBT314 | CAGGTCGACTCTAGAGGATCCCCATCAGAAAATTTATCAAAAAGAGTGTTGACTTGTGAGCGGATAACAATGATACTTAGATTCAATTGTGAGCGGATAACAATTTCACA CATCTAGAATTAAAGAGGAGAAATTAA GCATGGTGAGCAAGGGCGAGGAG | Zhao et al., 2013 |
| OBT315 | CTCCTCGCCCTTGCTCACCATGCTTAA TTTCTCCTCTTTAATTCTAGATGTGT GAAATTGTTATCCGCTCACAATTGAATCTAAGTATCATTGTTATCCGCTCACAAGTCAACACTCTTTTT GATAAATTTTCTGATGGGGAT CCTCTAGAGTCGACCTG | Zhao et al., 2013 |
| pPcdrA::gfpASV | PcdrA reporter with short halflife GFP | Rybtke et al., 2012 |
| pENTRPEX18Gm::ΔpilY1 | suicide plasmid containing pilY1 deletion construct for use in PAO1 | Gift from Joe Harrison |
| pENTRPEX18Gm::ΔdipA | suicide plasmid containing dipA deletion construct for use in PAO1 | Gift from Joe Harrison |
| pBBR1MCS5 | broad host range vector that is stable in P. aeruginosa, GentR | Elzer et al., 1995 |
| pUC18-miniTn7T2-PcdrA-RBSg10L-gfpAGA | source plasmid containing promoter of cdrA with enhanced ribosomal binding site | this study |
| pNCS-mTFP1 | source plasmid containing mTFP1 | Allele Biotech |
| pBBR1MCS5-PcdrA::RBSg10L::mTFP1 | teal fluorescent protein version of PcdrA reporter | this study |
| pPsiaA::gfp | PsiaA reporter expressing stable GFP, constructed using pMH487 plasmid | this study |
| pBT270 | miniTn7 transposon with gfpmut3 driven by the A1/04/03 promoter; Apr, Gmr | This study |
| pTNS2 | T7 transposase expression vector | Choi and Schweizer, 2006 |
| pBT223 | miniTn7 transposon with gfpmut3 driven by the trc promoter; Apr, Gmr | This study |
| pBT212 | A GateWay compatible plasmid containing gfpmut3 flanked by attR5 and attL1 recombination sites; Kmr | This study |
| pBT200 | A GateWay compatible plasmid containing the trc promoter flanked by attL2 and attL5 recombination sites; Knr | Zhao et al., 2013 |
| pUC18-miniTn7T2-Gm-GW | A GateWay compatible mini-Tn7 based vector; Cmr, Apr and Gmr; | Zhao et al., 2013 |
| AKN66 | source for gfpmut3 | Lambertsen et al., 2004 |
| pDONR221 P1-P5r | A GateWay compatible vector with attP1 and attP5r recombination sites and ccdB; Knr and Cmr | Invitrogen |
Additional files
-
Source code 1
Source code for fluorescence statistical tests.
- https://cdn.elifesciences.org/articles/45084/elife-45084-code1-v3.zip
-
Source code 2
Source code for family tree plots.
- https://cdn.elifesciences.org/articles/45084/elife-45084-code2-v3.zip
-
Source code 3
Source code for optogenetic family tree plots.
- https://cdn.elifesciences.org/articles/45084/elife-45084-code3-v3.zip
-
Transparent reporting form
- https://cdn.elifesciences.org/articles/45084/elife-45084-transrepform-v3.docx
Download links
A two-part list of links to download the article, or parts of the article, in various formats.
Downloads (link to download the article as PDF)
Open citations (links to open the citations from this article in various online reference manager services)
Cite this article (links to download the citations from this article in formats compatible with various reference manager tools)
Heterogeneity in surface sensing suggests a division of labor in Pseudomonas aeruginosa populations
eLife 8:e45084.
https://doi.org/10.7554/eLife.45084


