Neural mediation of greed personality trait on economic risk-taking
- Peking University, China
- Jinan University, China
Figures
Figure 1 with 1 supplement
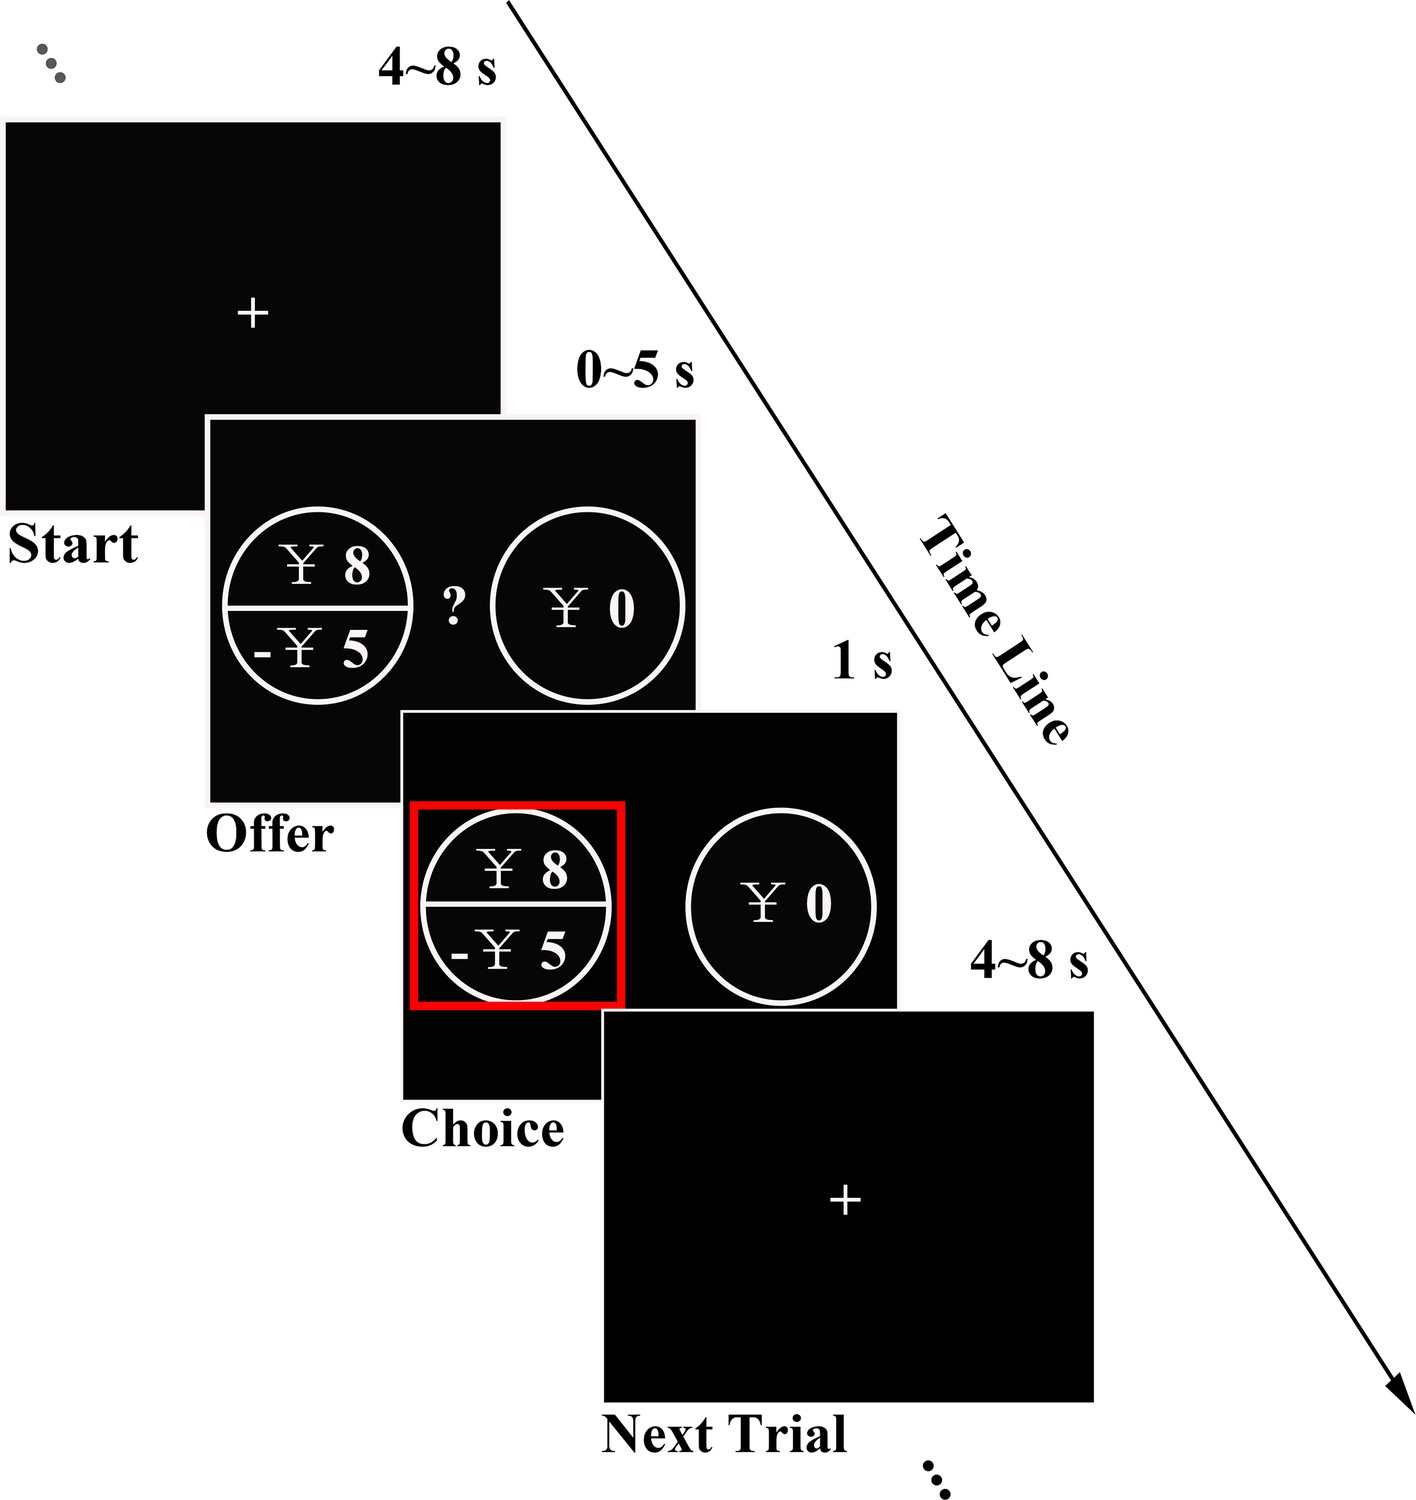
Experimental design.
In each trial, subjects had 5 s to decide between a certain option and a fair gamble with gain, loss or mixed prospects. Chosen option was highlighted with a red rectangle for 1 s before a random ITI (4 ~ 8 s) was introduced.
Figure 1—figure supplement 1
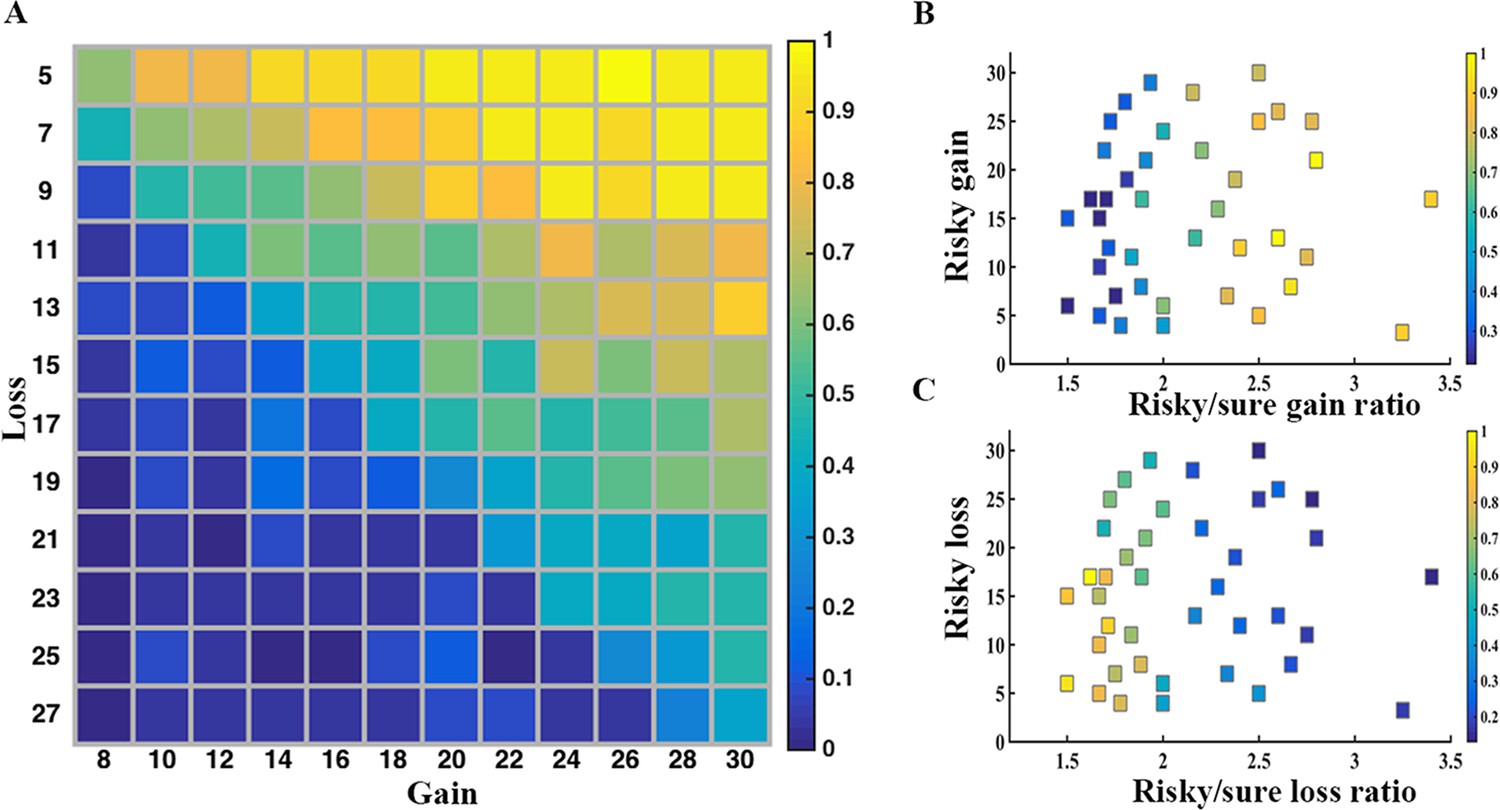
Choice sets and average percentage of risky choices across subjects.
(A) In 144 mixed gambles, potential gains and losses of the gamble were orthogonalized by design, with gains ranging from ¥8 to ¥30 (increments of ¥2) and losses from ¥5 to ¥27 (increments of ¥2). Subjects were sensitive to both gains and losses in the risky option. (B) In 40 gain only trials, the sure gain ranged from ¥1 to ¥15 and the risky gain ranged from ¥3 to ¥30, resulting the risky/sure gain ratio from 1.5 to 3.4. As this ratio increased, subjects were more likely to select the risky option (warmer color dots on the right). (C) In 40 loss trials, the signs of gamble and sure option amounts were flipped as opposed to the gain trials. Subjects were less likely to commit to the gamble as the risky/sure loss ratio increased. Color bar indicated the percentage of subjects choosing risky choices.
Figure 2 with 2 supplements
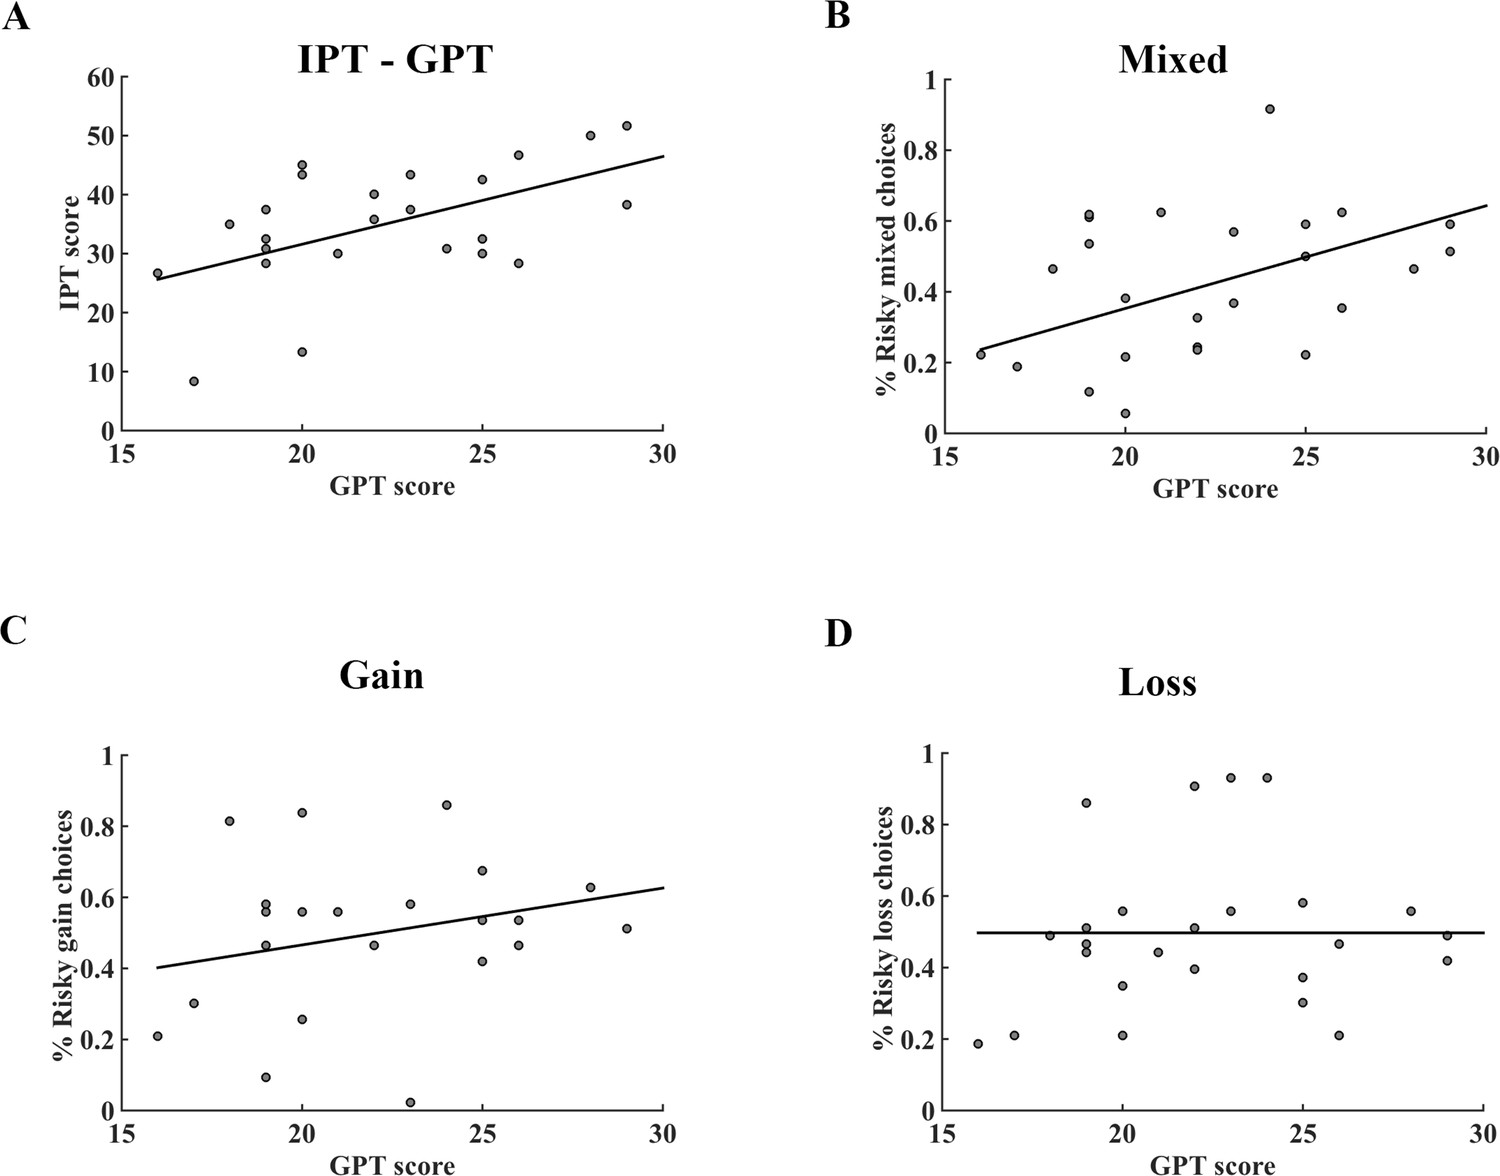
Correlation between GPT and IPT scores, GPT score and the percentage of risky choices in different conditions of the fMRI dataset.
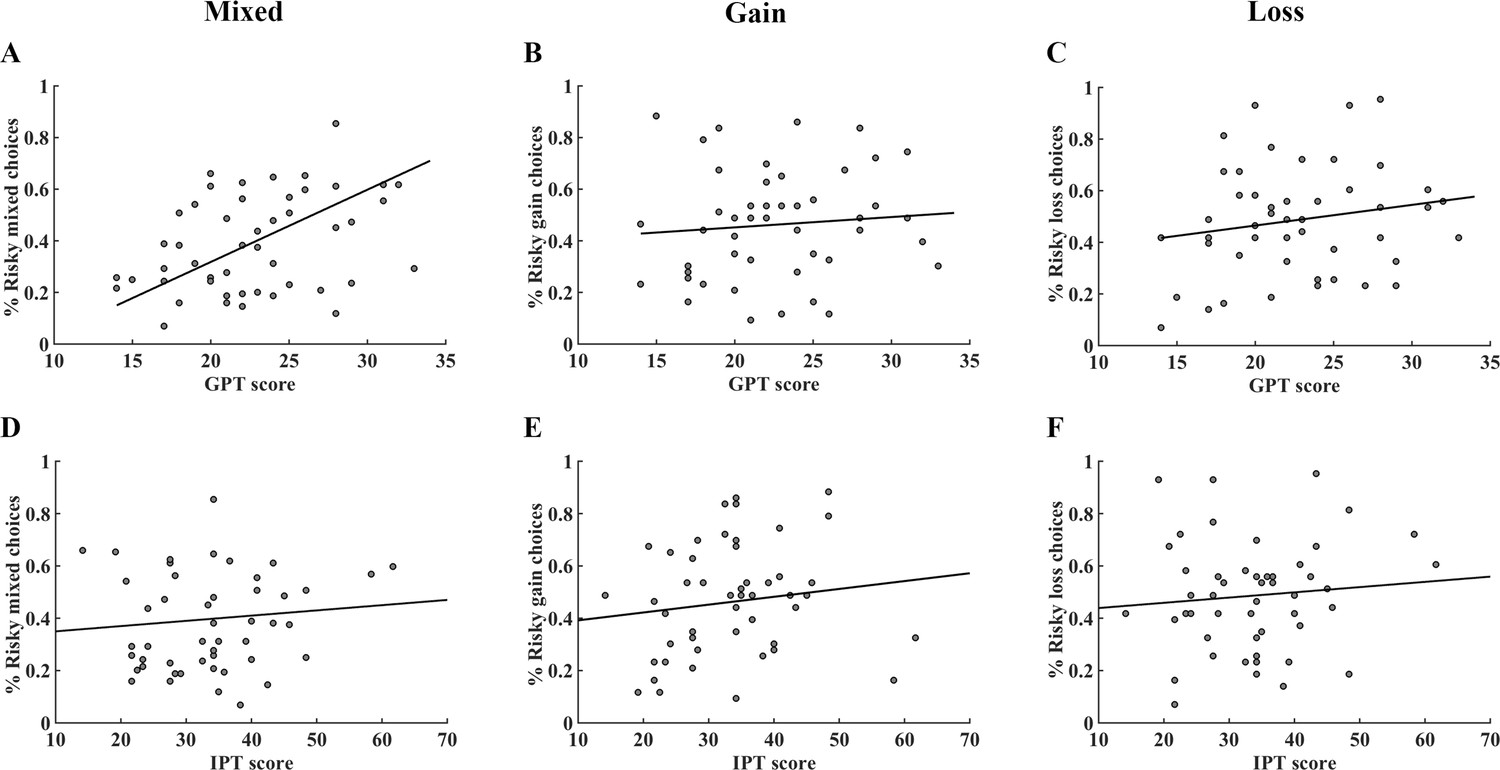
(A) There was a significant positive correlation between GPT and IPT scores (r = 0.543; p = 0.005). (B) – (D) The association between GPT score and the percentage of risky choices in mixed, gain, loss tasks, respectively. The GPT score was significantly correlated with the percentage of risky choices in (B) mixed trials (r = 0.440, p = 0.032), but not in (C) gain (r = 0.236, p = 0.267) nor (D) loss trials (r = −0.002, p = 0.992). GPT, greed personality trait; IPT, impulsivity personality trait.
Figure 2—figure supplement 1
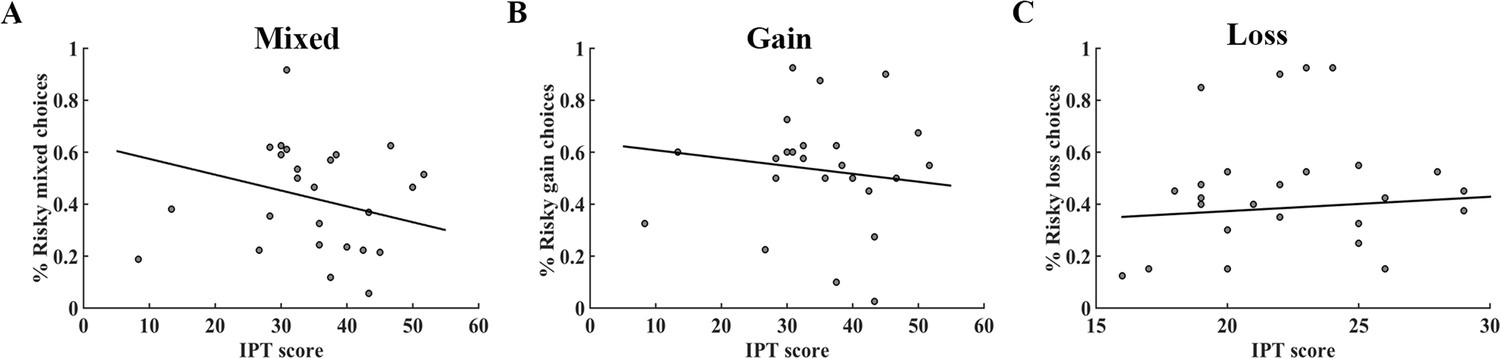
The relationship between IPT score and the percentage of risky choices in the fMRI dataset.
The IPT score was not correlated with the percentage of risky choices in the (A) mixed trials (r = −0.270, p = 0.202), (B) gain trials (r = −0.119, p = 0.580) nor (C) loss trials (r = 0.201, p = 0.347). The r and p values reported here were obtained after controlling for GPT scores as a covariate of no interest. GPT, greed personality trait; IPT, impulsivity personality trait.
Figure 2—figure supplement 2
In the behavioral replication task, the correlation between personality trait scores and the percentage of risky choices in different conditions.
The GPT score was significantly correlated with the percentage of risky choices in (A) mixed trials (r = 0.354, p = 0.013), but not in (B) gain (r = 0.098, p = 0.507) nor (C) loss trials (r = 0.180, p = 0.222). The IPT score was not correlated with the percentage of risky choices in the (D) mixed trials (r = 0.094, p = 0.524), (E) gain trials (r = 0.150, p = 0.310) nor (F) loss trials (r = 0.092, p = 0.532). The r and p values reported here were obtained after controlling for IPT (A, B and C) or GPT (D, E and F) scores as a covariate of no interest. GPT, greed personality trait; IPT, impulsivity personality trait.
Figure 3 with 4 supplements
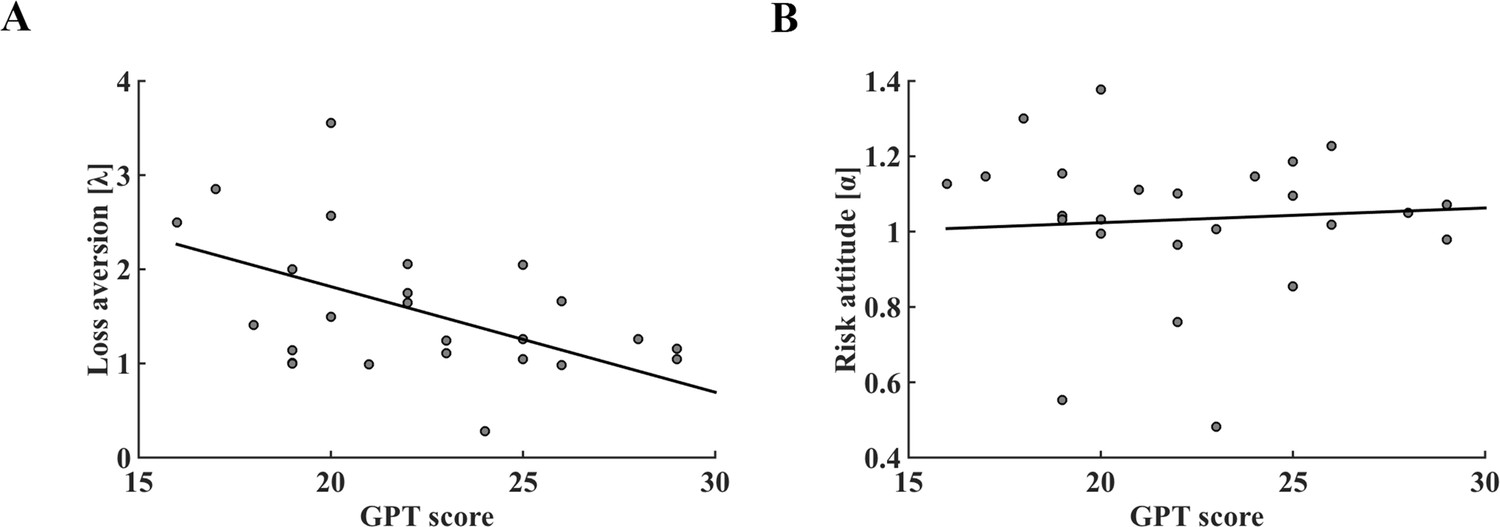
The relationship between GPT score and parameters of prospect theory decision-making model in the fMRI dataset.
(A) Individual GPT score was significantly associated with model derived loss aversion coefficient (r = −0.479, p = 0.018). (B) Correlation between GPT score and risk attitude was not significant (r = 0.062, p = 0.775). GPT, greed personality trait.
Figure 3—figure supplement 1
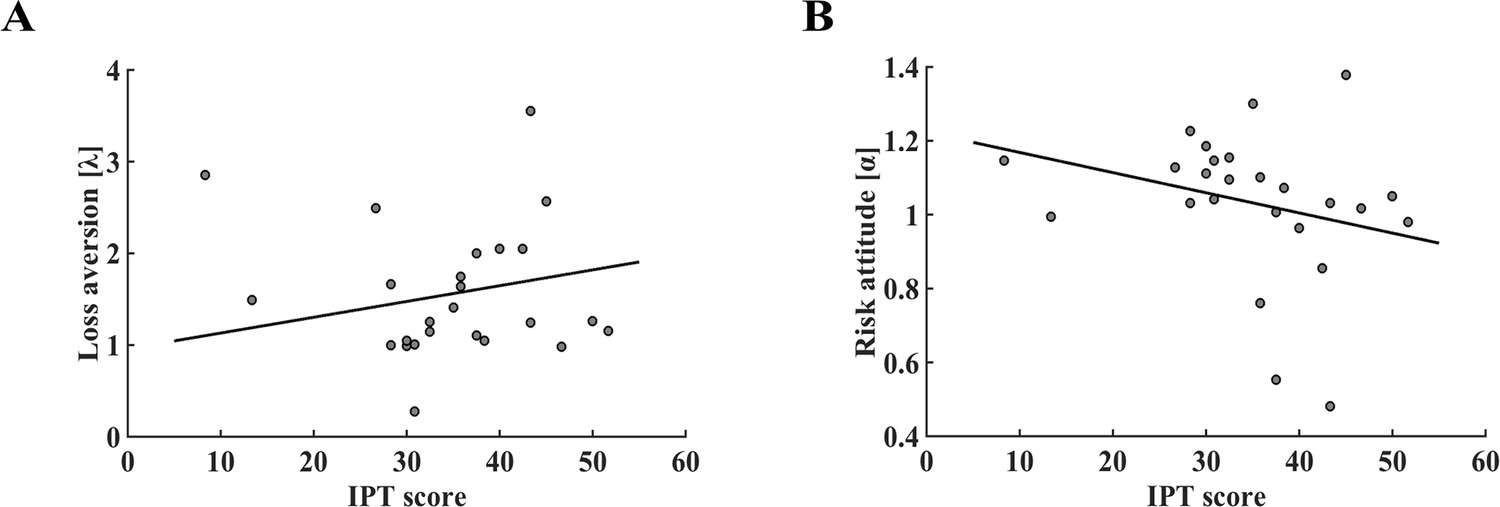
The relationship between IPT score and the parameters of decision-making model based on prospect theory in the fMRI dataset.
The IPT score was not correlated with loss aversion (A) r = 0.223, p = 0.294) nor risk attitude (B) r = −0.230, p = 0.280). The r and p values reported here were obtained after controlling for GPT scores as a covariate of no interest. GPT, greed personality trait; IPT, impulsivity personality trait.
Figure 3—figure supplement 2

Behavioral loss aversion mediated the effect of GPT on the percentage of risky choices (% risky choices) in the fMRI dataset.
Path a represented the effect of greed personality on behavioral loss aversion; path b represented the effect of behavioral loss aversion on the percentage of risky choices and path c’ represented the direct effect of greed personality on the percentage of risky choices when behavioral loss aversion was included as mediator. The 95% bootstrap confidence intervals of the indirect effect did not contain zero (a × b 95% CI [0.007 0.045]) while that of the direct effect did (c’ 95% CI [−0.014 0.008]), indicating full mediation. GPT, greed personality trait.
Figure 3—figure supplement 3
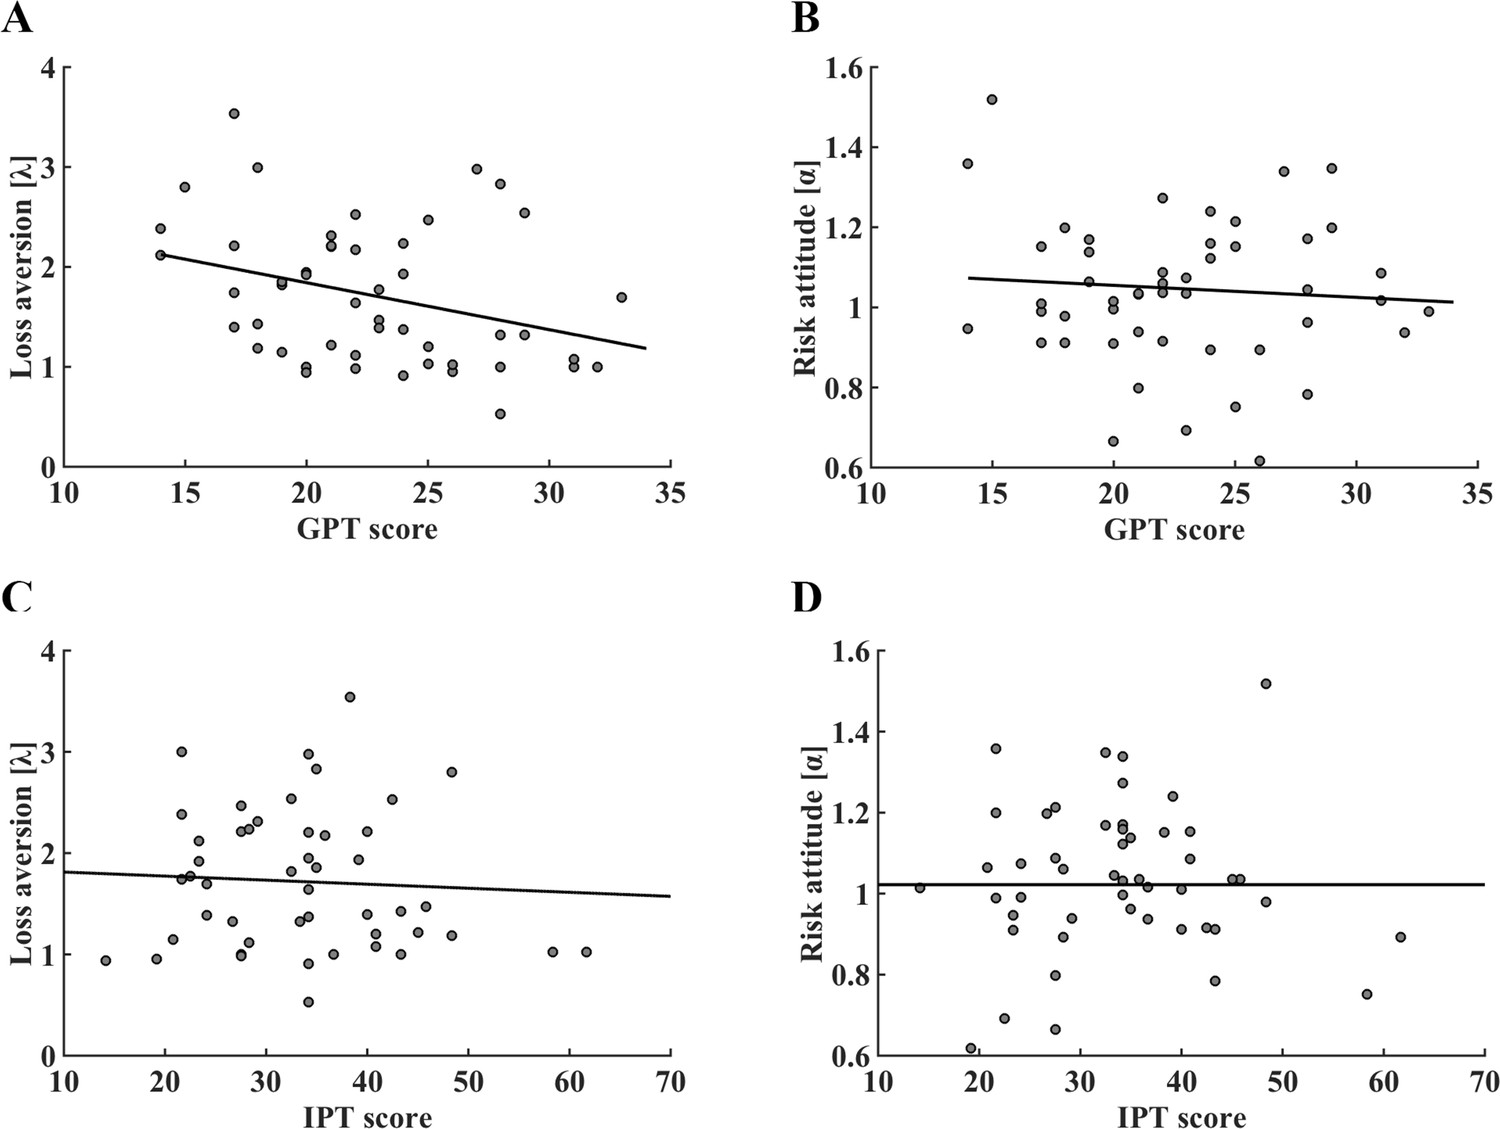
In the behavioral replication task, the relationship between personality trait scores and parameters of prospect theory decision-making model.
(A) Individual GPT score was significantly associated with model derived loss aversion coefficient (r = −0.325, p = 0.024). (B) Correlation between GPT score and risk attitude was not significant (r = −0.089, p = 0.547). The IPT score was not correlated with loss aversion (C) (r = −0.063, p = 0.669) nor risk attitude (D) (r = 0.025, p = 0.868). The r and p values reported here were obtained after controlling for IPT (A and B) or GPT (C and D) scores as a covariate of no interest. GPT, greed personality trait; IPT, impulsivity personality trait.
Figure 3—figure supplement 4

In the behavioral replication task, the loss aversion parameter fully mediated the relationship between GPT and the percentage of risky choices (% risky choices).
The 95% bootstrap confidence intervals of the indirect effect did not contain zero (a × b 95% CI [0.001 0.018]) while that of the direct effect did (c’ 95% CI [−0.002 0.006]), indicting full mediation. GPT, greed personality trait.
Figure 4 with 1 supplement
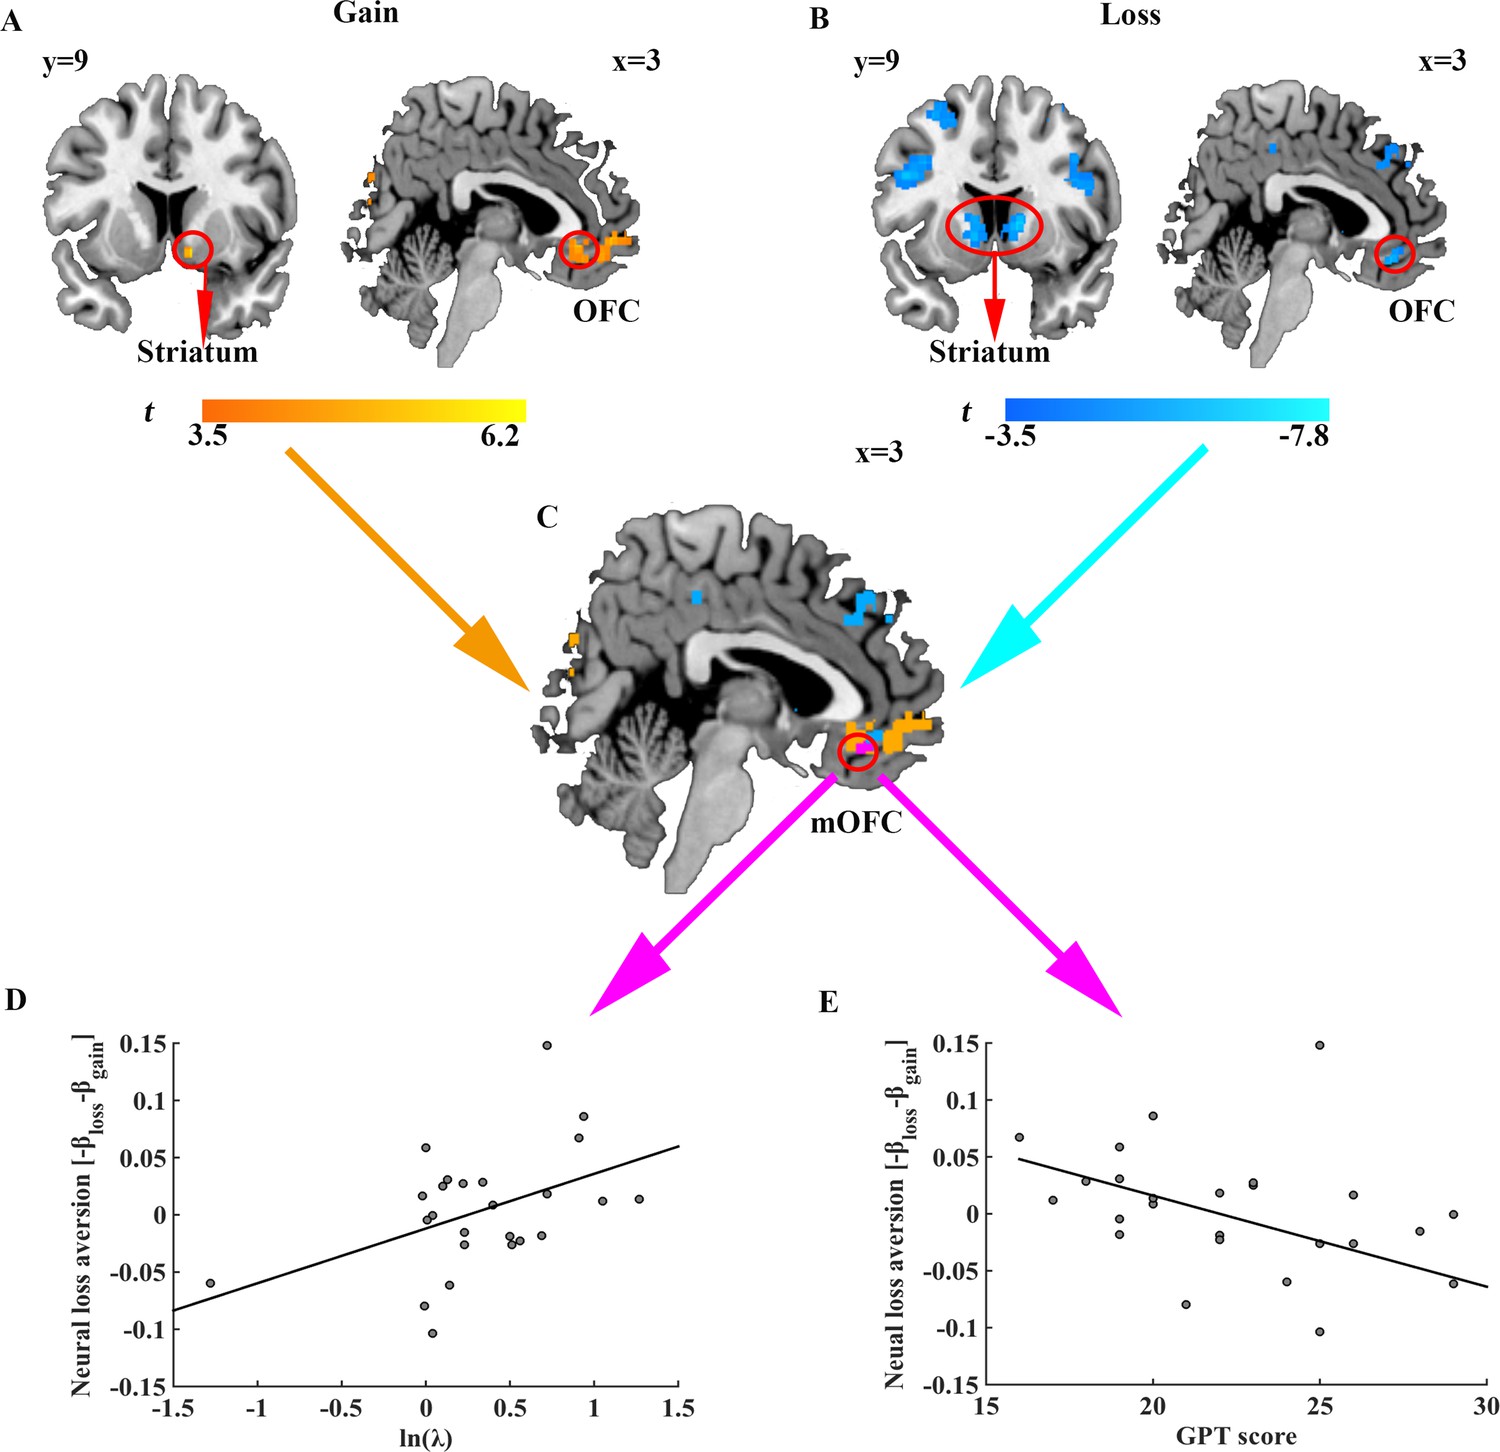
Neural representation of gain and loss prospects, behavioral loss aversion and GPT score.
Brain regions whose activities (A) positively correlated with gain prospects and (B) negatively correlated with loss prospects. Results are shown uncorrected (p<0.001, voxel size >20) for visualization purposes. (C) Brain areas encoding both gain and loss prospects (purple). (D) Scatter plot indicating significant correlation between behavioral loss aversion (ln (λ)) and neural loss aversion (-βloss - βgain) in the mOFC (r = 0.450, p = 0.024). (E) Scatter plot showing the significant correlation between GPT score and neural loss aversion (-βloss - βgain) in the mOFC (r = −0.449, p = 0.028).
Figure 4—figure supplement 1
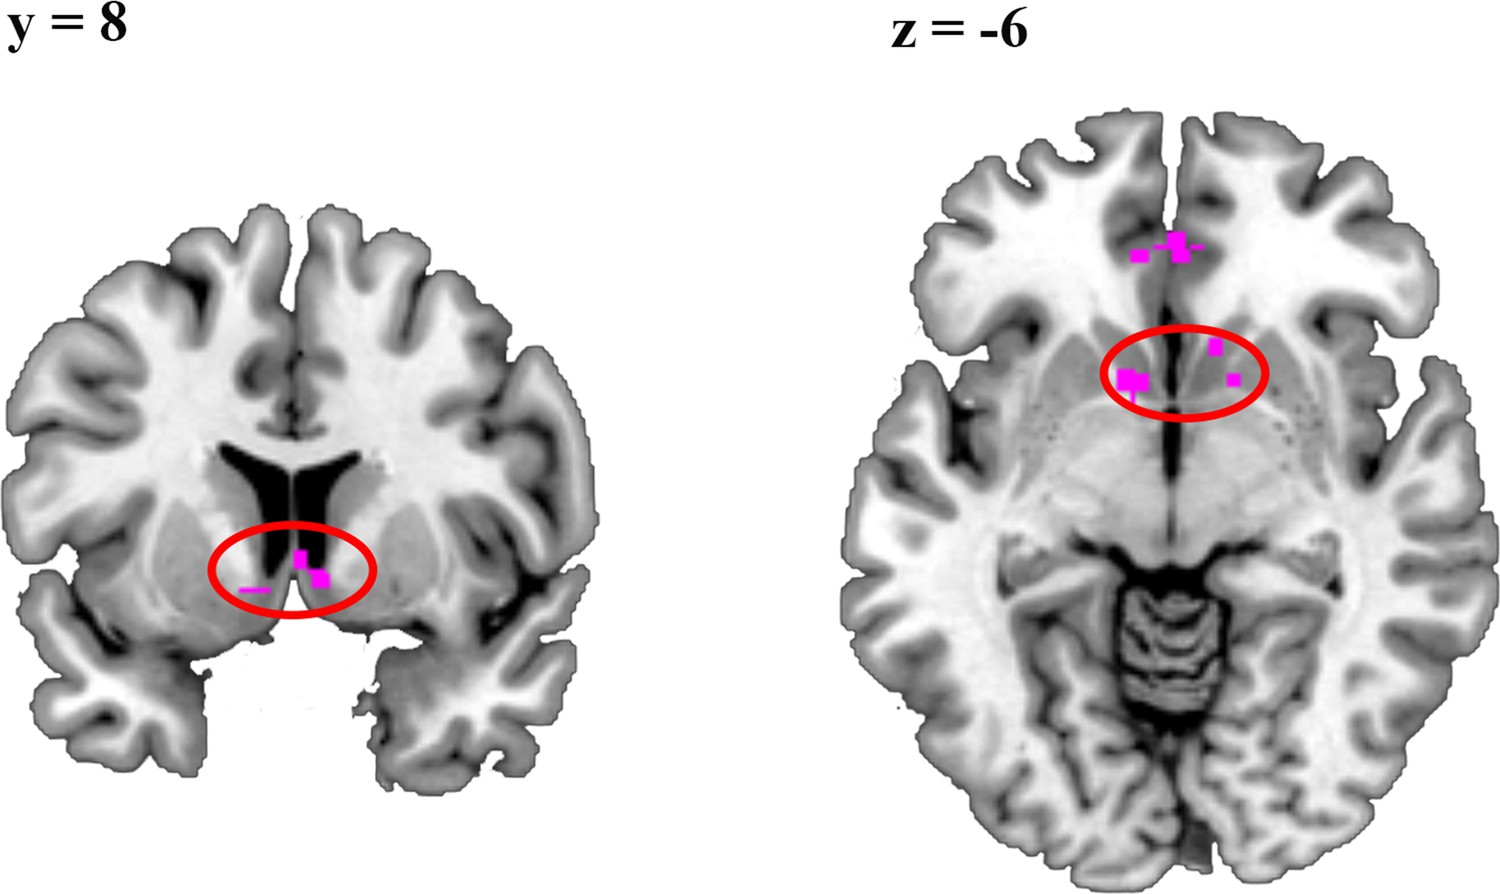
Ventral striatum (circled) activities also encoded gain and loss prospects, but with a more lenient threshold (z = 2.3, p < 0.05 FDR corrected).
https://doi.org/10.7554/eLife.45093.013
Figure 5

The mOFC neural loss aversion signal mediated the effect of GPT on behavioral loss aversion.
Path a represented effect of GPT score on mOFC activity; path b indicated effect of mOFC signal on behavioral loss aversion; path c’ represented the direct effect of greed personality on behavioral loss aversion when the mOFC activity was included as a mediator. The indirect effect (a × b) was significant with 95% bootstrap CI [−0.084 –0.001] and the direct effect (c’) did not reach significance (95% CI [−0.117 0.024]), indicating full mediation.
Author response image 1
Additional files
-
Supplementary file 1
Tables for statistical results and model parameters.
- https://doi.org/10.7554/eLife.45093.015
-
Supplementary file 2
The discriminant and convergent validities of Dispositional Greed Scale (DGS) in the datasets.
- https://doi.org/10.7554/eLife.45093.016
-
Supplementary file 3
Tables of brain activations correlating with potential gains and losses.
- https://doi.org/10.7554/eLife.45093.017
-
Transparent reporting form
- https://doi.org/10.7554/eLife.45093.018
Download links
A two-part list of links to download the article, or parts of the article, in various formats.
Downloads (link to download the article as PDF)
Open citations (links to open the citations from this article in various online reference manager services)
Cite this article (links to download the citations from this article in formats compatible with various reference manager tools)
Neural mediation of greed personality trait on economic risk-taking
eLife 8:e45093.
https://doi.org/10.7554/eLife.45093


