Glycolysis upregulation is neuroprotective as a compensatory mechanism in ALS
- University of Arizona, United States
- Barrow Neurological Institute, United States
- Université de Montpellier, MMDN U1198, CC105, France
Figures
Figure 1 with 1 supplement
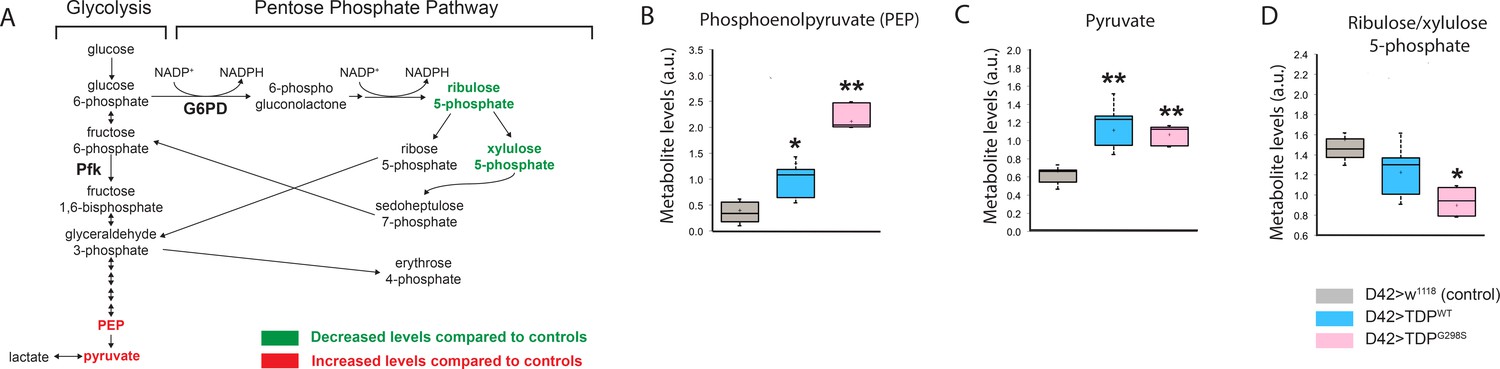
Glycolysis and pentose phosphate pathways are altered by TDP-43 expression in motor neurons.
(A) Metabolite changes in glycolysis for whole larvae expressing TDP-43WT or TDP-43G298S were analyzed using mass spectrometry (see Materials and methods). Green and red font represent metabolites that are significantly changed compared to controls (w1118), as indicated. PEP and pyruvate were upregulated in both TDP-43WT and TDP-43G298S expressing flies. Changes in the pentose phosphate pathway metabolites are specific to larvae expressing TDP-43G298S. (B, C, D) Significant changes in select metabolites shown as box and whisker plots. Whiskers represent maximum and minimum values. Box edges represent upper and lower quartiles. Median values are denoted by horizontal lines within each box. One-way ANOVA was used to identify metabolites that differed significantly between experimental groups (N = 5).
-
Figure 1—source data 1
Metabolic analysis.
- https://doi.org/10.7554/eLife.45114.005
Figure 1—figure supplement 1

Pyruvate measurements in whole larvae expressing RNAi knock-down constructs for the endogenous Drosophila TDP-43 (TBPH) with the D42 GAL driver show no significant changes compared to w1118 controls.
Pvalue = 0.092 (Student’s t test).
-
Figure 1—figure supplement 1—source data 1
Pyruvate assay.
- https://doi.org/10.7554/eLife.45114.004
Figure 2
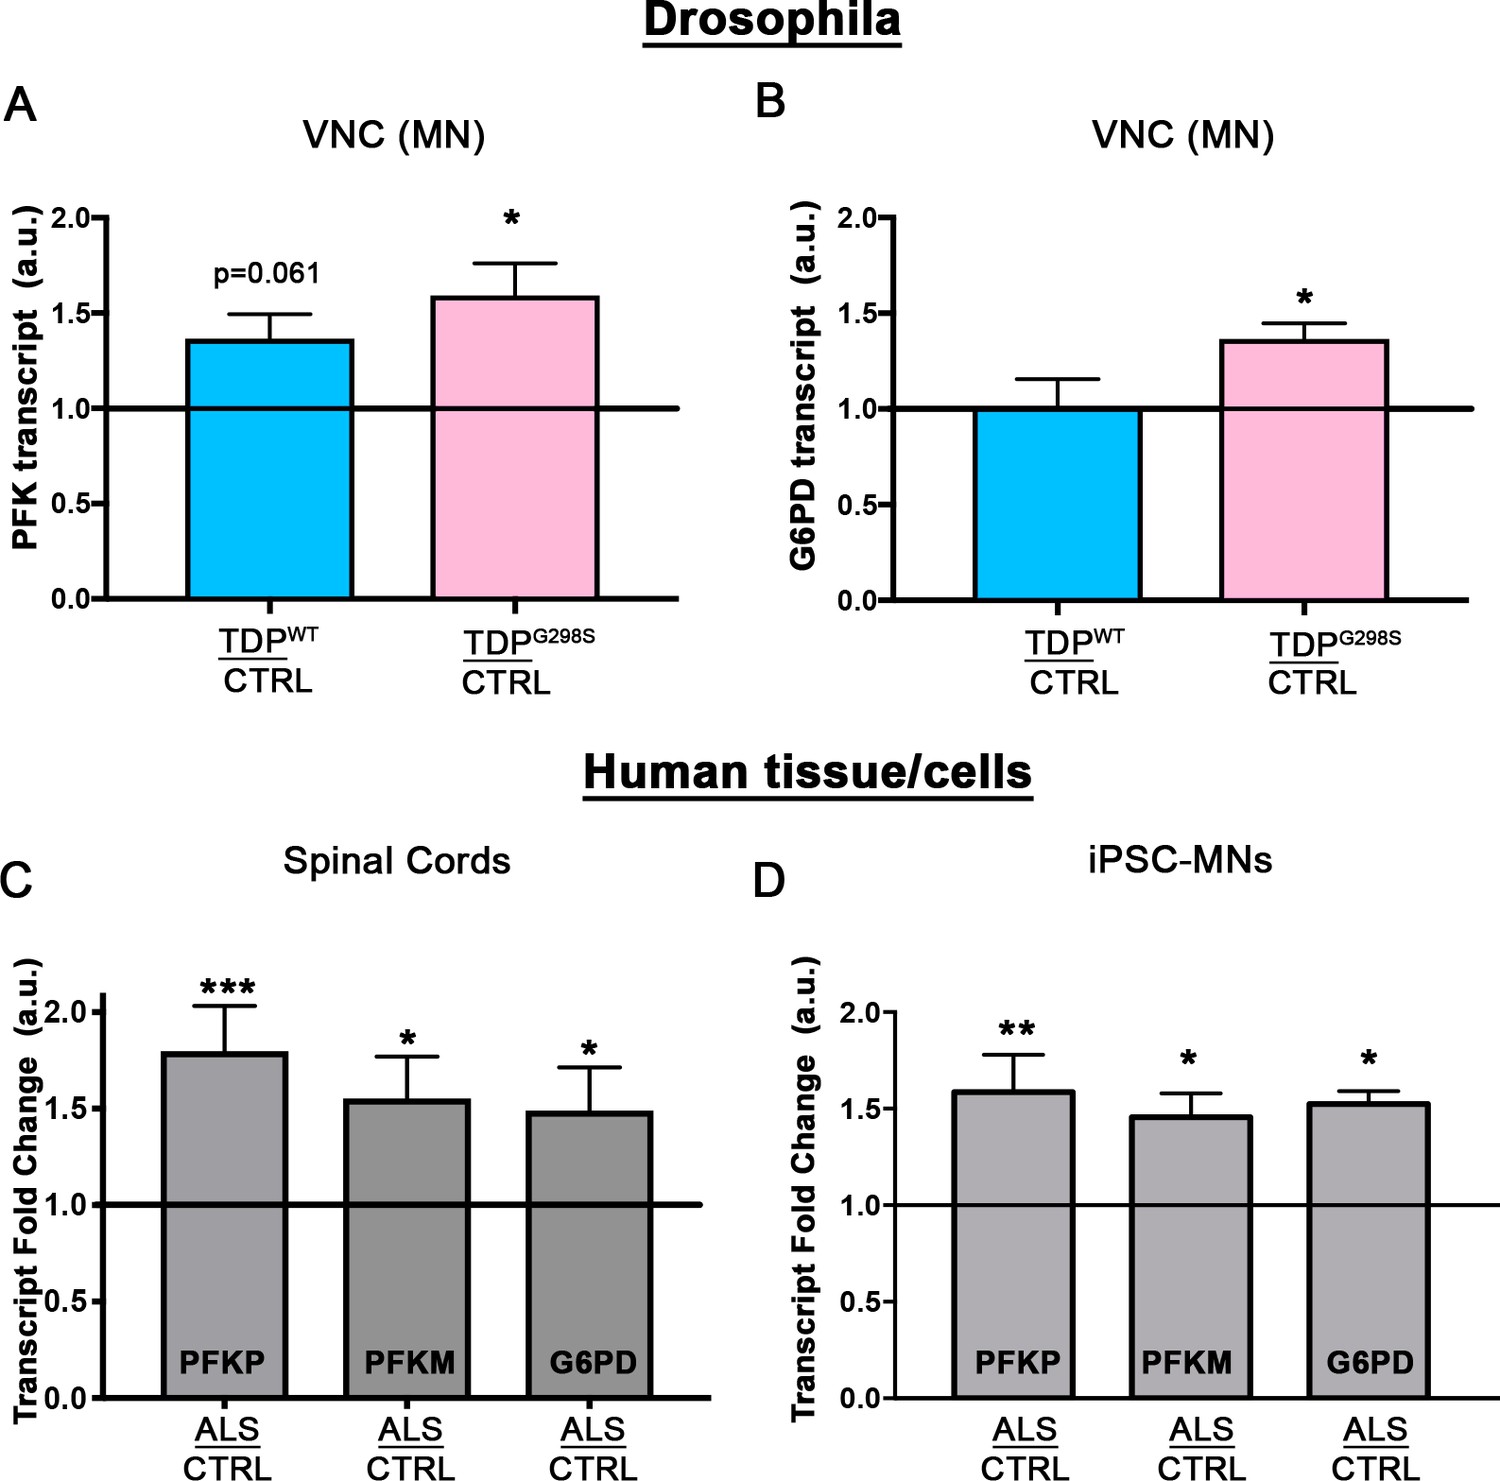
Glycolytic enzymes are transcriptionally upregulated.
qPCR profiling of PFK (A; N = 5) and G6PD (B; N = 5) from ventral nerve cords of Drosophila. Human PFKP, PFKM, or G6PD mRNA levels were profiled in either spinal cords (C; N = 8 control and 9 ALS cases) or human iPSCs (D; N = 3 differentiations). Kruskal-Wallis test was used to identify significance.
-
Figure 2—source data 1
Drosophila qPCR, ipsc neuron qPCR, and human spinal cord qPCR.
- https://doi.org/10.7554/eLife.45114.007
Figure 3 with 1 supplement
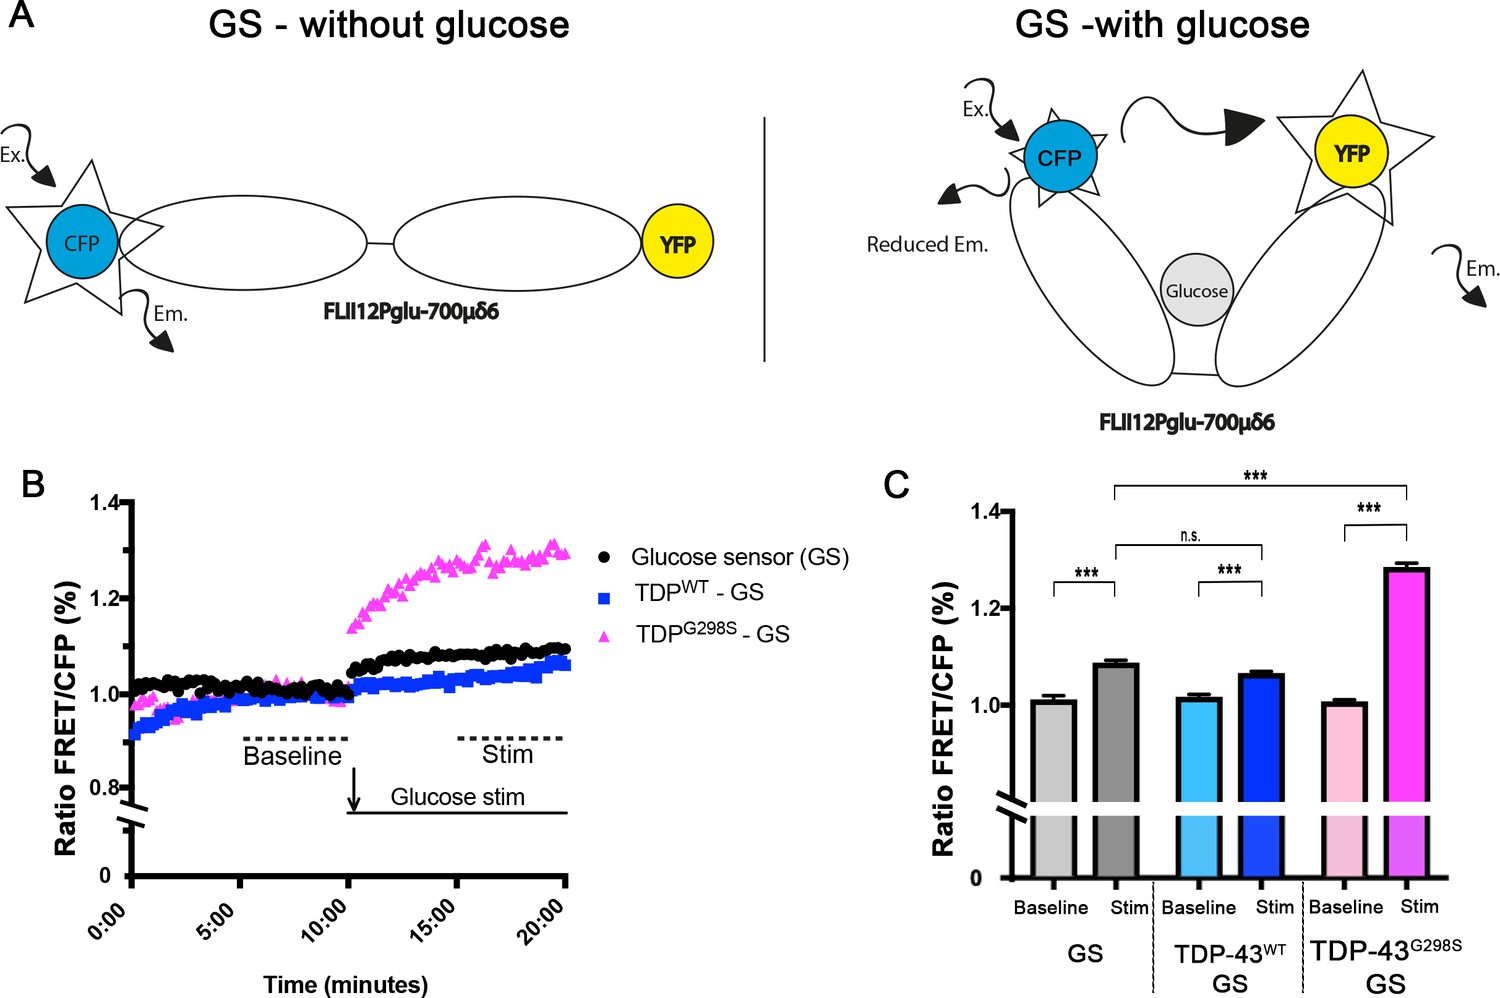
TDP expressing neurons have altered capacity to import glucose.
FRET based glucose sensor described in Volkenhoff et al. (2018) was used to measure the glucose import capacity. Glucose sensor schematic described in (A). Ex – Excitation; Em – Emission. (B, C) TDP-43 expressing neurons and controls were imaged to detect CFP and FRET signal. 12–14 neurons were imaged every 10 s for 20 min. Values shown are the mean of 12–14 individual cells (ROI) from two ventral nerve cords (B). Mean values for 5–10 min and 15–20 min time intervals were used to calculate the ‘baseline’ and ‘stimulated’ (‘Stim’) values respectively (C). Kruskal-Wallis test was used to calculate significance.
-
Figure 3—source data 1
Glucose sensor data.
- https://doi.org/10.7554/eLife.45114.010
Figure 3—figure supplement 1
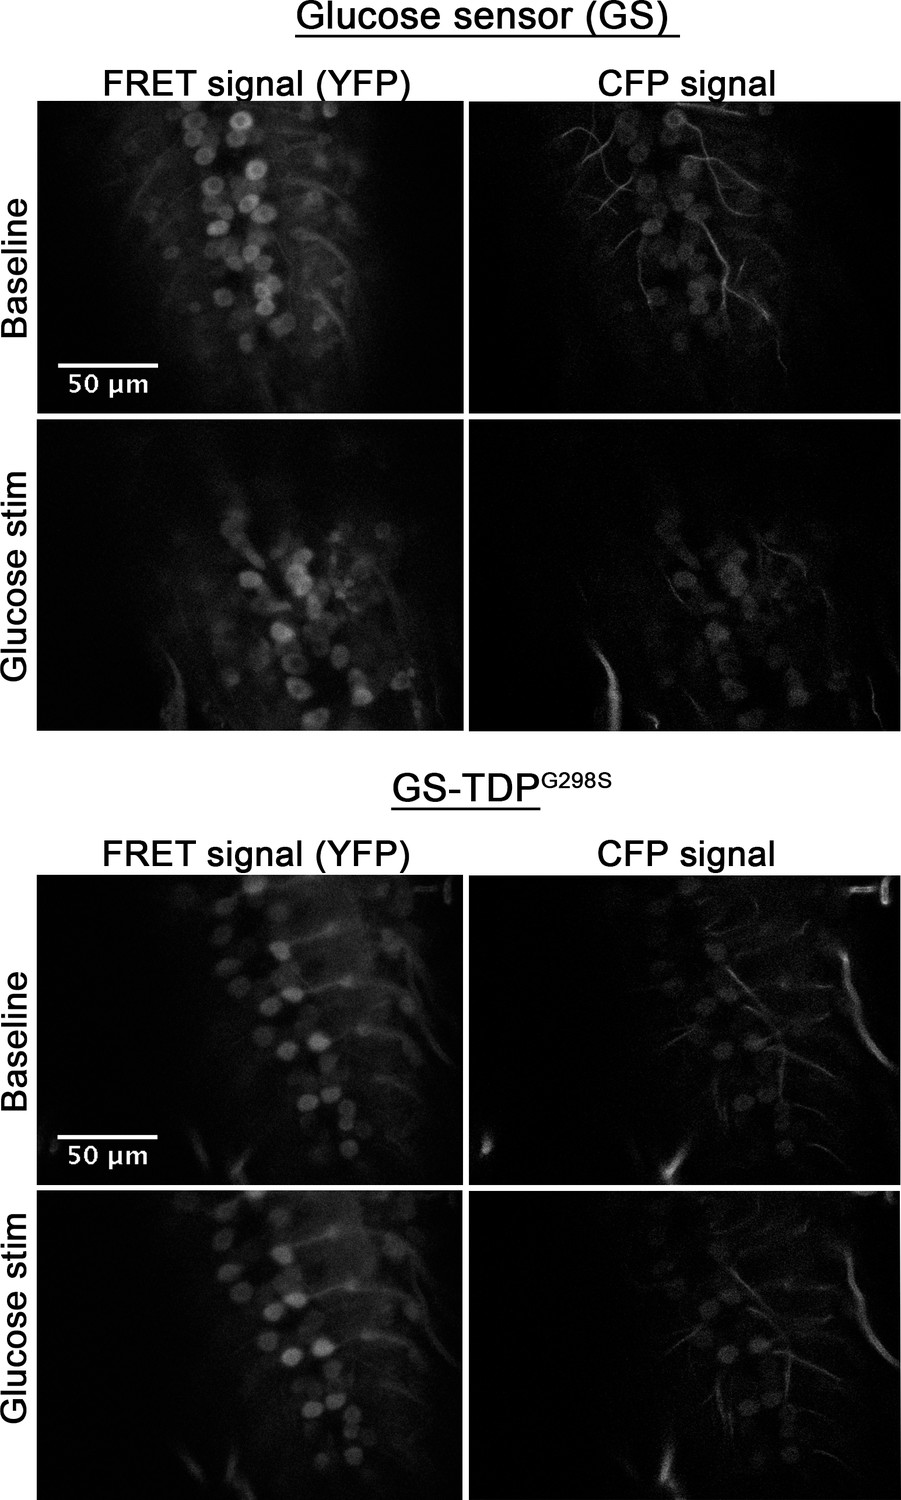
Raw images of glucose sensor (A) or glucose sensor in the context of TDP-43G298S (B).
Sections shown are taken through the ventral nerve cord 7.5 min post mounting (baseline) and 7.5 min post stimulation (Glucose stim), as indicated. See Materials and methods for details on imaging and analyses. Scale bar as shown.
Figure 4 with 5 supplements
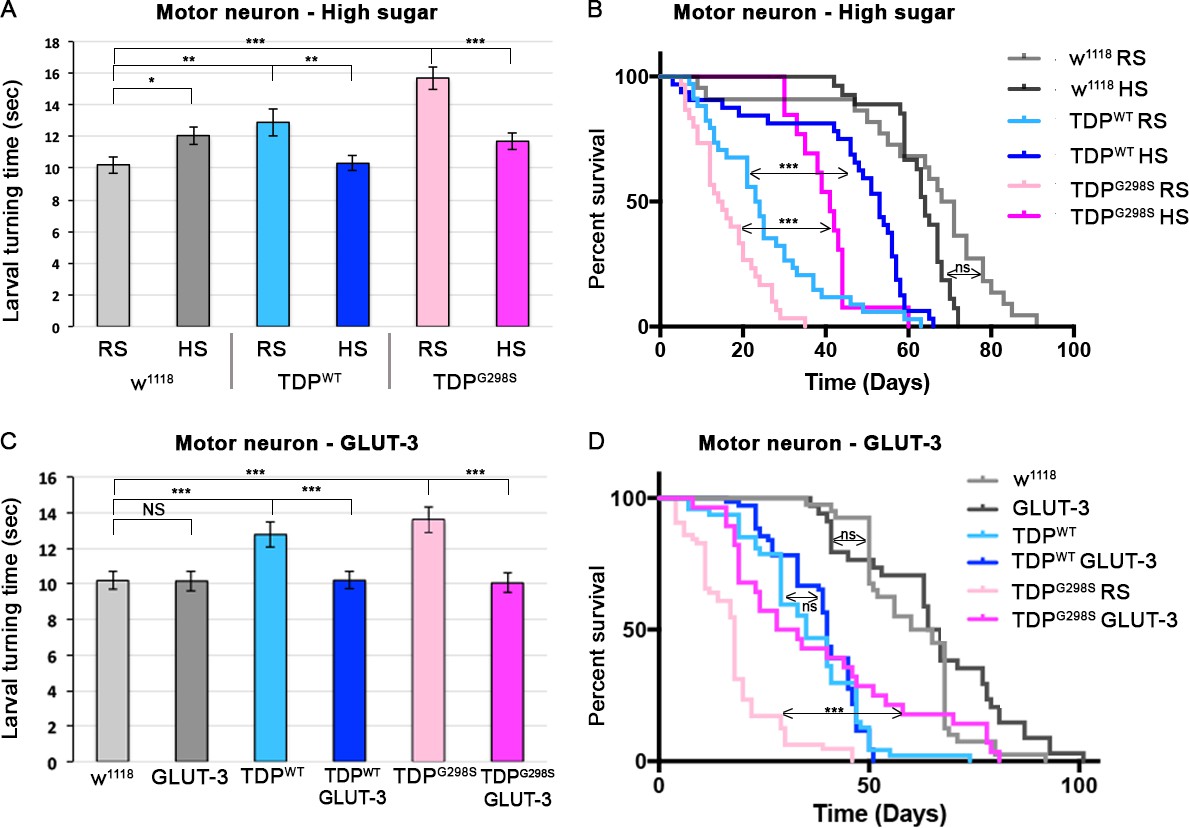
A high glucose diet rescues neuronal TDP-43 toxicity in flies.
TDP-43WT or ALS associated TDP-43G298S were expressed in MNs (using GAL4-UAS). (A, B) Larval turning and lifespan assays for Drosophila fed a cornmeal based food containing either regular concentration of sugar (RS) or a high sugar diet (HS:10x the standard amount of sugar). (C, D) Larval turning and lifespan assays for Drosophila expressing GLUT-3 on its own or with TDP-43, as indicated. At least 30 larvae were tested in larval turning assays and on average 20 adults were assayed for survival. Kruskal-Wallis test and Log-rank (Mantel-Cox) test was used to determine statistical significance for larval turning and survival curve respectively. * - p<0.05, ** - p<0.01, *** - p<0.001.
-
Figure 4—source data 1
D4210x, 5x, 2x, 1x, 0x Glucose Larval Turning D42 AO; GLUT 3LT; GLUT3 survival; and HS survival.
- https://doi.org/10.7554/eLife.45114.021
Figure 4—figure supplement 1
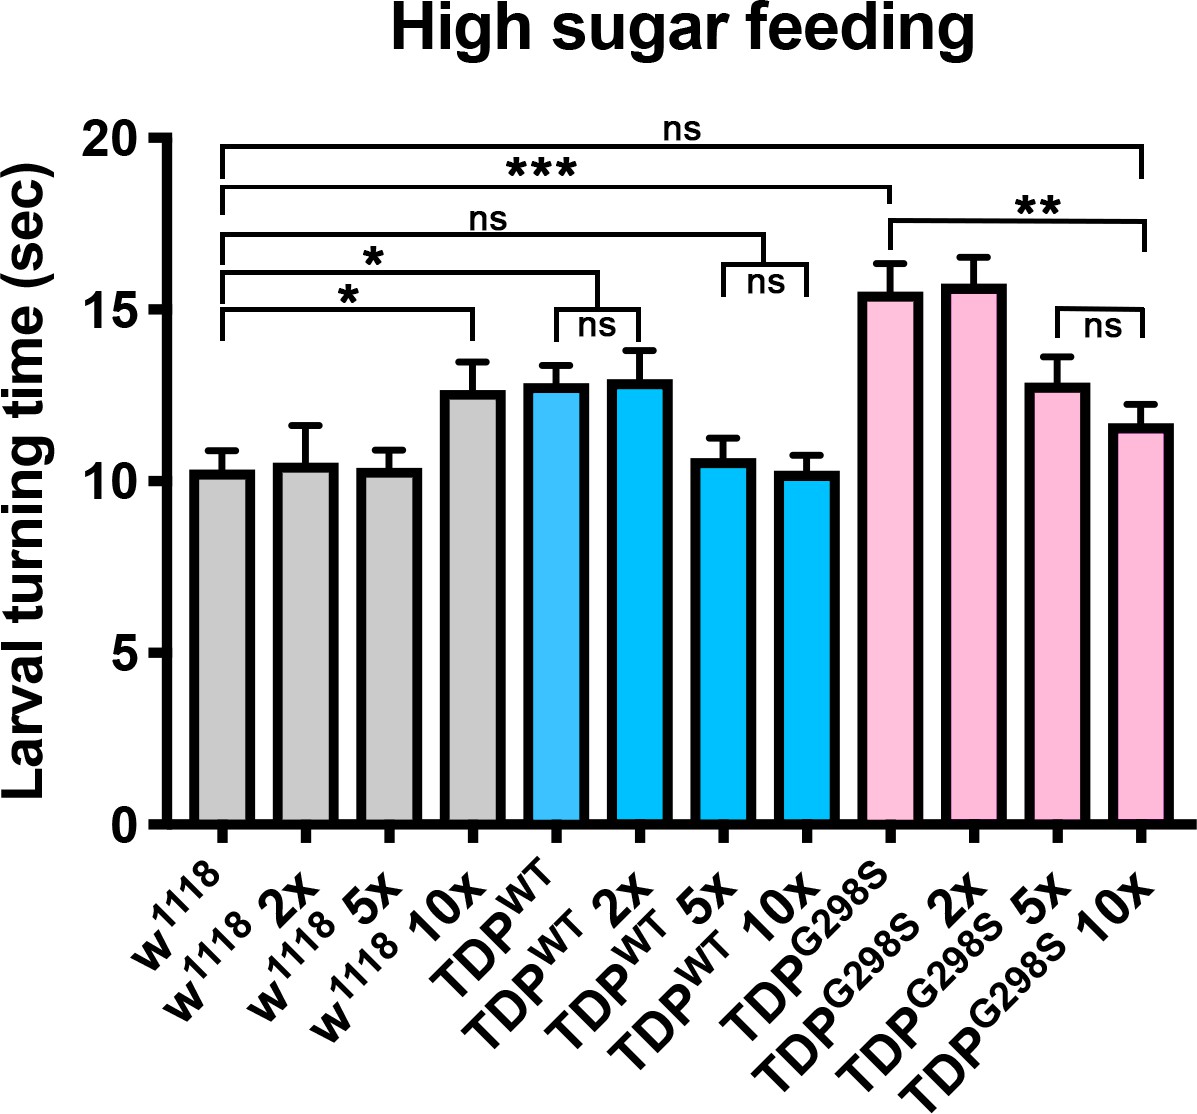
Larval turning assays on regular cornmeal-molasses food supplemented with various amounts of glucose (2X, 5X or 10X, as shown).
Genotypes as indicated. N = 30 larvae. Kruskal-Wallis test was used to determine statistical significance.
-
Figure 4—figure supplement 1—source data 1
Glucose Larval Turning.
- https://doi.org/10.7554/eLife.45114.013
Figure 4—figure supplement 2

A high sugar diet or GLUT-3 overexpression are partially protective when TDP-43 is expressed in glia but not in muscles.
(i, ii) Larval turning assays (i) and lifespan assays (ii) on a high sugar diet (HS) compared to a regular sugar diet (RF). Genotypes as indicated. (iii and iv) Larval turning assays (iii) and lifespan assays (iv) for GLUT-3 overexpression alone or in conjunction with TDP-43. Genotypes as indicated. (v and vi) Larval turning assays on HS versus RF (v) or in the context of GLUT-3 and TDP-43 overexpression in muscles (vi). Kruskal-Wallis test was used for larval turning assays and Log-rank or Mantel-Cox tests were used for lifespan assays to determine significance.
-
Figure 4—figure supplement 2—source data 1
(i) Glia HS LT; (ii) Glia HS SC; (iii) Glia Glut3 LT; (iv) GLUT3 Glia SC; (v) Muscle HS LT; (vi) Muscle Glut3 LT.
- https://doi.org/10.7554/eLife.45114.015
Figure 4—figure supplement 3

Negative geotaxis assay on adult flies expressing TDP-43WT or TDP-43G298S alone or in conjunction with GLUT-3.
The percent of flies that reach the top of the column are shown after 60 s. Gene expression was specifically targeted in all neurons by using the elav GAL4 driver. Statistical comparisons were performed using one-way ANOVA followed by Tukey’s multiple-comparison test.
Figure 4—figure supplement 4

GLUT-4 overexpression mitigates locomotor defects when TDP-43 is expressed in motor neurons or glia but not muscles.
(i) Western blot of ventral nerve cords probing for TDP-43-YFP and β-actin. D42 motor neuron driver was used to express TDP-43 in motor neurons. (ii) Quantification of 3 western blot bioreplicates. Protein levels measured by GFP western blot (to detect TDP-YFP) are shown as a ratio between GLUT-3-TDPWT-YFP to TDPWT-YFP alone and GLUT-3-TDPG298S-YFP to TDPG298S-YFP alone.
-
Figure 4—figure supplement 4—source data 1
Western Blot Quantifications.
- https://doi.org/10.7554/eLife.45114.018
Figure 4—figure supplement 5
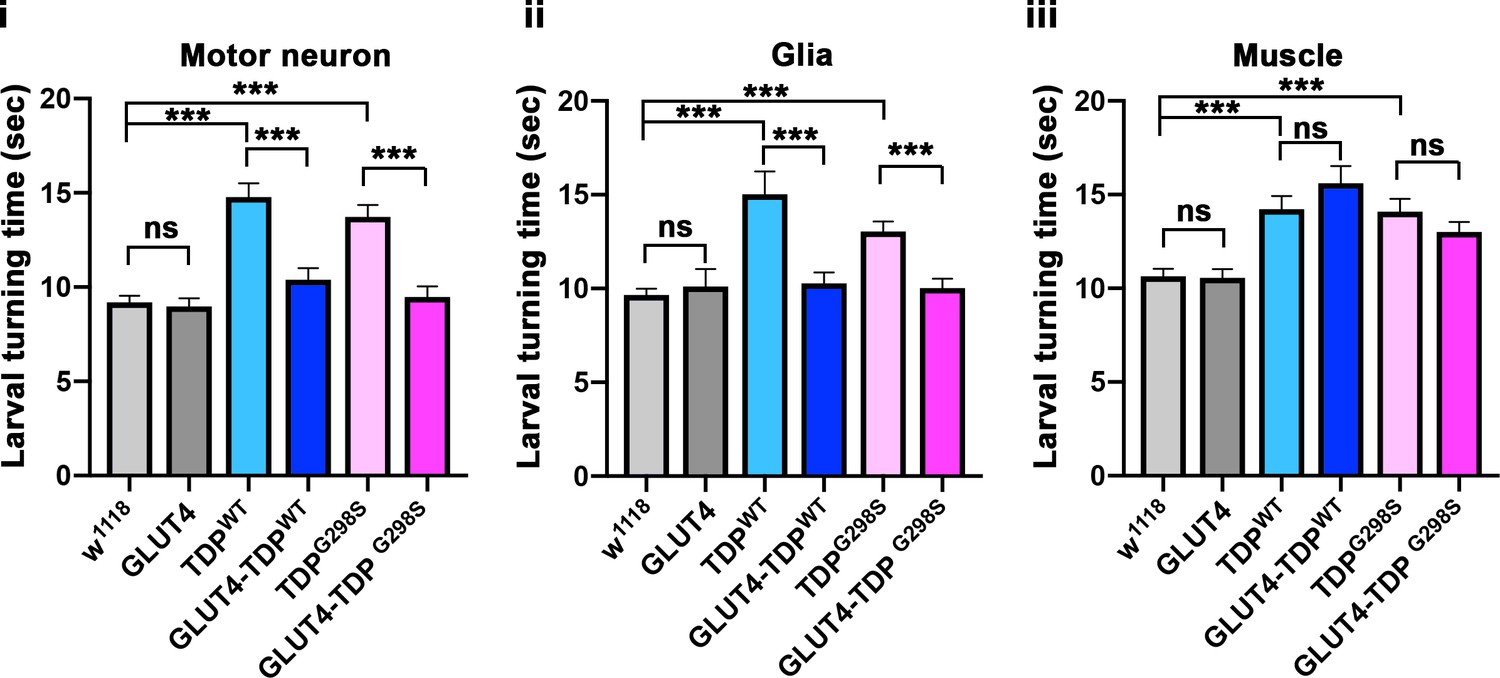
Larval turning assays for GLUT-4 and TDP-43 overexpression in motor neurons (i), glia (ii) or muscles (iii).
Genotypes as indicated. N = 30 larvae. Kruskal-Wallis test was used to determine statistical significance.
-
Figure 4—figure supplement 5—source data 1
GLUT 4 Glia LT; GLUT4 MN LT; and GLUT4 Muscle LT.
- https://doi.org/10.7554/eLife.45114.020
Figure 5
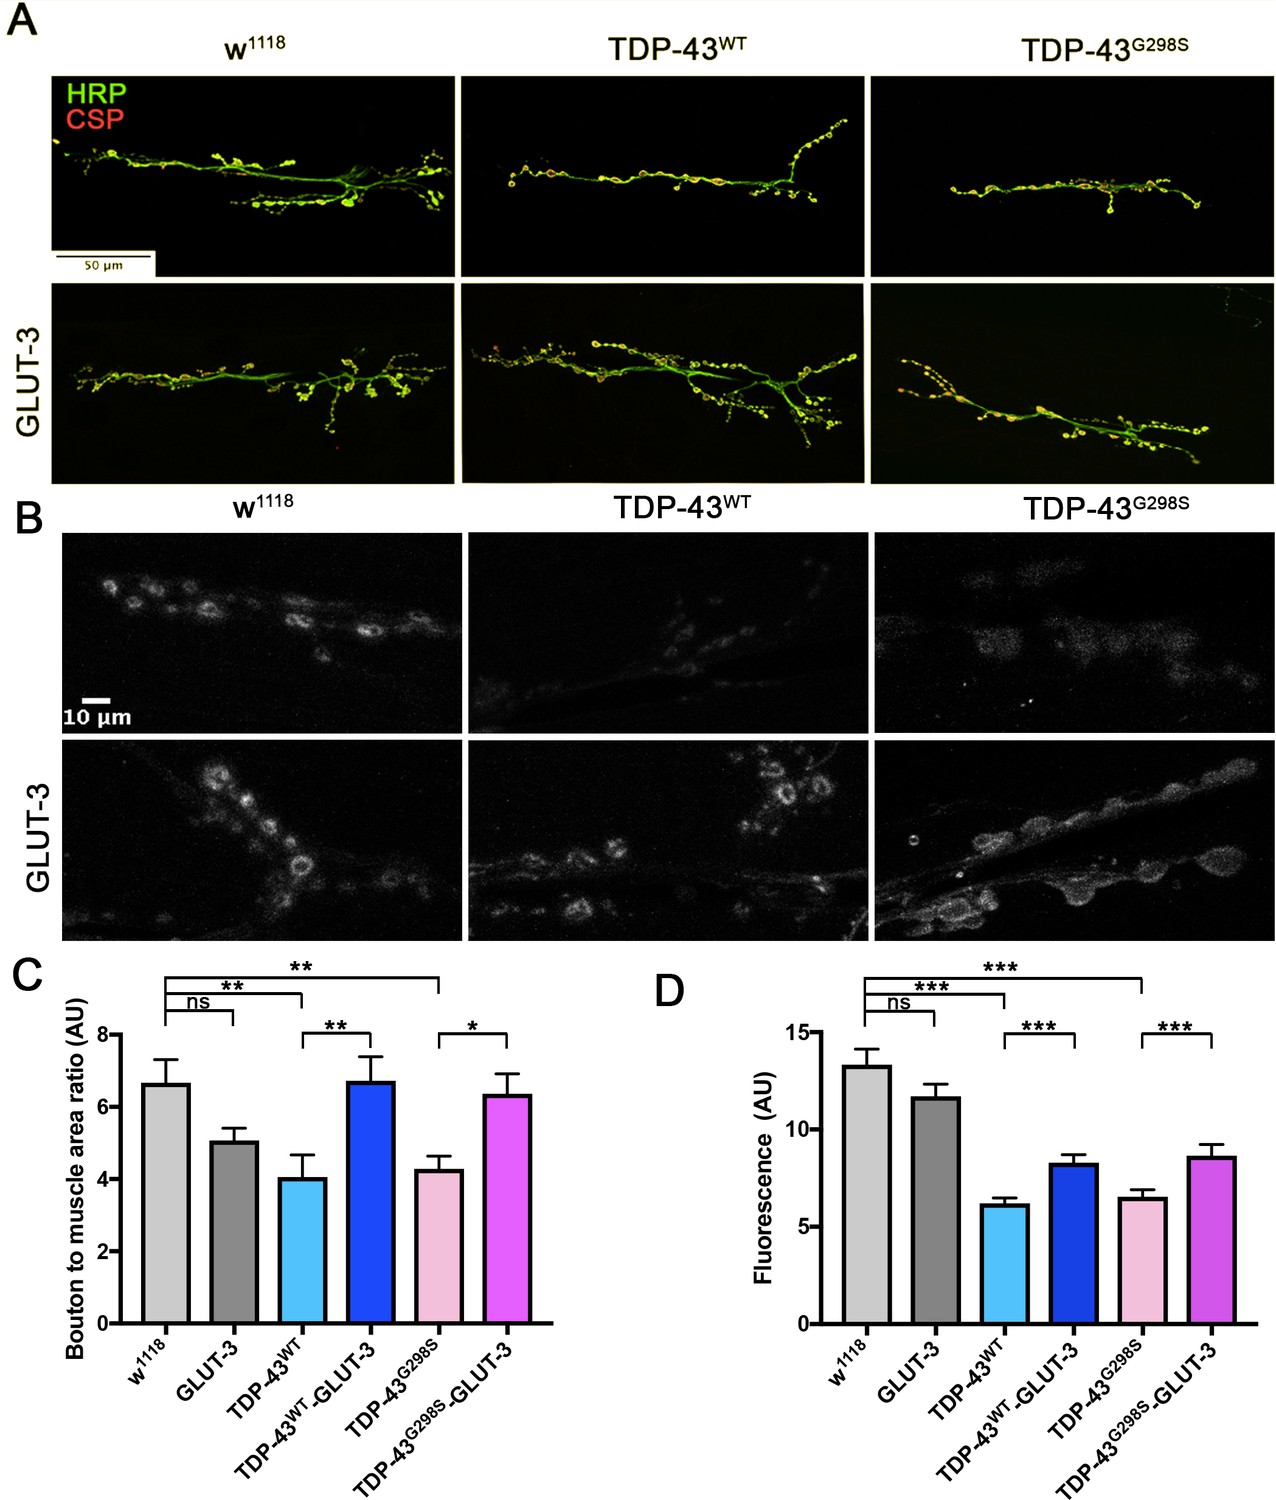
TDP-43 dependent defects at the NMJ are rescued by GLUT-3.
Third instar larvae NMJ from segment A3, muscle 6/7 were immunostained for CSP and HRP (A) or analyzed for their ability to endocytose FM1-43 dye upon stimulation with 90 mM KCl (B). (A, C) Neuronal TDP-43 expression in Drosophila neurons reduces the number of boutons (labeled with CSP and HRP (A, C) and reduces FM1-43 dye uptake (B, D). These morphological (A, C) and functional (B, D) deficits are rescued by co-expression of GLUT-3. N = 7–10 larvae. Kruskal-Wallis test was used to identify significance.
-
Figure 5—source data 1
Bouton count analysis and FM1-43 GLUT-3 analysis.
- https://doi.org/10.7554/eLife.45114.023
Figure 6 with 1 supplement
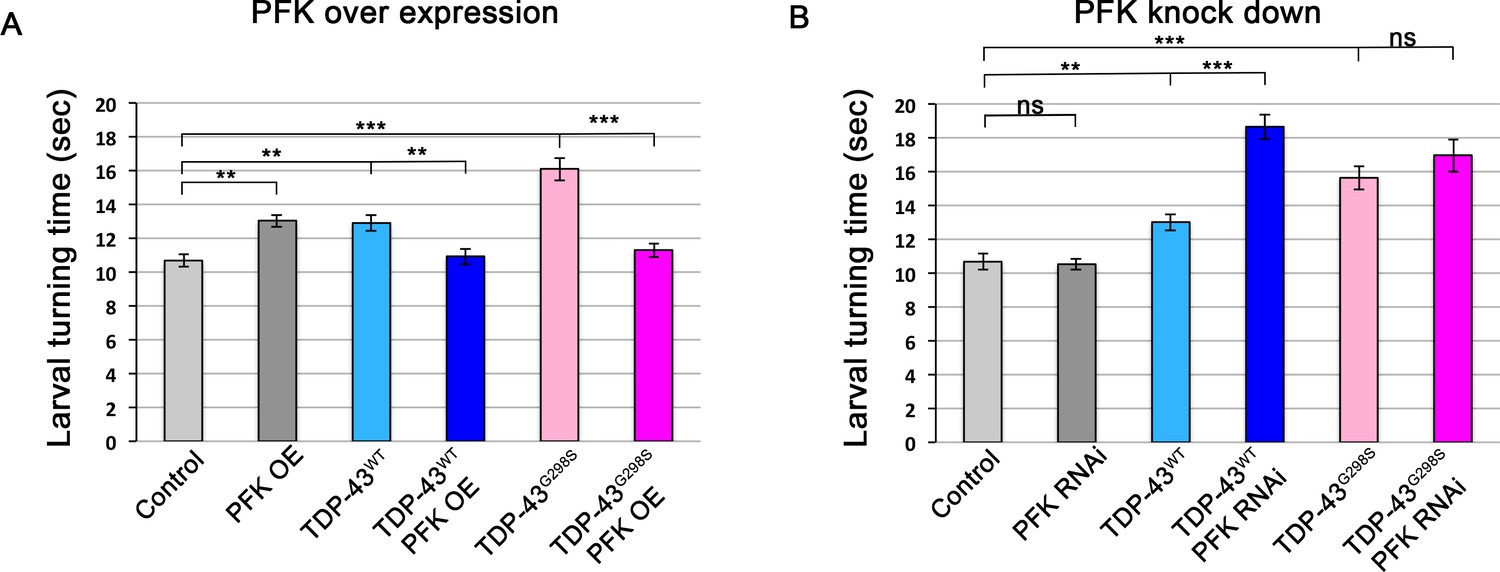
Co-overexpression of PFK rescues TDP-43 induced locomotor defects.
(A) TDP-43WT or ALS associated TDP-43G298S were expressed in MNs (using the GAL4-UAS system together with Drosophila UAS-PFK). (B) TDP-43WT or ALS associated TDP-43G298S were expressed in MNs (using the GAL4-UAS system together with Drosophila UAS-PFKRNAi). N = 30 larvae. Kruskal-Wallis was used to determine statistical significance. * - P value < 0.05, ** - P value < 0.01, *** - P value < 0.001.
-
Figure 6—source data 1
PFK D42 LT.
- https://doi.org/10.7554/eLife.45114.027
Figure 6—figure supplement 1
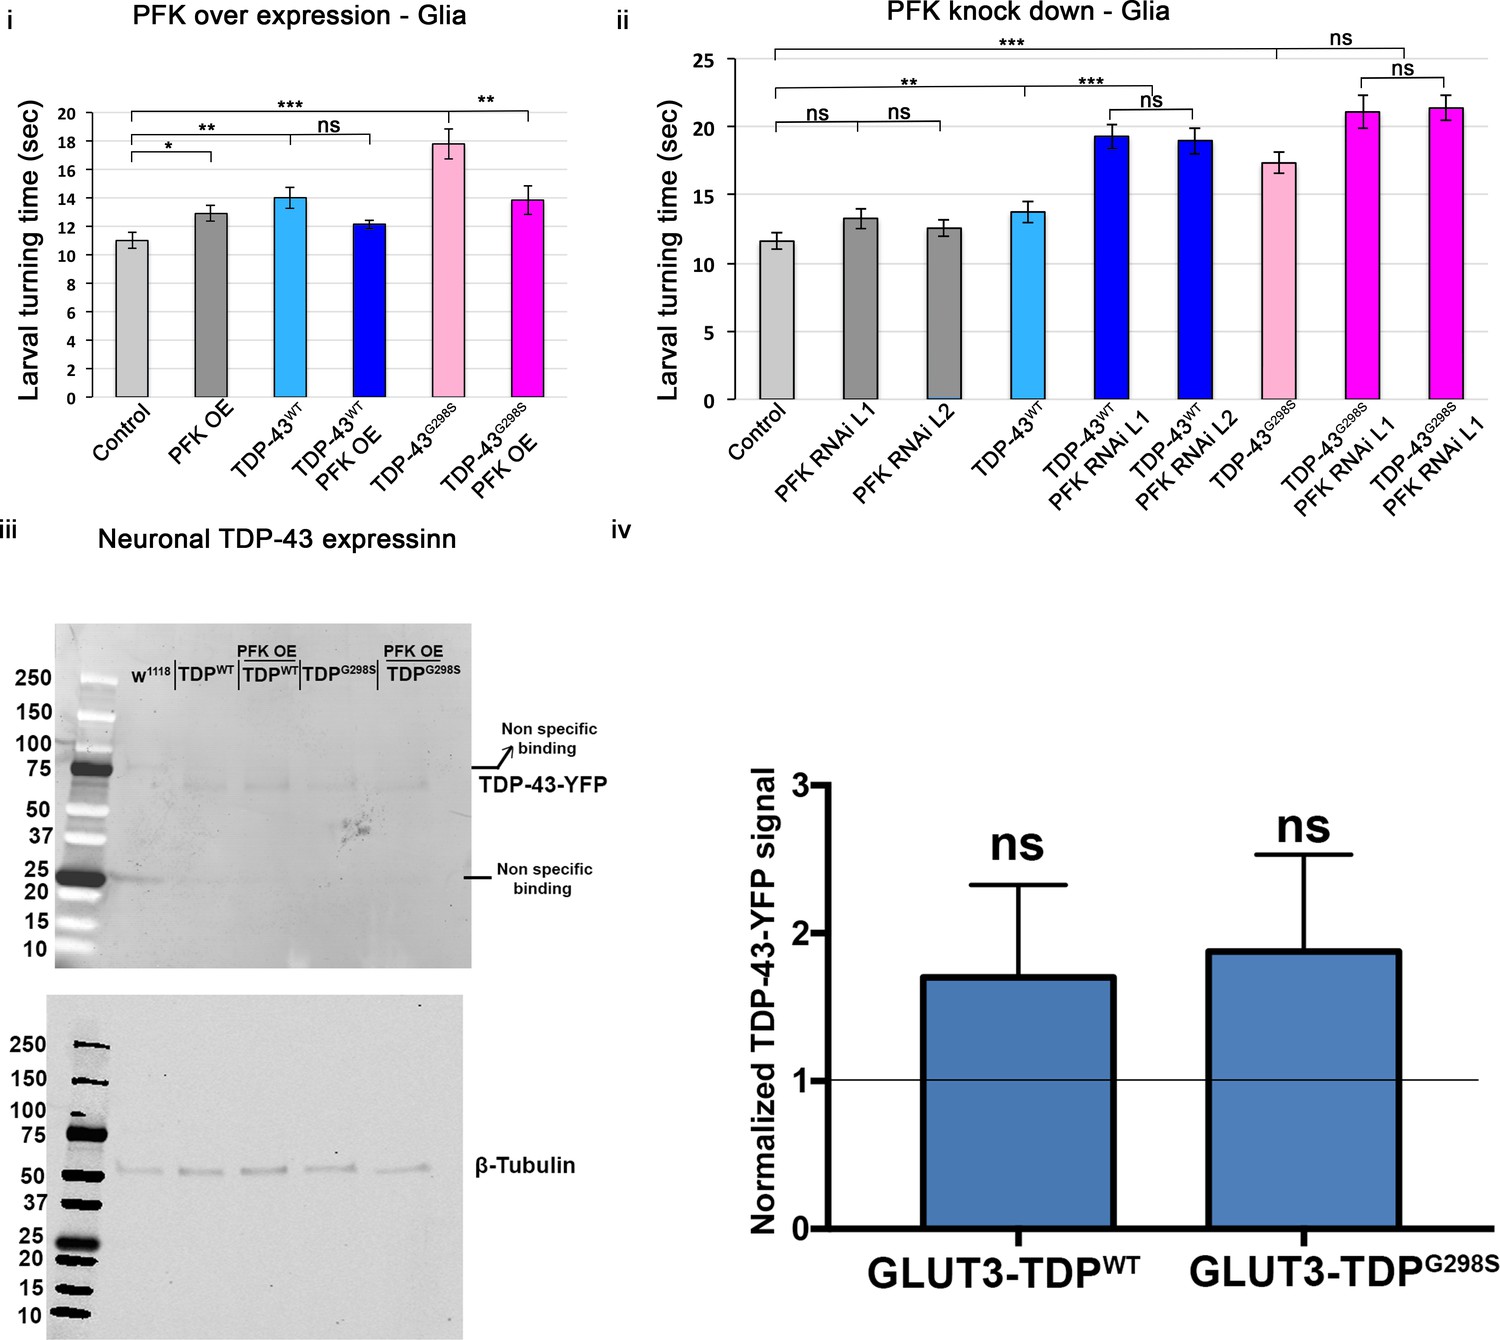
Larval turning assays for PFK overexpression (i) or RNAi (ii) in the context of TDP-43 in glia.
Genotypes as indicated. N = 30 larvae. Kruskal-Wallis test was used to determine statistical significance. (iii) Western blot of ventral nerve cords probing for TDP-43-YFP and tubulin. D42 motor neuron driver was used to express TDP-43 in motor neurons. ii. Quantification of 3 western blot bioreplicates. Protein levels measured by GFP western blot (to detect TDP-YFP) are shown as a ratio between PFK OE - TDPWT-YFP to TDPWT-YFP alone and PFK OE - TDPG298S-YFP to TDPG298S-YFP alone.
-
Figure 6—figure supplement 1—source data 1
PFK Glia.
- https://doi.org/10.7554/eLife.45114.026
Figure 7 with 1 supplement
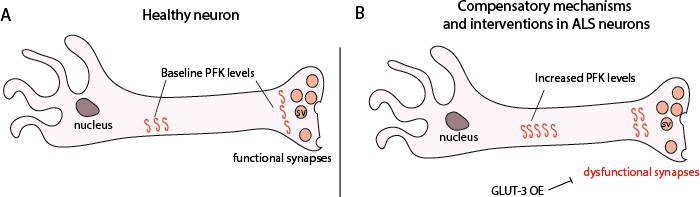
Proposed model showing PFK transcript levels increase in response to TDP-43 proteinopathy.
(A) Neurons from non-diseased patients. (B) ALS neurons showing an increase in PFK transcript levels. SV – synaptic vesicle.
Figure 7—figure supplement 1

Cellular fractionations from third instar larvae.
TDPWT (A) or TDPG298S (B) were fractionated (see supplemental materials and methods above) and PFK transcript levels in the urea fraction were quantified and normalized to controls (w1118). Wilcoxon ranked sum test was used to perform statistics.
-
Figure 7—figure supplement 1—source data 1
Soluble fractionations.
- https://doi.org/10.7554/eLife.45114.030
Tables
Key resources table
| Reagent type (species) or resource | Designation | Source or reference | Identifiers | Additional information |
|---|---|---|---|---|
| Genetic reagent (D. melanogaster) | w1118;UAS;TDPWT- YFP | doi: 10.1242/dmm.010710 | TDPWT | Stock maintained by the Zarnescu Laboratory |
| Genetic reagent (D. melanogaster) | w1118;UAS-TDPG298S- YFP | doi: 10.1242/dmm.010710 | TDPG298S | Stock maintained by the Zarnescu Laboratory |
| Genetic reagent (D. melanogaster) | w1118;UAS-GLUT-3 | doi: 10.1371/journal.pone.0118765 | GLUT-3 | Stock maintained by the Liévens Laboratory |
| Genetic reagent (D. melanogaster) | UAS-HA-GLUT-4-GFP | doi: 10.1371/journal.pone.0077953 | GLUT-4 | Stock maintained by the Pick Laboratory |
| Genetic reagent (D. melanogaster) | UAS-FLII12Pglu- 700µδ6 | doi: 10.1016/j.jinsphys.2017.07.010 | Glucose Sensor | Stock maintained by the Schirmeier Laboratory |
| Genetic reagent (D. melanogaster) | Motor neuron - D42- GAL4 Driver | Bloomington | FBst0008816 | |
| Genetic reagent (D. melanogaster) | Repo- Glial GAL4 driver | Bloomington | FBti0018692 | |
| Genetic reagent (D. melanogaster) | Bg487 - Muscle driver | Bloomington | FBti0004407 | |
| Genetic reagent (D. melanogaster) | TBPH RNAi | Bloomington | FBst0039014 | |
| Genetic reagent (D. melanogaster) | TBPH RNAi | Bloomington | FBti0128633 | |
| Genetic reagent (D. melanogaster) | PFK over expression | Bloomington | FBst0060675 | |
| genetic reagent (D. melanogaster) | PFK RNAi | Bloomington | FBst0034336 | |
| genetic reagent (D. melanogaster) | PFK RNAi | Bloomington | FBst0036782 | Used as second RNAi line for glial expression |
| Antibody | DCSP-2 | DSHB | 6D6 | 1/300 |
| Antibody | Alexa Fluor 488 Phalloidin | ThermoFisher | A12379 | 1/200 |
| Antibody | Alexa Fluor 568 | Invitrogen | A10037 | 1/500 |
| Antibody | Anti-HRP -CY5 | Jackson Labs | 123-165-021 | 1/200 |
| Antibody | GFP Monoclonal | Takara | 6326375 | 1/20000 |
| Antibody | GFP Polyclonal | ThermoFisher | A-11122 | 1/1000 |
| Antibody | β-Actin | Cell Signaling | 4967 | 1/1000 |
| Antibody | β-Tubulin | Millipore Sigma | Mab3408 | 1/1000 |
| Commercial assay or kit | Pyruvate Assay Kit | abcam | ab65342 | |
| Chemical compound | FM 1–43 Dye | ThermoFisher | T3163 | 4 μM |
| Other | Primer: Human Phosphofructokinase P (PFKP) | ThermoFisher | Assay ID Hs00242993_m1 | |
| Other | Primer: Human Phosphofructokinase M (PFKM) | ThermoFisher | Assay ID Hs00175997_m1 | |
| Other | Primer: Human G6PD | ThermoFisher | Assay ID Hs00166169_m1 | |
| Other | Primer: Human GAPDH | ThermoFisher | Assay ID Hs99999905_m1 |
Additional files
-
Supplementary file 1
Summary of carbohydrate metabolites in TDP-43WT and TDP-43G298S compared to w1118 controls.
Altered metabolites in third instar larvae crossed with the motor neuron driver D42 GAL4 were measured using gas or liquid chromatography followed by mass spectrometry. Red and green colored cells indicate statistically significant changes (Pvalue <0.05) that are increased and decreased, respectively. Light red and light green colored cells indicate upward or downward trends, respectively (Pvalue <0.1).
- https://doi.org/10.7554/eLife.45114.031
-
Supplementary file 2
Summary of demographic information for patient samples used to quantify PFKP, PFKM and G6PD.
- https://doi.org/10.7554/eLife.45114.032
-
Supplementary file 3
Summary of iPSC MNs used to quantify PFKP, PFKM and G6PD.
Patient cell lines used for qPCR analysis are shown.
- https://doi.org/10.7554/eLife.45114.033
-
Transparent reporting form
- https://doi.org/10.7554/eLife.45114.034
Download links
A two-part list of links to download the article, or parts of the article, in various formats.
Downloads (link to download the article as PDF)
Open citations (links to open the citations from this article in various online reference manager services)
Cite this article (links to download the citations from this article in formats compatible with various reference manager tools)
Glycolysis upregulation is neuroprotective as a compensatory mechanism in ALS
eLife 8:e45114.
https://doi.org/10.7554/eLife.45114


