Replication Study: Biomechanical remodeling of the microenvironment by stromal caveolin-1 favors tumor invasion and metastasis
- Department of Microbiology and Immunology, United States
- MIA Cellavie Inc, Canada
- Harvard Medical School, United States
Figures
Figure 1
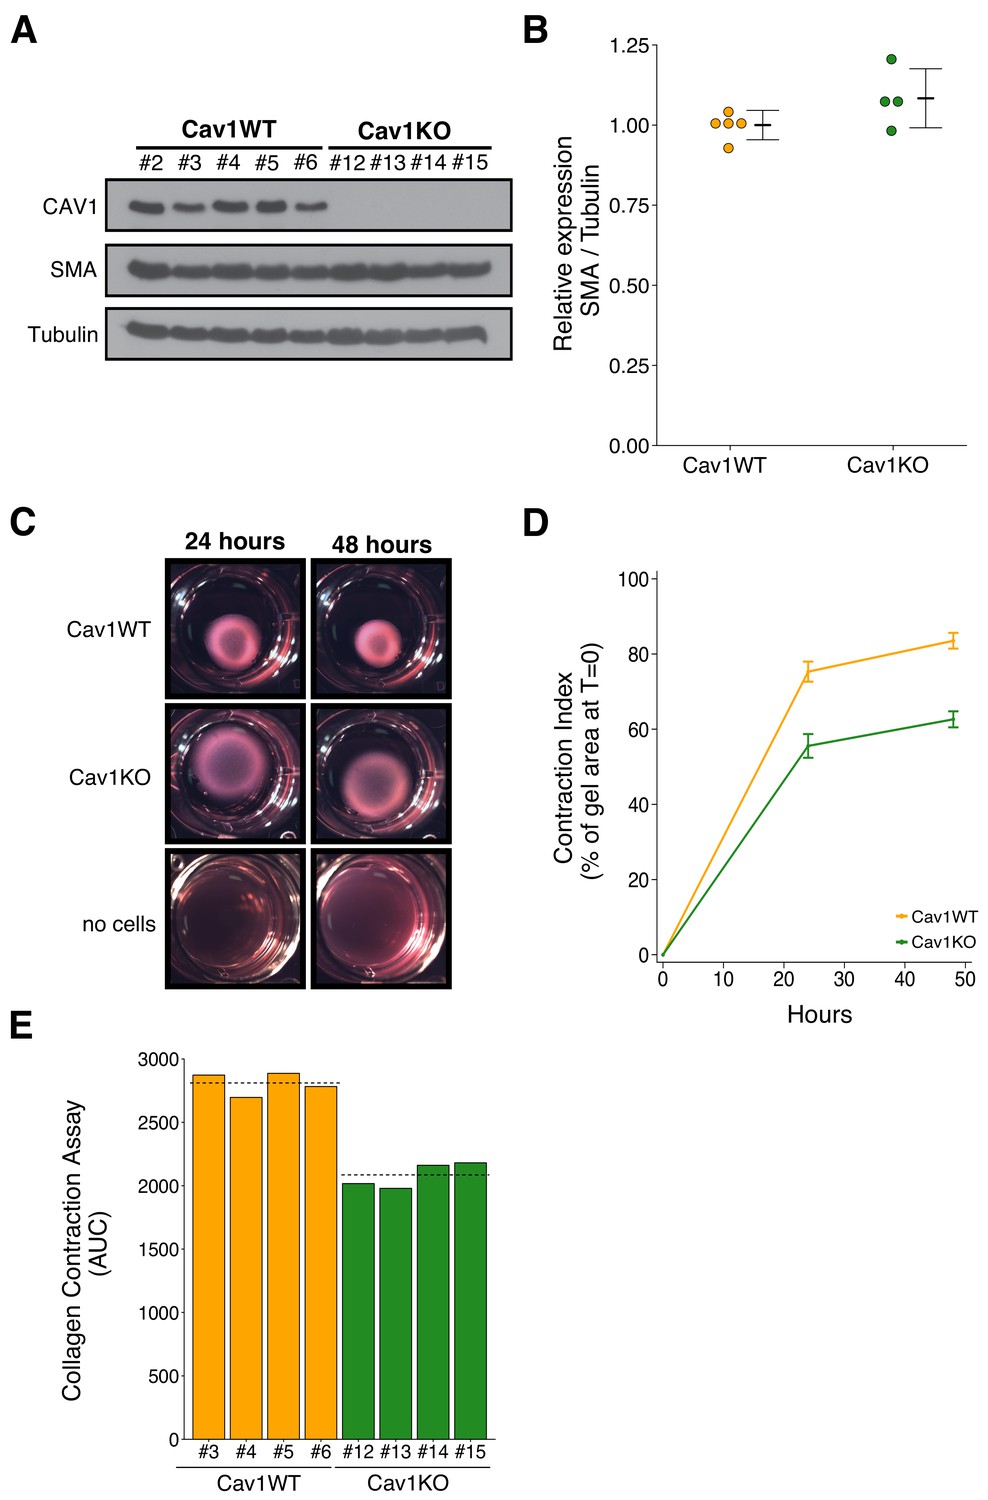
Characterization of Cav1 wild-type and Cav1 knockout pMEFs.
Primary MEFs (pMEFs) from wild-type (WT) or knockout (KO) embryos were examined for increased fibroblast activation and extracellular matrix (ECM) remodeling capabilities in vitro. (A) Western blots of the indicated pMEFs probed with antibodies against caveolin-1 (CAV1), alpha-smooth muscle actin (SMA), and gamma-Tubulin. Numbers indicate individual pMEF clones. (B) Western blot bands were quantified, SMA levels were normalized to Tubulin, and protein expression are presented relative to Cav1WT. Dot plot with means reported as crossbars and error bars represent SD. Number of individual clones per group: Cav1WT = 5, Cav1KO = 4. Exploratory analysis: Student’s two-tailed t-test; t(7) = 1.791, p=0.116; Cohen’s d = 1.20, 95% CI [−0.52, 2.92]. (C) Representative images from collagen contraction assay of the indicated conditions at 24 or 48 hr after plating. (D) Line graph of contraction index, measured as the change in percent of gel area at time of plating, of Cav1WT and Cav1KO pMEFs at the indicated times after plating. Means reported and error bars represent SD. Number of individual clones per group: Cav1WT = 4, Cav1KO = 4. (E) The contraction index was used to calculate the area under the curve (AUC) for each clone. Bar plots for each individual clone tested (numbers indicate same clone number as in A). Dashed lines indicate means of each group. Exploratory analysis: Student’s two-tailed t-test; t(6) = 10.80, p=3.72×10⁻⁵; Cohen’s d = 7.64, 95% CI [2.66, 12.62]. Additional details for this experiment can be found at https://osf.io/na5h2/.
Figure 2
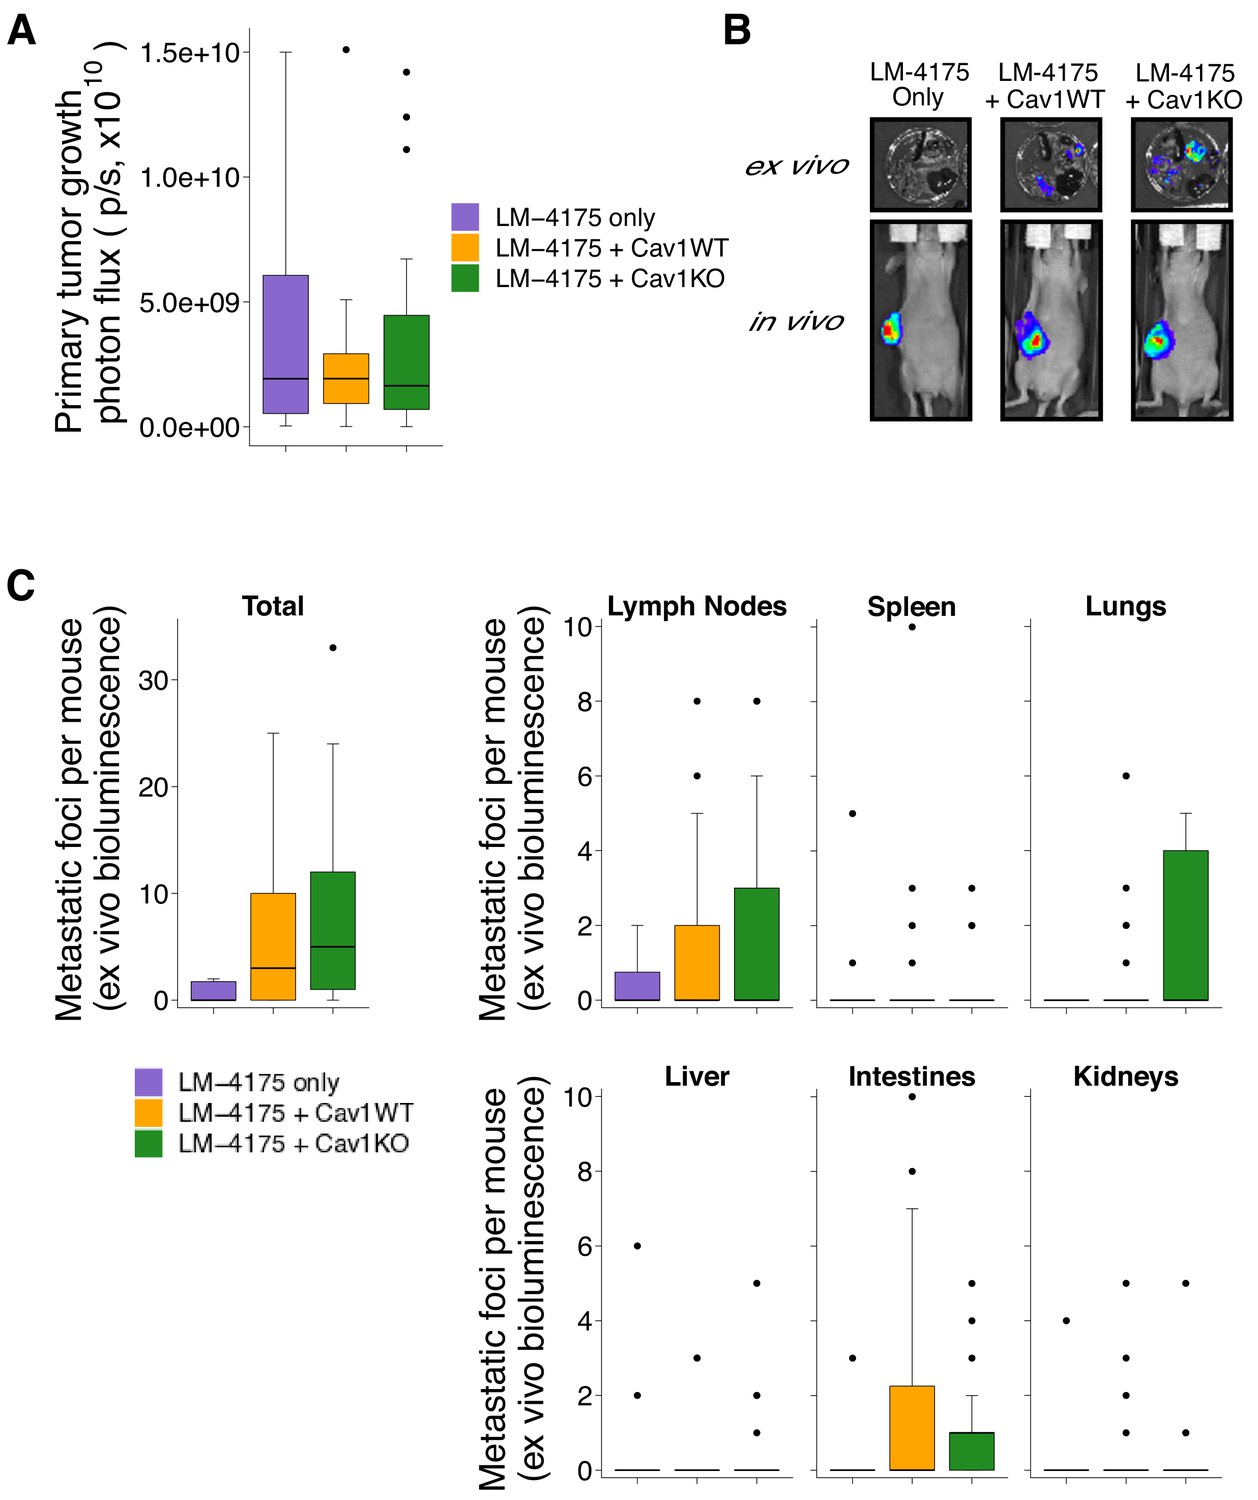
Primary tumor growth and metastatic burden from subcutaneous tumorigenicity assay.
Female nude mice were subcutaneously injected with 1 × 10⁶ LM-4175 cells mixed with or without 1 × 10⁶ Cav1WT or Cav1KO pMEFs and monitored for 45 days. (A) At the end of the experiment primary tumors were imaged in vivo. Box and whisker plot of primary tumor photon flux with median represented as the line through the box and whiskers representing values within 1.5 IQR of the first and third quartile. Number of primary mice per group: LM-4175 only (control group)=10, LM-4175 plus Cav1WT pMEFs = 26, LM-4175 plus Cav1KO pMEFs = 25. Kruskal-Wallis test on all three groups: H(2) = 0.0439, p=0.978. (B) Representative images of primary tumors in vivo and extracted organs ex vivo. (C) The indicated organs were dissected, imaged ex vivo, and individual metastatic foci were blindly quantified. Box and whisker plots of metastatic foci counts for each organ and total metastatic counts with median represented as the line through the box and whiskers representing values within 1.5 IQR of the first and third quartile (dots represent outliers). Note: the y-axes have been truncated for visualization purposes and excludes two outliers from Total (LM-4175 only), one from Lymph Nodes (LM-4175 plus Cav1WT), seven from Lung (two from LM-4175 only; five from LM-4175 plus Cav1KO), and one from Intestines (LM-4175 only). The excluded outliers were included in the statistical analysis below. Number of mice per group: LM-4175 only = 10, LM-4175 plus Cav1WT pMEFs = 26, LM-4175 plus Cav1KO pMEFs = 25. Planned Wilcoxon-Mann-Whitney comparison on total metastatic counts between LM-4175 only and LM-4175 plus Cav1WT pMEFs: U = 103, uncorrected p=0.318 with a priori alpha level of 0.0167, Bonferroni corrected p=0.954, Cliff’s delta = 0.21, 95% CI [−0.08, 0.46]. Planned Wilcoxon-Mann-Whitney comparison on total metastatic counts between LM-4175 only and LM-4175 plus Cav1KO pMEFs: U = 175.5, uncorrected p=0.062, Bonferroni corrected p=0.185, Cliff’s delta = 0.40, 95% CI [0.10, 0.64]. Planned Wilcoxon-Mann-Whitney comparison on total metastatic counts between LM-4175 plus Cav1WT pMEFs and LM-4175 plus Cav1KO pMEFs: U = 389.5, uncorrected p=0.219, Bonferroni corrected p=0.657, Cliff’s delta = −0.20, 95% CI [−0.47, 0.11]. Additional details for this experiment can be found at https://osf.io/bq54u/.
Figure 3 with 4 supplements
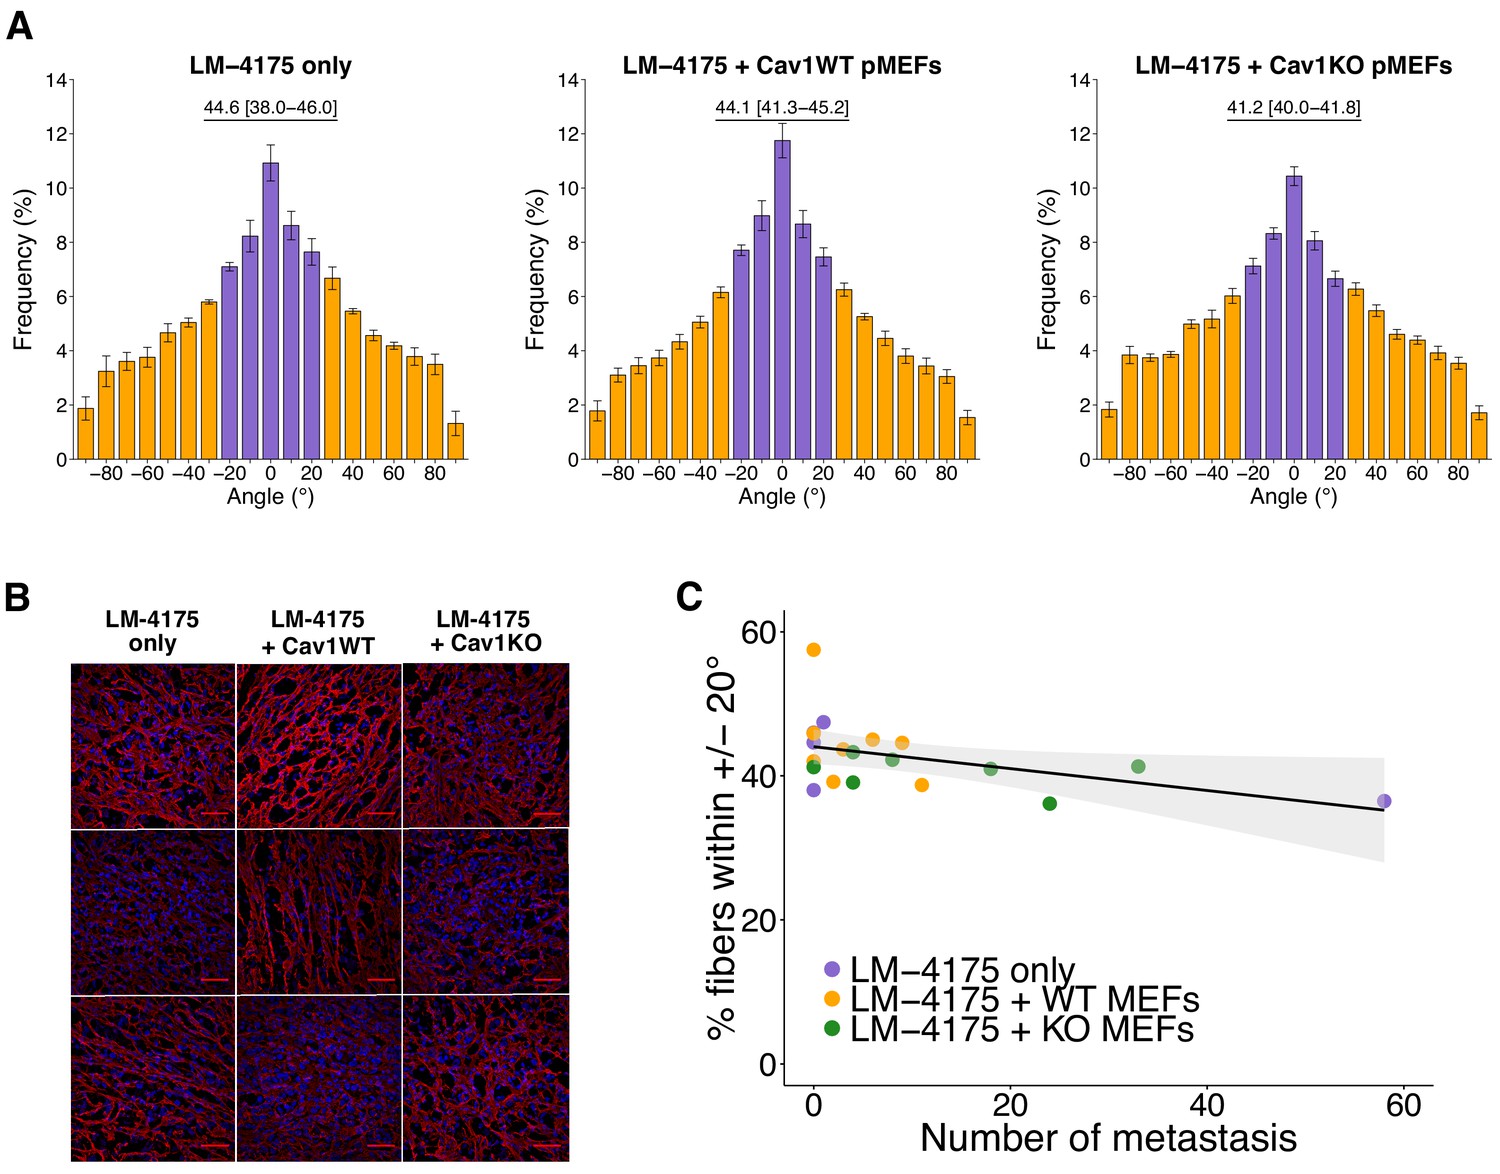
Intratumoral fibronectin fiber orientation and correlation to metastasis.
A random subset of the primary tumors from the subcutaneous tumorigenicity assay (20 of 61 mice) were stained for fibronectin and analyzed to determine the average percentage of fibers oriented within 20° of the modal angle. (A) Bar graphs of the frequency of fibronectin fiber angle plotted relative to the modal angle (set at 0°). Means reported and error bars represent s.e.m. Number of mice, and thus tumors, per group: LM-4175 only = 5, LM-4175 plus Cav1WT pMEFs = 8, LM-4175 plus Cav1KO pMEFs = 7. Values reported above bar graphs indicate the median and interquartile range (IQR) of percent of fibers oriented within 20° of the modal angle (−20° to 20°, represented as purple bars) for each tumor. Planned Wilcoxon-Mann-Whitney comparison on percent of fibers oriented within 20° of the modal angle between LM-4175 only and LM-4175 plus Cav1WT pMEFs: U = 19, uncorrected p=0.884 with a priori alpha level of 0.025, Bonferroni corrected p>0.99. Planned Wilcoxon-Mann-Whitney comparison on percent of fibers oriented within 20° of the modal angle between LM-4175 plus Cav1WT pMEFs and LM-4175 plus Cav1KO pMEFs: U = 13, uncorrected p=0.0826, Bonferroni corrected p=0.165. (B) Different fields of views (fov) of the immunostained primary tumors for fibronectin and Hoechst. Three independent tumors derived from LM4175 only (first column, top to bottom: tumor 2 fov5, tumor 4 fov9, tumor 34 fov3), LM-4175 plus Cav1WT pMEFs (second column, top to bottom: tumor 16 fov7, tumor 51 fov 7, tumor 61 fov2), and LM-4175 plus Cav1KO pMEFs (third column, top to bottom: tumor 20 fov4, tumor 30 fov1, tumor 47 fov6). Scale bar: 50 µm. Fibronectin signal is pseudo-colored in red (microscope emission peak wavelength: 614 nm) and Hoechst signal is pseudo-colored in blue (microscope peak emission wavelength: 454 nm). Images are maximum intensity projections of the Z-stacks, corrected for background (as described in Materials and methods - Fibronectin fiber analysis) and displayed in the same range of grey levels. (C) Scatter plot of percentage of fibers within 20° of the modal angle and total number of metastatic counts for 20 tumors analyzed for fibronectin orientation. Line represents spearman rank correlation and light gray region represents 95% CI. Spearman rank-order correlation analysis: rs(18) = −0.50, p=0.025. Additional details for this experiment can be found at https://osf.io/bq54u/.
Figure 3—figure supplement 1
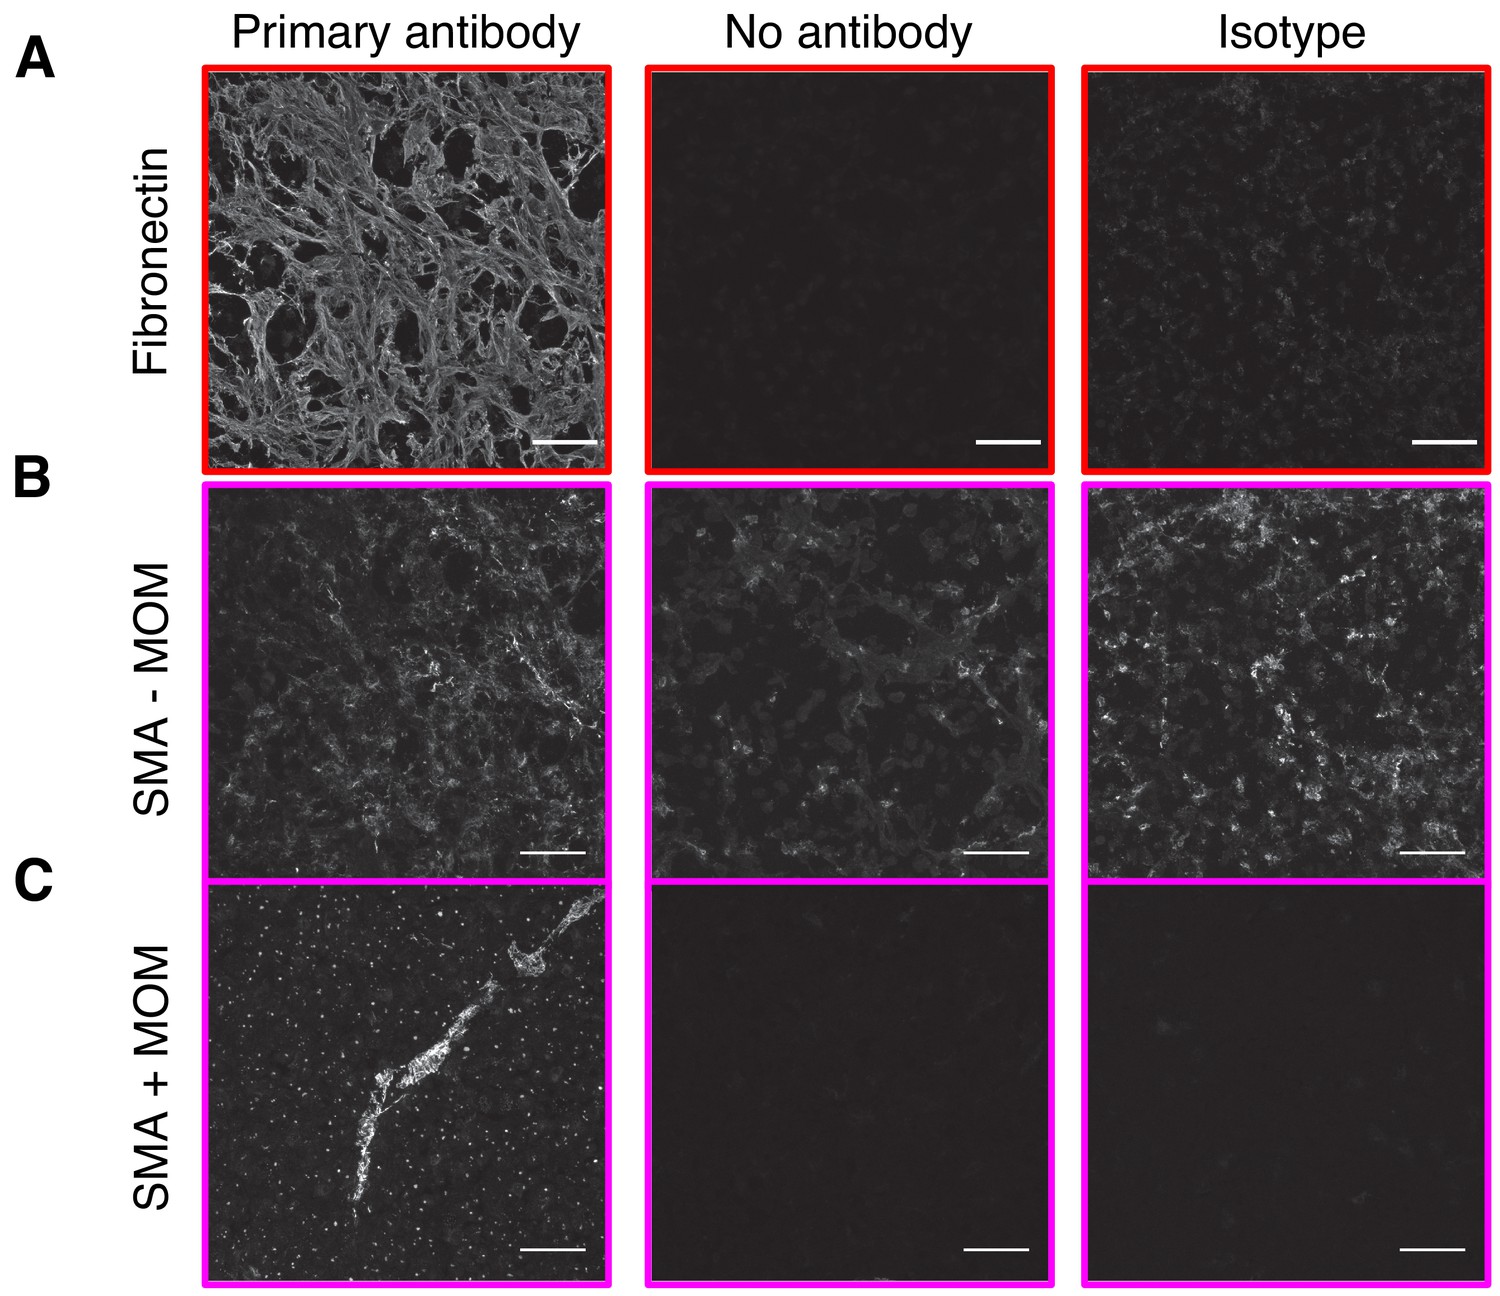
Immunostaining of primary tumors.
Primary tumors from the subcutaneous tumorigenicity assay were sectioned, fixed, and stained for fibronectin and SMA. (A) Representative images of tumor sections stained for fibronectin, no primary antibody control, or isotype control antibody. Tumor derived from LM-4175 plus Cav1WT pMEFs (tumor 8). (B) Representative images of tumor sections stained for SMA, no primary antibody control, or isotype control antibody. Tumor derived from LM-4175 plus Cav1WT pMEFs (tumor 8). (C) Representative images of tumor sections stained for SMA, no primary antibody control, or isotype control antibody after performing mouse-on-mouse (MOM) blocking Tumor derived from LM-4175 plus Cav1WT pMEFs (tumor 16). Images are maximum intensity projections of the original Z-stacks and each row are displayed in the same grey level range. Scale bar: 50 µm. Additional details for this experiment can be found at https://osf.io/bq54u/.
Figure 3—figure supplement 2
Additional measures of fibronectin fiber analysis.
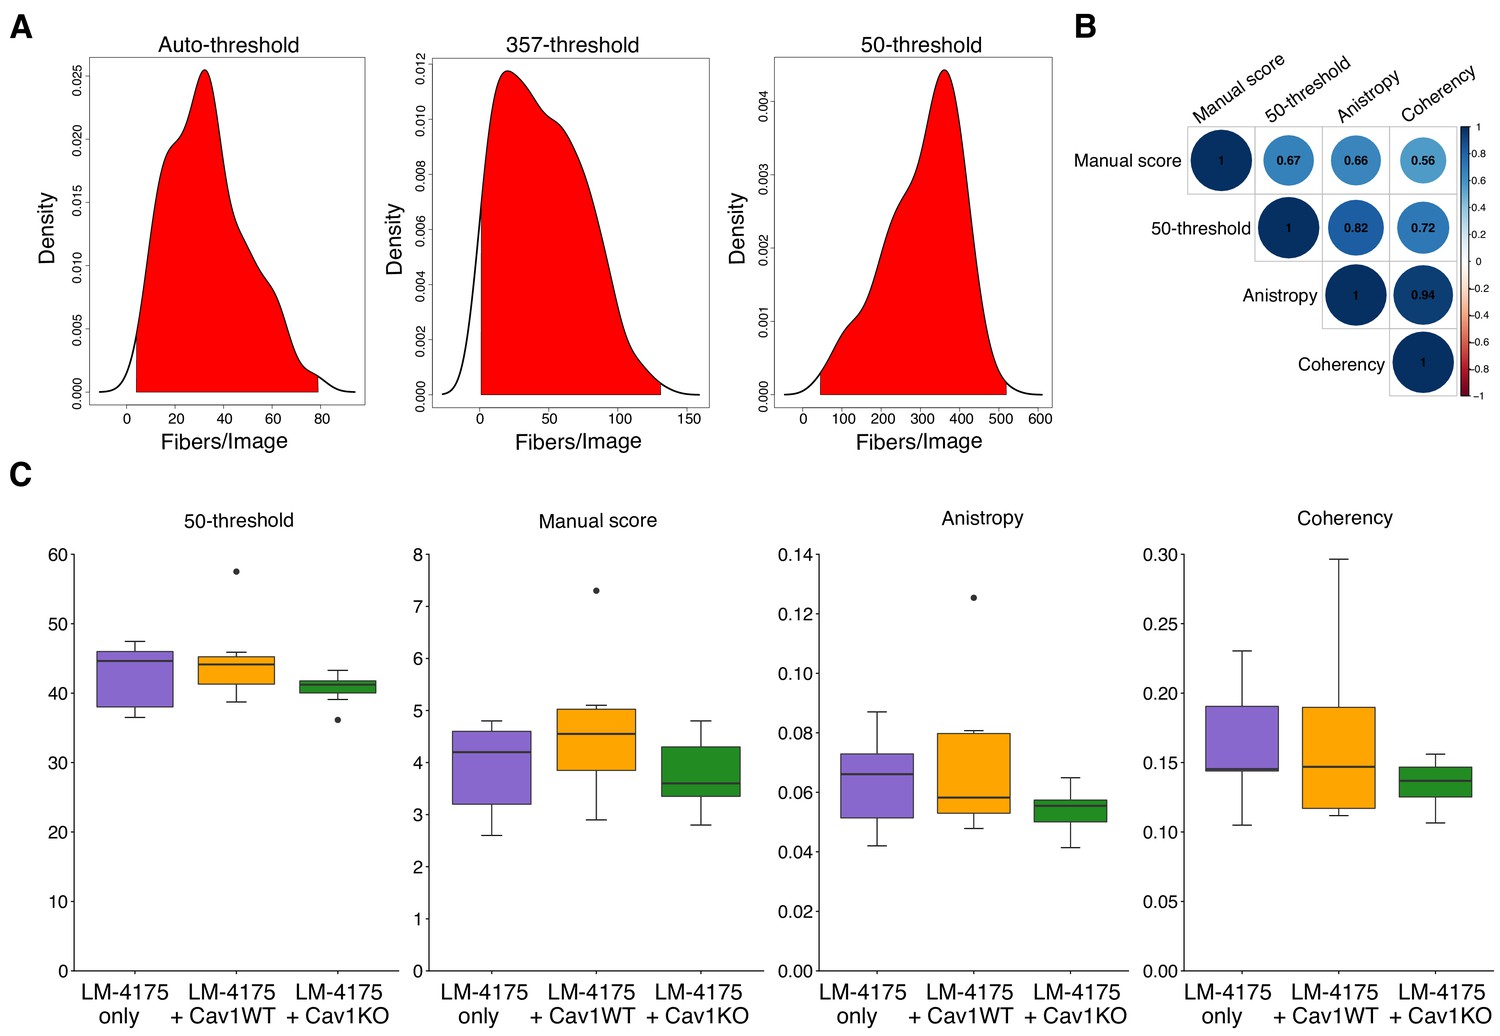
Image thresholding parameters tested and exploratory analysis approaches. (A) Kernel density estimations of number of fibers per image for each thresholding parameter tested with range of number of fibers per image observed colored as red. Auto-threshold used object sizes greater than 50 and KNIME automatic thresholding, 357-threshold used object sizes greater than 357 and global threshold of 35% of max signal, and 50-threshold used object sizes greater than 50 and global threshold of 35% of max signal. Of note, 50-threshold parameter was used for results presented in Figure 3 of this study and used to compare results to the original study. (B) Correlation matrix of additional methods to assess fibronectin fiber orientation. Positive correlations are displayed in blue with color intensity and circle size proportional to the correlation coefficients, which are displayed in each circle. Exploratory spearman rank-order correlation analyses. Manual score vs 50-threshold: rs(198) = 0.67, p=1.04×10⁻²⁷; Manual score vs Anisotropy: rs(198) = 0.66, p=2.33×10⁻²⁶; Manual score vs Coherency: rs(198) = 0.56, p=6.29×10⁻¹⁸; 50-threshold vs Anisotropy: rs(198) = 0.82, p=1.02×10−50; 50-threshold vs Coherency: rs(198) = 0.72, p=5.85×10⁻³³; Anisotropy vs Coherency: rs(198) = 0.94, p=5.68×10−96. (C) Box and whisker plots of average percent of fibers oriented within 20° of the modal angle using 50-threshold (same parameter presented in Figure 3A), manual score, anisotropy score, or coherency score for each tumor with median represented as the line through the box and whiskers representing values within 1.5 IQR of the first and third quartile (dots represent outliers). Number of tumors per group: LM-4175 only = 5, LM-4175 plus Cav1WT pMEFs = 8, LM-4175 plus Cav1KO pMEFs = 7. Confirmatory analysis with 50-threshold reported in Figure 3 figure legend. Exploratory Wilcoxon-Mann-Whitney analyses for each additional method. Manual score: LM-4175 vs LM-4175 plus Cav1WT pMEFs: U = 13, p=0.306, Cliff’s delta = 0.35, 95% CI [−0.27, 0.76]; LM-4175 plus Cav1WT pMEFs vs LM-4175 plus Cav1KO pMEFs: U = 17, p=0.203, Cliff’s delta = 0.39, 95% CI [−0.18, 0.77]. Anisotropy score: LM-4175 vs LM-4175 plus Cav1WT pMEFs: U = 18, p=0.770, Cliff’s delta = 0.10, 95% CI [−0.52, 0.65]; LM-4175 plus Cav1WT pMEFs vs LM-4175 plus Cav1KO pMEFs: U = 19, p=0.298, Cliff’s delta = 0.32, 95% CI [−0.26, 0.73]. Coherency score: LM-4175 vs LM-4175 plus Cav1WT pMEFs: U = 21, p=0.884, Cliff’s delta = −0.05, 95% CI [−0.61, 0.55]; LM-4175 plus Cav1WT pMEFs vs LM-4175 plus Cav1KO pMEFs: U = 22, p=0.487, Cliff’s delta = 0.21, 95% CI [−0.39, 0.69]. Additional details for this experiment can be found at https://osf.io/bq54u/.
Figure 3—figure supplement 3
Fields of view from fibronectin fiber analysis.
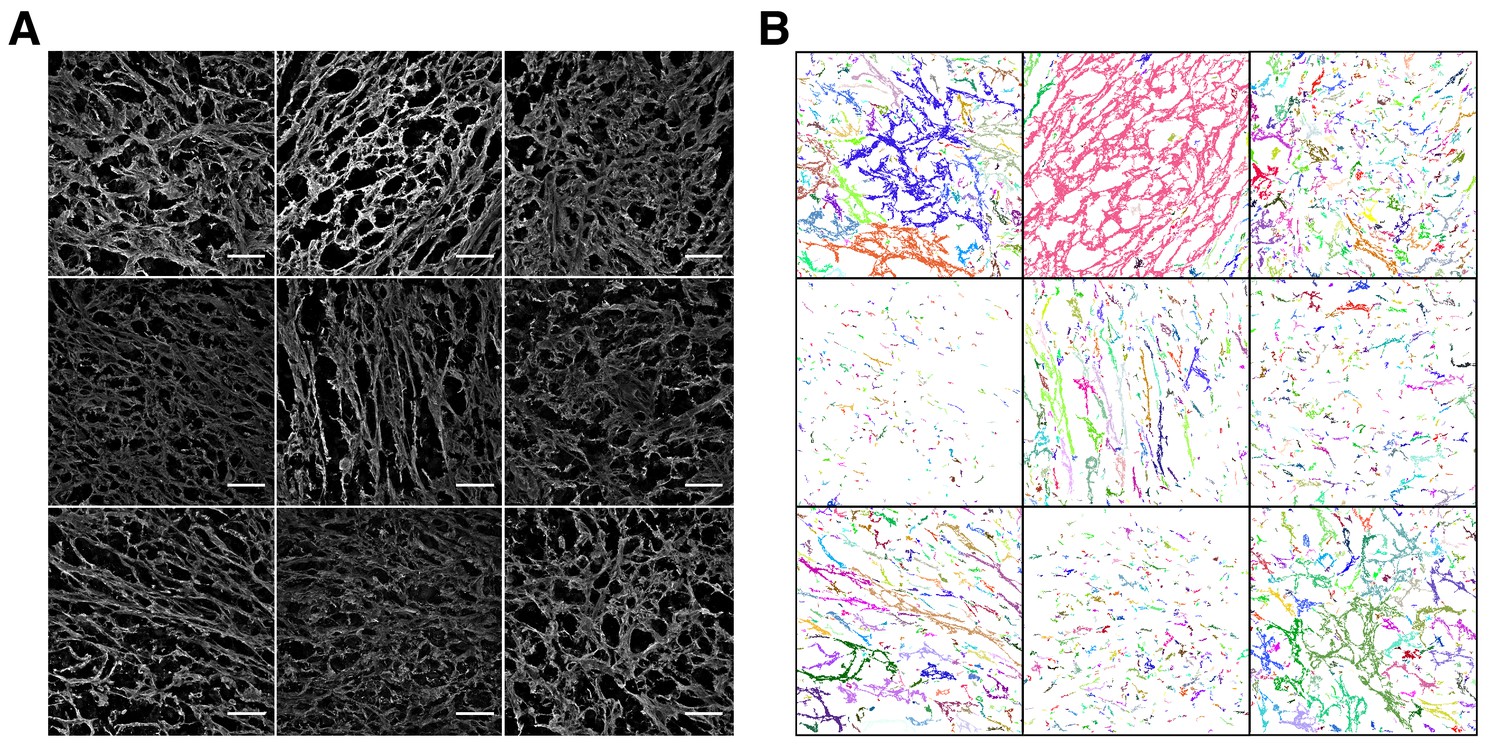
These are the same fields of views of immunostated primary tumors for fibronectin displayed in Figure 3B. (A) Monochrome display presented in grey levels for fibronectin only (microscope emission peak wavelength: 614 nm). Scale bar: 50 µm. (B) Display of the corresponding segmented objects obtained with the described workflow, the angles of which were measured.
Figure 3—figure supplement 4
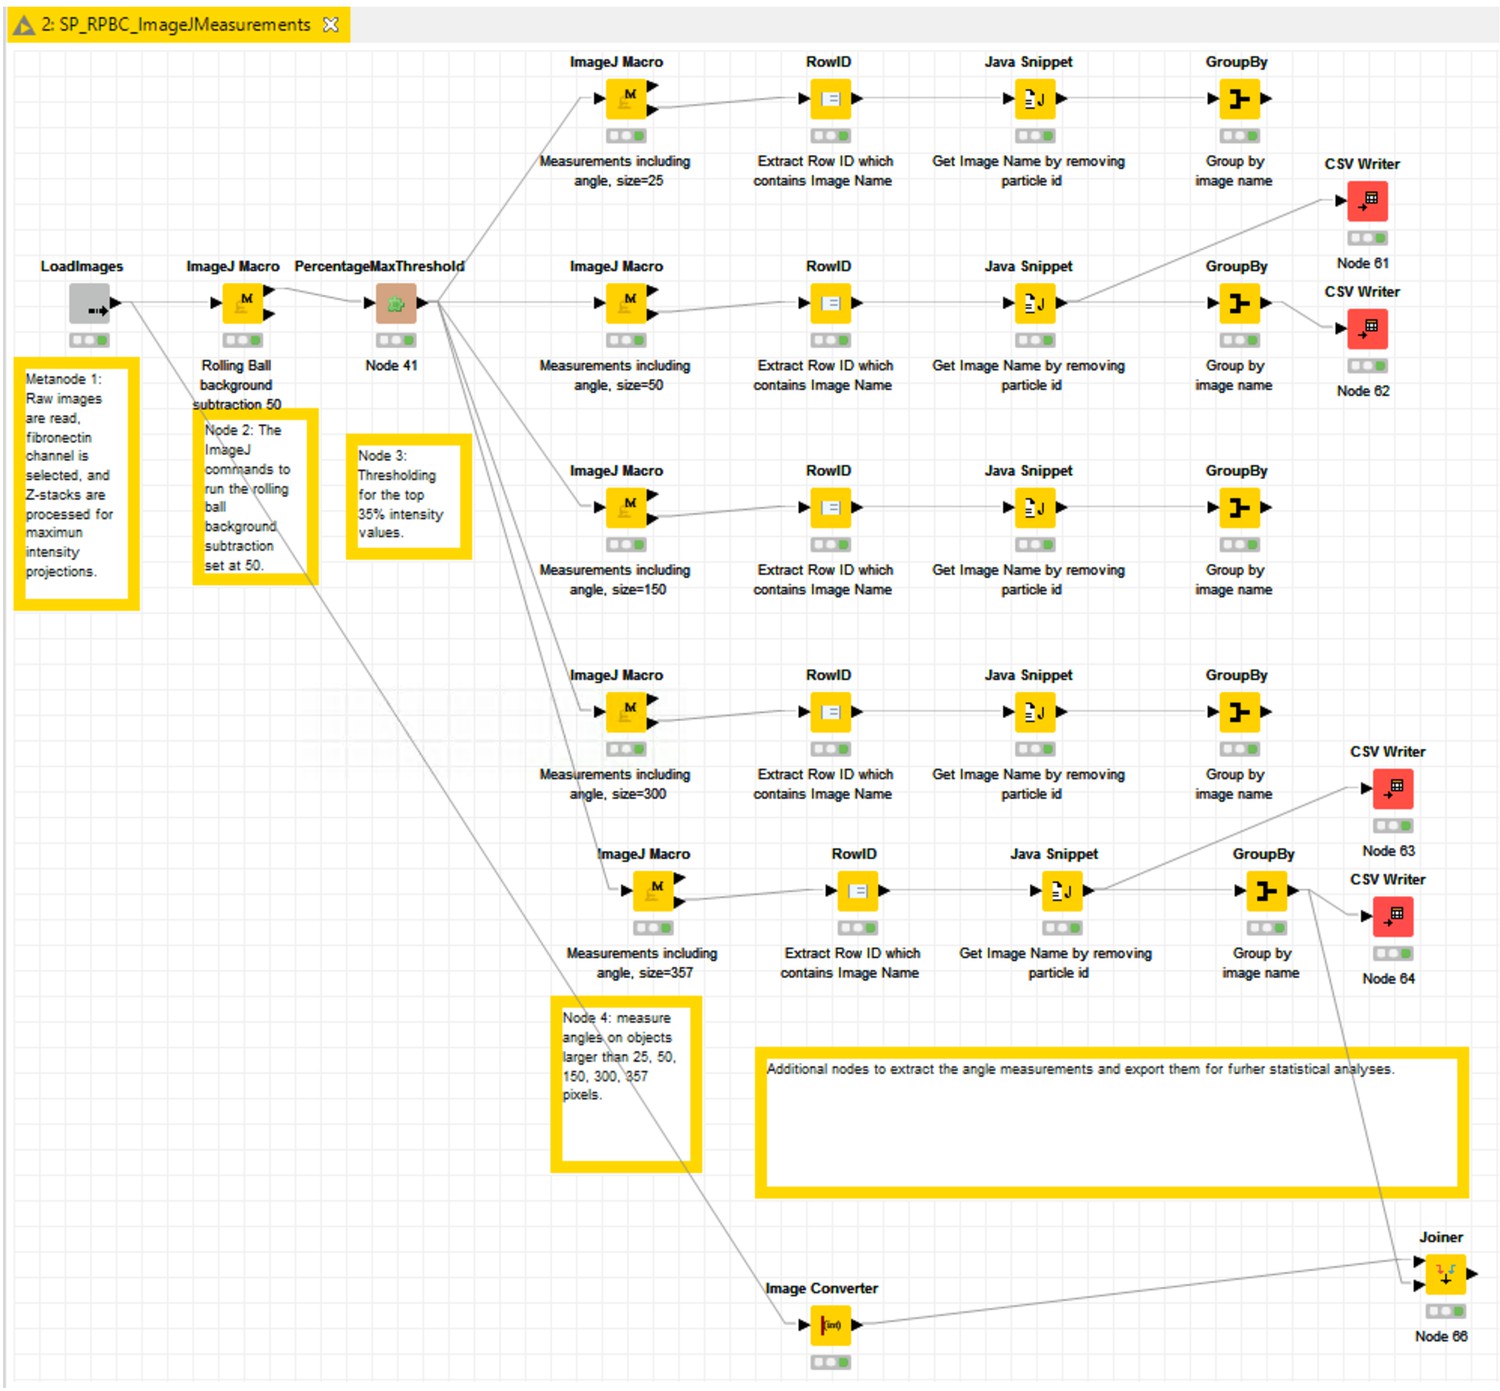
KNIME workflow.
Screenshot of the processing/analysis steps performed using the KNIME analytics platform.
Figure 4
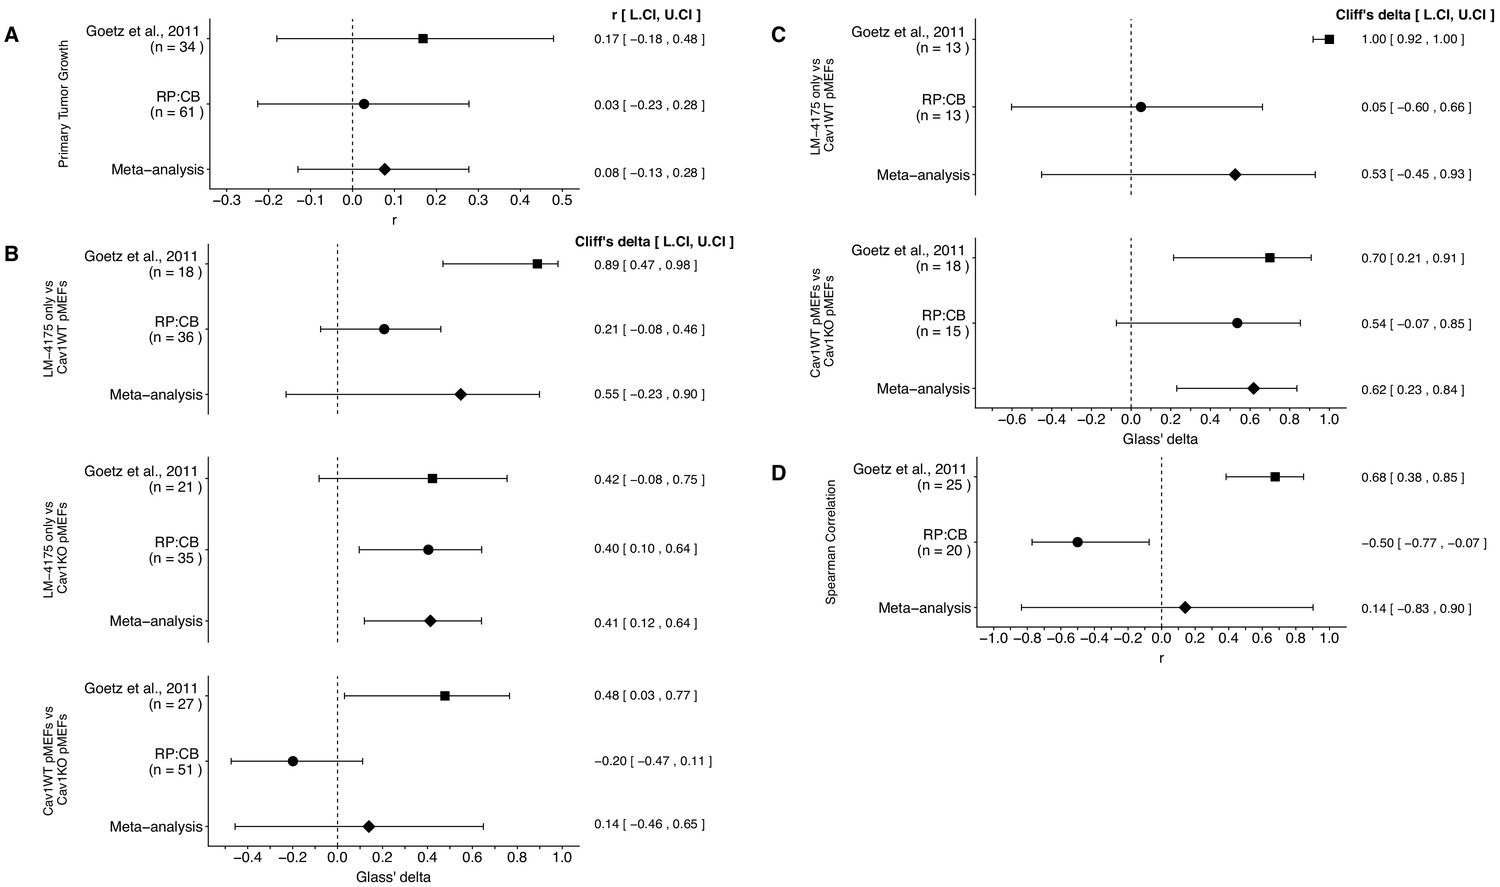
Meta-analyses of each effect.
Effect size and 95% confidence interval are presented for Goetz et al. (2011), this replication attempt (RP:CB), and a random effects meta-analysis to combine the two effects. The effect size r is a standardized measure of the correlation (strength and direction) of the association between two variables and Cliff’s delta is a standardized measure of how often a value in one group is larger than the values from another group. Sample sizes used in Goetz et al. (2011) and this replication attempt are reported under the study name. (A) Primary tumor growth between mice injected with LM-4175 cells with or without Cav1WT or Cav1KO pMEFs (meta-analysis p=0.467). (B) Total metastasis counts between mice injected with LM-4175 cells and LM-4175 plus Cav1WT pMEFs (meta-analysis p=0.107), mice injected with LM-4175 cells and LM-4175 plus Cav1KO pMEFs (meta-analysis p=0.0027), and mice injected with LM-4175 plus Cav1WT pMEFs and LM-4175 plus Cav1KO pMEFs (meta-analysis p=0.680). (C) Fibronectin fiber orientation (average percentage of fibers oriented within 20° of the mode angle) between tumors from mice injected with injected with LM-4175 cells and LM-4175 plus Cav1WT pMEFs (meta-analysis p=0.269) and mice injected with LM-4175 plus Cav1WT pMEFs and LM-4175 plus Cav1KO pMEFs (meta-analysis p=1.11×10⁻⁴). (D) Rank-order correlation between fibronectin fiber orientation and total metastasis counts (meta-analysis p=0.837). Additional details for these meta-analyses can be found at https://osf.io/rvf57/.
Tables
Key resources table
| Reagent type (species) or resource | Designation | Source or reference | Identifiers | Additional information |
|---|---|---|---|---|
| Cell line (Mus musculus) | Cav1WT pMEFs | This paper | isolated from embryonic day 14.5 embryos from B6129SF2/J mice (Jackson Laboratory, Stock No. 101045, RRID:IMSR_JAX:101045) | |
| Cell line (M. musculus) | Cav1KO pMEFs | This paper | isolated from embryonic day 14.5 embryos from Cav1tm1Mls/J mice (Jackson Laboratory, Stock No. 004585, RRID:IMSR_JAX:004585) | |
| Cell line (H. sapiens, female) | LM-4175 | doi: 10.1038/nature03799 | Expresses HSV-tk1-GFP-Fluc; shared by del Pozo lab, CNIC | |
| Strain, strain background (M. musculus, Athymic Nude-Foxn1nu, female) | athymic nude | Envigo | MGI:5652489 | |
| Other | Matrigel | Corning | cat# 356234 | |
| Other | D-luciferin | Promega | cat# P1042 | |
| Antibody | mouse anti-Caveolin 1 | BD Biosciences | cat# 610406; clone: 2297; RRID:AB_397789 | 1:1000 dilution |
| Antibody | mouse anti-alpha-SMA | Sigma-Aldrich | cat# A5228; clone: 1A4; RRID:AB_262054 | 1:100 or 1:1000 dilution |
| Antibody | mouse anti-gamma-tubulin | Sigma-Aldrich | cat# T6557; clone: GTU-88; RRID:AB_477584 | 1:1000 dilution |
| Antibody | rabbit-fibronectin | Sigma-Aldrich | cat# F3648, RRID:AB_476976 | 1:200 dilution |
| Antibody | HRP-conjugated goat anti-mouse | Thermo Fisher Scientific | cat# 32430; RRID:AB_1185566 | 1:5000 to 1:10,000 dilution |
| Antibody | Alexa Fluor 594-conjugated donkey anti-rabbit | Jackson ImmunoResearch Laboratories | cat# 711-585-152; RRID:AB_2340621 | 1:300 dilution |
| Antibody | Alexa Fluor 647-conjugated donkey anti-mouse | Jackson ImmunoResearch Laboratories | cat# 715-605-151; RRID:AB_2340863 | 1:300 dilution |
| Antibody | rabbit IgG isotype control | Sigma-Aldrich | cat# I5006; RRID:AB_1163659 | 1:200 dilution |
| Antibody | mouse IgG2a isotype control | Sigma-Aldrich | cat# M5409; clone: UPC-10; RRID:AB_1163691 | 1:100 dilution |
| Software, algorithm | Qcapture-pro | Teledyne Qimaging | RRID:SCR_014432 | version 6.0.0.605 |
| Software, algorithm | Living Image | Perkin Elmer | RRID:SCR_014247 | version 4.3.1 |
| Software, algorithm | Zen Black Acquisition | ZEISS | RRID:SCR_013672 | version 2.0 |
| Software, algorithm | KNIME | KNIME | RRID:SCR_006164 | version 3.5.1 |
| Software, algorithm | ImageJ | doi:10.1038/nmeth.2089 | RRID:SCR_003070 | version 1.50a |
| Software, algorithm | Fiji | doi:10.1038/nmeth.2019 | RRID:SCR_002285 | version 2.0.0-rc-34 |
| Software, algorithm | FibrilTool | doi:10.1038/nprot.2014.024 | RRID:SCR_016773 | |
| Software, algorithm | OrientationJ | doi:10.1007/s10237-011-0325-z | RRID:SCR_014796 | version 2.0.3 |
| Software, algorithm | MetaMorph | Molecular Devices | RRID:SCR_002368 | version 7.10.1 |
| Software, algorithm | Bio-Formats Importer plugin | doi:10.1083/jcb.201004104 | RRID:SCR_000450 | version 5.1.9 |
| Software, algorithm | R Project for statistical computing | https://www.r-project.org | RRID:SCR_001905 | version 3.5.1 |
Additional files
-
Transparent reporting form
- https://cdn.elifesciences.org/articles/45120/elife-45120-transrepform-v1.docx
-
Reporting standard 1
The ARRIVE guidelines checklist.
- https://cdn.elifesciences.org/articles/45120/elife-45120-repstand1-v1.pdf
Download links
A two-part list of links to download the article, or parts of the article, in various formats.
Downloads (link to download the article as PDF)
Open citations (links to open the citations from this article in various online reference manager services)
Cite this article (links to download the citations from this article in formats compatible with various reference manager tools)
Replication Study: Biomechanical remodeling of the microenvironment by stromal caveolin-1 favors tumor invasion and metastasis
eLife 8:e45120.
https://doi.org/10.7554/eLife.45120


