Structural basis for mammalian nucleotide sugar transport
- Oregon Health & Science University, United States
Figures
Figure 1 with 3 supplements

Functional properties of mCST.
(A) Purified, detergent-solubilized mCST was bound to SPA beads and the indicated compound was titrated against 30 nM [3H]CMP to determine its affinity. Solid symbols denote titrations done with mCST and the open symbols are for mCST∆C. (B) Time course of 30 µM CMP-Sia uptake for purified mCST reconstituted into lipid vesicles with (black) or without (red) 300 µM CMP inside the vesicles. (Inset), The first minute of CMP-Sia uptake for either mCST (solid circles) or mCST∆C (open circles) reconstituted into CMP-filled vesicles is shown to illustrate the linear relationship between uptake and time for up to 30 s, which we used to determine the initial velocity of transport for a given concentration of CMP-Sia. (C) The initial velocity of CMP-Sia uptake for either mCST (solid circles) or mCST∆C (open circles) reconstituted into CMP-filled vesicles is plotted as a function of substrate concentration to determine the Km and Vmax for transport. In all panels, the symbols show the mean ± standard error of the mean (SEM) for n = 2, except for the CMP titrations in (A), and the titration for mCST in (C) where n = 4.
Figure 1—figure supplement 1
Description of SLC35 proteins.
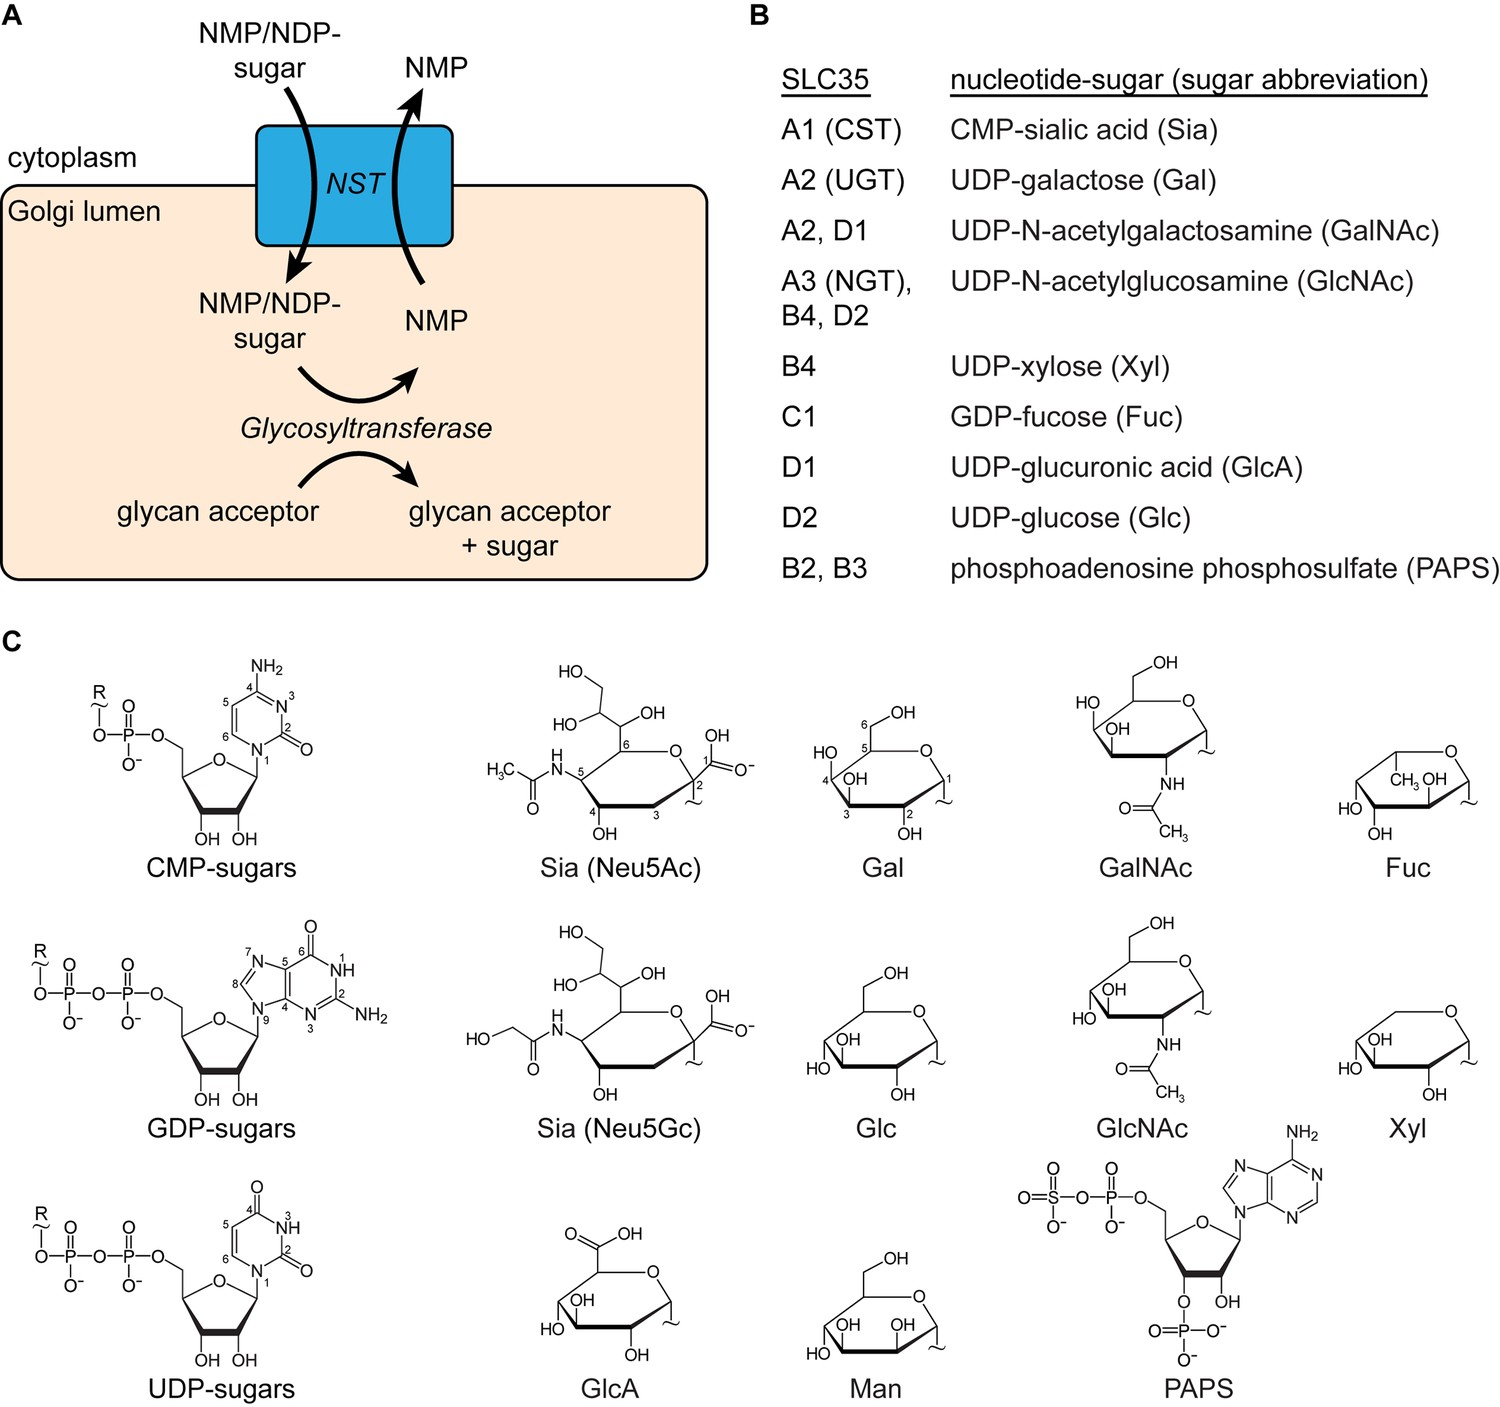
(A) Diagram of the nucleotide-sugar transporter (NST) transport cycle. Nucleotide sugars are first synthesized in the cytoplasm (or nucleus for CMP-Sia). They are then transported into the Golgi lumen by NSTs (blue box). A large family of glycosyltransferase enzymes transfers the sugar to a glycan acceptor, leaving behind the nucleotide monophosphate (NMP), which is then transported back to the cytoplasm by the NST. (B) A list of proteins in the SLC35 family with a known function and the associated nucleotide sugar(s) that they transport. SLC35B2 and SLC35B3 are listed for completeness even though they transport PAPS, the substrate used in sulfonation reactions inside the Golgi. In mammals, mannose (Man) is only present in the oligosaccharide precursor that is synthesized in the cytoplasm and then transported across the ER membrane, by a family of transporters distinct from NSTs, before being added to nascent polypeptides to form the base for N-linked glycans. However, lower organisms such as fungi do possess Golgi-localized GDP-Man transporters. (C) The structural formulas of the nucleotide phosphate (left) and sugar (right) moieties of nucleotide sugars are shown. The ‘~” symbol indicates the bond that links the two moieties. In mammals, two types of sialic acid may be transported into the Golgi: N-acetylneuraminic acid (Neu5Ac) or N-glycolylneuraminic acid (Neu5Gc). The ring atoms for the nucleobases and Neu5Ac and Gal are labeled.
Figure 1—figure supplement 2
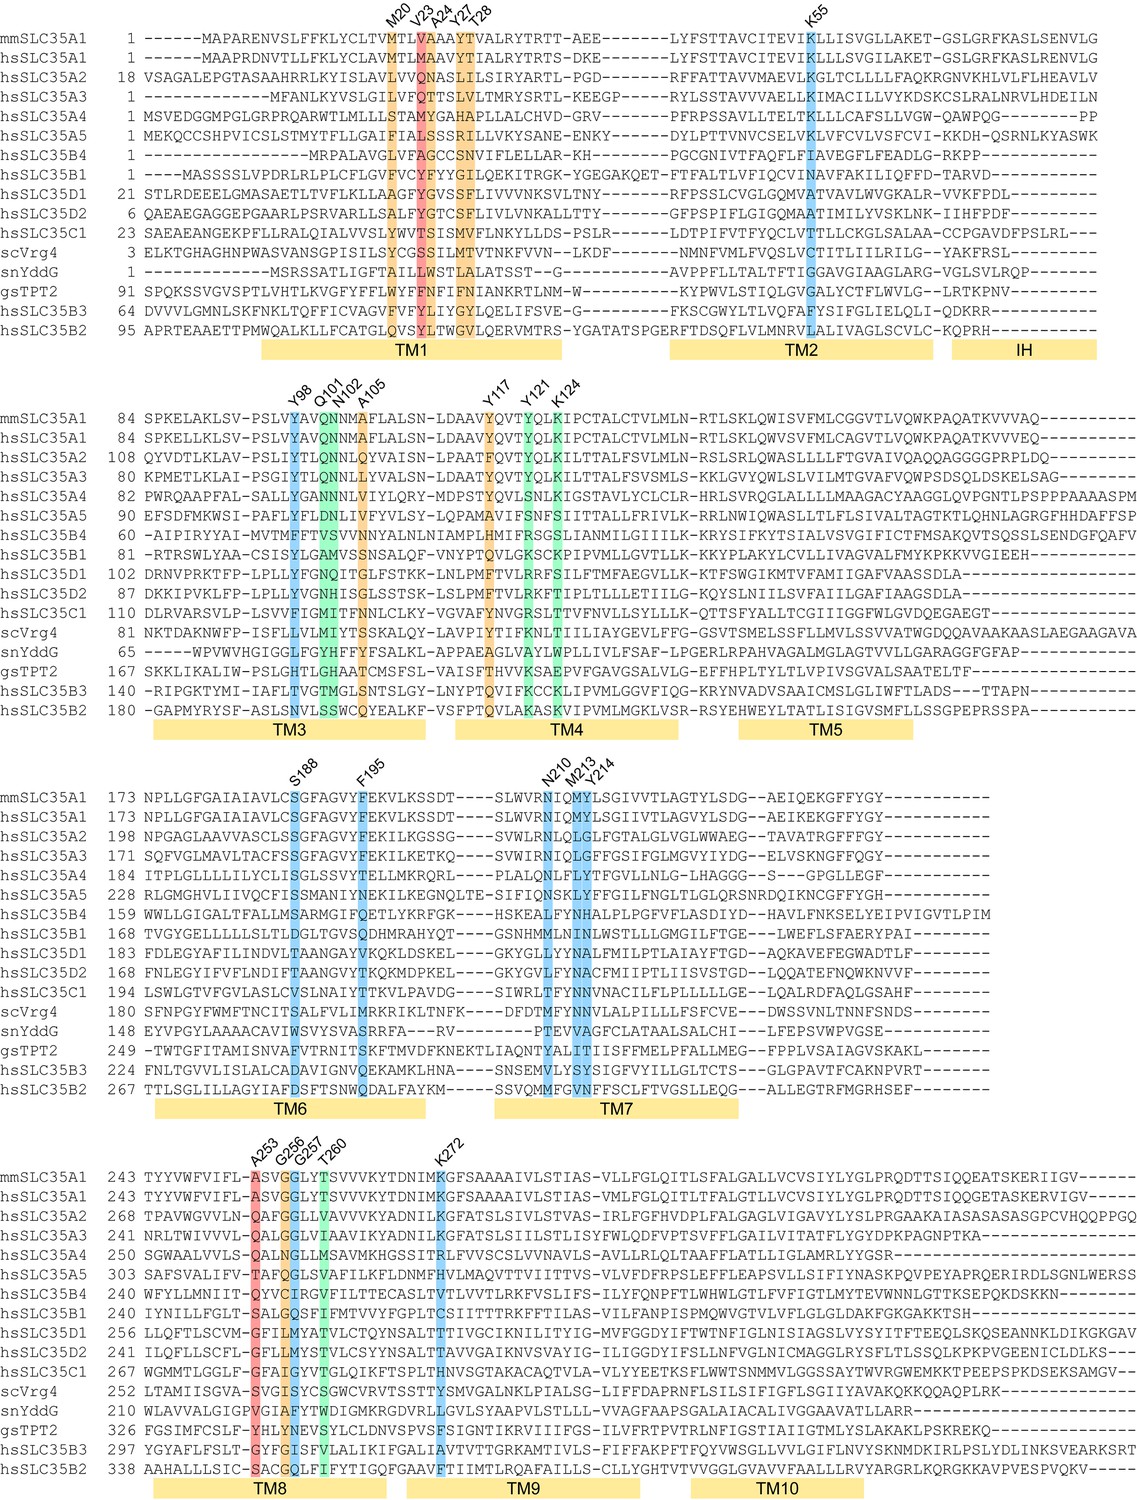
Sequence alignment of mCST with other SLC35 and DMT proteins.
The two letter prefix for each sequence name indicates the species as follows: mm: Mus musculus; hs: Homo sapiens; sc: Saccharomyces cerevisiae; sn: Starkeya novella; gs: Galdieria sulphuraria. The colored highlights indicate: CMP-interacting residues (blue), Sia-interacting residues (orange), residues that interact with both CMP and Sia (green), residues that do not interact with CMP or Sia but may interact with sugars in SLC35A2/A3 (red). The labeled yellow bars under the sequences indicate the extent of each TM. The interfacial alpha helix (IH) connecting TMs 2 and 3 is also indicated.
Figure 1—figure supplement 3
Detection and elimination of CMP contaminants in CMP-Sia stocks.
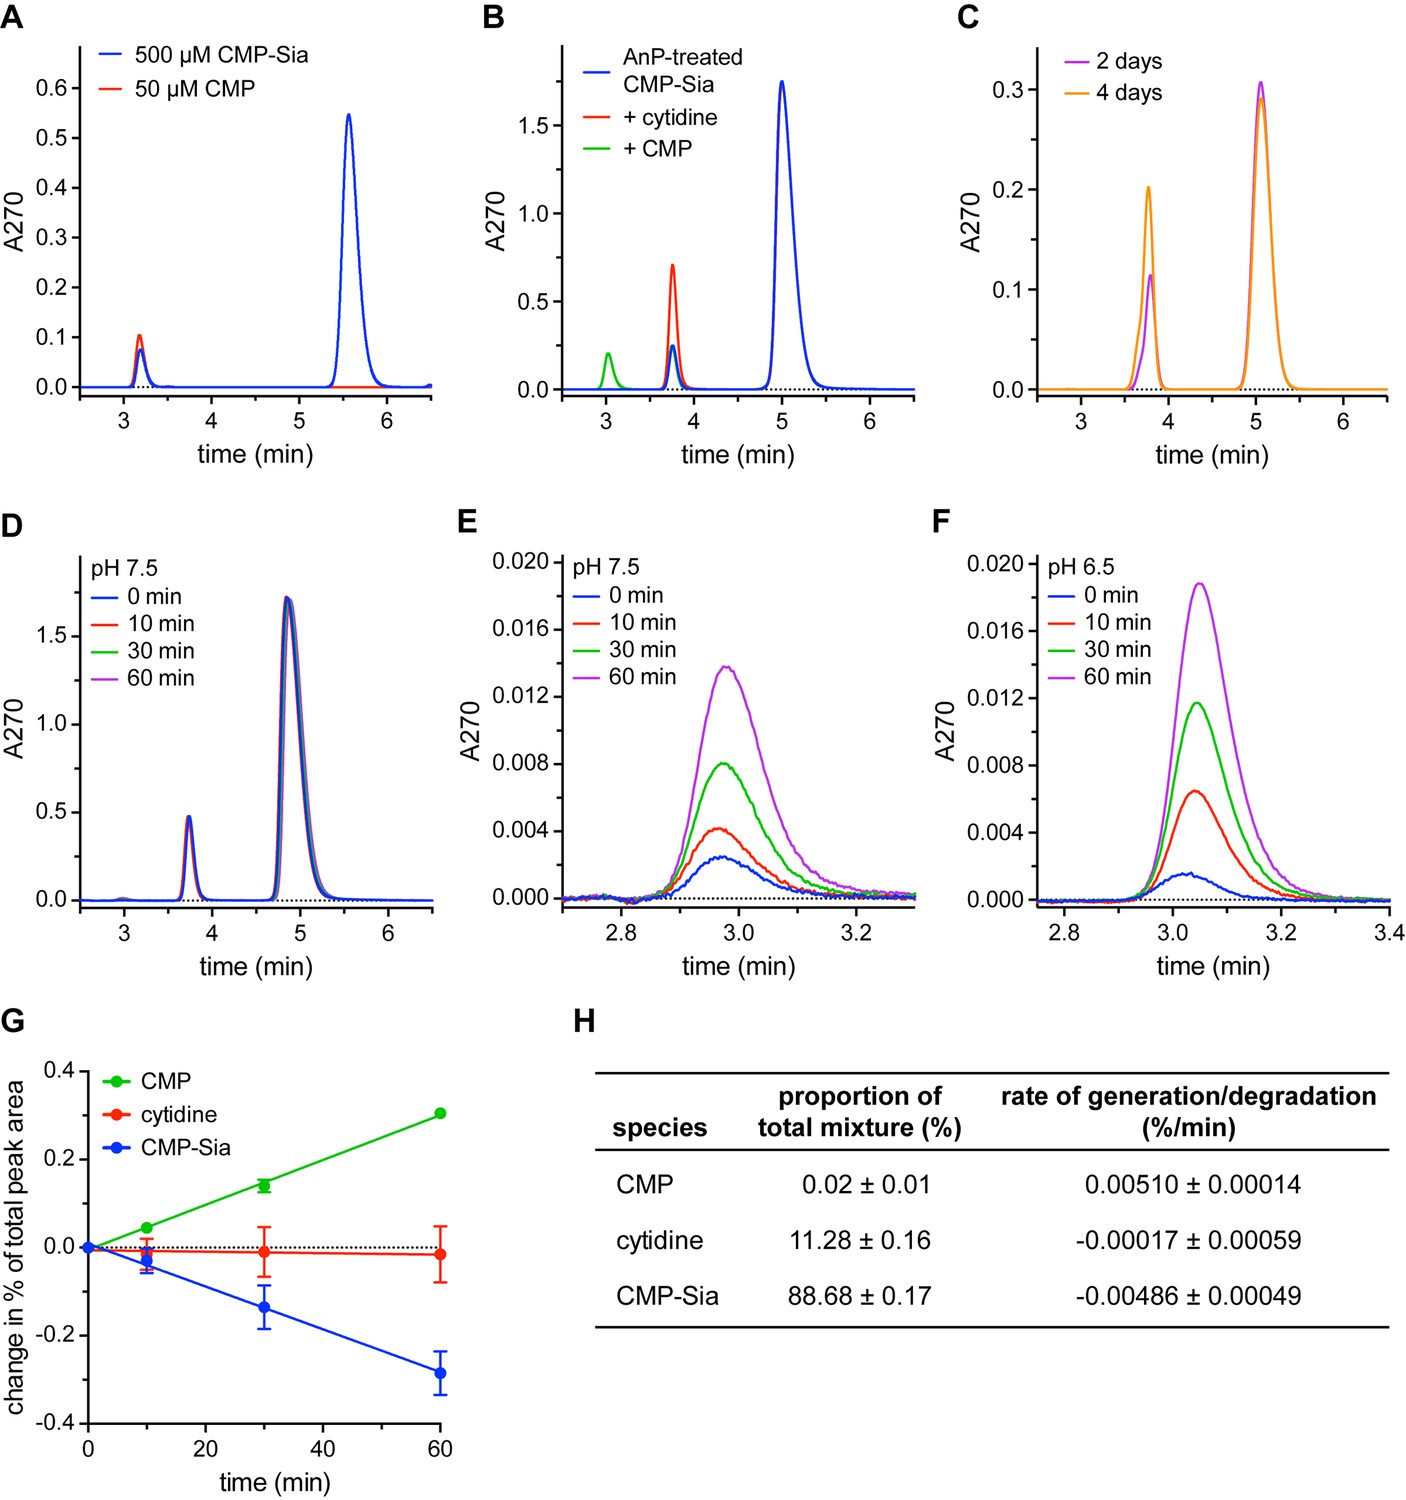
(A) Two peaks were observed when a CMP-Sia stock was run on a C18 column (blue trace). Subsequently running a CMP stock on the same column (red trace) identified the first peak in the CMP-Sia sample as CMP. (B) Adding Antarctic phosphatase (AnP) to CMP-Sia shifts the elution time of the first peak from ~3 min to ~3.8 min. Running samples where either cytidine (red trace) or CMP (green trace) is mixed with the AnP-treated CMP-Sia shows that the AnP converts the CMP to cytidine. (C) To demonstrate the long-term stability of AnP, CMP-Sia was incubated with AnP at 20°C for the indicated time before running on the C18 column. (D–F) To determine the rate of CMP formed from CMP-Sia hydrolysis, AnP-treated CMP-Sia (with the AnP removed) was incubated at room temperature for the indicated time in either a pH 7.5 buffer (D, E) or a pH 6.5 buffer (F). (E) highlights the CMP peak at ~3 min from the chromatograms in (D); likewise, (F) shows the CMP peak from a similar set of chromatograms for an experiment performed at pH 6.5. In all the experiments shown in (A–F), small differences in elution times from run to run were sometimes observed and are most likely due to partial phase dewetting from using a 100% aqueous mobile phase. (G) The proportion of each of the three species from the series of chromatograms shown in (D), as well as from another independent time-course experiment, was calculated by dividing the area under the curve for each peak by the total area of all peaks combined. The proportion at 0 min was subtracted from the proportion at the other time points to give the change in proportion over time, which is graphed. See the Methods for more details. (H) The starting proportion of each species in a given AnP-treated CMP-Sia sample is listed. The slope from a linear regression fit to each of the data series in (G) gives the respective rates of species generation or degradation The symbols in (G) represent the mean and the errors in (G) and (H) represent SEM for n = 2.
Figure 2 with 3 supplements

Overall structure of mCST.
(A and B) Side views of mCST are shown. CMP or CMP-Sia is shown as sticks with carbon atoms colored yellow. The approximate boundary of the lipid bilayer is indicated by the horizontal gray lines. In (A), only the mCST-CMP-Sia structure is shown and the dashed green line indicates the connectivity of the disordered linker between TMs 5 and 6. In (B), the mCST-CMP-Sia (orange) and mCST-CMP (blue) structures are superimposed. (C) Top-down view of the mCST-CMP-Sia structure from the lumenal side. The protein is colored the same as in (A). (D and E) The mCST-CMP-Sia (D, orange) and mCST-CMP (E, blue) structures are shown in surface representation with the front half of the protein sliced away to reveal the shape of the substrate binding cavities. (F) A surface representation of a top-down view (same as in C) of the mCST-CMP-Sia structure is shown to highlight the shape of the lumen-facing cavity and the location of the constriction. (G and H) A close-up top-down view of the constriction from the lumen-facing cavity is shown for the mCST-CMP-Sia (G, orange) and mCST-CMP (H, blue) structures. The black scale bar in each is 5 Å.
Figure 2—figure supplement 1
Electron density maps.
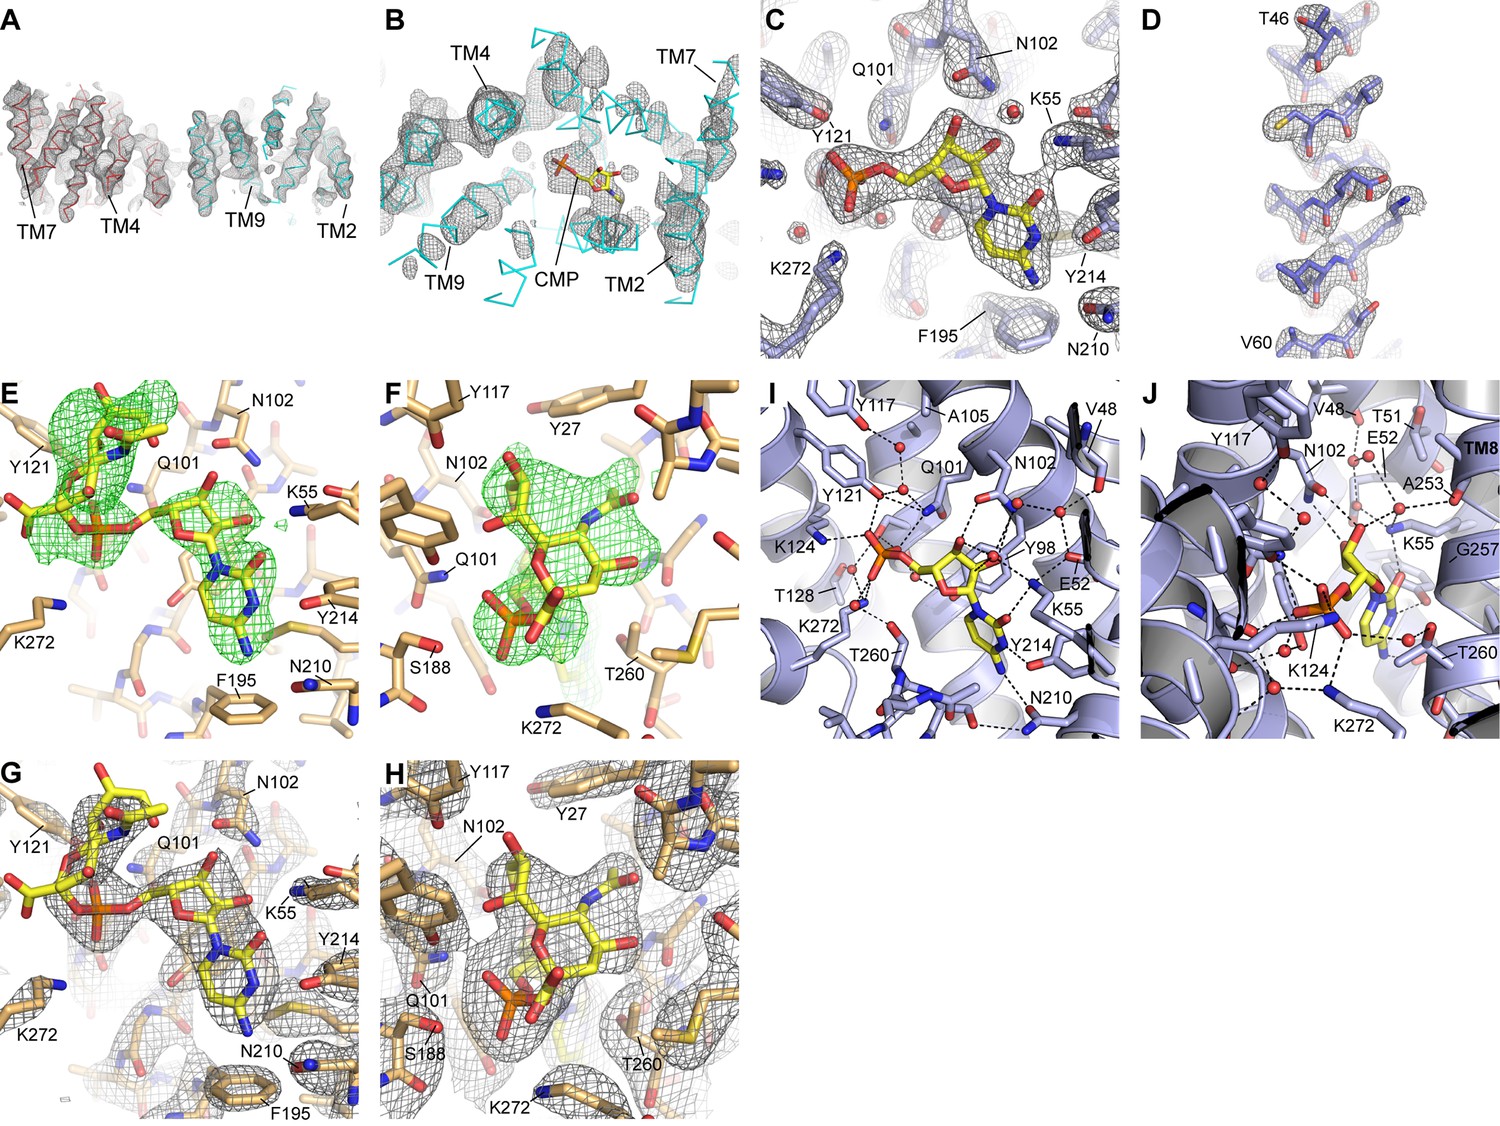
(A) A density-modified experimental map for the two mCST molecules in the asymmetric unit of the HDVD crystal is shown at 1.8σ. (B) A top-down view of one of the mCST molecules with the same map as in (A) but at 3σ to show the presence of density for CMP. (C and D) 2Fo-Fc maps of the mCST-CMP LCP crystal showing the CMP binding site (C, 1.9σ) and TM2 (D, 1.8σ). Density is seen for all 11 waters in this structure at at least 1.2σ, but only the three waters (red spheres) with density at 1.9σ are shown in (C). (E and F) Positive Fo-Fc density maps (2σ) are shown for two views of the CMP-Sia site of the mCST-CMP-Sia LCP crystal immediately after molecular replacement where the mCST-CMP structure without any ligand present was used as a search model. (G and H) 2Fo-Fc maps of the mCST-CMP-Sia LCP crystal showing the CMP-Sia binding site with a focus on the CMP moiety (G, 1.8σ) and the Sia moiety (H, 1.0σ). The density for the two waters in the CMP-Sia binding site are visible at just under 1σ, so they are not shown in these panels. The views shown in (C) and (E–H) are similar to those in Figure 3. (I and J) Two views of the CMP site of the mCST-CMP structure are shown with waters depicted as red spheres. Black lines indicate polar interaction distances within 3.2 Å.
Figure 2—figure supplement 2
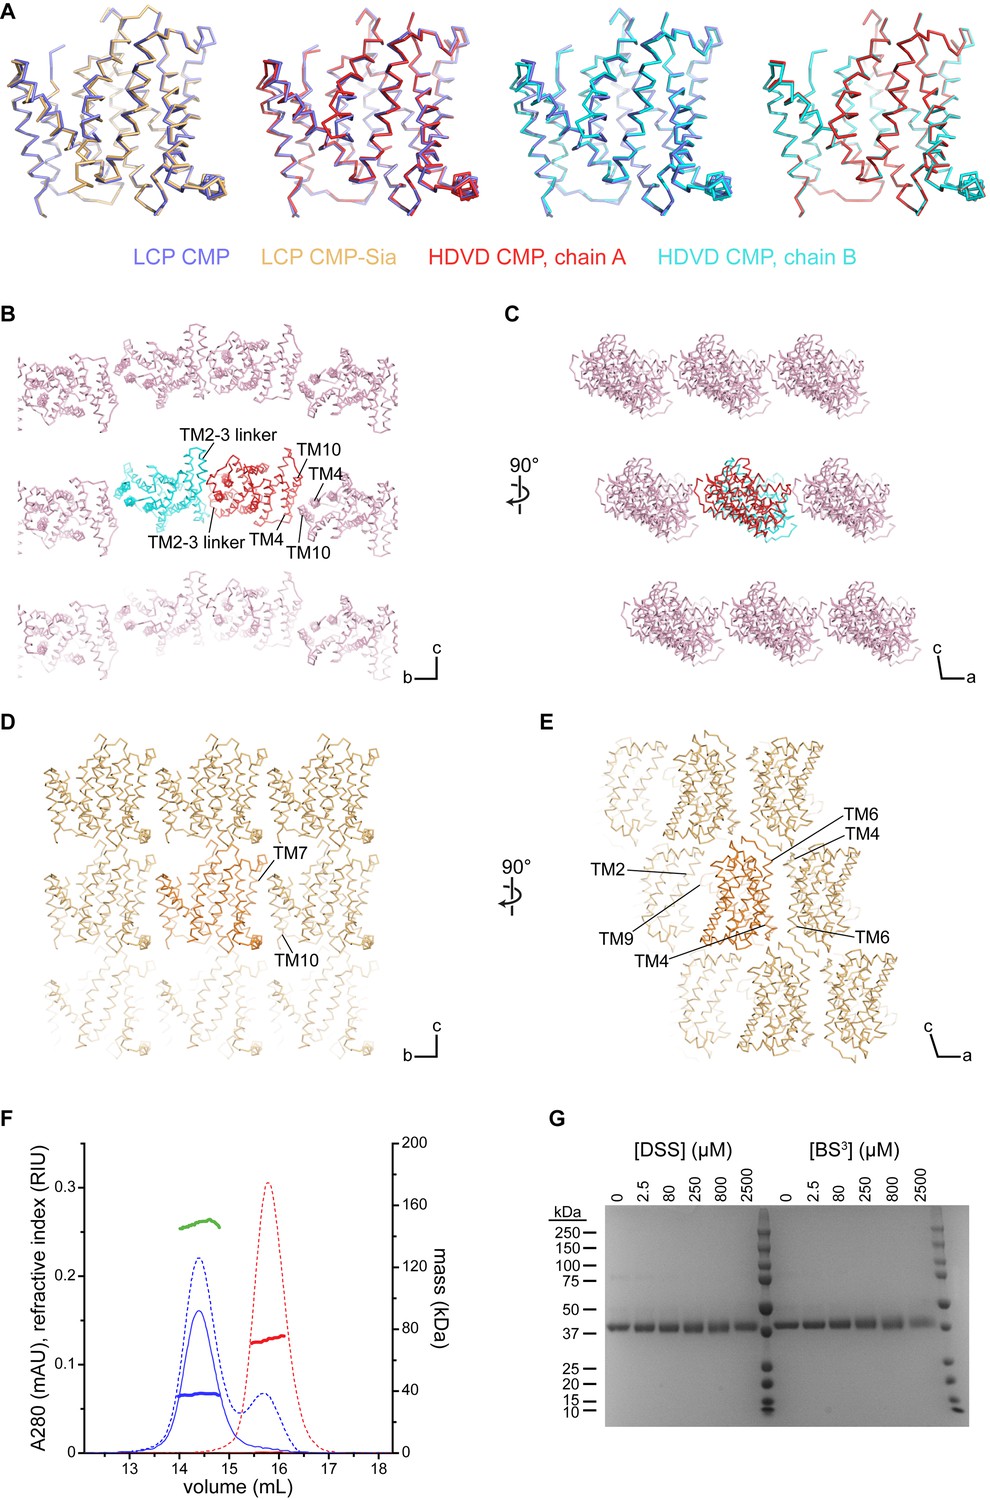
Comparison of the mCST structures and crystal lattices.
(A) Side views of the indicated structures superimposed with each other. The orientations shown are the same as in Figure 2A and B. (B–D) Various views of the lattices of the mCST-CMP HDVD crystal (B and C) and the mCST-CMP-Sia LCP crystal (D and E) are shown. TMs that interact with each other at the lattice interfaces are indicated. The lattice for the mCST-CMP LCP crystal (not shown) is very similar to the mCST-CMP-Sia one. The direction of the unit cell axes are indicated in the bottom right of each panel. In the mCST-CMP HDVD crystal, the only intramembrane interactions are along the b axis (B), whereas the mCST-CMP-Sia LCP crystal has intramembrane interactions along the b (D) and a (E) axes. The TM2-3 linker interface in (B), and all of the interactions shown in (E) are antiparallel. (F) Results from the SEC-UV/LS/RI experiment. Purified human CST (hCST, blue chromatograms), which has nearly identical biochemical properties to mCST, was run on a Superdex 200 column with A280 (solid lines), refractive index (dashed lines), and light scattering (not shown) detectors inline. For comparison, a sample of DDM micelles was also run (red chromatograms). The mass of each sample is calculated across the peak using the three-detector method and is shown as the thick horizontal lines. The calculated values are as follows: 38 kDa for the protein-only component of hCST (blue line), 149 kDa for the hCST protein-lipid-detergent complex (green line), 73 kDa for the DDM micelles (red line). (G) Coomassie-stained SDS-PAGE gel showing purified hCST that was treated with increasing amounts of either disuccinimidyl suberate (DSS) or bis(sulfosuccinimidyl)suberate (BS3). The lack of cross-linking shows it is a monomer. Lanes 7 and 14 are molecular weight standards with sizes listed on the left.
Figure 2—figure supplement 3
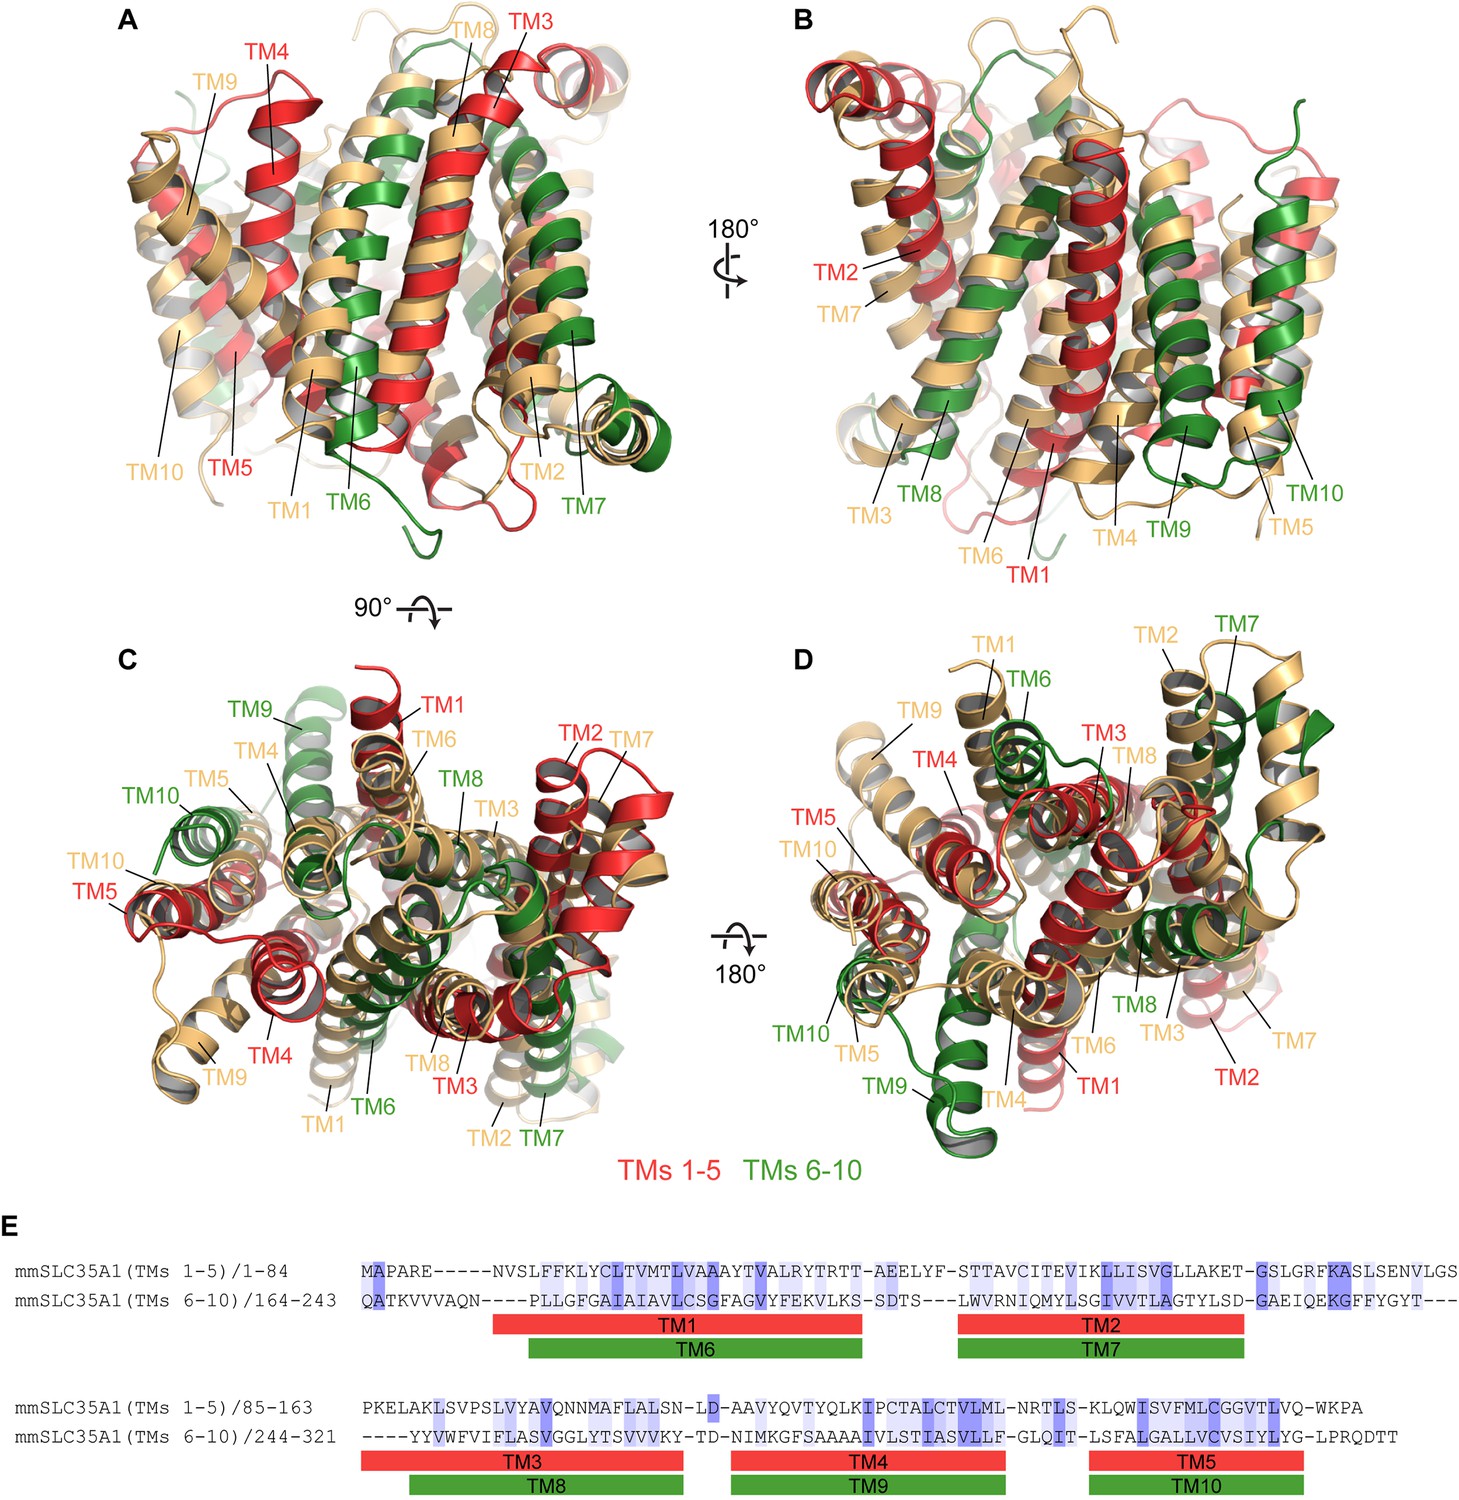
Pseudo-symmetry in mCST.
(A–D) Different views are shown where TMs 1–5 of mCST (red) are aligned to TMs 6–10 of another copy of mCST (orange). Likewise, TMs 6–10 (green) are aligned to TMs 1–5 of the orange molecule. (E) A sequence alignment of the two halves of mCST. Sequence identity and similarity is shown by the blue highlights.
Figure 3 with 2 supplements
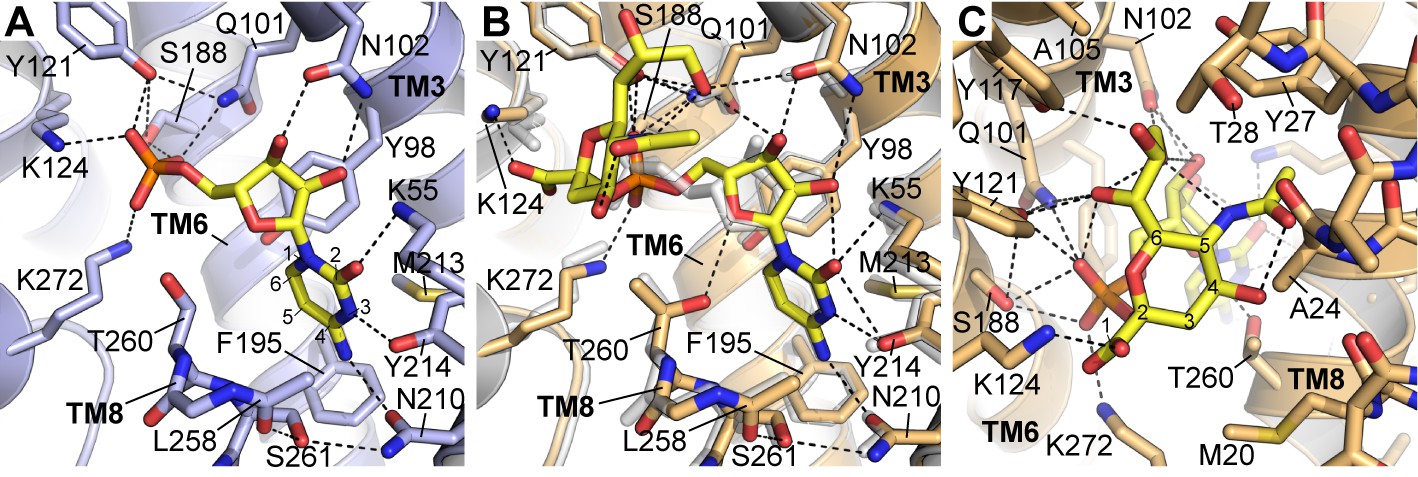
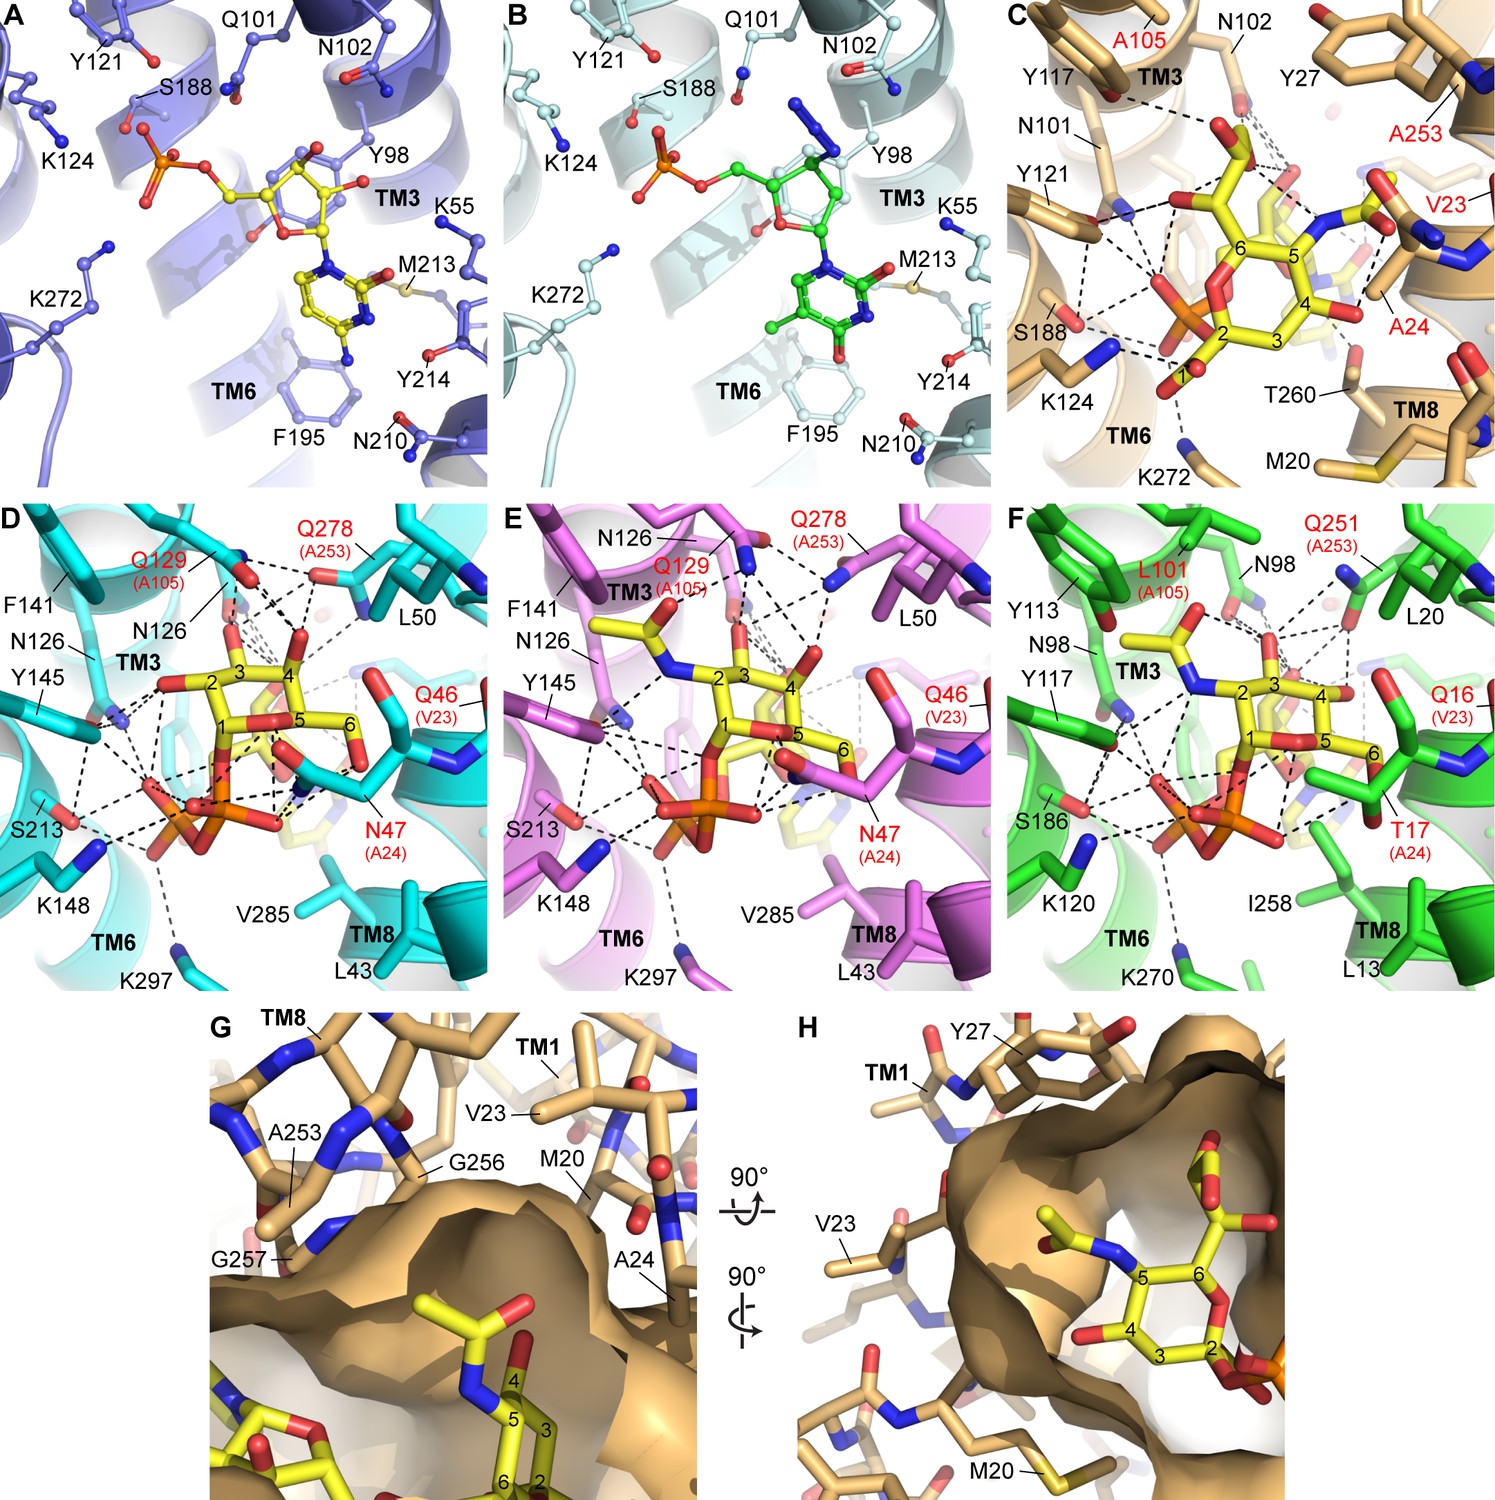
Details of CMP and CMP-Sia interactions with mCST.
Either the mCST-CMP structure (A) or the mCST-CMP-Sia structure (B, C) are shown. (B) focuses on the CMP moiety of CMP-Sia whereas a different view is shown in (C) to better show the interactions with the Sia moiety. In all panels, key interacting residues are shown and dashed black lines indicate polar interactions. In (A) and (B), parts of TM8 are not shown for clarity. In (B), the mCST-CMP structure is superimposed (light gray) to show the different position of CMP and some of the interacting side chains. In (A) and (C), the ring atoms are numbered for cytosine (A) and Sia (C). In (A), the Thr260 hydroxyl interacts with the phosphate of CMP through a water, which is not shown (see Figure 2—figure supplement 1I–J for detailed views of the water interactions). In the mCST-CMP-Sia structure (B), the Sia moiety of CMP-Sia displaces this water, which causes Thr260 to flip and interact with the ribose of the CMP moiety.
Figure 3—figure supplement 1
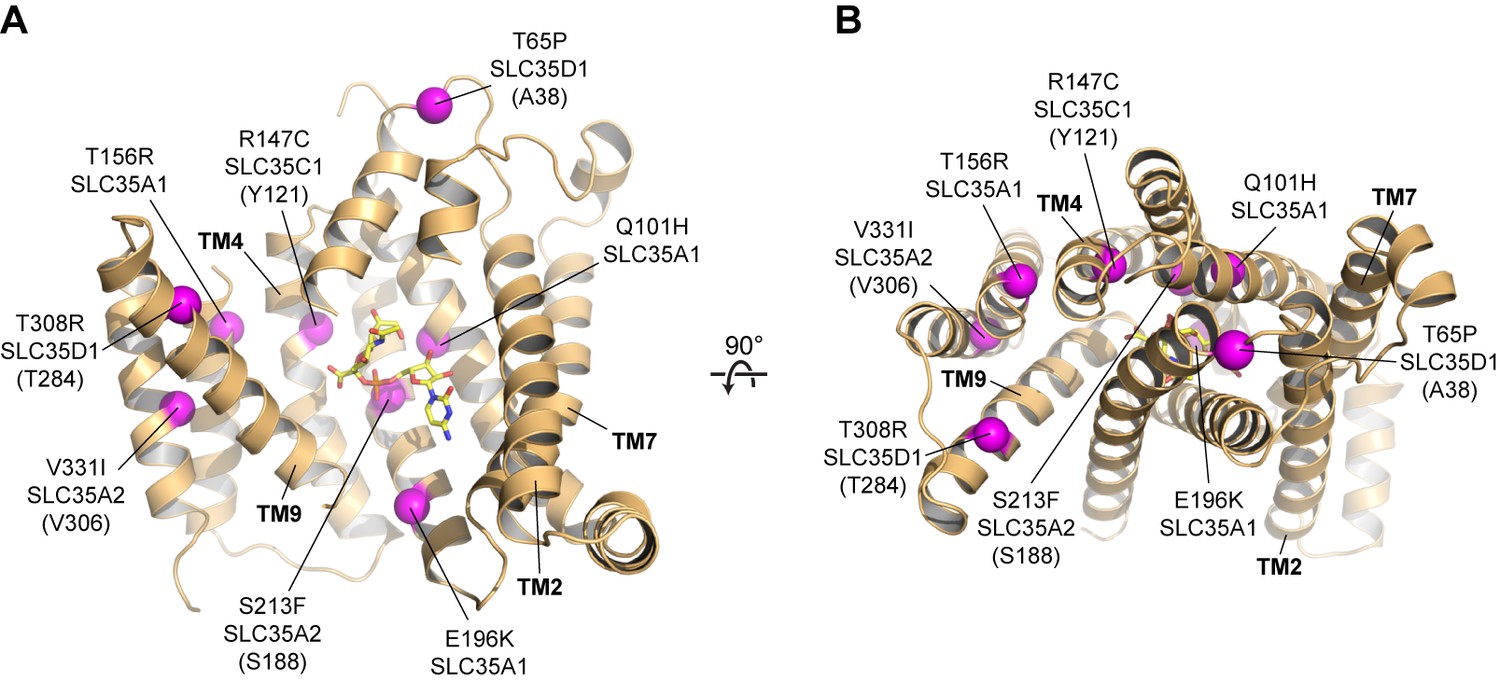
Human diseases caused by SLC35 point mutations.
Side (A) and top-down (B) views of the mCST structure are shown with purple spheres highlighting the location of disease-causing point mutations in human SLC35 genes. The orientations are the same as in Figure 2A–2C. For genes other than SLC35A1 (CST), the equivalent residue in mCST, based on a sequence alignment (Figure 1—figure supplement 2), is instead shown (and indicated in parentheses). In (A), parts of TMs 1 and 8 are not shown for clarity.
Figure 3—figure supplement 2
Homology modeling and docking of other nucleotide sugars and nucleotide analogs.
(A) As a reference, the CMP site of the mCST-CMP structure is shown. (B) In the same view as (A), azidothymidine monophosphate (AZTMP) (green carbons) is shown docked into the mCST structure. (C) As a reference, the binding site for the Sia moiety of CMP-Sia in the mCST-CMP-Sia structure is shown. (D–F) Structural homology models of UGT (D, E) and NGT (F) with UDP-Gal (D), UDP-GalNAc (E) and UDP-GlcNAc (F) docked in. In (C–D), the residues labeled with red text indicate the most significant differences among the residues that line the sugar-binding site between CST and UGT/NGT. In (D–F), the equivalent residue in CST is indicated in parentheses. (G) A top-down view of a surface representation of the Sia-binding site in the mCST-CMP-Sia structure shows the cavities on either side of the C-5 N-acetyl of Sia (Neu5Ac) that could accommodate an extra hydroxyl group from Neu5Gc. (H) A side view of the same region is shown. In (G) and (H), all of the residues that surround the C-5 N-acetyl are indicated. All of these are conserved in human CST except for Val23, which is a Met. Val23 faces the side of TM8 as well as the lipid bilayer, so the equivalent Met in human CST would likely extend into the lipid bilayer rather than dramatically affect the shape of the Sia binding pocket. However, as shown in (D–F), the Val-equivalent residue in UGT and NGT is a Gln, which would perhaps instead face the sugar-binding site.
Figure 4

Differences between the CMP and CMP-Sia structures.
(A) The mCST-CMP (blue) and mCST-CMP-Sia (orange) structures are superimposed and shown as a top-down view. CMP-Sia is shown as yellow sticks. (B–E) The surface of the CMP (shown as yellow sticks) site of the mCST-CMP-Sia structure is shown alone as an orange mesh in (B) and (D), and superimposed with the CMP site of the mCST-CMP structure, which is shown as a blue surface in (C) and (E). (F) The same comparisons are shown as in (A), highlighting the TM1-9 interface. (G) Surface views of TMs 1 and 9 are shown for mCST-CMP-Sia (orange) and mCST-CMP (blue). The magenta regions highlight atoms that are within 4 Å of each other at the interface between the two TMs. (H) The same comparisons are shown as in (A), highlighting the TM5-9-10 bundle.
Figure 5
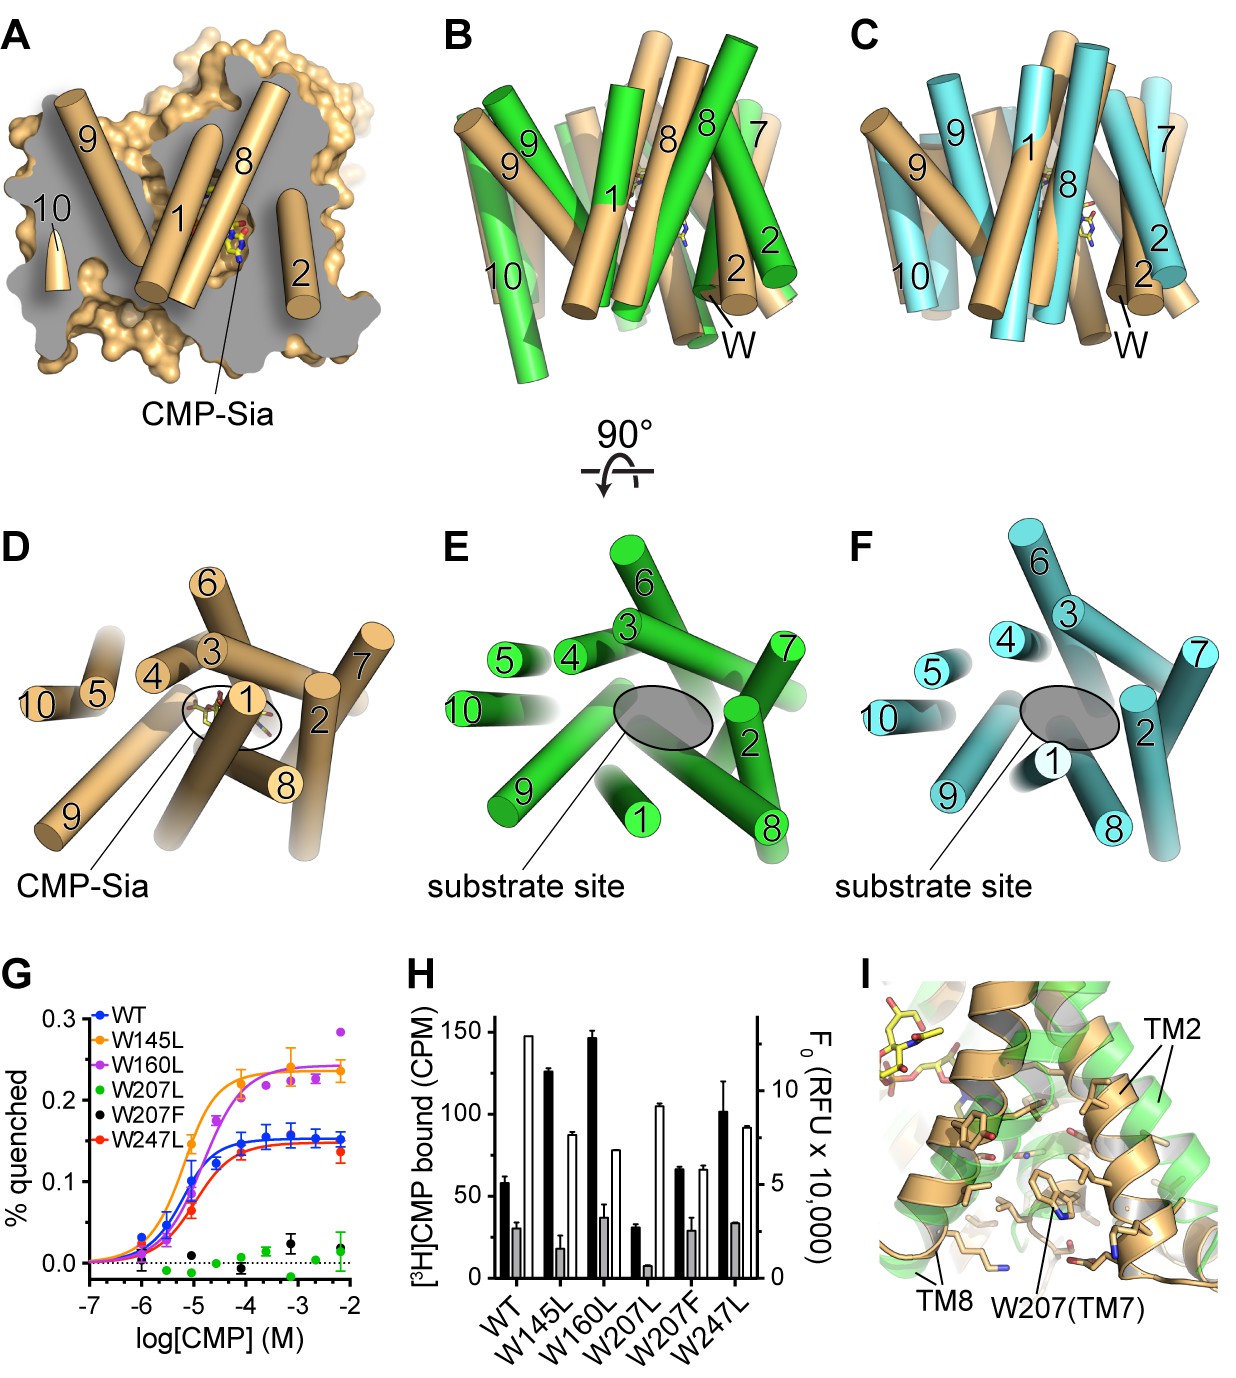
Comparison of substrate accessibility for DMT protein structures, and characterization of mCST’s intrinsic tryptophan fluorescence.
(A) The surface representation of the mCST-CMP-Sia structure from Figure 2D is reproduced. The front half of the protein that was removed to make the sliced view is put back on top of the plane of the slice with the alpha-helical TMs represented as cylinders. The TMs are numbered. (B and C) The structures of Vrg4 (B, green), and YddG (C, cyan) are superimposed with the mCST-CMP-Sia structure (orange). These side view orientations are very similar to what is shown in (A) and identical to the view in Figure 2A and B. In (A–C), the top and bottom are the lumenal and cytosolic sides, respectively. (D–F) Top-down views from the lumenal side of the Golgi membrane are shown for the mCST-CMP-Sia structure (D, orange, Vrg4 (E, green), and YddG (F, cyan). This orientation is the same as shown in Figure 2C and F. The CMP-Sia binding site is highlighted in panel (D) and the equivalent substrate-binding sites are indicated in panels (E) and (F). In panels (B–F), all TMs are also represented as cylinders and TMs are numbered. (G) Quenching of the intrinsic tryptophan fluorescence of wild-type and mutant mCST is shown as a function of CMP concentration. The lack of any quenching for either Trp207 mutant indicates that it is sensing the CMP-induced conformational changes. (H) Left axis: a SPA assay was used to determine the amount of CMP bound to wild-type and mutant mCST to give an indication as to the relative CMP affinity for the tryptophan mutants compared to wild-type mCST. The black bars represent binding in the presence of 30 nM [3H]CMP whereas the gray bars represent binding with an additional 5 µM unlabeled CMP added. CMP affinities, which were all very similar, were estimated by fitting the data to a one-site model and are listed in Table 1. These results show that the Trp207 mutants still bind CMP. Right axis: Tryptophan fluorescence in the absence of any ligand is shown for wild-type and mutant mCST. These results show that the initial, ligand-free fluorescence of the Trp207 mutants is not significantly different from wild-type. The symbols and bars in (G) and (H) represent the mean ± SEM for n = 2. (I) The location and local environment of Trp207 of mCST is shown (orange) and compared to the structure of Vrg4 (green). In (B and C) the location of Trp207 is also indicated with the ‘W’ label.
Figure 6
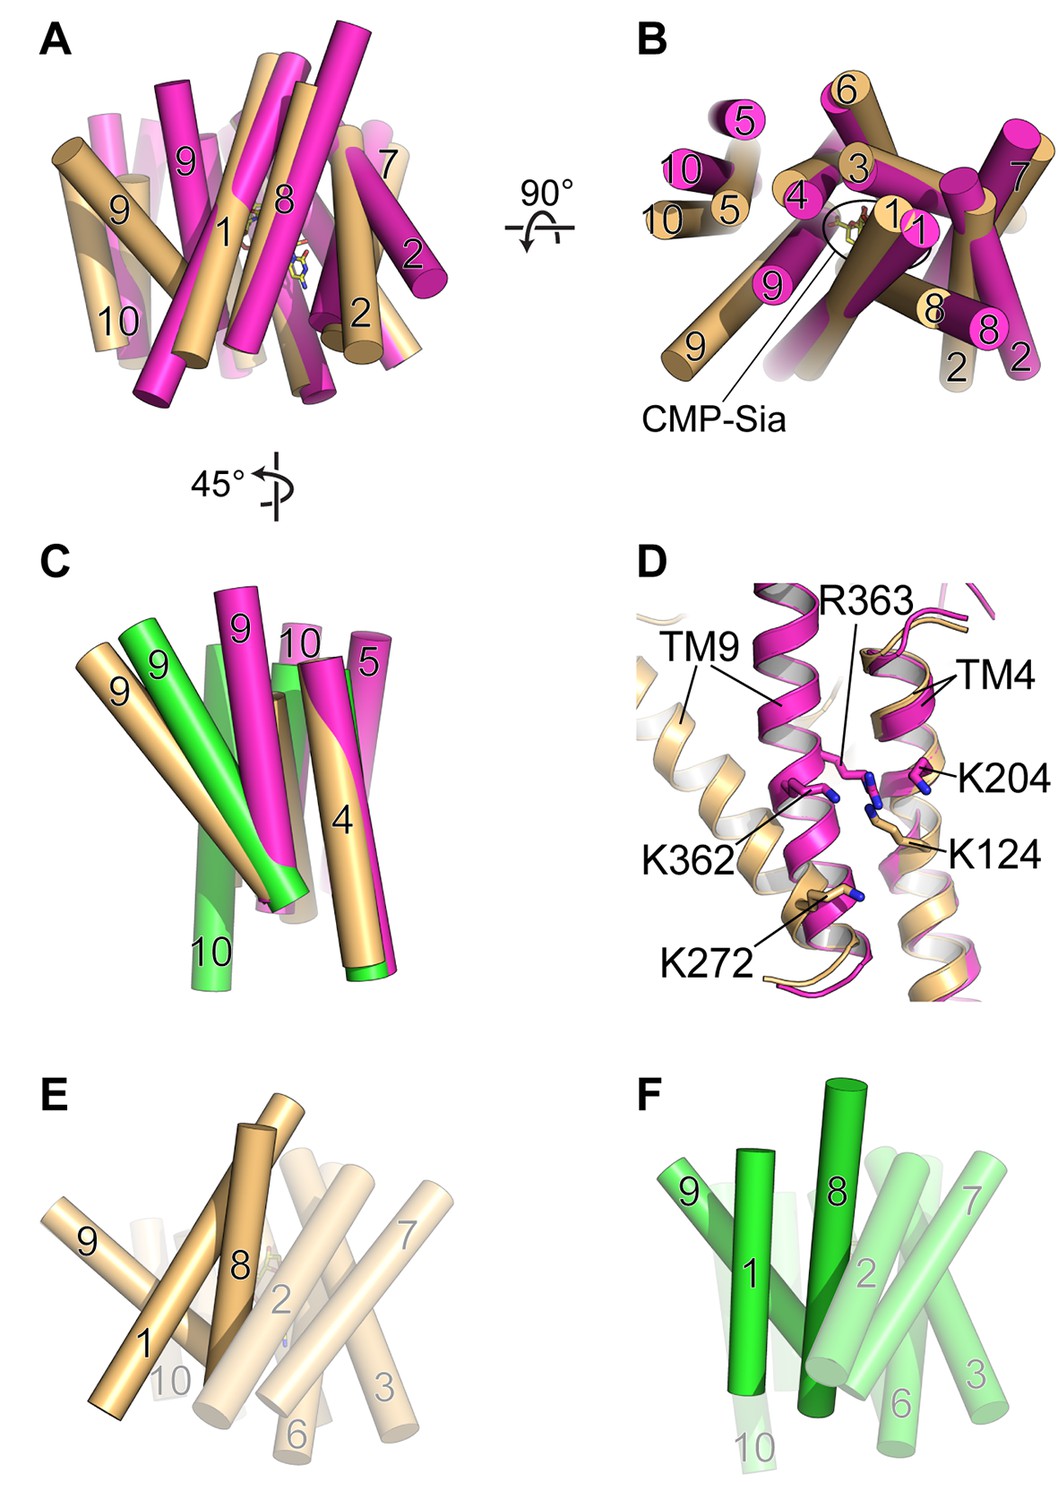
Comparison of DMT protein antiport coupling mechanisms.
(A and B) The mCST-CMP-Sia structure (orange) is superimposed with the GsTPT2 structure (magenta). A side view (A) and top-down view from the lumen (B) are shown and these orientations are the same as shown in Figure 5B–5F. In the side view in (A), the top part of the panel is the lumenal/extracellular side for mCST and GsTPT2, respectively. The bottom is the cytoplasmic side. In (B) the CMP-Sia binding site is indicated. (C) GsTPT2 (magenta) and Vrg4 (green) are superimposed with the mCST-CMP-Sia structure (orange) to show the relative orientation of TM9 with respect to TM4 in these structures. This is a side view as in panel (A) but rotated approximately 45° clockwise about a vertical axis. TMs 1–3 and 6–8 are hidden for clarity. (D) A close-up view of the same orientation as shown in (C) to show the position of Lys and Arg residues on TMs 4 and 9 in the GsTPT2 (magenta) and mCST-CMP-Sia structures (orange). (E and F) A similar 45°-rotated side view is shown for the mCST-CMP-Sia structure (D, orange) and Vrg4 (E, green). All TMs are shown but TMs 1, 8, and 9 are highlighted to show their differential arrangement in the two structures.
Figure 7
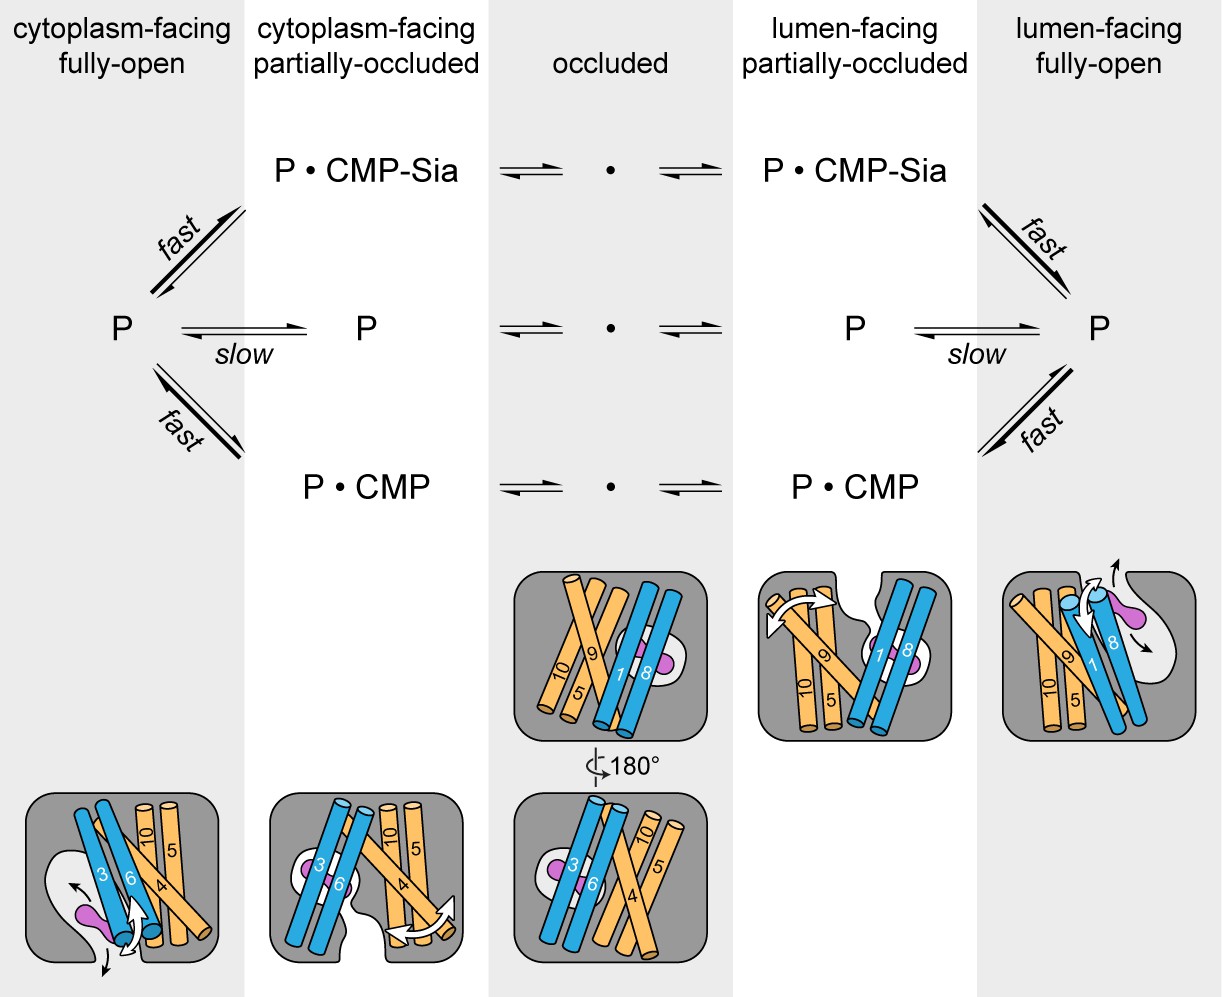
Schematic of the proposed transport cycle of mCST.
The top row indicates the five predominant conformational states that mCST is expected to occupy. Below this is a simple kinetic model of the mCST transport cycle. ‘P’ represents the protein and the substrate that is bound in each state is indicated. A cartoon representation for each state is shown at the bottom. The main domains (with numbered TMs) that change conformation to yield each state are highlighted, and the conformational changes that occur in these domains as the protein transitions between different states are indicated by the white arrows. The purple peanut represents a substrate. The alternating gray and white column bars that span the length of the figure are added as visual aids to help associate the state names with the cartoon depictions and their position in the kinetic scheme.
Tables
Table 1
Functional properties of various mCST constructs.
The Kd for the indicated ligand was determined by either: 1) a full SPA titration as shown in Figure 1A 2) fitting the two-point SPA data from Figure 5H to get a crude estimation of the Kd, or 3) fitting the tryptophan fluorescence quenching data shown in Figure 5G (Kd’s were not fit for the Trp207 mutants which showed no quenching). The Km and Vmax were determined from data shown in Figure 1C.
| Construct | Ligand | Kd (µM) | Km (µM) | Vmax (nmol/mol mCST/min) | ||
|---|---|---|---|---|---|---|
| SPA titration | SPA 2-point | Trp-FL | ||||
| mCST | CMP | 6.3 ± 1.2 | 5.5 ± 1.6 | 2.9 ± 1.1 | ||
| CMP-Sia | 482 ± 147 | 58.1 ± 13.2 | 6.5 ± 0.6 | |||
| mCST∆C | CMP | 1.8 ± 0.4 | 11.1 ± 2.9 | |||
| CMP-Sia | 295 ± 100 | 62.0 ± 14.7 | 5.3 ± 0.5 | |||
| UMP | 1621 ± 1119 | |||||
| GMP | 5376 ± 1151 | |||||
| mCST (W145L) | CMP | 0.8 ± 0.3 | 3.3 ± 1.0 | |||
| mCST (W160L) | CMP | 1.6 ± 0.4 | 11.9 ± 2.4 | |||
| mCST (W207L) | CMP | 1.5 ± 0.4 | N/D | |||
| mCST (W207F) | CMP | 3.8 ± 1.5 | N/D | |||
| mCST (W247L) | CMP | 2.4 ± 1.5 | 7.4 ± 2.6 | |||
Table 2
Data collection and refinement statistics.
https://doi.org/10.7554/eLife.45221.012| HDVD mCST-CMP | LCP mCST∆C | ||||
|---|---|---|---|---|---|
| Native | Hg | Pt | CMP | CMP-Sia | |
| Data collection | |||||
| Space group | P21 | P21 | P21 | C2 | C2 |
| Crystals (#) | 5 | 1 | 1 | 26 | 1 |
| Cell dimensions (Å) | |||||
| a | 51.82 | 51.88 | 51.50 | 50.15 | 50.42 |
| b | 193.96 | 194.00 | 193.46 | 49.53 | 50.12 |
| c | 66.44 | 66.89 | 66.31 | 137.9 | 132.33 |
| α, γ = 90; β = (°) | 101.79 | 102.16 | 101.63 | 92.65 | 91.83 |
| Resolution (Å) | 49–3.4 × 3.4 × 4.6* (3.47–3.38) | 49–3.5 × 3.5 × 5.6† (3.59–3.50) | 49–4.2 × 4.2 × 7.6† (4.31–4.20) | 47–2.58 (2.65–2.58) | 48–2.75 (2.83–2.75) |
| Rmerge | 0.07 (0.95) | 0.14 (4.03) | 0.23 (2.62) | 0.14 (0.47) | 0.13 (1.37) |
| Rpim | 0.03 (0.67) | 0.09 (2.43) | 0.14 (1.63) | 0.05 (0.28) | 0.07 (0.75) |
| I / σI | 6.7 (1.6) | 6.8 (0.5) | 4.9 (0.7) | 9.3 (2.2) | 6.0 (1.0) |
| CC1/2 in outer shell | 0.65 | 0.20 | 0.30 | 0.79 | 0.41 |
| Completeness (%) | 67.3 (4.0)* | 99.0 (99.6) | 99.9 (100) | 97.8 (79.1)‡ | 99.8 (99.4) |
| Redundancy | 3.6 (2.2) | 7.1 (7.4) | 6.8 (7.0) | 7.2 (3.3) | 4.1 (4.3) |
| MIRAS phasing§ | |||||
| Phasing power (iso/ano) | 2.39/1.16 | 1.47/0.29 | |||
| Rcullis (iso/ano) | 0.45/0.44 | 0.65/1.00 | |||
| Figure of merit (SHARP) | 0.31 | ||||
| Figure of merit (DM) | 0.89 | ||||
| Refinement | |||||
| Resolution (Å) | 49–3.4 (3.50–3.38) | 47–2.58 (2.67–2.58) | 48–2.75 (2.85–2.75) | ||
| No. reflections (No. in free set) | 11456 (573) | 10101 (514) | 8305 (404) | ||
| Rwork/Rfree | 28.9/32.1¶ (64.9/63.0)** | 24.1/25.2 (26.3/33.6) | 25.6/27.9 (37.5/37.8) | ||
| No. atoms | |||||
| Protein | 4502 | 2235 | 2244 | ||
| Ligand | 42 | 21 | 41 | ||
| Water | 0 | 11 | 3 | ||
| B-factors | |||||
| Protein | 149.4 | 47.8 | 81.1 | ||
| Ligand | 122.1 | 39.4 | 90.6 | ||
| Water | — | 42.8 | 58.9 | ||
| R.m.s. deviations | |||||
| Bond lengths (Å) | 0.007 | 0.008 | 0.007 | ||
| Bond angles (°) | 1.011 | 1.127 | 1.031 | ||
-
*The diffraction data are anisotropic. For phasing and model refinement, the data were anisotropically truncated and B-factor sharpened as described in the Methods section. The data collection and refinement statistics reflect this. The dataset was overall 94.7% (81.7% in high-resolution shell) complete before being truncated. For the truncated dataset, resolution shells up to 4.4 Å are at least 95% complete.
†The diffraction data are anisotropic; however, the datasets were left unmodified for phasing.
-
‡The lower completeness for the high-resolution shell is due to only a minority of the crystals diffracting to ~2.6 Å. Most of the crystals only diffracted to ~2.7 Å, as evidenced by the 2.72–2.65 Å shell being 98.8% complete.
§The acentric phasing power and Rcullis for the isomorphous (iso) and anomalous (ano) signals are shown. Phase figure of merits are also shown after refinement in SHARP and after density modification with DM.
-
¶The refinement statistics in this column represent the model from the LCP mCST∆C-CMP crystal being refined against the native HDVD mCST-CMP dataset.
**R-factors in the 3.81–3.64 Å and 4.26–4.01 Å shells, which are 34% and 79% complete, respectively, are 38.5/39.8% and 31.2/34.4% (Rwork/Rfree), respectively.
-
Values in parentheses are for the highest-resolution shell, unless otherwise indicated.
Table 3
Human diseases caused by mutations in NST genes.
Only point mutations are shown; however, there are many examples of other types of mutations in SLC35 genes (e.g. insertions and deletions) that lead to frameshift or premature truncations that also cause disease (see Edvardson et al., 2013; Hiraoka et al., 2007; Martinez-Duncker et al., 2005 and Online Mendelian Inheritance in Man (OMIM) database (https://omim.org)).
| Gene | Disease | Mutation | mCST residue | Biochemical phenotype | Possible mechanism based on the structure | Ref.* |
|---|---|---|---|---|---|---|
| SLC35A1 | Congenital disorder of glycosylation type IIf | Q101H | CMP-Sia transport activity reduced by 50%. | Impairs substrate interaction. | 1 | |
| SLC35A1 | Congenital disorder of glycosylation type IIf | T156R | CMP-Sia transport activity reduced by 9-fold. | Impairs conformational transitions during transport. | 2 | |
| SLC35A1 | Congenital disorder of glycosylation type IIf | E196K | CMP-Sia transport activity reduced by 9-fold. | Impairs conformational transitions during transport. | 2 | |
| SLC35A2 | Epileptic encephalopathy | S213F | S188 | No UDP-Gal transport observed. | Impairs substrate interaction. | 3 |
| SLC35A2 | Congenital disorder of glycosylation type IIm | V331I | V306 | UDP-Gal transport reduced by at least 60%. | Impairs conformational transitions during transport. | 4 |
| SLC35C1 | Congenital disorder of glycosylation type IIc | R147C | Y121 | Does not rescue fucosylation in cells lacking GDP-fucose transport. | Impairs substrate interaction. | 5, 6 |
| SLC35C1 | Congenital disorder of glycosylation type IIc | T308R | T284 | Does not rescue fucosylation in cells lacking GDP-fucose transport. | Impairs conformational transitions during transport. | 6, 7 |
| SLC35D1 | Schneckenbecken dysplasia | T65P | A38 | Near-complete loss of transport activity. | Impairs conformational transitions during transport. | 8 |
-
*References: 1 (Mohamed et al., 2013), 2 (Ng et al., 2017), 3 (Kodera et al., 2013), 4 (Ng et al., 2013), 5 (Lühn et al., 2001), 6 (Lübke et al., 2001), 7 (Etzioni et al., 2002), 8 (Furuichi et al., 2009)
Key resources table
| Reagent type (species) or resource | Designation | Source or reference | Identifiers | Additional information |
|---|---|---|---|---|
| Gene (Mus musculus) | Slc35a1;CMP-sialic acid transporter;mCST;mCST∆C | Biobasic | Uniprot:Q61420 | |
| Recombinant DNA reagent | pPICZ | ThermoFisher | cat# V19020 | |
| Strain, strain background (Pichia pastoris) | SMD1168H | ThermoFisher | cat# C18400 | |
| Chemical compound, drug | Cytidine 5'-monophosphate; CMP | Sigma-Aldrich | cat# C1006 | |
| Chemical compound, drug | Cytidine 5'-monophospho-N-acetylneuraminic acid; CMP-sialic acid; CMP-Sia | Carbosynth | cat# MC04391 | |
| Chemical compound, drug | [3H] CMP | American Radiolabeled Chemicals | cat# ART0342 | |
| Chemical compound, drug | [3H] CMP-sialic acid | American Radiolabeled Chemicals | cat# ART0147 | |
| Chemical compound, drug | cytidine | Sigma-Aldrich | cat# C122106 | |
| Chemical compound, drug | sialic acid | Fisher | cat # ICN15142450 | |
| Chemical compound, drug | Uridine 5′-monophosphate; UMP | Sigma-Aldrich | cat# U6375 | |
| Chemical compound, drug | Guanosine 5′-monophosphate; GMP | Sigma-Aldrich | cat# G8377 | |
| Peptide, recombinant protein | Antarctic phosphatase | New England Biolabs | cat# M0289S | |
| Software, algorithm | XDS | doi: 10.1107/S0907444909047337 | SCR:015652 | |
| Software, algorithm | Pointless | doi: 10.1107/S090744491003982 | SCR:014218 | |
| Software, algorithm | Aimless | doi: 10.1107/S0907444913000061 | SCR:015747 | |
| Software, algorithm | CCP4i | doi: 10.1107/S0907444910045749 | SCR:007255 | |
| Software, algorithm | XSCALE | doi: 10.1107/S0907444909047337 | SCR:015652 | |
| Software, algorithm | UCLA anisotropy server | doi: 10.1073/pnas.0602606103 | https://services.mbi.ucla.edu/anisoscale/ | |
| Software, algorithm | HKL2Map | doi: 10.1107/S0021889804018047 | ||
| Software, algorithm | SHELX | doi: 10.1107/S0108767307043930 | SCR:014220 | |
| Software, algorithm | SHARP | doi: 10.1107/S0907444903017694 | ||
| Software, algorithm | DM | doi: 10.1107/S090744499500761X | ||
| Software, algorithm | Coot | doi: 10.1107/S0907444910007493 | SCR:014222 | |
| Software, algorithm | Refmac | doi: 10.1107/S0907444911001314 | SCR:014225 | |
| Software, algorithm | Phaser | doi: 10.1107/S0021889807021206 | SCR:014219 | |
| Software, algorithm | MolProbity | doi: 10.1107/S0907444909042073 | SCR:014226 | |
| Software, algorithm | Phenix | doi: 10.1107/S0907444909052925 | SCR:014224 | |
| Software, algorithm | PyMOL | pymol.org | SCR:000305 | |
| Software, algorithm | SWISS-MODEL webserver | doi: 10.1093/nar/gky427 | SCR:013032 | https://swissmodel.expasy.org/ |
| Software, algorithm | AutoDock4 | doi: 10.1002/jcc.21256 | SCR:012746 |
Additional files
-
Transparent reporting form
- https://doi.org/10.7554/eLife.45221.021
Download links
A two-part list of links to download the article, or parts of the article, in various formats.
Downloads (link to download the article as PDF)
Open citations (links to open the citations from this article in various online reference manager services)
Cite this article (links to download the citations from this article in formats compatible with various reference manager tools)
Structural basis for mammalian nucleotide sugar transport
eLife 8:e45221.
https://doi.org/10.7554/eLife.45221


