Fetal and trophoblast PI3K p110α have distinct roles in regulating resource supply to the growing fetus in mice
- University of Cambridge, United Kingdom
- The Babraham Institute, United Kingdom
- The Rosie Hospital, United Kingdom
- University of Calgary, Canada
Figures
Figure 1 with 1 supplement

Successful modulation of p110α expression in the conceptus.
(A–B) Validation that Cyp19Cre (A) and Meox2Cre (B) are active in opposite compartments in the conceptus by crossing lines to the tdTomato reporter and assessing placentas and fetuses on day 16 of pregnancy. Boxes in A and B are shown in high magnification in i and ii, respectively. Scale bar for fetuses and placentas in A and B = 2 mm and 1 mm, in i and ii = 200 μm, and in iii and iv = 20 μm, respectively. (C) qRT-PCR for Pik3ca gene normalized to Gapdh in whole homogenates of fetus and placenta of Het-P, Het-F, Het-U and Hom-P mutants on day 19 of pregnancy, expressed as a ratio of their respective wild-type control (WT, denoted as a dotted line). Gapdh expression was not affected by genotype. *p<0.05, **p<0.01, and ***p<0.001 versus WT, unpaired t test. n ≥ 4 per genotype. Het-F = heterozygous deficiency in the fetus, Het-P = heterozygous deficiency in the placenta, Het-U = heterozygous deficiency in the fetus and placenta, Hom-P = heterozygous deficiency in the fetus and homozygous deficiency in the placenta, Jz = Junctional zone, Lz = Labyrinth zone, T = Trophoblast.
-
Figure 1—source data 1
Summary of the mouse strains and experimental crosses used in the study.
* Note for Cyp19Cre mutants (Het-P and Hom-P) the frequency is actually ~half than stated, due to mosaic activity of this Cre line.
- https://doi.org/10.7554/eLife.45282.004
Figure 1—figure supplement 1
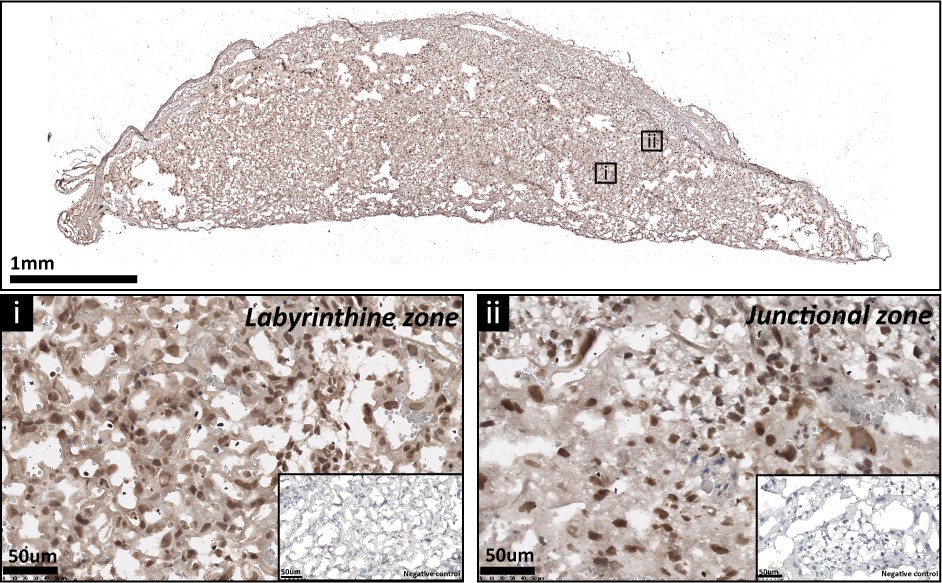
The expression of p110α protein by the mouse placenta on day 19 of pregnancy.
Representative stained section shown with negative control shown in the figure inset.
Figure 2
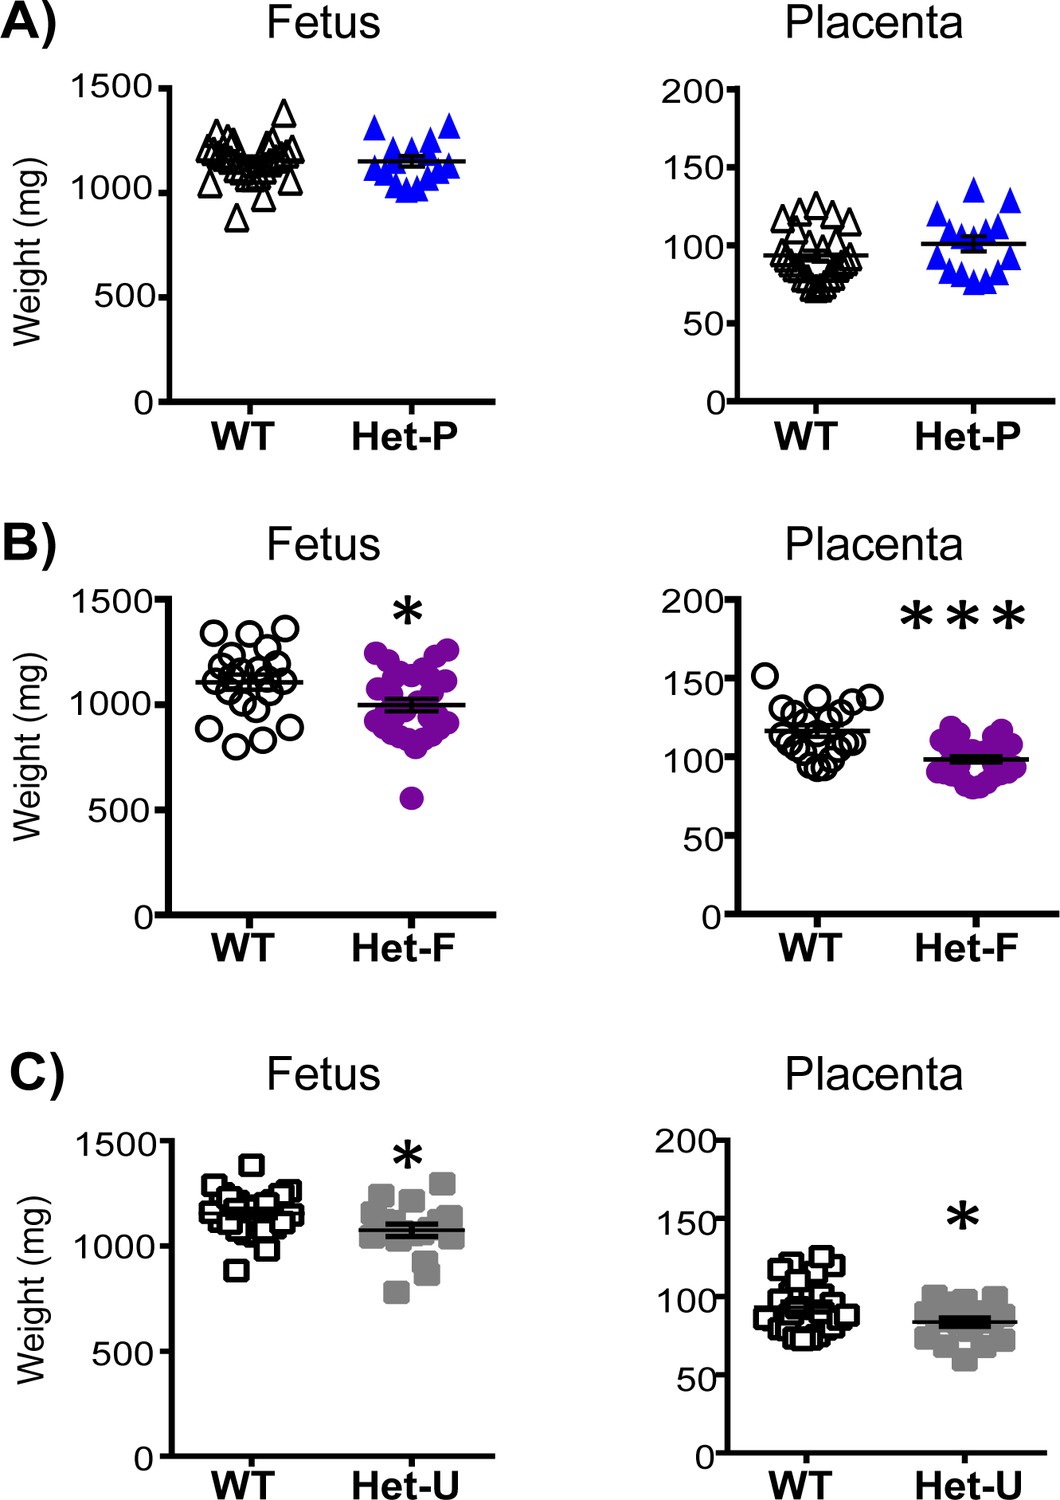
Feto-placental growth is regulated by fetal but not trophoblast p110α.
(A) Het-P (n = 15) compared to WT (n = 26) (B), Het-F (n = 30) compared to WT (n = 21) and (C) Het-U (n = 18) compared to WT (n = 26) on day 19 of pregnancy. *p<0.05 and ***p<0.001 versus WT, unpaired t test. Note, there was no significant difference in fetal weight between Het-F and WT when data were analyzed by paired t test. Data from individual conceptuses are shown and the mean is denoted as a horizontal line with SEM.
Figure 3 with 1 supplement

Placental morphology is regulated by both fetal and trophoblast p110α.
(A) Het-P, (B) Het-F and (C) Het-U placental morphology on day 19 of pregnancy as determined by stereology. *p<0.05, **p<0.01, and ***p<0.001 versus WT, unpaired t test. Data presented as means ± SEM. Scale bar for hematoxylin and eosin-stained placental cross-sections is 500 μm. 6–10 placentas were assessed for each genotype for labyrinthine zone (Lz) volume and 4–5 analysed for Lz morphology.
Figure 3—figure supplement 1
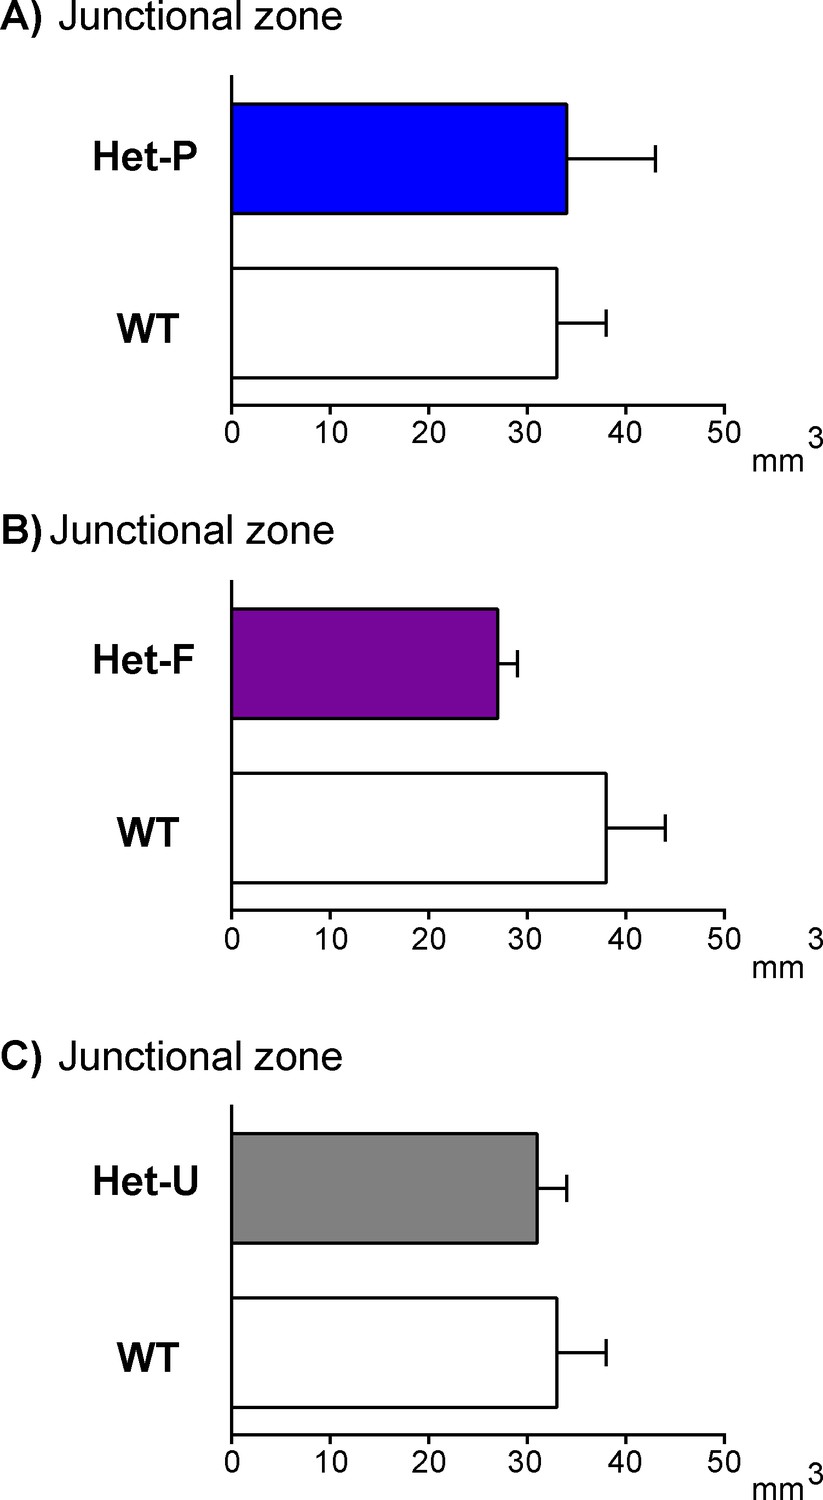
Junctional zone volume is not modified by fetal and/or trophoblast loss of p110α.
Placental junctional zone volume on day 19 of pregnancy in Het-P (A), Het-F (B) and Het-U (C). n ≥ 6 placentas were assessed for each genotype. Data are presented as means ± SEM.
Figure 4 with 1 supplement

Placental nutrient transfer is adaptively increased in response to fetal and/or trophoblast loss of p110α.
(A–F) The capacity of the placenta to transport 3H-methyl-D glucose (MeG) and 14C-amino isobutyric acid (MeAIB) relative to surface area available or to fetal weight (D–F) on day 19 of pregnancy for Het-P (n = 15) (A, D), Het-F (n = 24) (B, E) and Het-U (n = 16) (C, F), expressed as a ratio of their respective WT control values (denoted as a dotted line, n = 21, 18 and 21, respectively). DPM = disintegrations per minute. *p<0.05 and ***p<0.001 versus WT, unpaired t test. Data presented as means ± SEM.
Figure 4—figure supplement 1
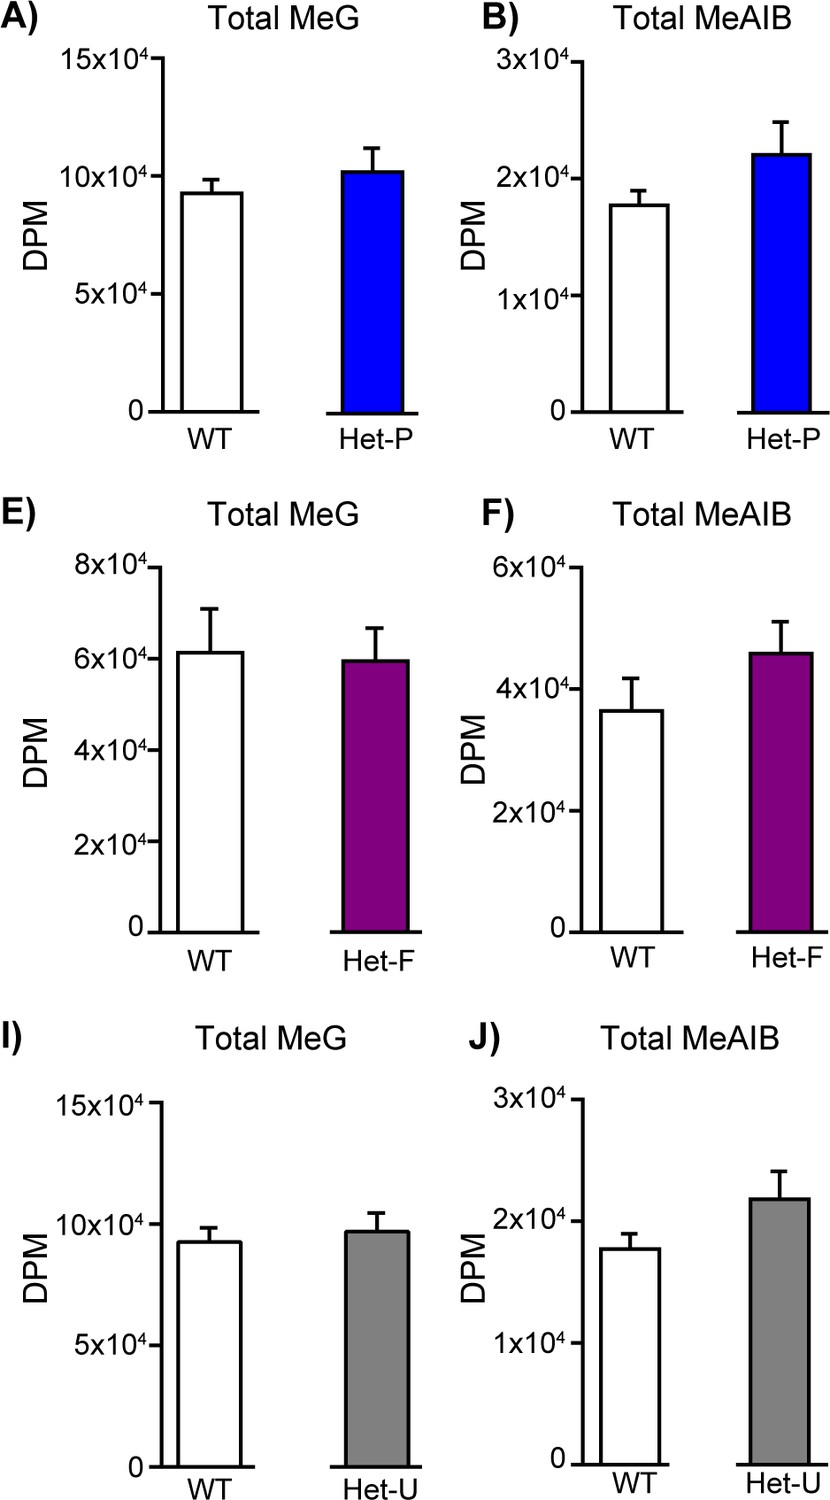
Total solute accumulation in response to fetal and/or trophoblast loss of p110α.
The accumulation of 3H-methyl-D glucose (MeG) and 14C-amino isobutyric acid (MeAIB) on day 19 of pregnancy for Het-P (n = 15) (A, D), Het-F (n = 24) (B, E) and Het-U (n = 16) (C, F) with their respective WT control values (n = 21, 18 and 21, respectively). DPM = disintegrations per minute. Data presented as means ± SEM.
Figure 5 with 1 supplement

Retaining trophoblast p110α is critical for the ability of the placenta to increase amino acid transport.
MeG and MeAIB transport relative to surface area available (A) or to fetal weight (B) on day 19 of pregnancy in Hom-P (n = 16), expressed as a ratio of Het-U control values (denoted as a dotted line, n = 16). DPM = disintegrations per minute. *p<0.05 versus Het-U, unpaired t test.
-
Figure 5—source data 1
The effect of deleting the remaining p110α from trophoblast in Hom-P on placental transport capacity relative to WT and Het-P.
Placental transport of 3H-methyl-D glucose (MeG) and 14C-amino isobutyric acid (MeAIB) relative to surface area available or to fetal weight on day 19 of pregnancy is shown as a ratio of WT values. Hom-P * versus WT or † versus Het-P. *p<0.05, †p<0.05 and †††p<0.001, unpaired t test. DPM = disintegrations per minute. Data are from n ≥ 15 and presented as means ± SEM.
- https://doi.org/10.7554/eLife.45282.016
Figure 5—figure supplement 1
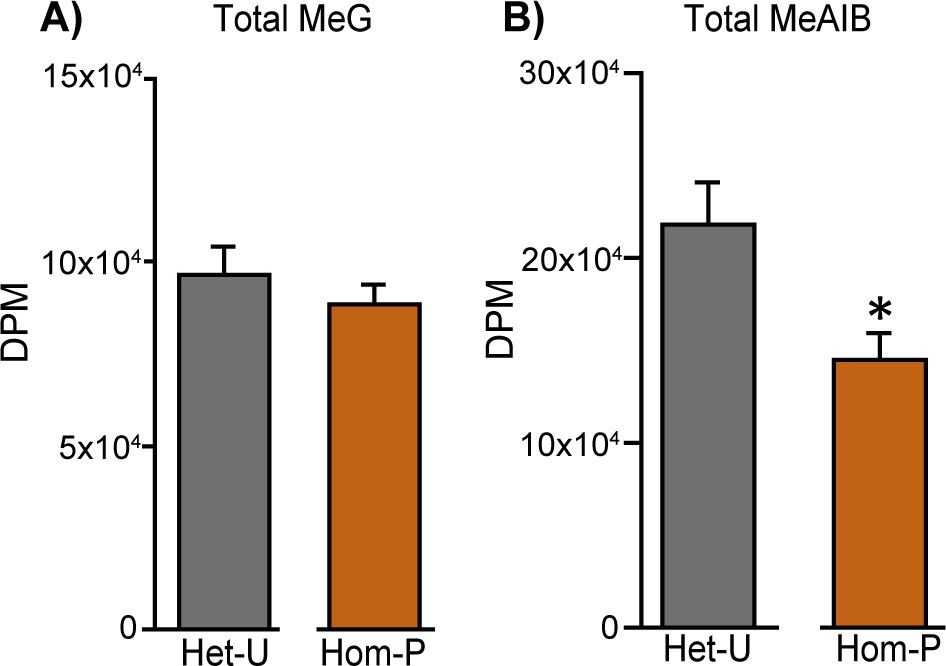
Total solute accumulation in Het-U versus Hom-P.
MeG and MeAIB accumulation on day 19 of pregnancy in Het-U control values (n = 16) and Hom-P (n = 16). DPM = disintegrations per minute. *p<0.05 versus Het-U, unpaired t test.
Figure 6 with 3 supplements
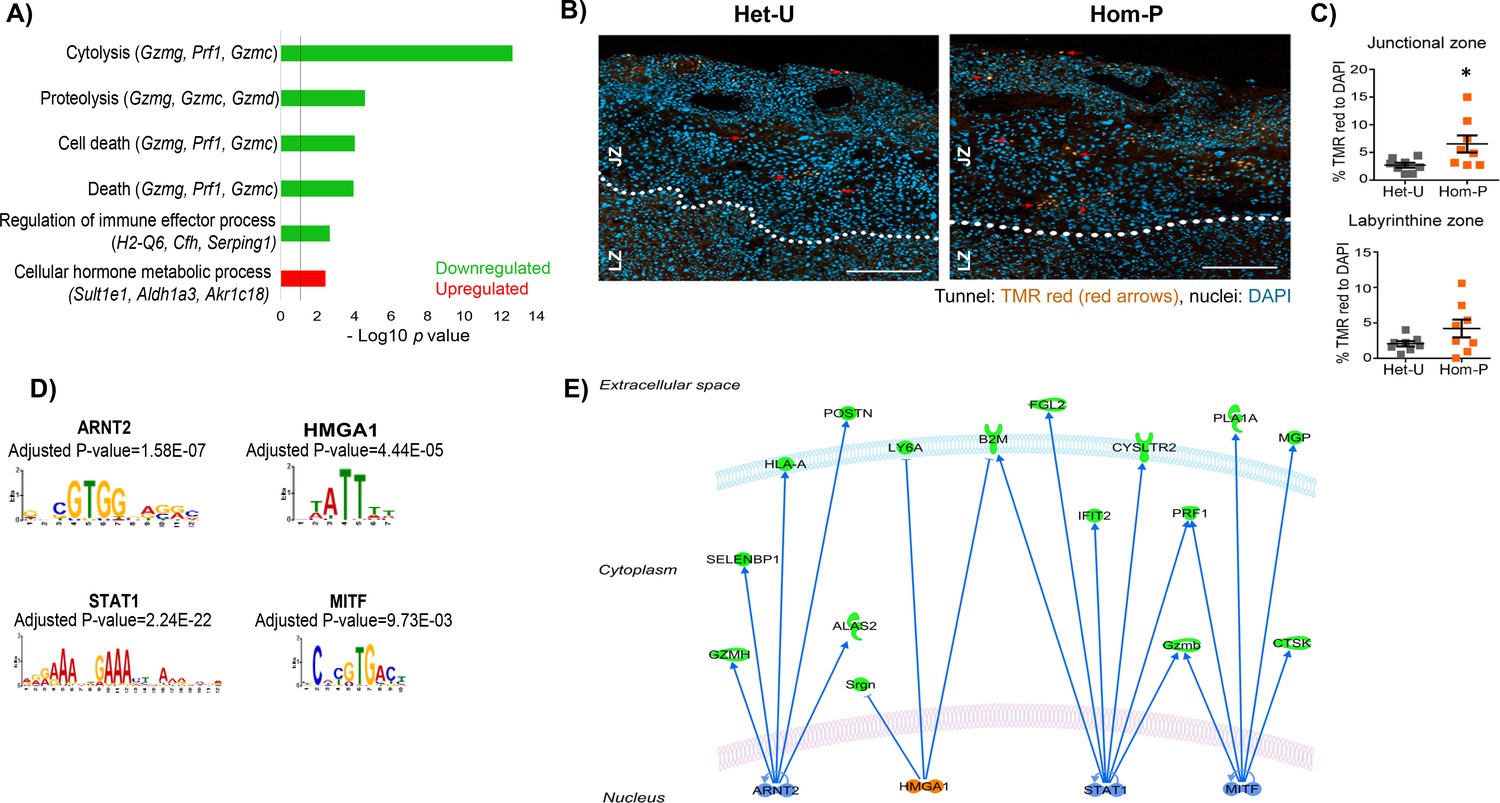
Genes downstream of p110α in the trophoblast implicated in changes in placental phenotype on day 19 of pregnancy.
(A) Top-scoring biological processes enriched in Hom-P (n = 4) versus Het-U (n = 5) placentas on day 19 determined by RNA-seq (see also Figure 6—source data 1). GO terms enriched in up-regulated genes shown in red and those down-regulated in green. Three genes with the highest fold expression changes are indicated in parentheses. The line corresponds to p=0.05. (B) Representative photomicrographs of increasing magnification of cells in the placenta undergoing apoptosis in situ in Het-U and Hom-P mutants on day 19 of pregnancy. Arrows indicate cells undergoing cell death (Tunnel: TMR red, nuclei: DAPI). (C) Quantification of cells in the placenta undergoing apoptosis in situ for Het-U (n = 8) versus Hom-P (n = 8) on day 19 of pregnancy. Scale bar = 200 μm, Tunnel: TMR red, nuclei: DAPI, Jz = Junctional zone, Lz = labyrinth zone. *p<0.05, unpaired t test. Data presented as individual values with means ± SEM shown. (D) Transcription factors with binding sites enriched at the promoters of differentially expressed genes, as identified by Analysis of Motif Enrichment (AME). (E) Regulatory network built with the four TFs identified by AME analysis using ingenuity pathway analysis. In green are shown proteins that are down-regulated at mRNA level in Hom-P versus Het-P placentas, in blue are depicted TFs predicted as repressors and in orange TFs predicted as activators.
-
Figure 6—source data 1
List of differentially expressed genes obtained by RNA-seq comparing 5 Het-U and 4 Hom-P placentas on day 19 of pregnancy.
- https://doi.org/10.7554/eLife.45282.021
Figure 6—figure supplement 1
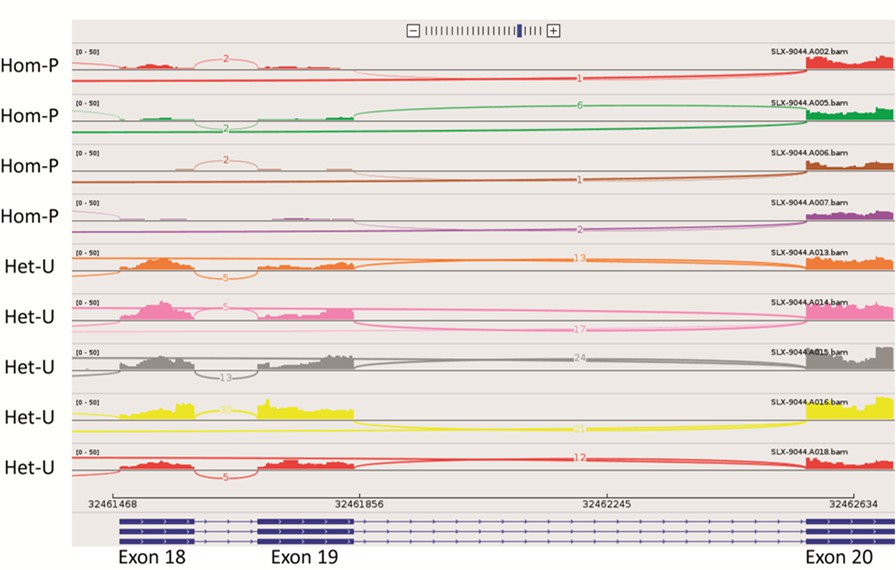
Sashimi plot showing RNA-seq reads for exons 18-20 of Pik3ca for the 4 Hom-P and 5 Het-U placentas analysed on day 19 of pregnancy.
https://doi.org/10.7554/eLife.45282.018
Figure 6—figure supplement 2
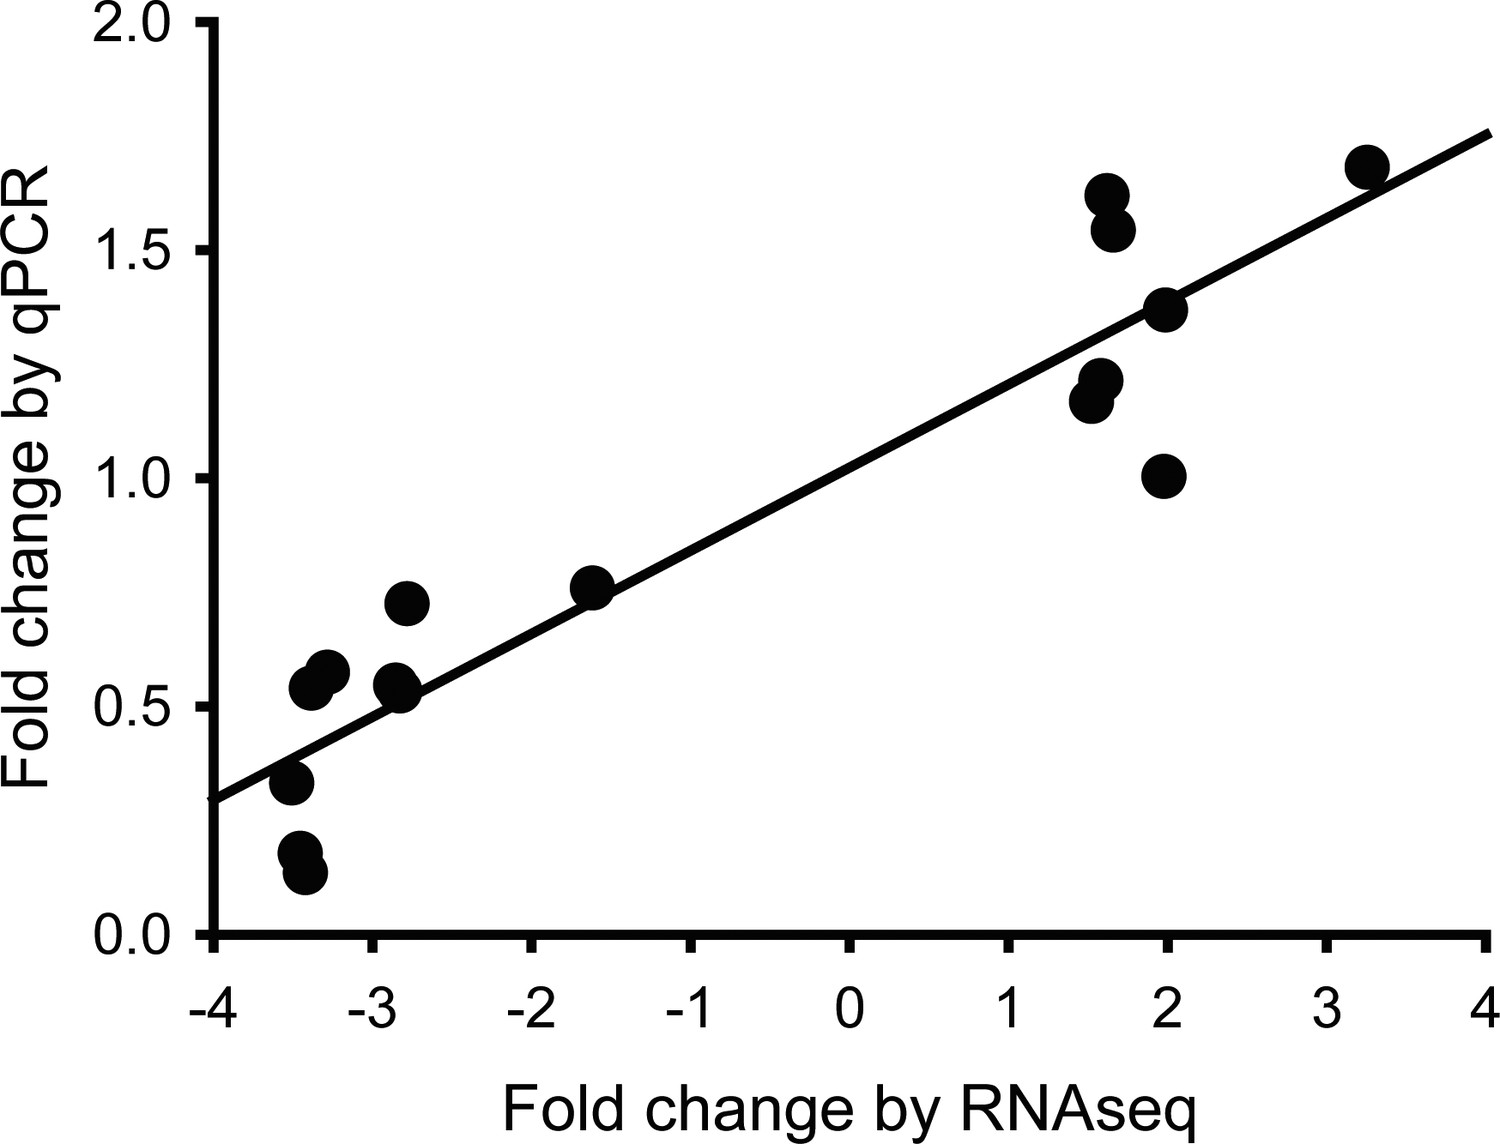
Validation of RNA-seq data.
Validation performed by qRT-PCR for 16 genes by plotting the average FKPM values against the average fold change values of both technical and independent biological Het-U (n=5 and n=4, respectively) and Hom-P (n=4 and n=3, respectively) placental replicates on day 19 of pregnancy.
Figure 6—figure supplement 3
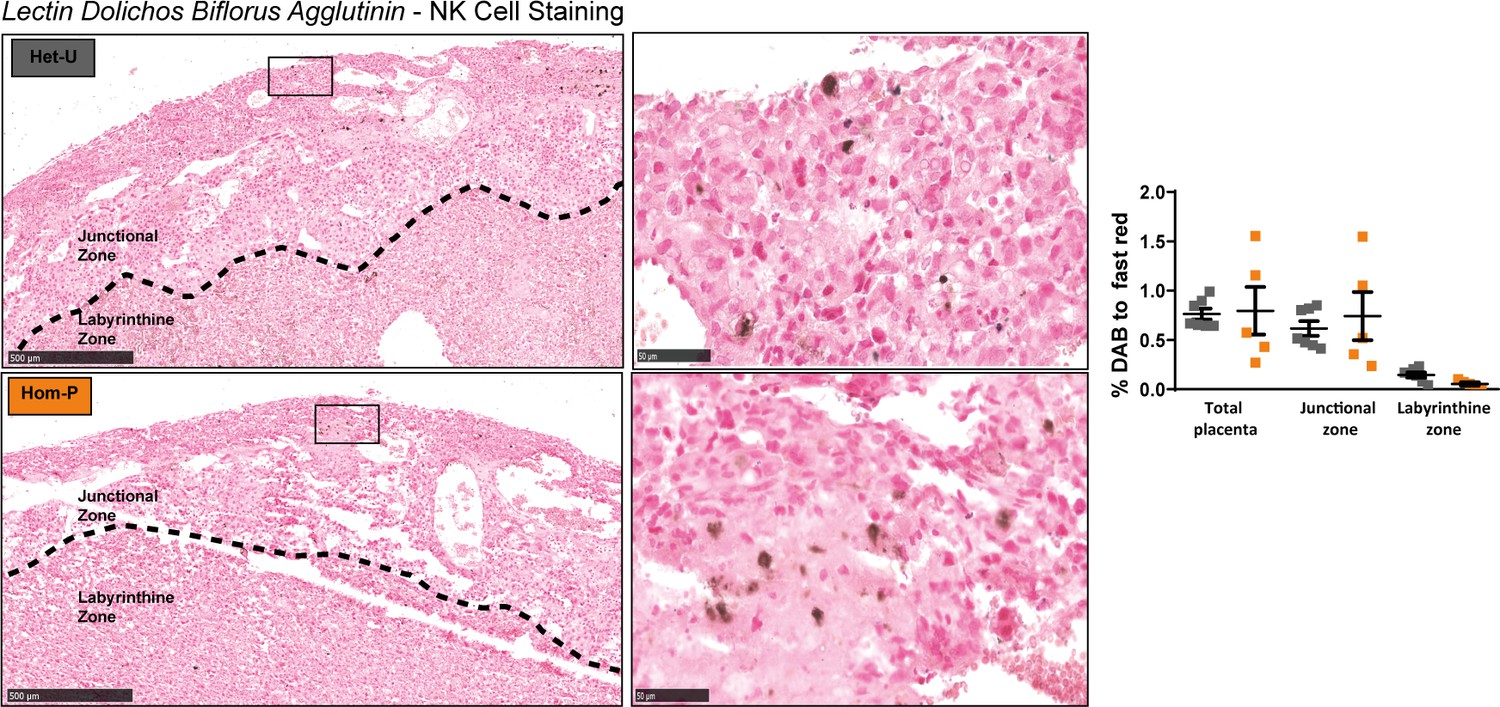
Abundance of uterine natural killer cells in Hom-P versus Het-U placentas.
Representative sections stained with Dolichos biflorus agglutinin (DBA) to identify uterine natural killer cells on day 19 of pregnancy. Data presented as individual values with means ± SEM shown. n = 7 for Het-U and n = 5 for Hom-P.
Figure 7 with 2 supplements

PI3K p110α differentially affects the expression of genes in the trophoblast and fetal cell lineages.
(A) Details of CRISPR/Cas9 design to delete exons 18–19 of Pik3ca in trophoblast or embryonic stem cells (TSC and ESC, respectively). The deletion in TSC (trophoblast stem cells) and ESC (embryonic stem cells) was confirmed by (B) qRT-PCR analysis of exons 18–19 of Pik3ca and (C) by Western blotting for p110α. (D) The expression of candidate genes in Pi3kca wildtype (WT) and mutant (Mut) TSC (n = 5 and n = 4, respectively) and ESC (n = 4 and n = 3, respectively). Data in (D) are normalized against housekeeping Sdha. *p<0.05, ****p<0.0001, two-ways ANOVA analysis followed by Fisher post hoc test. Data presented as means ± SEM.
-
Figure 7—source data 1
Functional predictions for the candidate genes enriched in trophoblast and embryonic stem cells cells (TSC and ESC, respectively).
- https://doi.org/10.7554/eLife.45282.025
-
Figure 7—source data 2
Primer sequence for RT-qPCR, PCR screening and CRISPR gRNAs target.
- https://doi.org/10.7554/eLife.45282.026
Figure 7—figure supplement 1
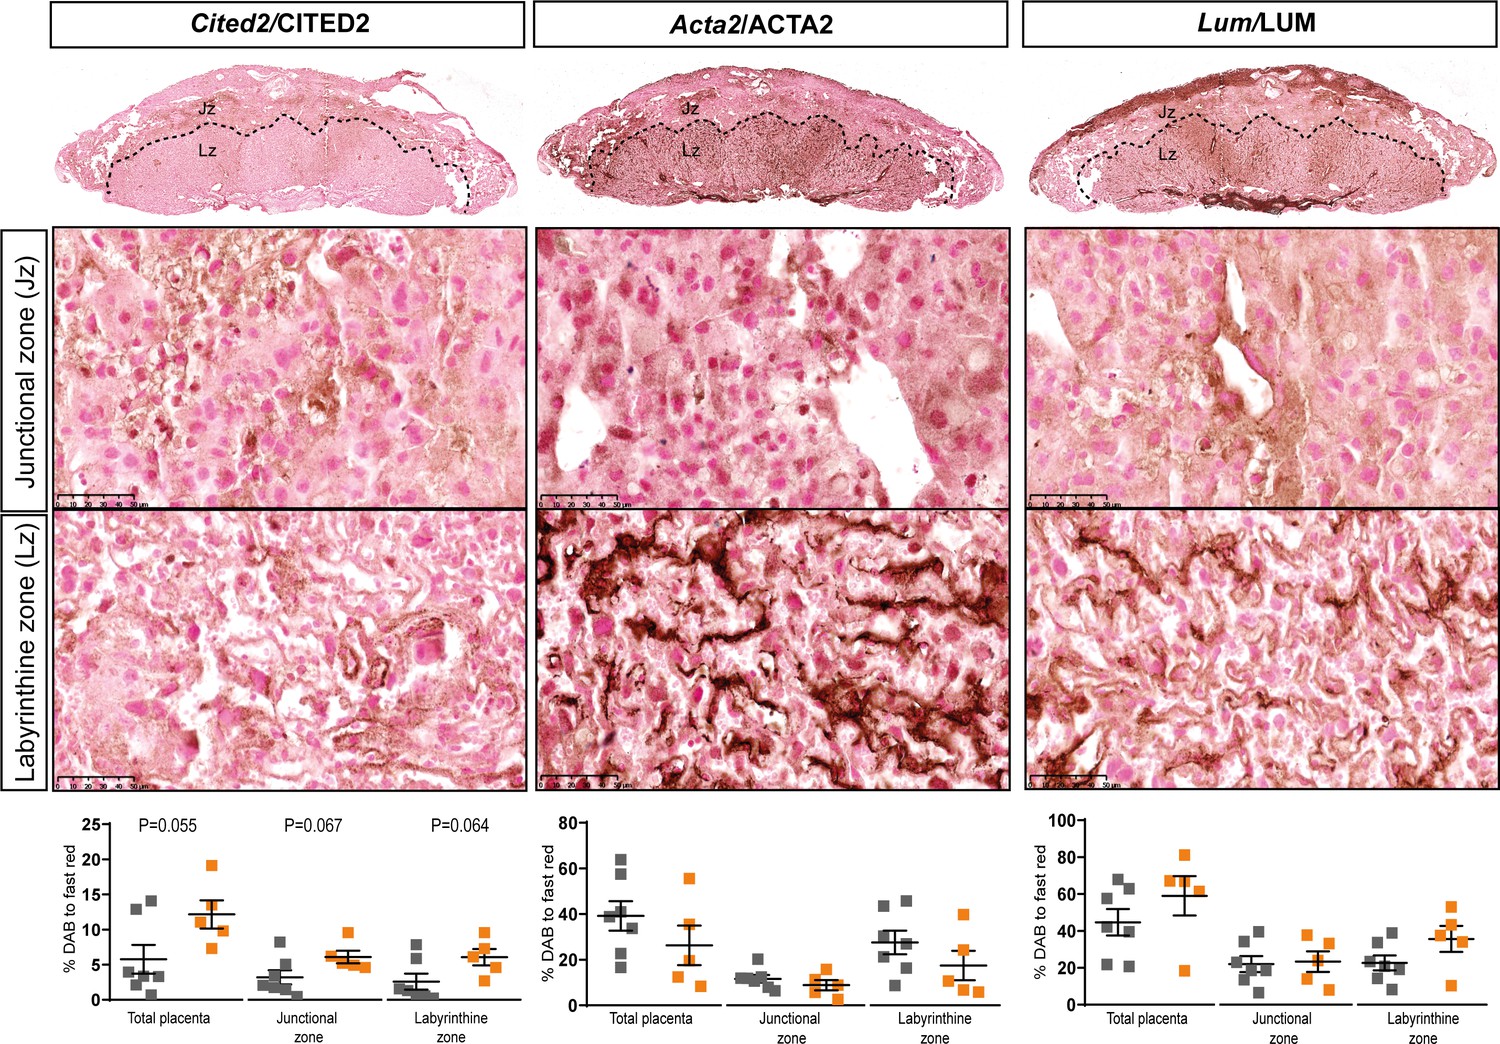
Localisation and abundance of CITED2, ACTA2 and LUM identified to be dysregulated at the gene level, in Hom-P versus Het-U placentas on day 19 of pregnancy.
Data presented as individual values with means ± SEM shown. Data are from n = 7 for Het-U and n = 5 for Hom-P and were analysed by unpaired t test.
Figure 7—figure supplement 2
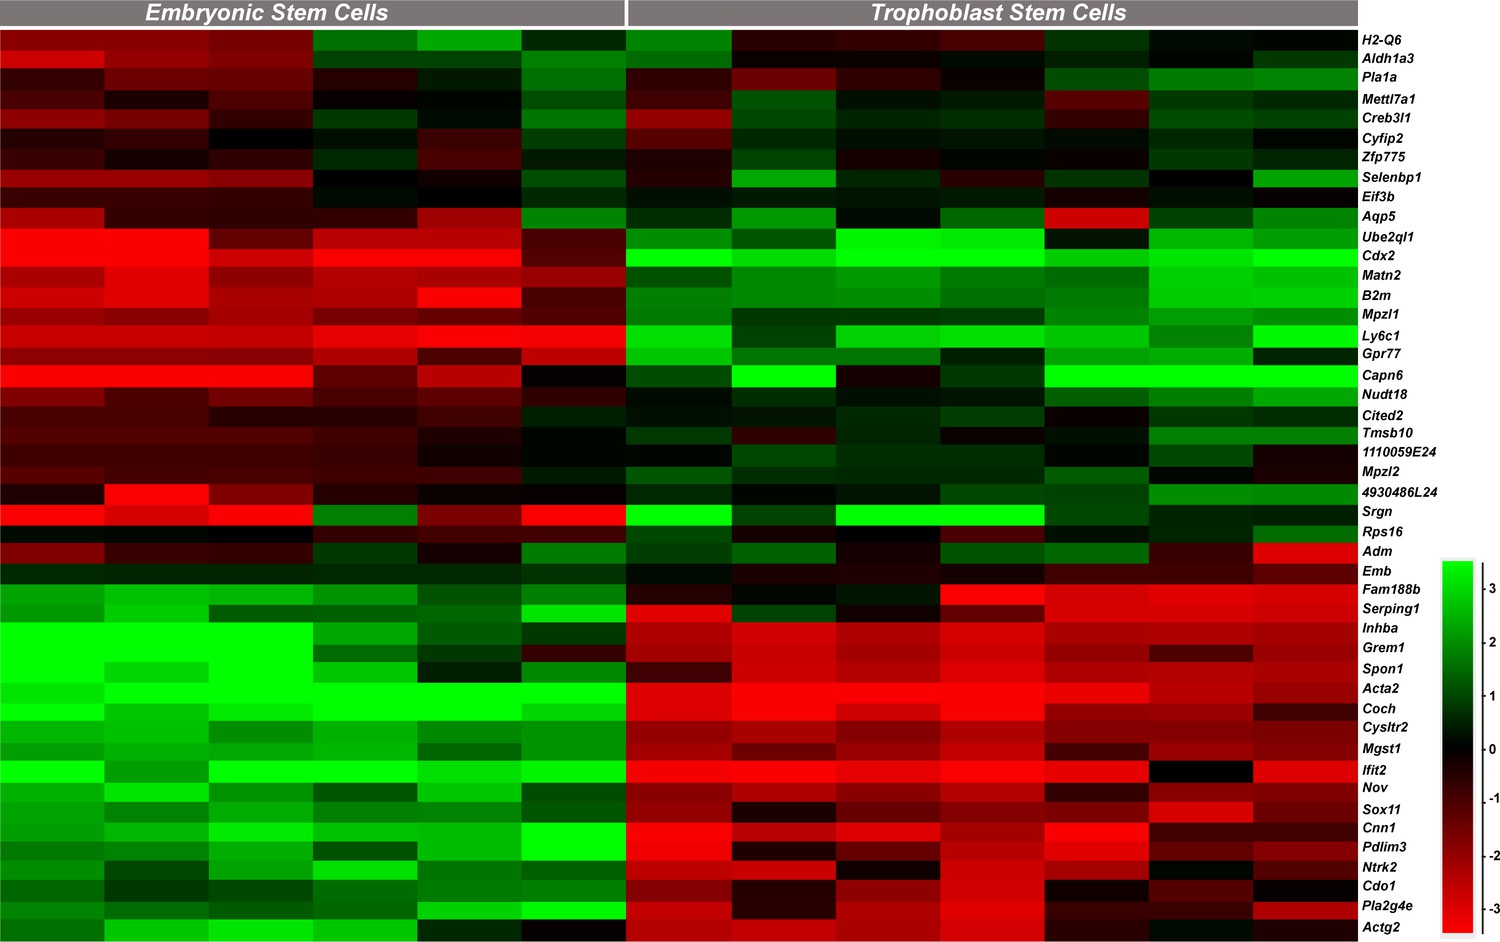
Expression profiles of the genes identified as dysregulated in Hom-P versus Het-U placentas in trophoblast stem cells (TS cells) and embryonic stem cells (ES cells), as determined by analysis of existing RNA-seq datasets (Chrysanthou et al., 2018; Latos et al., 2015).
https://doi.org/10.7554/eLife.45282.024
Figure 8
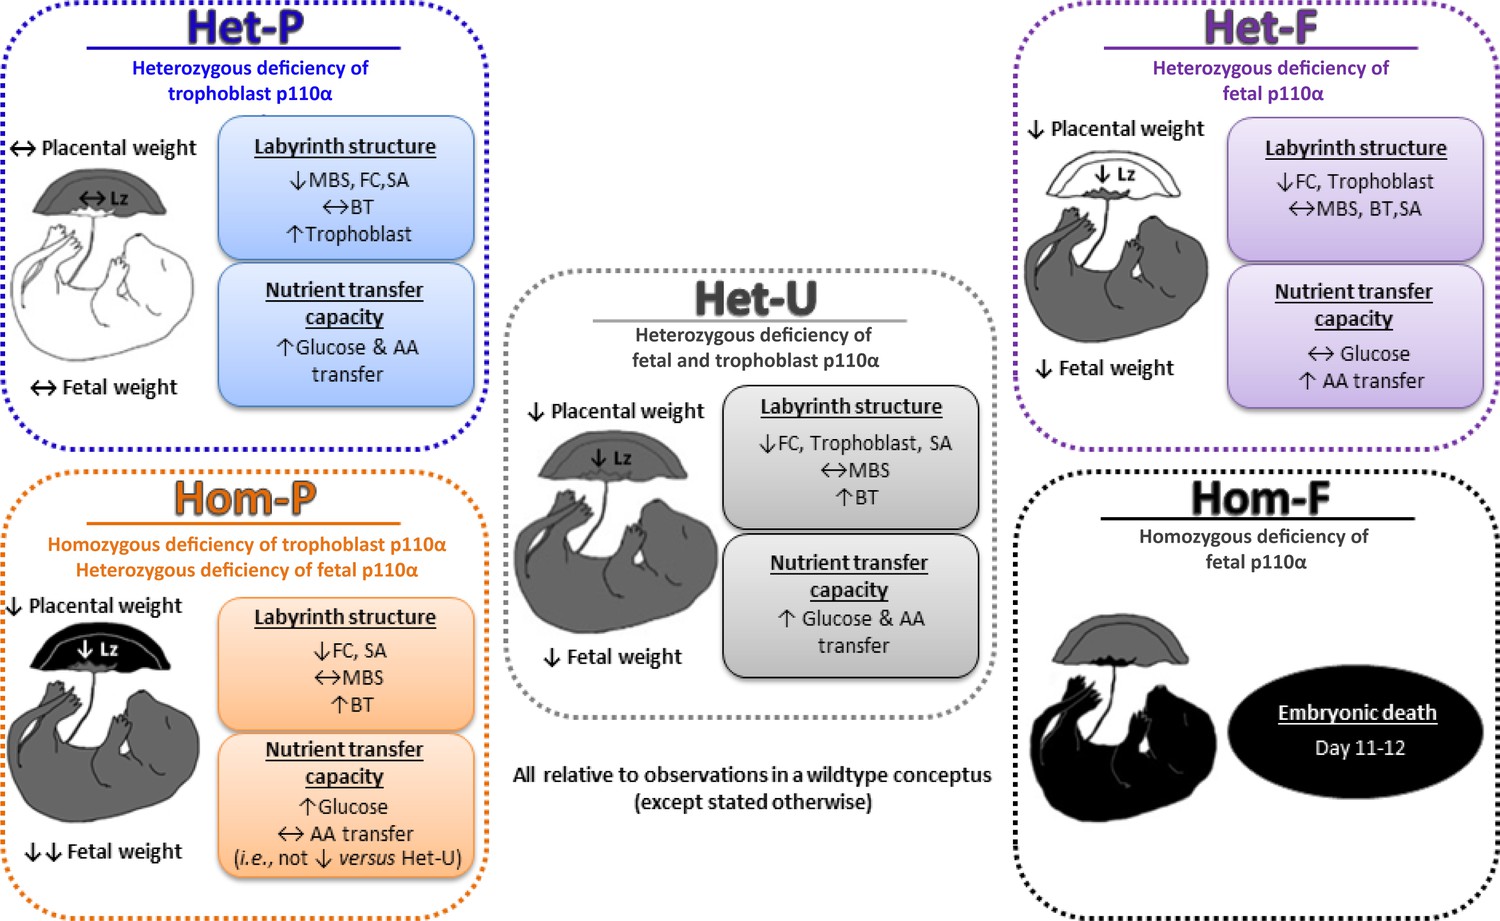
Summary figure showing the phenotypes of all p110α mutants used in this study, which together highlight that fetal and trophoblast p110α have distinct contributions in regulating resource allocation to the growing fetus.
Findings are from mice at day 19 of pregnancy, unless indicated otherwise. AA=amino acid, BT=barrier thickness, FC=fetal capillaries, Lz=labyrinth zone, MBS=maternal blood spaces, SA=surface area for exchange.
Tables
Table 1
Deleting the remaining p110α from fetal compartment of the conceptus results in fetal lethality in Hom-F mutants between days 11 and 12 of pregnancy.
Frequency of viable fetuses in a litter per gestational age are displayed, with the number of litters in parentheses.
| WT | Het-F | Het-U | Hom-F | |
|---|---|---|---|---|
| D10 (5) | 23% | 26% | 34% | 17% |
| D11 (6) | 35% | 23% | 29% | 13% |
| D12 (2) | 50% | 25% | 25% | 0% |
| D13 (3) | 39% | 33% | 28% | 0% |
-
Table 1—source data 1
Deleting the remaining p110α from the trophoblast in Hom-P does not affect fetal viability at day 19 of pregnancy.
Frequency of viable fetuses in a litter are displayed, with data from n = 15 litters. Offspring genotypes were determined by conventional PCR, and in the case of Cyp19Cre mutants, additionally by qRT-PCR to identify those with a sufficient level of Pik3ca deletion (frequency is in parentheses). When the cut off for Pik3ca deletion in the placenta using qRT-PCR was applied (<65% for Het-P and <30% for Hom-P), the frequency of Cyp19Cre mutants was ~50% less.
- https://doi.org/10.7554/eLife.45282.005
Table 2
Deleting the remaining p110α from the trophoblast reduces fetal weight but does not alter placental growth on day 19 of pregnancy, in Hom-P relative to Het-U controls.
Conceptus weights are from n ≥ 18, Lz and Jz volume from n ≥ 6 and Lz morphology from n ≥ 4 per genotype. Data are presented as means ± SEM. * versus Het-U, p<0.05, unpaired t test.
| Het-U | Hom-P | |
|---|---|---|
| Fetus (mg) | 1075 ± 31 | 994 ± 22* |
| Placenta (mg) | 84 ± 3 | 89 ± 3 |
| Labyrinthine zone (mm3) | 38 ± 3 | 36 ± 2 |
| Junctional zone (mm3) | 31 ± 3 | 30 ± 2 |
| Maternal blood spaces (mm3) | 13 ± 3 | 11 ± 1 |
| Trophoblast (mm3) | 20 ± 1 | 22 ± 2 |
| Fetal capillaries (mm3) | 3 ± 1 | 4 ± 1 |
| Barrier thickness (μm) | 4.0 ± 0.2 | 3.9 ± 0.1 |
| Surface area (mm2) | 11 ± 1 | 10 ± 1 |
-
Table 2—source data 1
The effect of deleting the remaining p110α from the trophoblast in Hom-P on feto-placental growth relative to WT and Het-P.
Hom-P * versus WT or † versus Het-P. *p<0.05 and ***p<0.001, †p<0.05 and †††p<0.001, unpaired t test. Conceptus weights are from n ≥ 15, Lz and Jz volume from n ≥ 6 and Lz morphology from n ≥ 4 per genotype on day 19 of pregnancy. Data are presented as means ± SEM.
- https://doi.org/10.7554/eLife.45282.007
Additional files
-
Transparent reporting form
- https://doi.org/10.7554/eLife.45282.028
Download links
A two-part list of links to download the article, or parts of the article, in various formats.
Downloads (link to download the article as PDF)
Open citations (links to open the citations from this article in various online reference manager services)
Cite this article (links to download the citations from this article in formats compatible with various reference manager tools)
Fetal and trophoblast PI3K p110α have distinct roles in regulating resource supply to the growing fetus in mice
eLife 8:e45282.
https://doi.org/10.7554/eLife.45282


