An ESCRT-LEM protein surveillance system is poised to directly monitor the nuclear envelope and nuclear transport system
- Yale School of Medicine, United States
- European Molecular Biology Laboratory, Germany
Figures
Figure 1 with 1 supplement
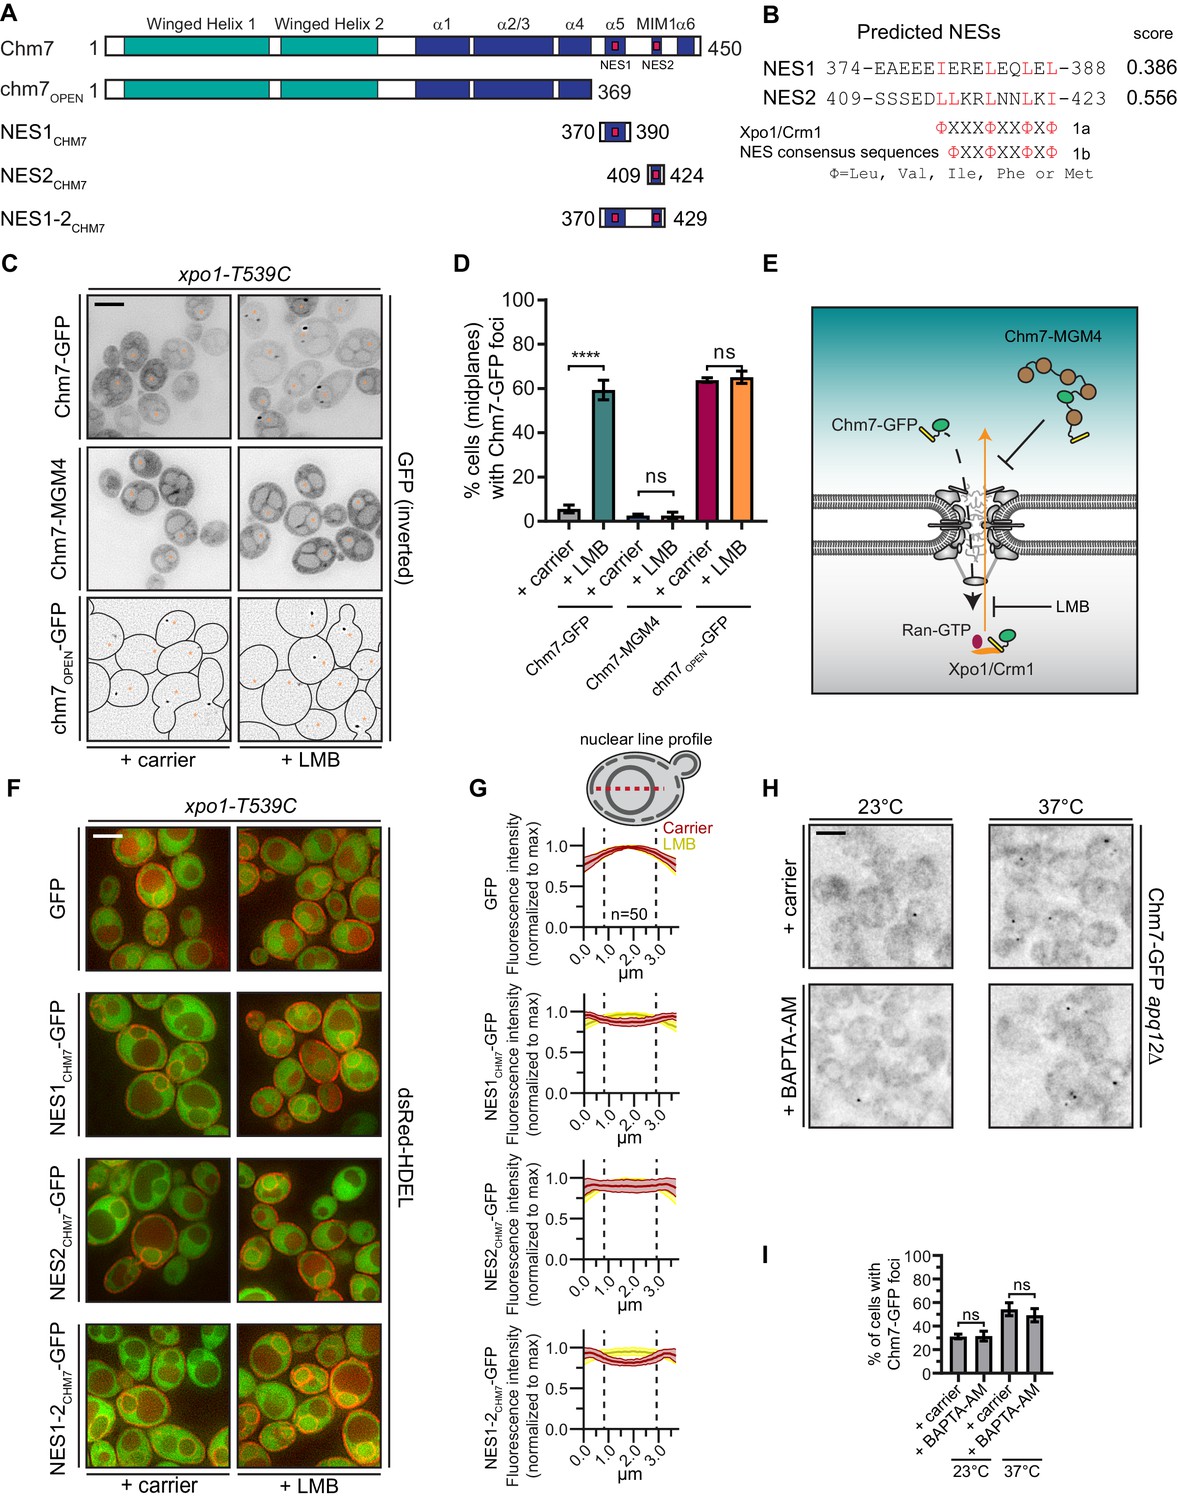
Chm7 can diffuse across the NPC but is actively exported by Xpo1.
(A) Schematic of Chm7 and deletion constructs with predicted winged helix domains (teal), alpha helices (blue) and NESs (red boxes); numbers are amino acids. (B) Predicted Chm7 NESs with probability score from LocNES; numbers are amino acids from Chm7 sequence. Hydrophobic residues in putative NESs are highlighted red as per the consensus class 1a and 1b NESs shown. (C) Deconvolved inverted fluorescence micrographs of the indicated Chm7-GFP constructs in a LMB-sensitive strain (xpo1-T539C) treated with carrier (MeOH) or LMB. Nuclei are marked with orange asterisks. Because of the lack of detectable cytosolic fluorescence in chm7OPEN-GFP-expressing cells, cell boundaries in the bottom panel are drawn from phase-images (not shown). Scale bar is 5 µm. (D) Plots showing the percentage of cells with Chm7-GFP nuclear envelope foci from C. Data are from three independent replicates where > 100 cells were counted for each strain. Only images of midplanes were quantified. P-values from unpaired Student’s t-test where ns is p>0.05, ****p≤0.0001. (E) Schematic of the experiment and interpretation of C. (F) Deconvolved fluorescence micrographs (merge of green and red channels) of the indicated GFP, and GFP-NES constructs co-expressed with dsRed-HDEL to help visualize the nucleus. Cells were treated with carrier (MeOH) or LMB before imaging. Scale bar is 5 µm. (G) To quantify relative nuclear exclusion of the GFP and GFP-NES constructs in F, line profiles bisecting the nucleus as shown in diagram were measured from 50 cells/condition pooled from three independent replicates. The normalized average (thick lines) ±SD (thin lines) of the carrier (red) and LMB-treated (yellow) cells are shown. Vertical dotted lines designate nuclear boundaries. (H) Ca2+ chelation does not affect Chm7-GFP recruitment to the nuclear envelope in apq12Δ cells. Deconvolved inverted fluorescence micrographs of Chm7-GFP in apq12Δ cells pretreated for 30 min with carrier (DMSO) or BAPTA-AM and shifted to the indicated temperature for 45 min. (I) Plot quantifying the percentage of apq12Δ cells with Chm7-GFP foci at the indicated temperature and treatment. three independent replicates of >100 cells were quantified per replicate. P-values are calculated from un-paired Student’s t-test where ns is p>0.05.
Figure 1—figure supplement 1
Chm7 can diffuse across the NPC but is actively exported by Xpo1.
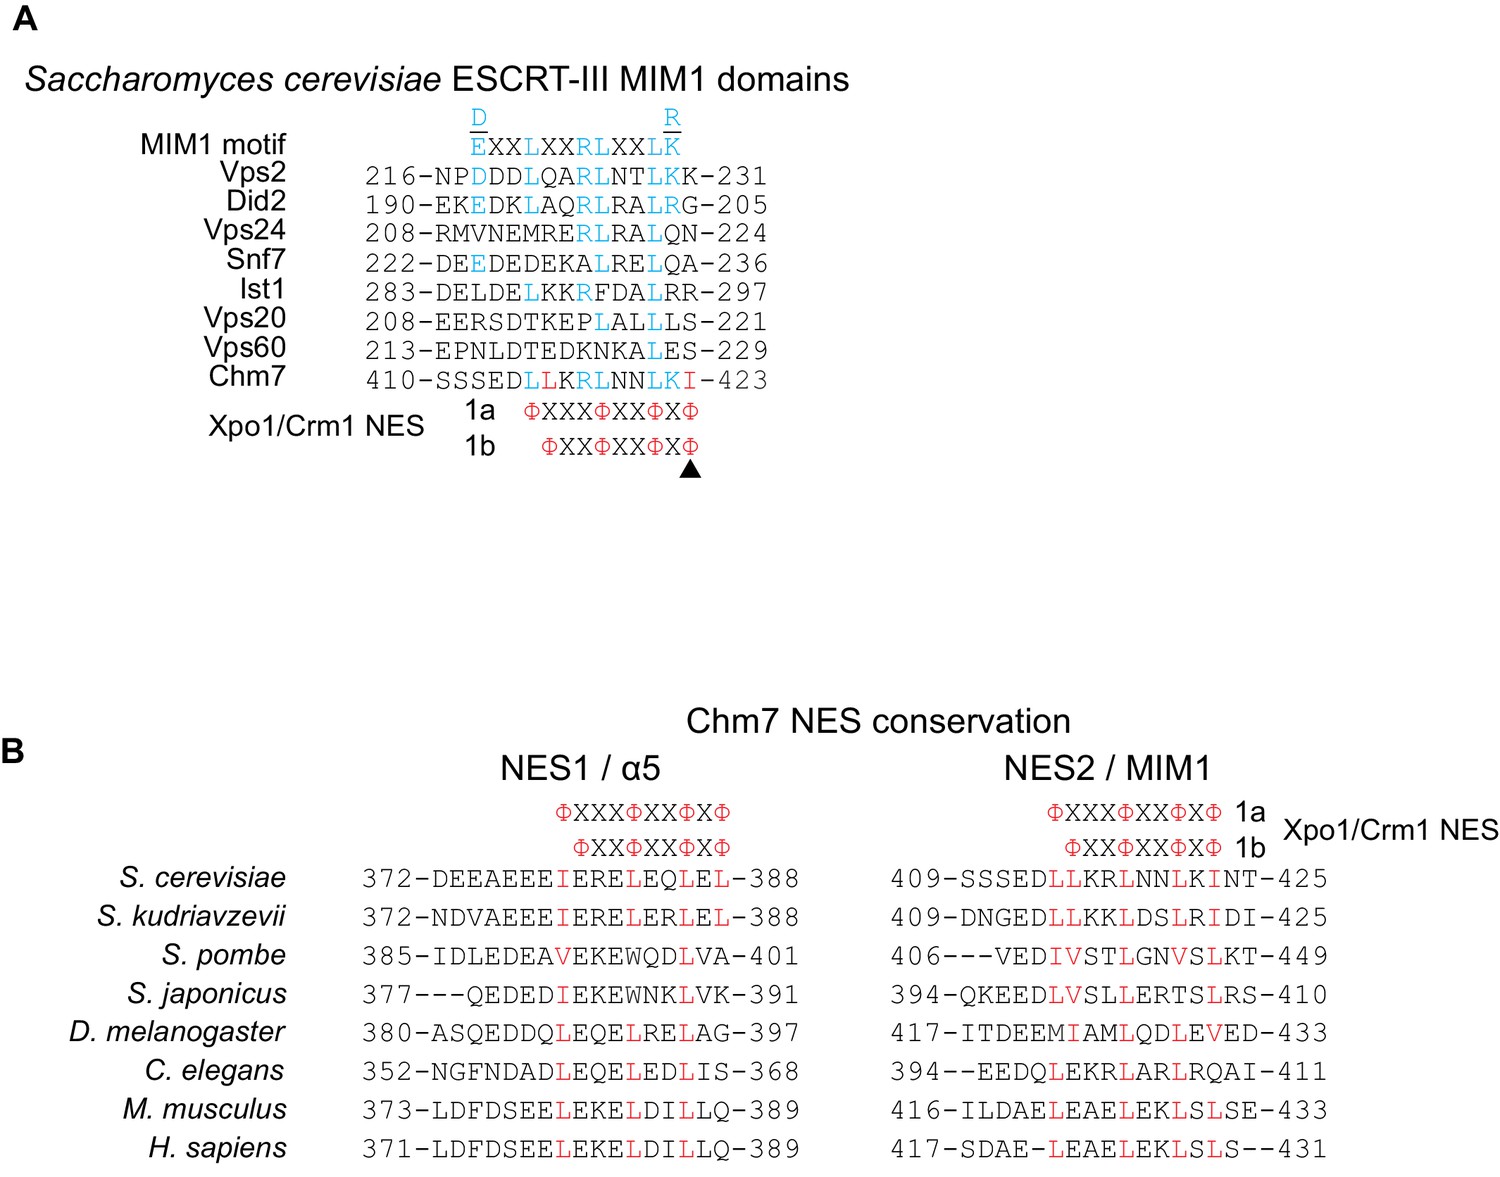
(A) Amino acid sequences of S. cerevisiae ESCRT-III MIM1 domains aligned with class 1a and 1b Xpo1/Crm1 NESs. Blue coloring reflects alignment with the MIM1 consensus (Stuchell-Brereton et al., 2007) (at top) and red coloring indicates additional hydrophobic amino acid residues in the putative Chm7 MIM1 domain that align with both the class 1a and 1b NESs. (B) Alignment of predicted NES1 and NES2 from Chm7 with the analogous sequence of the indicated species. Red coloring are hydrophobic residues that align with type 1a and 1b NES consensus sequences.
Figure 2
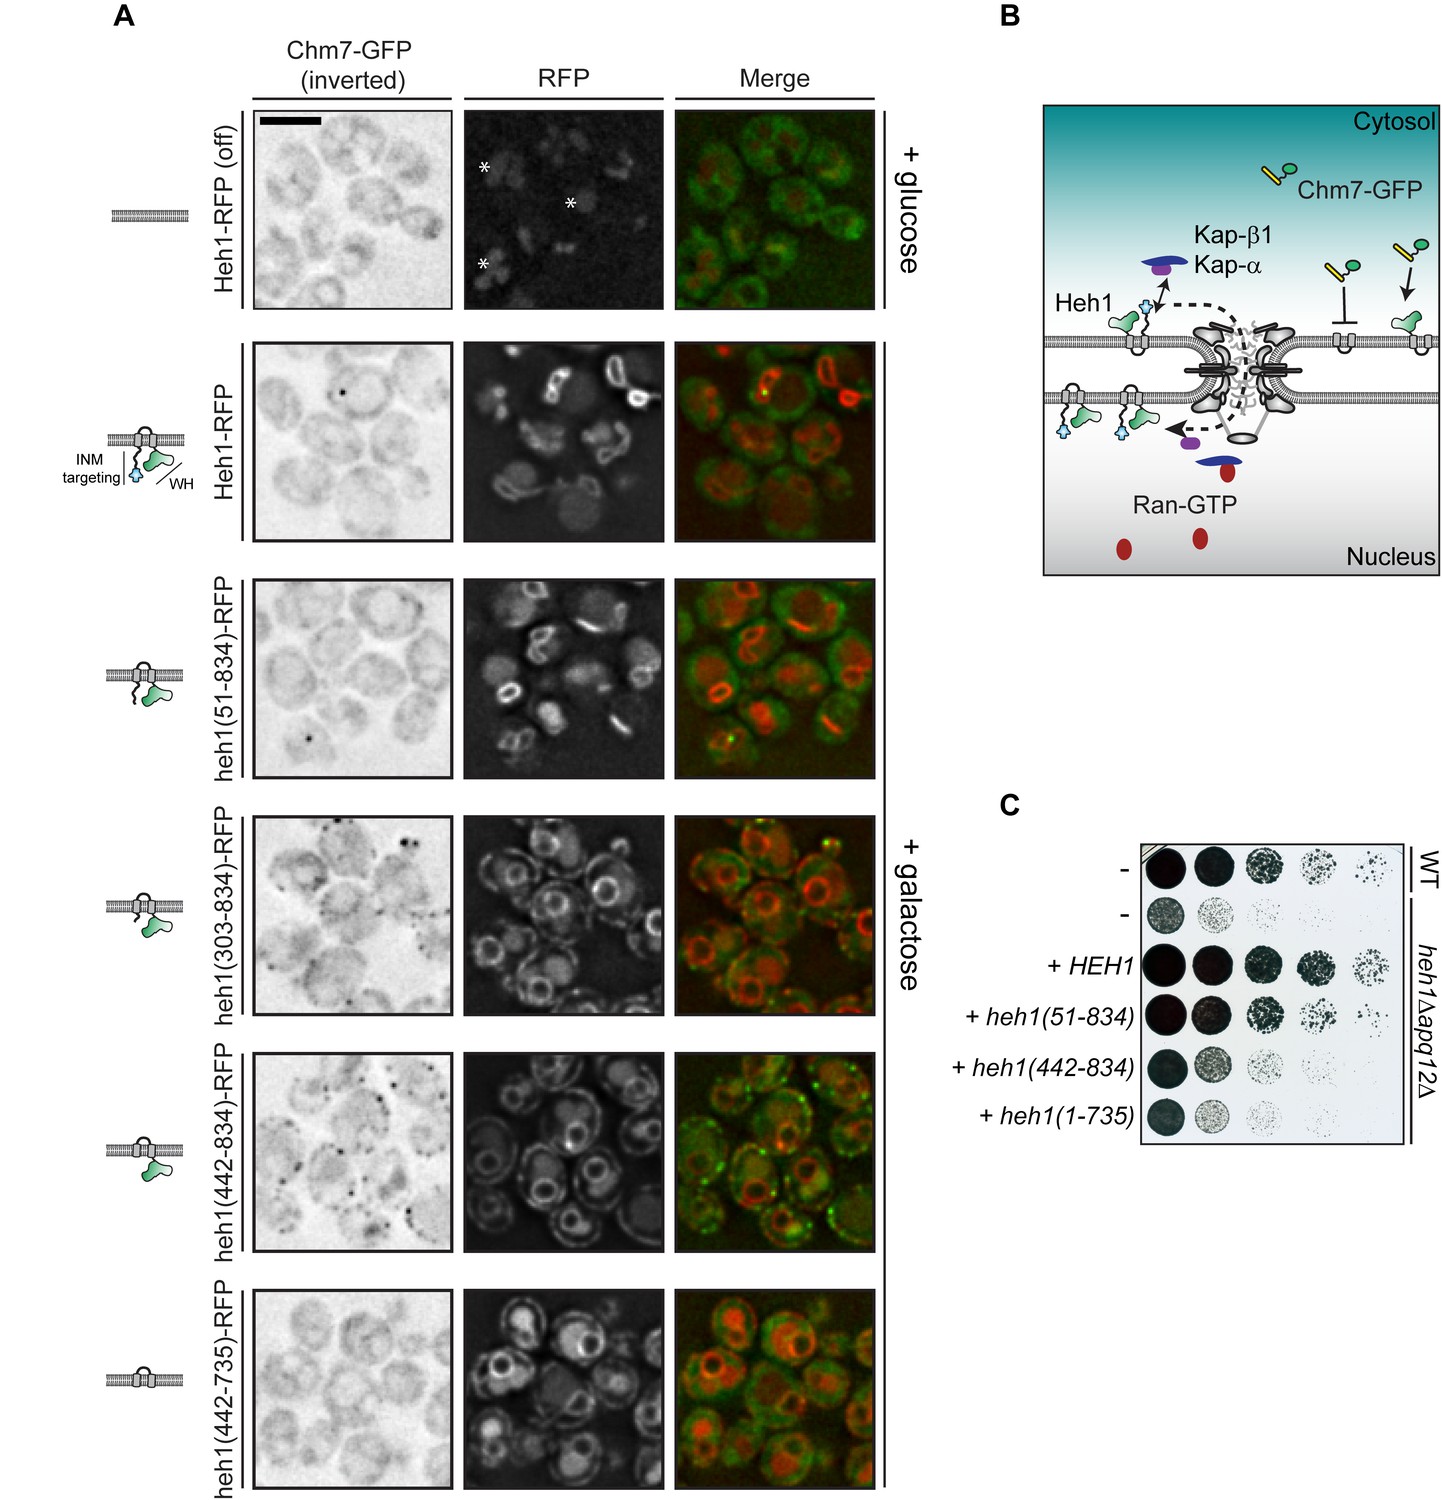
Cytosolic exposure of the Heh1 WH domain is sufficient to recruit Chm7 to ER membranes.
(A) Deconvolved fluorescence micrographs of Chm7-GFP (inverted) either prior to (+glucose) or after 2 hr of overexpression (+galactose) of RFP-tagged full length and truncations of Heh1 (depicted in cartoons at left in a lipid bilayer). Asterisks indicate vacuolar autofluorescence in the red channel. Scale bar is 5 µm. (B) Cartoon of experiment and interpretation of A. The efficient INM targeting of Heh1 depends on Kap-α/Kap-β1 (blue and purple) and on Ran-GTP (red). (C) Tenfold serial dilutions of the indicated strains spotted onto YPG plates to express the indicated truncations of Heh1. Plates imaged after growth at 30oC for 36 hr.
Figure 3 with 1 supplement
Chm7 binds to Heh1, Nur1 and downstream ESCRTs required for Vps4 recruitment.
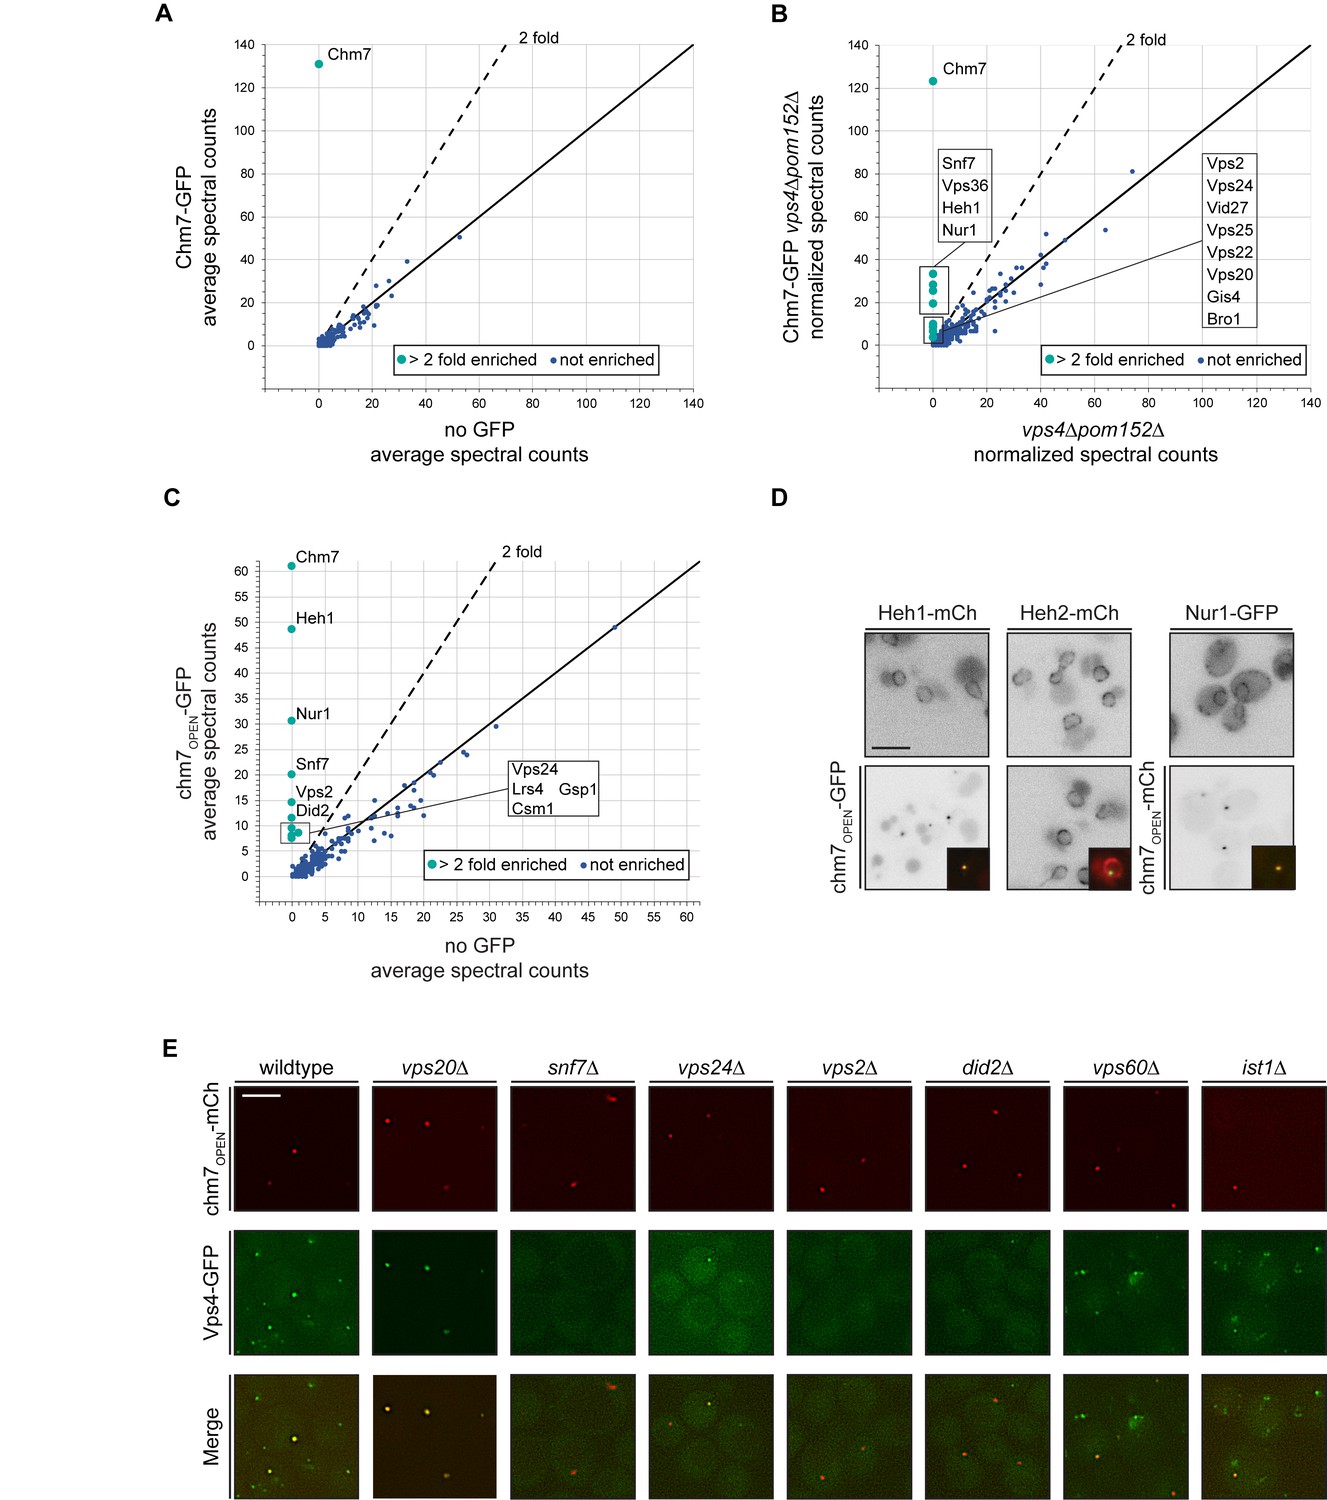
(A–C) Affinity purifications of Chm7-GFP and chm7OPEN-GFP were performed from wildtype and vps4Δpom152Δ cells. Bound proteins were eluted and subjected to LC-MS/MS peptide identification. Scatter plots of the number of peptide spectra identifying the indicated proteins were directly compared to those identified in ‘no GFP’ samples and were generated from data shown in Figure 3—source data 1. Dotted line and teal circles represent peptides found at least two fold enriched over non-specific proteins (blue). Plots A and C represent an average of two replicates of normalized spectral counts of peptides identified by MS. (D) Heh1 and Nur1 but not Heh2 colocalize with chm7OPEN. Deconvolved inverted fluorescence micrographs of Heh1-mCherry (red channel), Heh2-mCherry (red channel) and Nur1-GFP (green channel) are shown in indicated columns in both the top and bottom panels. Either chm7OPEN-GFP or chm7OPEN-mCherry are co-expressed as indicated in bottom panels but chm7open localization only shown in inset as merge of green and red channels. (E) Vps4 recruitment to chm7OPEN requires Snf7 and downstream ESCRTs. Deconvolved fluorescence micrographs of Vps4-GFP and chm7OPEN -mCherry in the indicated strain backgrounds. Green, red and merged images shown.
-
Figure 3—source data 1
Table containing all identified MS peptide spectra from affinity purifications of Chm7-GFP and chm7OPEN-GFP in either WT or vps4Δpom152Δ cells with no-GFP controls.
Data from each affinity purification can be found in tabs at bottom.
- https://doi.org/10.7554/eLife.45284.008
Figure 3—figure supplement 1
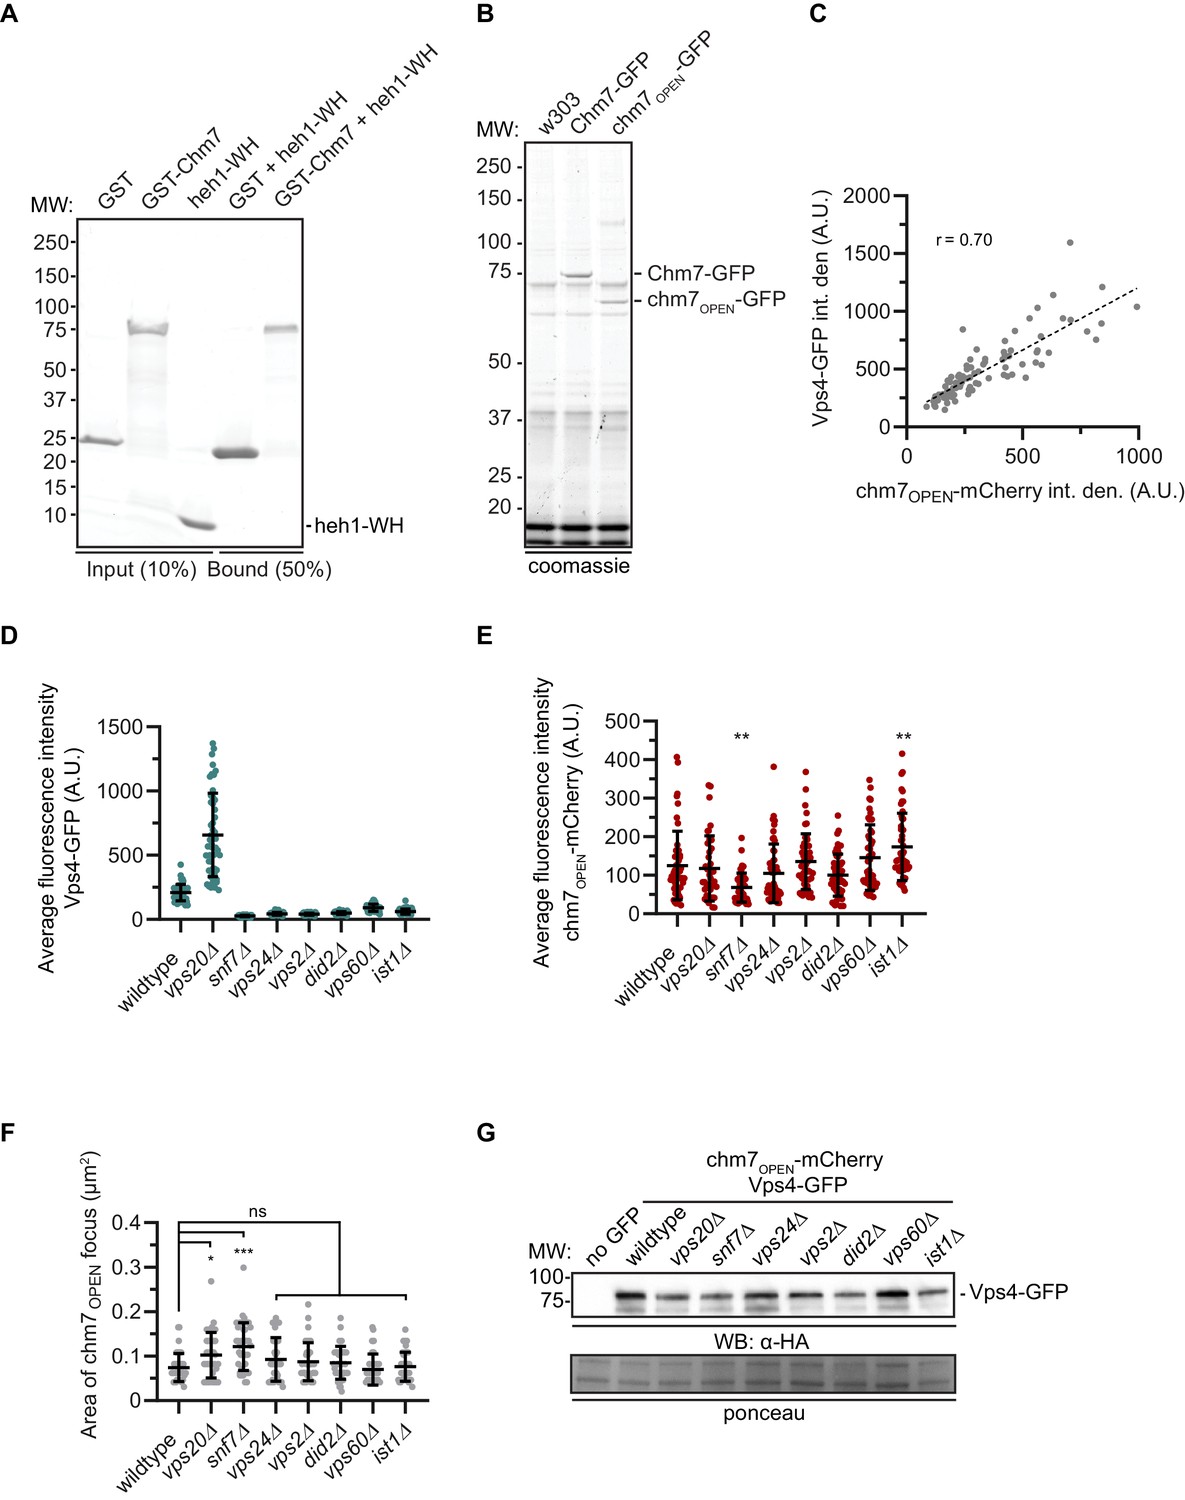
Chm7 binds to Heh1, Nur1 and downstream ESCRTs required for Vps4 recruitment.
(A) Recombinant purified Heh1 WH domain and GST-Chm7 fail to interact within an in vitro solution binding assay. A coomassie-stained SDS-PAGE gel showing input and bound fractions of a solution binding experiment where GST or GST-Chm7 were incubated with the Heh1 WH domain and immobilized on GT-beads. The position of MW markers are indicated at left. (B) Anti-GFP magnetic beads were incubated with cell extracts derived from wildtype (W303) or cells expressing Chm7-GFP or chm7OPEN-GFP. Proteins bound to beads were eluted, separated by SDS-PAGE and either sent for MS/MS peptide identification or stained with Coomassie as shown. Positions of molecular weight (MW) markers are shown at left. (C) Correlation of the total fluorescence (integrated density) in arbitrary units (A.U.) of chm7OPEN-mCherry and Vps4-GFP co-localized at the nuclear envelope. Linear regression calculated from 100 chm7OPEN foci pooled from three independent replicates; r is the linear correlation (Pearson’s) coefficient. (D) Plot of average fluorescence intensity (in arbitrary units; A.U.) of Vps4-GFP co-localized with chm7OPEN-mCherry foci in the indicated genetic backgrounds. Error bars represent SD of the mean from >50 foci pooled from three independent replicates. (E) Plot of average fluorescence intensity (in arbitrary units) of chm7OPEN-mCherry foci in the indicated genetic backgrounds. Error bars represent SD of the mean from >50 foci pooled from three independent replicates. P-values from one-way ANOVA with Dunnett’s correction where **p≤0.01. (F) Plot of the area encompassed by the chm7OPEN-GFP focus in the indicated genetic backgrounds. Error bars represent SD of the mean from >50 foci pooled from three independent replicates. P-values from one-way ANOVA with Dunnett’s correction where ns is p≥0.05, *p≤0.05, and ***p≤0.001. (G) Western blot to assess the total levels of Vps4-GFP in the indicated genetic backgrounds. Anti-HA-labeling detected by HRP-conjugated secondary antibodies and ECL. Ponceau-stain used to assess total protein loads. Position of MW markers at left.
Figure 4 with 1 supplement
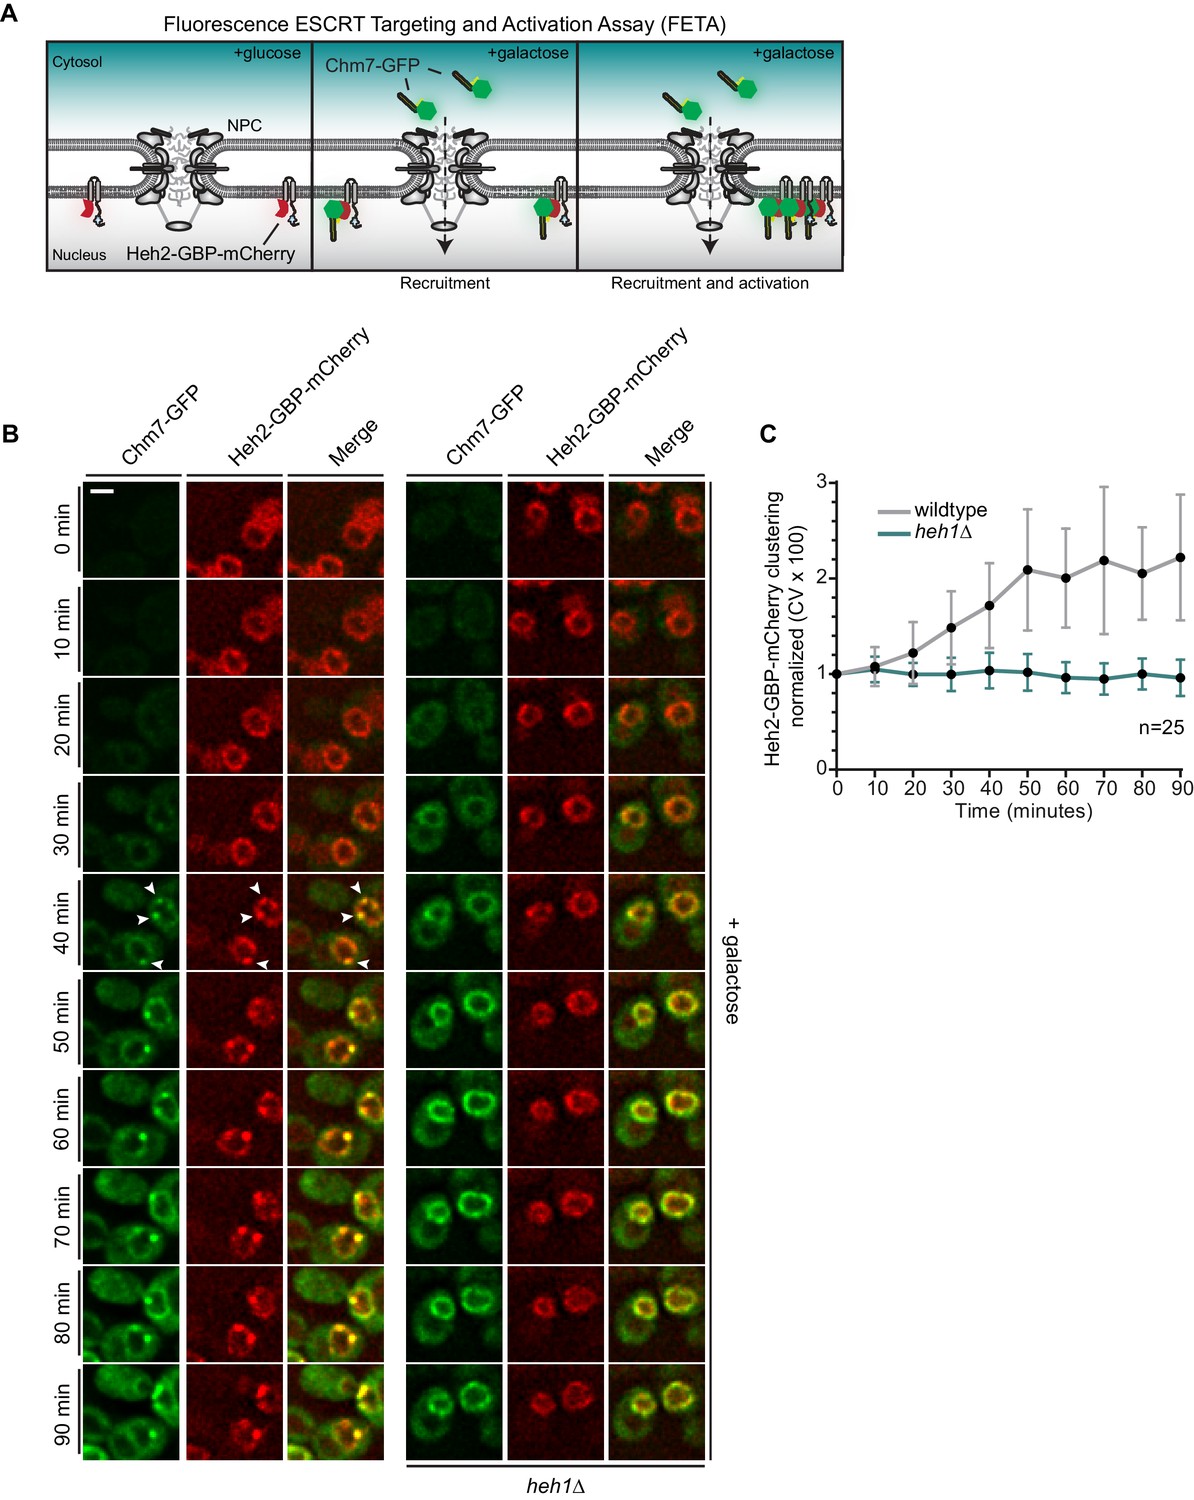
Heh1 is required to induce the focal accumulation of Chm7.
(A) Schematic of ‘Fluorescence ESCRT Targeting and Activation Assay’ where Heh2 is expressed as a fusion to GFP-binding protein (GBP; red). Chm7-GFP is expressed by the addition of galactose to the growth medium. The focal accumulation of Heh2-GBP-mCherry is interpreted as Chm7 activation. (B) Deconvolved fluorescence micrographs of Chm7-GFP and Heh2-GBP-mCherry at the indicated timepoints after addition of galactose to the growth medium. Scale bar is 5 μm. (C) As a metric for the clustering of Heh2-GBP-mCherry, a coefficient of variation (CV) of the Heh2-GBP-mCherry fluorescence along the nuclear envelope in a mid-section was calculated over time. Mean and SD normalized to 0 timepoint are shown. n = 25.
Figure 4—figure supplement 1
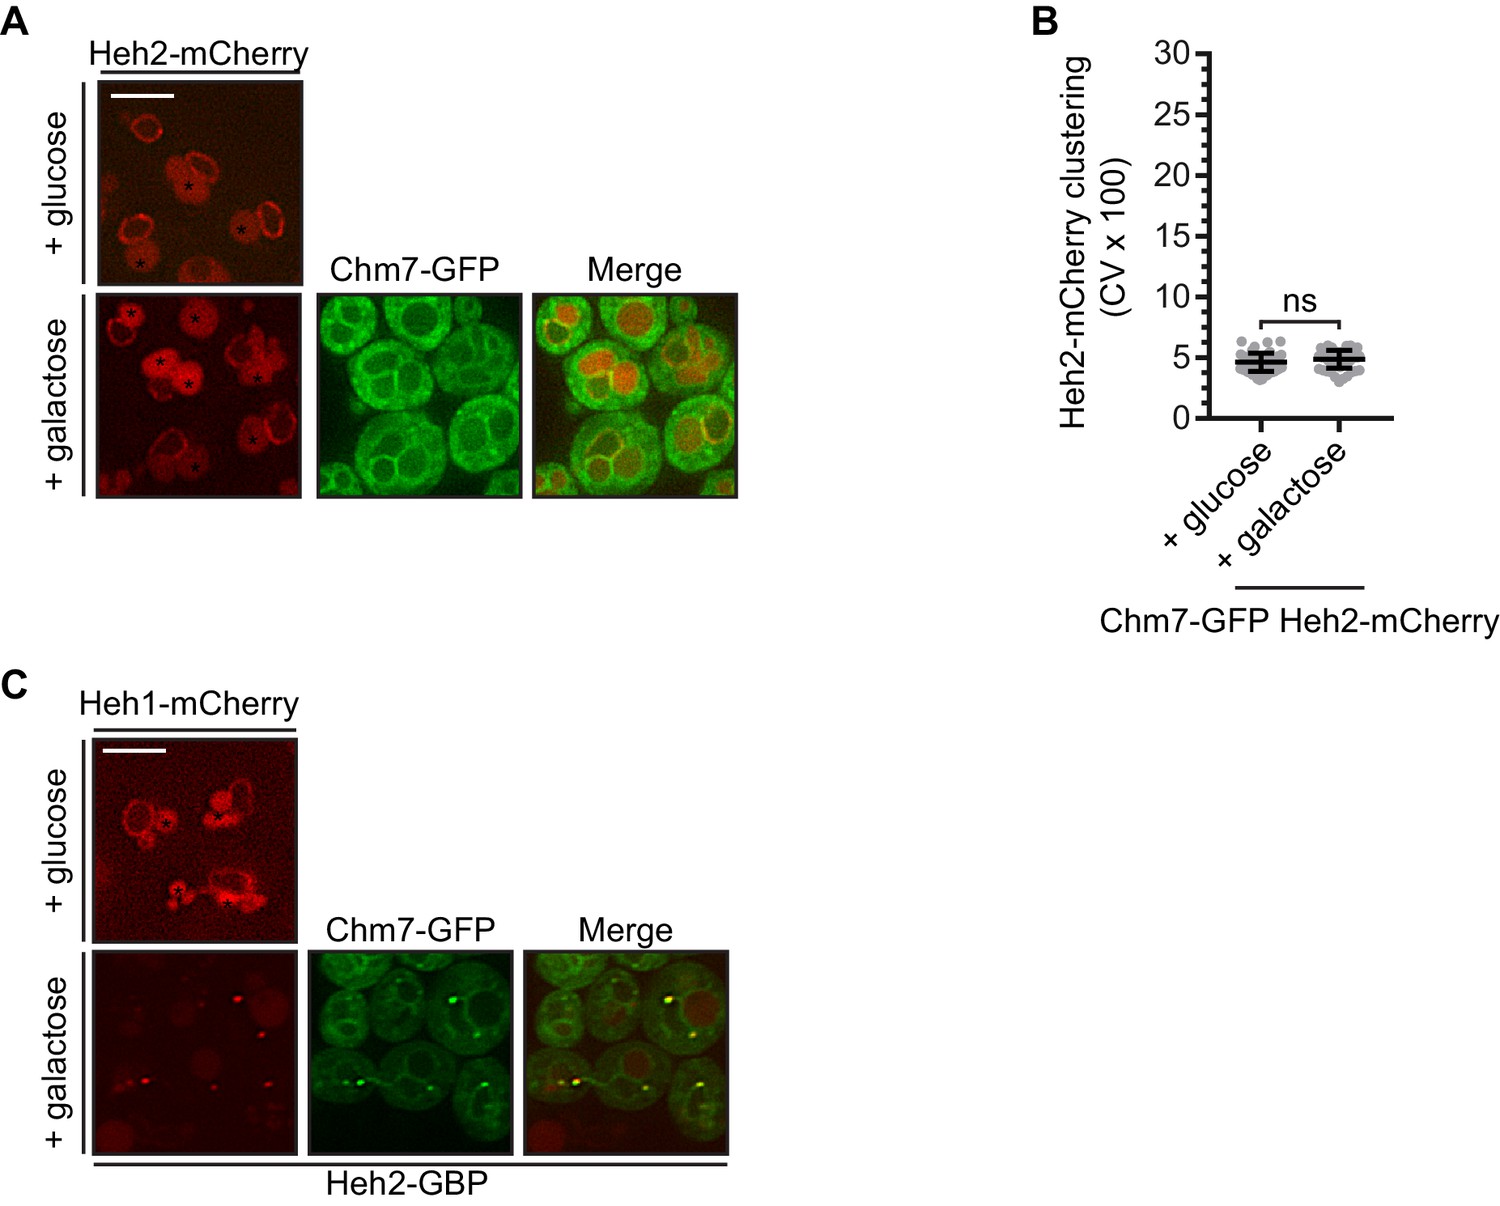
Heh1 is required to induce the focal accumulation of Chm7.
(A) Overexpression of Chm7-GFP does not impact the distribution of Heh2-mCherry. Deconvolved fluorescence micrographs of Heh2-mCherry and Chm7-GFP under conditions where Chm7-GFP was produced (galactose) or repressed (glucose). Merge of green and red fluorescence also shown. Asterisks denote vacuolar autofluorescence. Scale bar 5 μm. (B) Plot of the CV of Heh2-mCherry fluorescence along the nuclear envelope from images and conditions in (A). Error bars represent SD of the mean from three independent replicates of >50 cells. P-values from Student’s t-test where ns is p≥0.05. (C) Overexpression of Chm7-GFP in the context of Heh2-GBP leads to the accumulation of Heh1-mCherry in Chm7-GFP foci at the nuclear envelope. Deconvolved fluorescence micrographs of Heh1-mCherry and Chm7-GFP (in a strain also expressing Heh2-GBP) under conditions where Chm7-GFP is produced (galactose) or repressed (glucose). Merge of green and red fluorescence also shown. Asterisks denote vacuolar autofluorescence. Scale bar 5 μm.
Figure 5 with 1 supplement

The Heh1 WH domain and a transmembrane anchor are necessary and sufficient for Chm7 activation, which is also modulated by Nur1, Snf7 and Vps4.
(A) Deletion of NUR1, SNF7 and VPS4 impact Heh2-GBP-mCherry clustering in the FETA assay. Deconvolved fluorescence micrographs of Heh2-GBP-mCherry and Chm7-GFP in the indicated genetic backgrounds, either prior to (glucose) or after 90 min in galactose to drive Chm7-GFP production. Green and red channels with merge shown. Scale bar is 5 μm. (B) Plot of the CV of Heh2-GBP-mCherry fluorescence (as in Figure 4C) in the indicated strains before (glucose) or after 90 min of galactose addition to induce Chm7-GFP production. Data are from three independent replicates where 50 cells/genotype/replicate were counted. P-values are from two-way ANOVA with Dunnett’s test where ns is p>0.05, **p≤0.01, ***p≤0.001, and ****p≤0.0001. (C) Deconvolved fluorescence micrographs of Heh2-GBP-mCherry and Chm7-GFP produced for 90 min in galactose. All images are from heh1Δ strains expressing the indicated genes encoding HEH1 and several deletion constructs (schematized at left in a lipid bilayer). (D) Plot of the CV of Heh2-GBP-mCherry fluorescence (as in Figure 4C) in an heh1Δ strain expressing HEH1 or heh1(1-735) after 90 min of galactose addition to induce Chm7-GFP production. Data are from three independent replicates of 50 cells per strain. P-values are from two-way ANOVA with Dunnett’s test where ns is p>0.05, ****p≤0.0001.
Figure 5—figure supplement 1
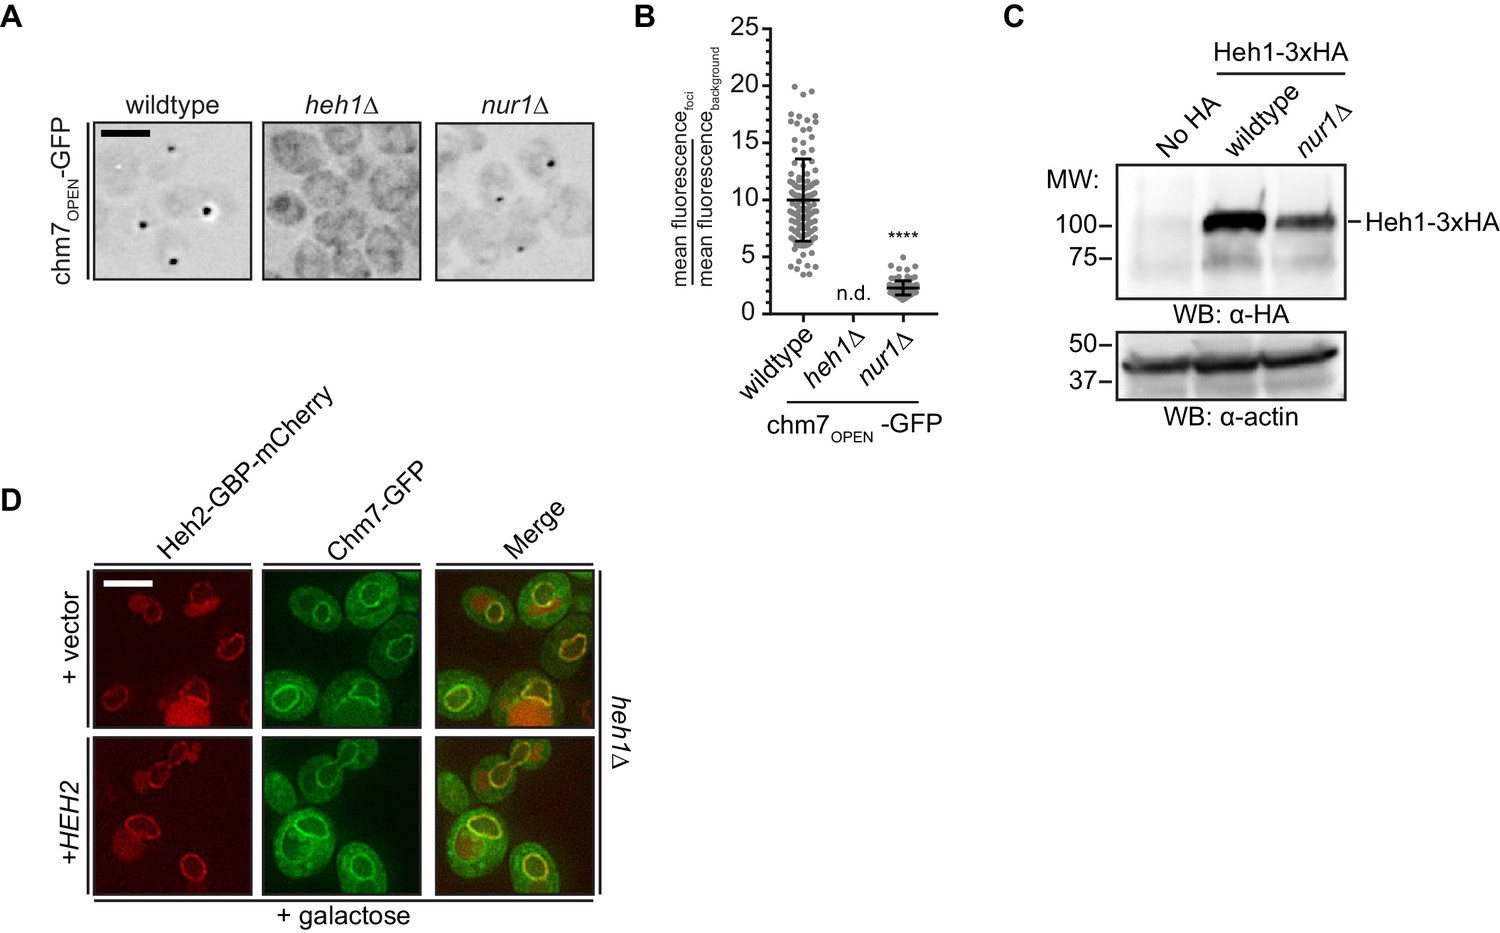
The Heh1 WH domain and a transmembrane anchor are necessary and sufficient for Chm7 activation, which is also modulated by Nur1, Snf7 and Vps4.
(A) Deletion of NUR1 impacts chm7OPEN-GFP accumulation at the nuclear envelope. Deconvolved fluorescence micrographs (inverted) of chm7OPEN-GFP in the indicated strains. (B) Plot of the level of enrichment of chm7OPEN-GFP at nuclear envelope foci in the indicated strains reflected by the ratio of its mean fluorescence at the nuclear envelope focus over background fluorescence. Error bars represent SD of the mean of >100 foci pooled from three independent replicates. (C) Heh1 levels are diminished in nur1Δ cells. Western blot of the total levels of a Heh1-3xHA fusion in the indicated strains. Heh1-3xHA and actin, which is used as a total protein load reference, are detected using either anti-HA antibodies or anti-actin antibodies followed by HRP-conjugated secondary antibodies and ECL. Position of molecular weight (MW) standards at left. (D) Deconvolved fluorescence micrographs of Heh2-GBP-mCherry and Chm7-GFP in an heh1Δ strain expressing HEH2 introduced on a plasmid, after 90 min of galactose addition to induce Chm7-GFP production. Green, red and merge channels are shown. Scale bar is 5 µm.
Figure 6 with 1 supplement
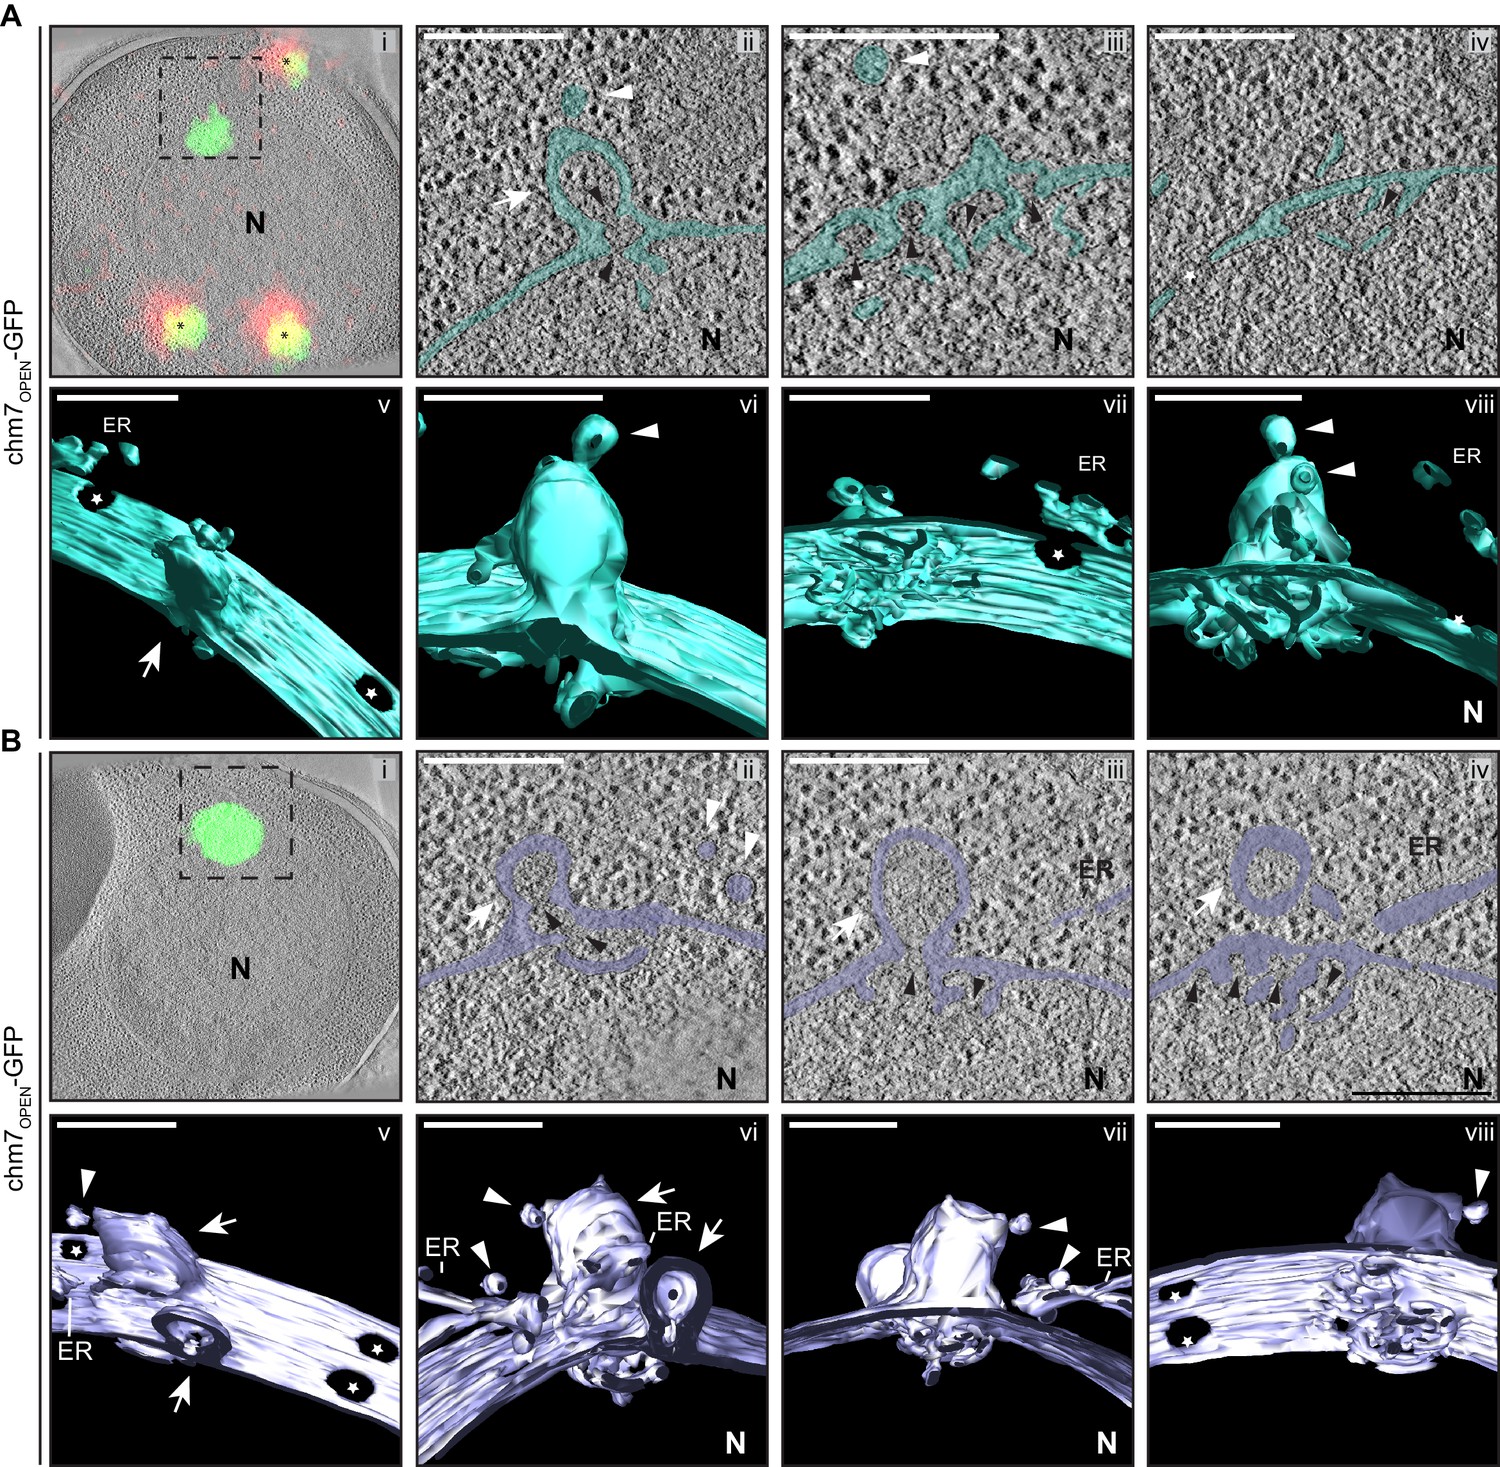
chm7OPEN associates with a network of intranuclear fenestrated cisterna often below nuclear envelope herniations.
(A, B) Correlative light and electron microscopy of 300 nm thick sections was used to examine the morphology of the nuclear envelope at sites of chm7OPEN-GFP accumulation. i. Overlay of fluorescent and electron micrographs with tetrafluorescent fiducials used for correlative alignment marked with (*); boxed region is magnified in ii-iv. ii-iv. Several views along the z-axis of the tomogram shown with the nuclear envelope/ER lumen filled with teal or light purple. v-viii. 3D models were generated and several perspective views are shown. White arrows are herniations, white arrowheads vesicles, black arrowheads are constrictions or necks of budding herniations, stars are nuclear pores. N is nucleus. Scale bars are 250 nm.
Figure 6—figure supplement 1
chm7OPEN associates with a network of intranuclear fenestrated cisterna often below nuclear envelope herniations.
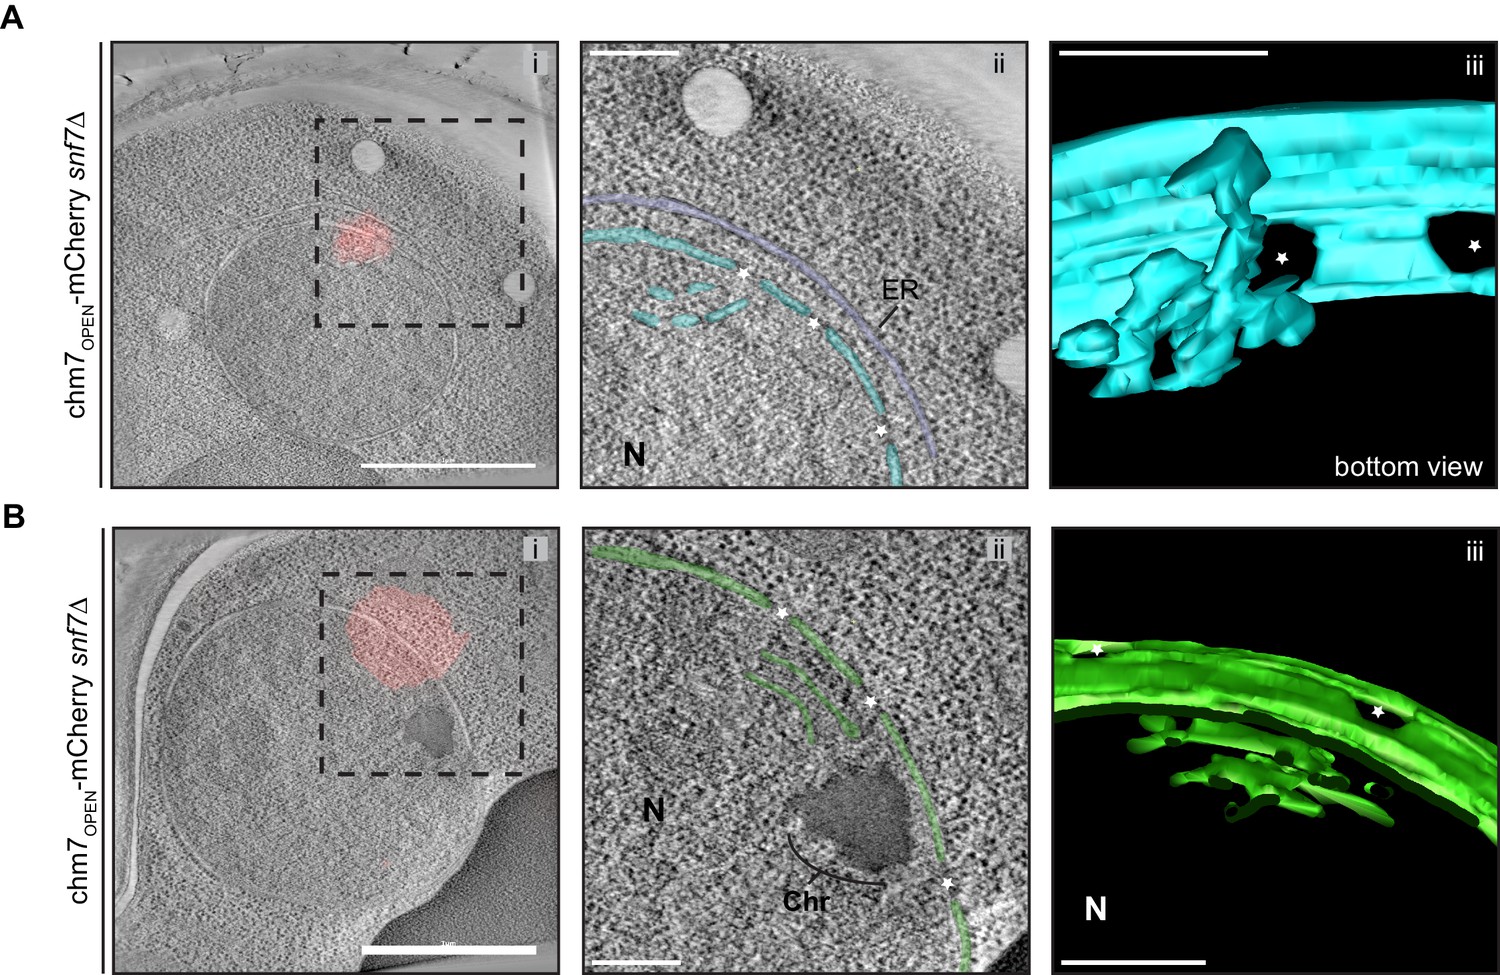
(A and B) SNF7 is dispensable for the formation of an intranuclear fenestrated membrane network in the context of chm7OPEN. (i) Correlative light and electron microscopy of ~220 nm thick sections was used to examine the morphology of the nuclear envelope at sites of chm7OPEN-mCherry accumulation in snf7Δ cells. i. Overlay of fluorescent (red) and electron micrographs; boxed region is magnified in ii. ii. Tomographic slices where nuclear envelope membranes are colored blue or green with ER in purple. iii. Views of 3D models. Stars are nuclear pores, Chr is chromatin and N is nucleus. Scale bars in i are 1 µm and scale bars in ii, iii are 250 nm.
Figure 7
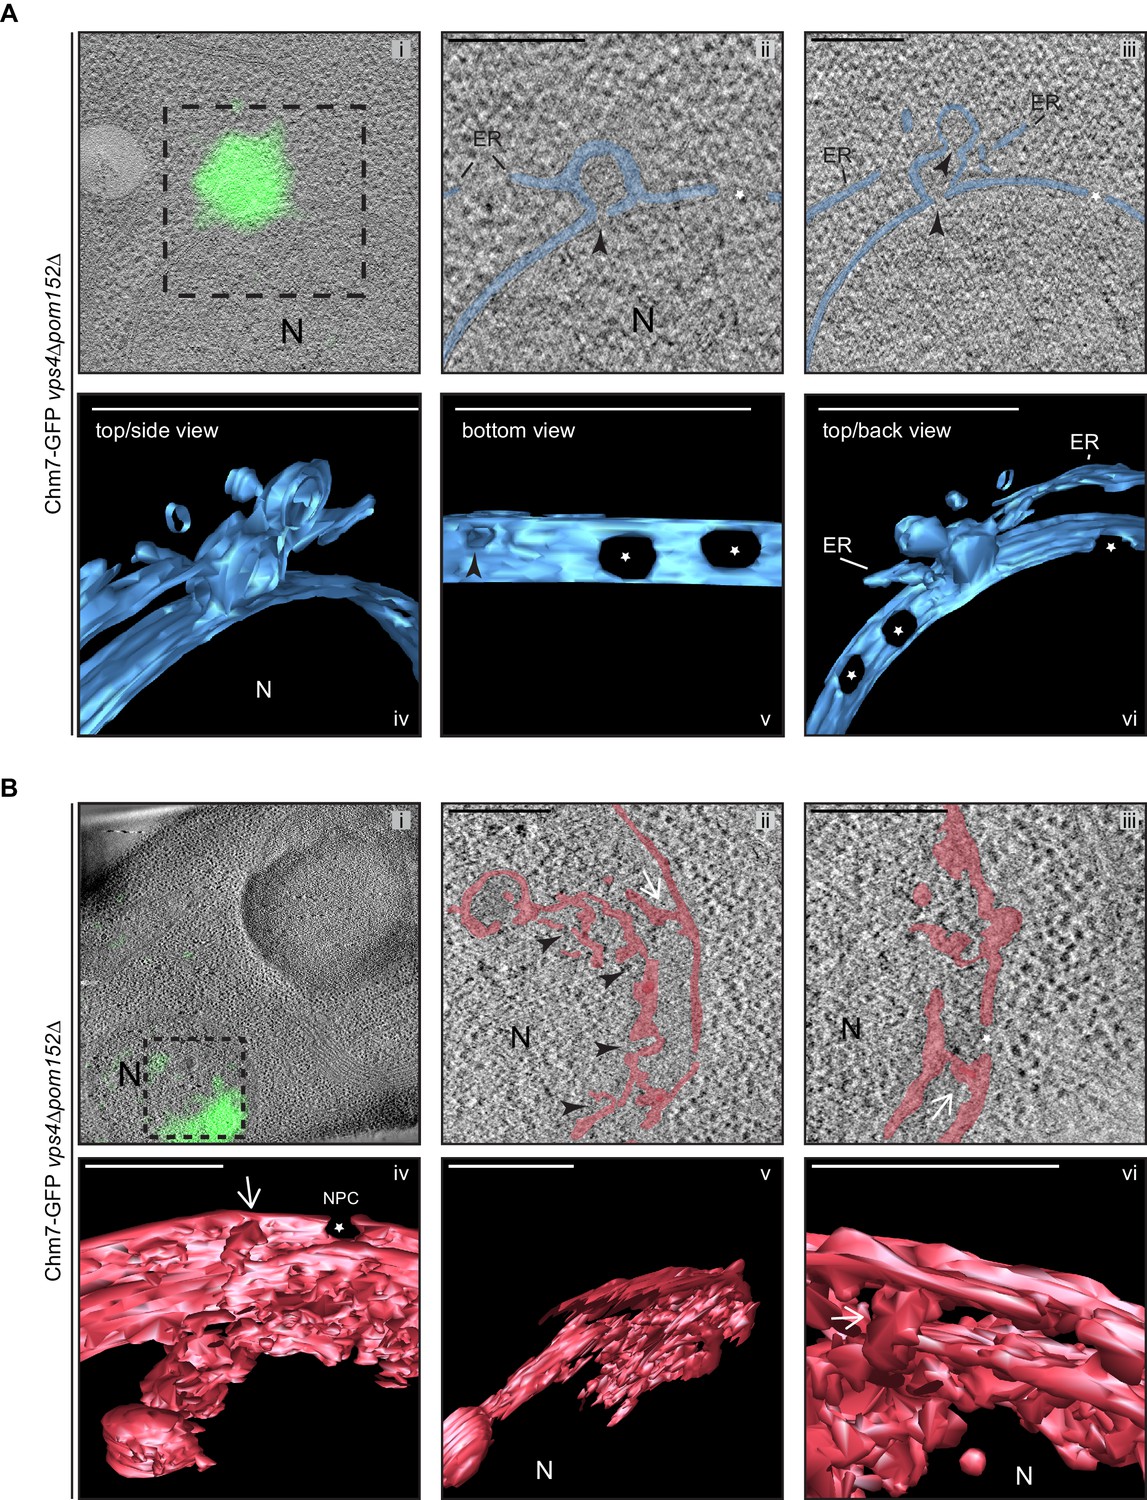
Chm7 associates with nuclear envelope herniations and intranuclear membranes.
(A, B) Correlative light and electron microscopy of 300 nm thick sections was used to examine the morphology of the nuclear envelope at sites of Chm7-GFP accumulation in vps4Δpom152Δ cells. i. Overlay of fluorescent and electron micrographs; boxed region is magnified in ii and iii. ii, iii. Several views along the z-axis of the tomogram shown. iv-vi. 3D models were generated with indicated perspective views shown. Nuclear envelope/ER lumen colored blue or red. Black arrowheads are herniation necks or sites of membrane constriction, stars are nuclear pores. N is nucleus. Scale bars are 250 nm.
Figure 8 with 3 supplements
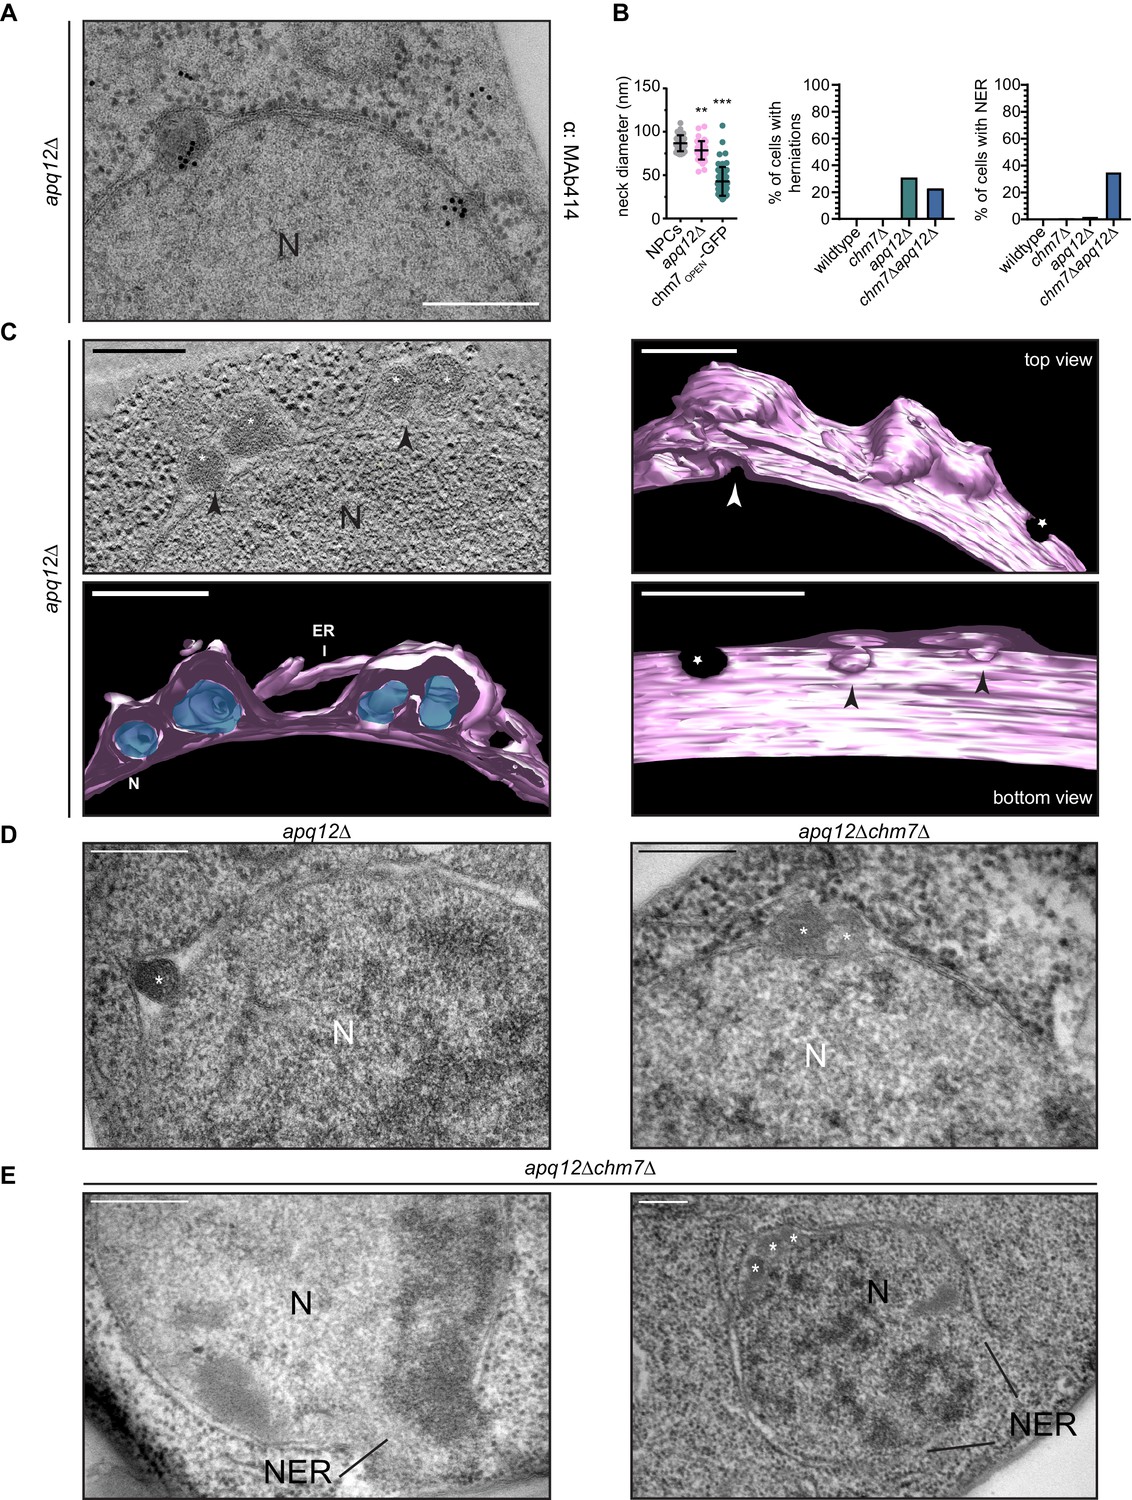
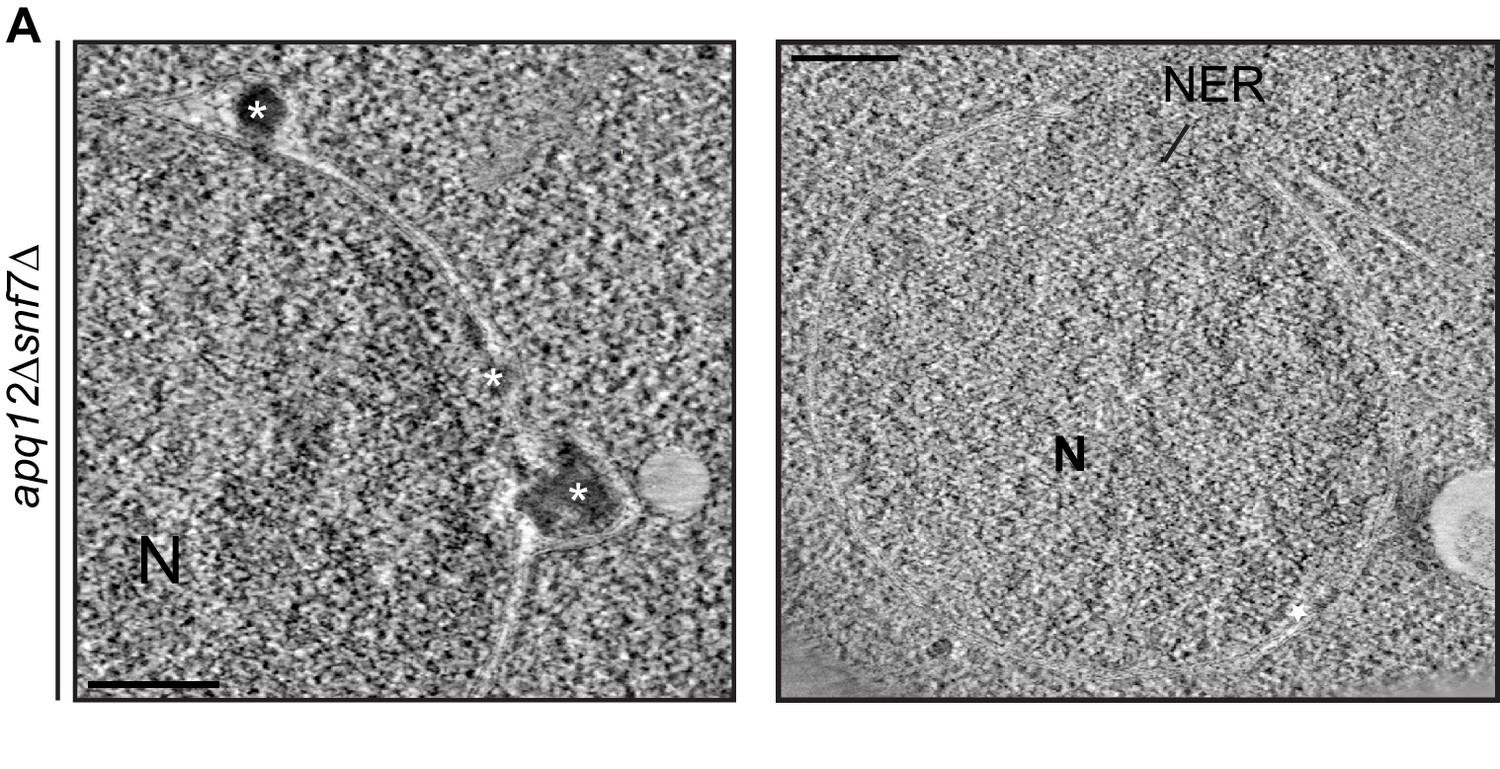
CHM7 is required to maintain the integrity of the nuclear membranes in the context of nucleoporin-associated herniations.
(A) Nucleoporins are found at the bases of nuclear envelope herniations in apq12Δ cells. Immunogold labelling of thin sections of apq12Δ cells with 5 nm gold-conjugated secondary antibodies that detect MAb414 labeled nups at bases of herniations. (B) Left: Plot of the diameter of herniation necks in the indicated genetic backgrounds and fenestrations within the intranuclear membrane network associated with chm7OPEN. Middle: Plot of the percentage of nuclei of the indicated strains where nuclear envelope herniations are observed. Right: Plot of the percentage of nuclei in the indicated strains where nuclear envelope ruptures (NER) are observed. At least 100 cells from each genotype were quantified. P-values are from Student’s t-test, where **p≤0.01, ***p≤0.001. (C) Electron tomograph of 300 nm thick section of apq12Δ cells grown at 37°C for 2 hr. Note the electron density within the herniations. Perspective views of 3D model shown (membranes/nuclear envelope-ER lumen colored pink with electron density within herniation blue). Arrowheads point to herniation necks and stars are nuclear pores. Scale bars are 250 nm. (D) Nuclear envelope herniations associated with nups persist in the absence of CHM7. Representative electron micrographs of the apq12Δ and chm7Δapq12Δ strains grown for 2 hr at 37°C. Asterisks denote herniation lumen. N is nucleus. (E) Nuclear envelope ruptures (NER) are observed in chm7Δapq12Δ cells. Electron micrographs of chm7Δapq12Δ depicting nuclear envelope ruptures (NER). Nucleus is indicated with ‘N’. Scale bars are 250 nm.
Figure 8—figure supplement 1
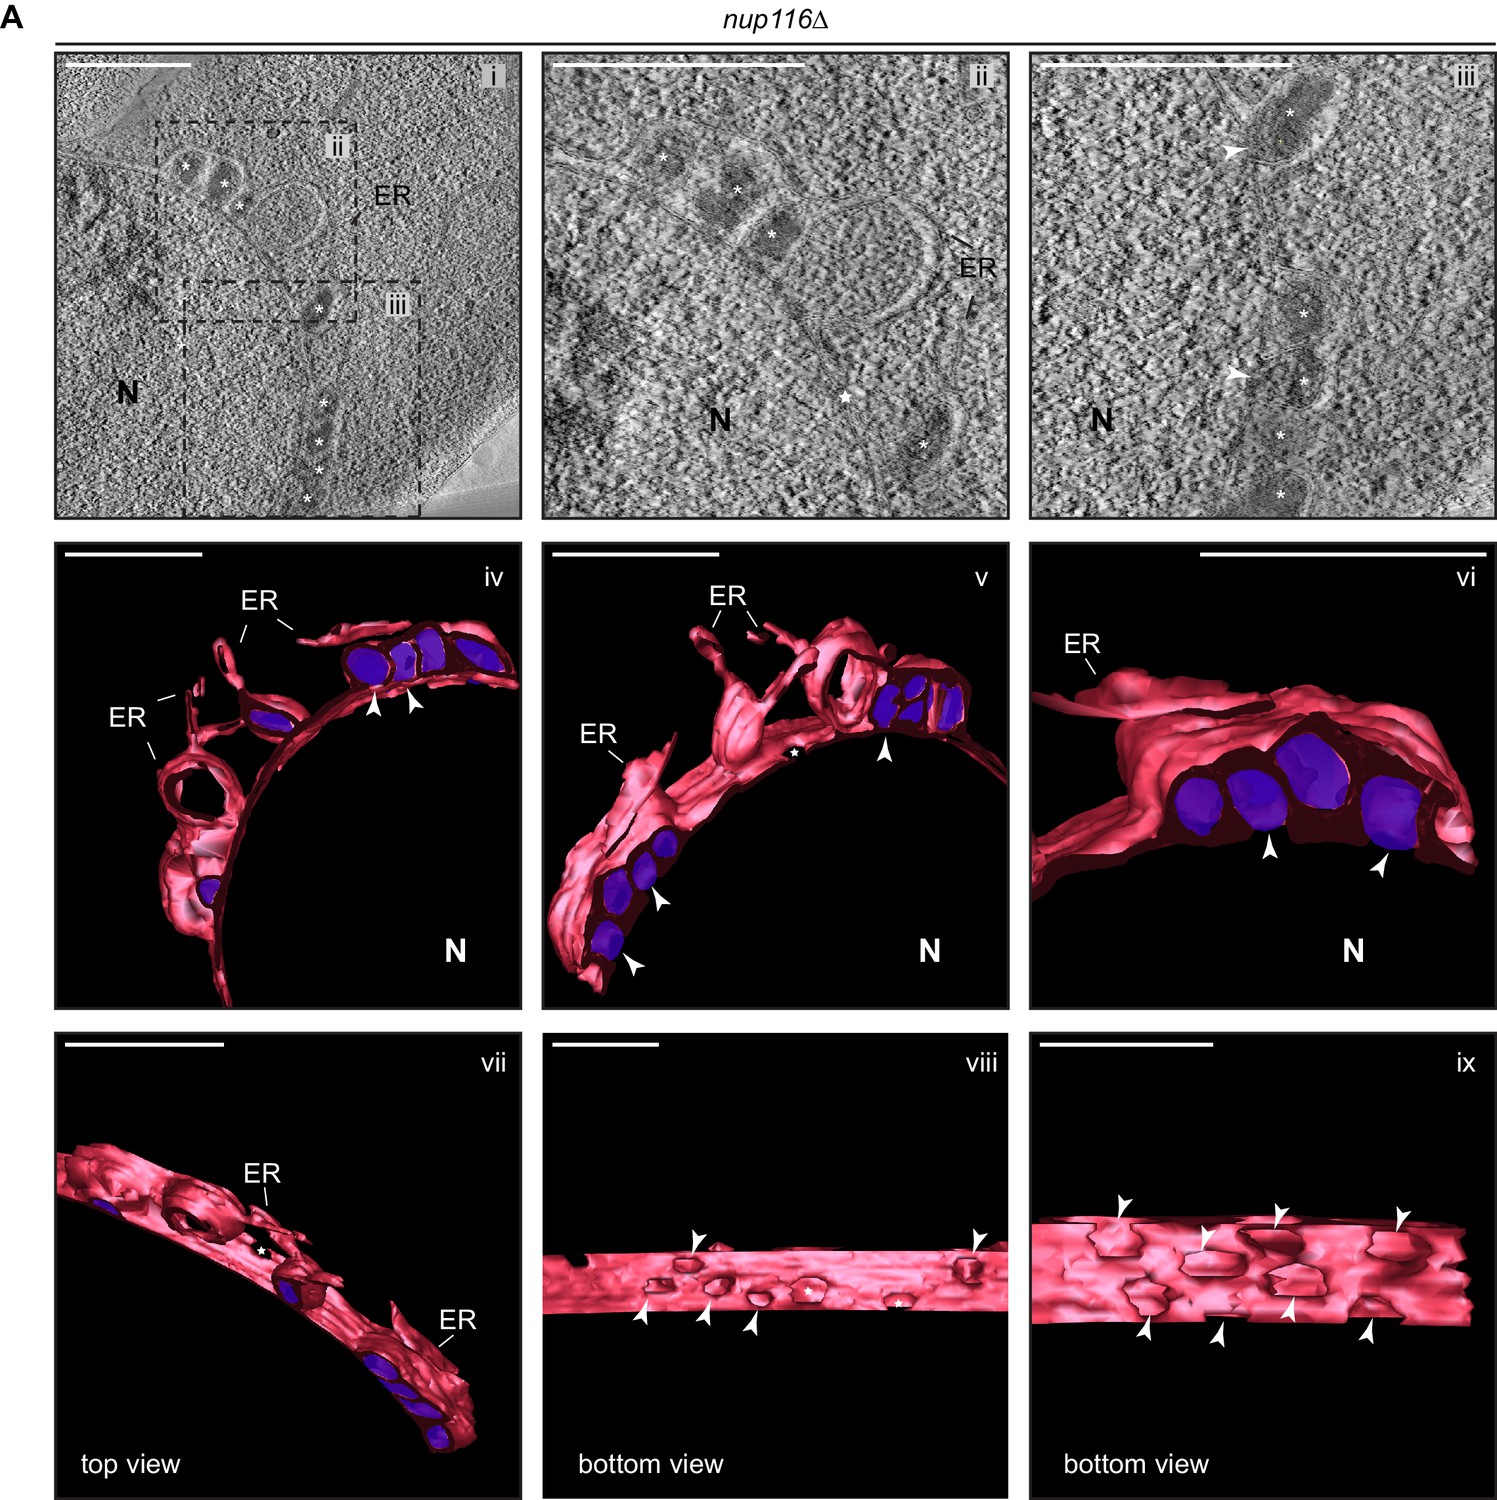
CHM7 is required to maintain the integrity of the nuclear membranes in the context of nucleoporin-associated herniations.
(A) Tomographic slices from 300 nm sections of nup116Δ cell nuclear envelope herniations. i-iii, Tomographic slice with boxed regions magnified in ii and iii. iv-ix. Different persepectives of 3D model with nuclear envelope and ER membranes in red and herniation densities (marked by asterisks in i-iii) are colored purple. White arrowheads point out the bases of the herniations and stars are nuclear pores. Scale bars are 250 nm.
Figure 8—figure supplement 2

CHM7 is required to maintain the integrity of the nuclear membranes in the context of nucleoporin-associated herniations.
(A) Electron micrographs (from thin sections) showing nuclear envelope ruptures (NER) in apq12Δchm7Δ cells after 2 hr at 37°C. Asterisks indicate herniations. Scale bars are 250 nm.
Figure 8—figure supplement 3
CHM7 is required to maintain the integrity of the nuclear membranes in the context of nucleoporin-associated herniations.
(A) Electron micrographs (from thin sections) showing nuclear envelope ruptures (NER) and herniations (asterisks) in apq12Δsnf7Δ cells after 2 hr at 37°C. Scale bars are 250 nm.
Videos
Video 1
Clustering of Heh2-GBP-mCherry in FETA assay requires Heh1.
Related to Figure 4. A timelapse series of fluorescence images acquired at 10 min intervals of Chm7-GFP and Heh2-GBP-mCherry in wildtype and heh1Δ cells. Green, red and merge shown. Timestamp shows elapsed time after galactose induction of Chm7-GFP expression. Images were resized and pixels interpolated in FIJI. Scale bar is 2 µm.
Video 2
Nuclear envelope morphology at sites of chm7OPEN-GFP accumulation.
Related to Figure 6A. Video showing full tomogram and 3D model from a nuclear envelope region of chm7OPEN-GFP accumulation. Scale bar is 250 nm.
Video 3
Nuclear envelope morphology at sites of chm7OPEN-GFP accumulation.
Related to Figure 6B. Video showing full tomogram and 3D model from a nuclear envelope region of chm7OPEN-GFP accumulation. Scale bar is 250 nm.
Video 4
Nuclear envelope morphology at sites of chm7OPEN-GFP accumulation in the absence of SNF7.
Related to Figure 7A. Video showing full tomogram and 3D model from a nuclear envelope region of chm7OPEN-mCherry accumulation. Scale bar is 250 nm.
Video 5
Morphology of nuclear envelope herniations in apq12Δ cells.
Related to Figure 8C. Video showing a tomogram and 3D model of the nuclear envelope in apq12Δ cells. Scale bar is 250 nm.
Video 6
Morphology of nuclear envelope herniations in nup116Δ cells.
Related to Figure 8—figure supplement 1A. Video showing a tomogram and 3D model of the nuclear envelope in nup116Δ cells. Scale bar is 250 nm.
Additional files
-
Supplementary file 1
List of all yeast strains used in this study, their source and/or derivation.
- https://doi.org/10.7554/eLife.45284.026
-
Supplementary file 2
List of all plasmids used in this study, their source and/or derivation.
- https://doi.org/10.7554/eLife.45284.027
-
Transparent reporting form
- https://doi.org/10.7554/eLife.45284.028
Download links
A two-part list of links to download the article, or parts of the article, in various formats.
Downloads (link to download the article as PDF)
Open citations (links to open the citations from this article in various online reference manager services)
Cite this article (links to download the citations from this article in formats compatible with various reference manager tools)
An ESCRT-LEM protein surveillance system is poised to directly monitor the nuclear envelope and nuclear transport system
eLife 8:e45284.
https://doi.org/10.7554/eLife.45284


