The phage L capsid decoration protein has a novel OB-fold and an unusual capsid binding strategy
- University of Connecticut, United States
- Michigan State University, United States
- University of Utah School of Medicine, United States
Figures
Figure 1 with 2 supplements
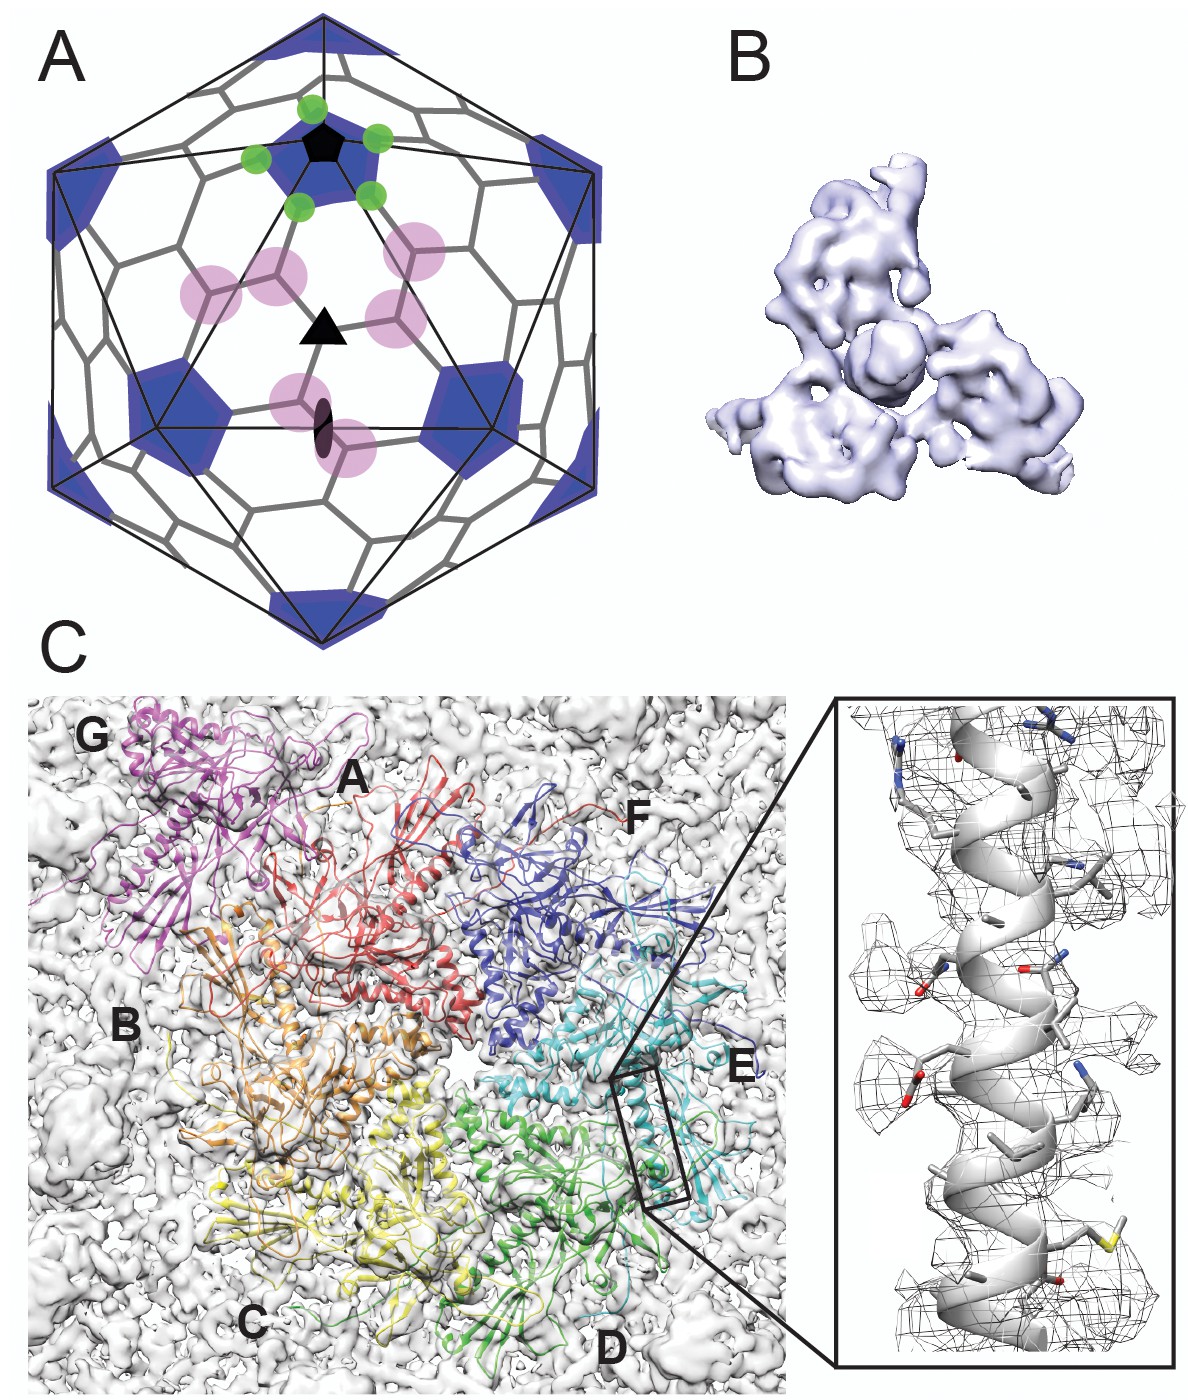
Cryo-EM imaging and icosahedral image reconstruction of the mature phage L capsid.
(A) Schematic of a T = 7 icosahedral capsid overlaid with a black icosahedral cage. The different symmetry axes are marked; two-fold by a black oval, five-fold by a black pentagon, and icosahedral three-fold by a black triangle. Magenta circles highlight quasi three-fold binding sites between hexamers on one icosahedral facet. The magenta quasi three-folds are the preferred binding sites for Dec. Green circles highlight additional quasi three-fold sites between hexons and pentons surrounding one vertex, to which Dec has never been observed to bind. (B) Segmented electron density for a capsid-bound Dec trimer shown in a top-down view. (C) Enlarged view of an asymmetric unit showing coat subunits color coded according to chains A-G, where the coat density is segmented away from the Dec trimer. Additionally, an enlarged area is shown highlighting a region of the spine helix to show the goodness of fit of the coat protein homology model.
Figure 1—figure supplement 1

Phage L cryo-EM and 3D reconstruction data.
(A) Representative micrograph of frozen hydrated phage L particles. (B) FSC curve with FSC0.143 cutoff shown with a dashed line. The red arrow points out the estimated global resolution of the map at 4.2 Å according to the ‘gold standard’ method (Henderson et al., 2012). (C) Phage L surface rendered view, colored accorded to local resolution with an octant of the virion removed to show the internal genome organization. The color bar indicates resolution in Å.
Figure 1—figure supplement 2
Phage L coat protein subunit.
(A) Single coat protein monomer color-coded according to domain boundaries (N-arm in red, P-domain in green, E-loop in yellow, A-domain in cyan, and I-domain in magenta). (B) 1/8th of the capsid used for modeling with coat protein segmentation is colored in grey and the Dec segmentation is colored in lavender. Note the map is rotated to peer down a icosahedral three-fold axis in the center of the area that was modeled to emphasize the lack of Dec density at this location.
Figure 2
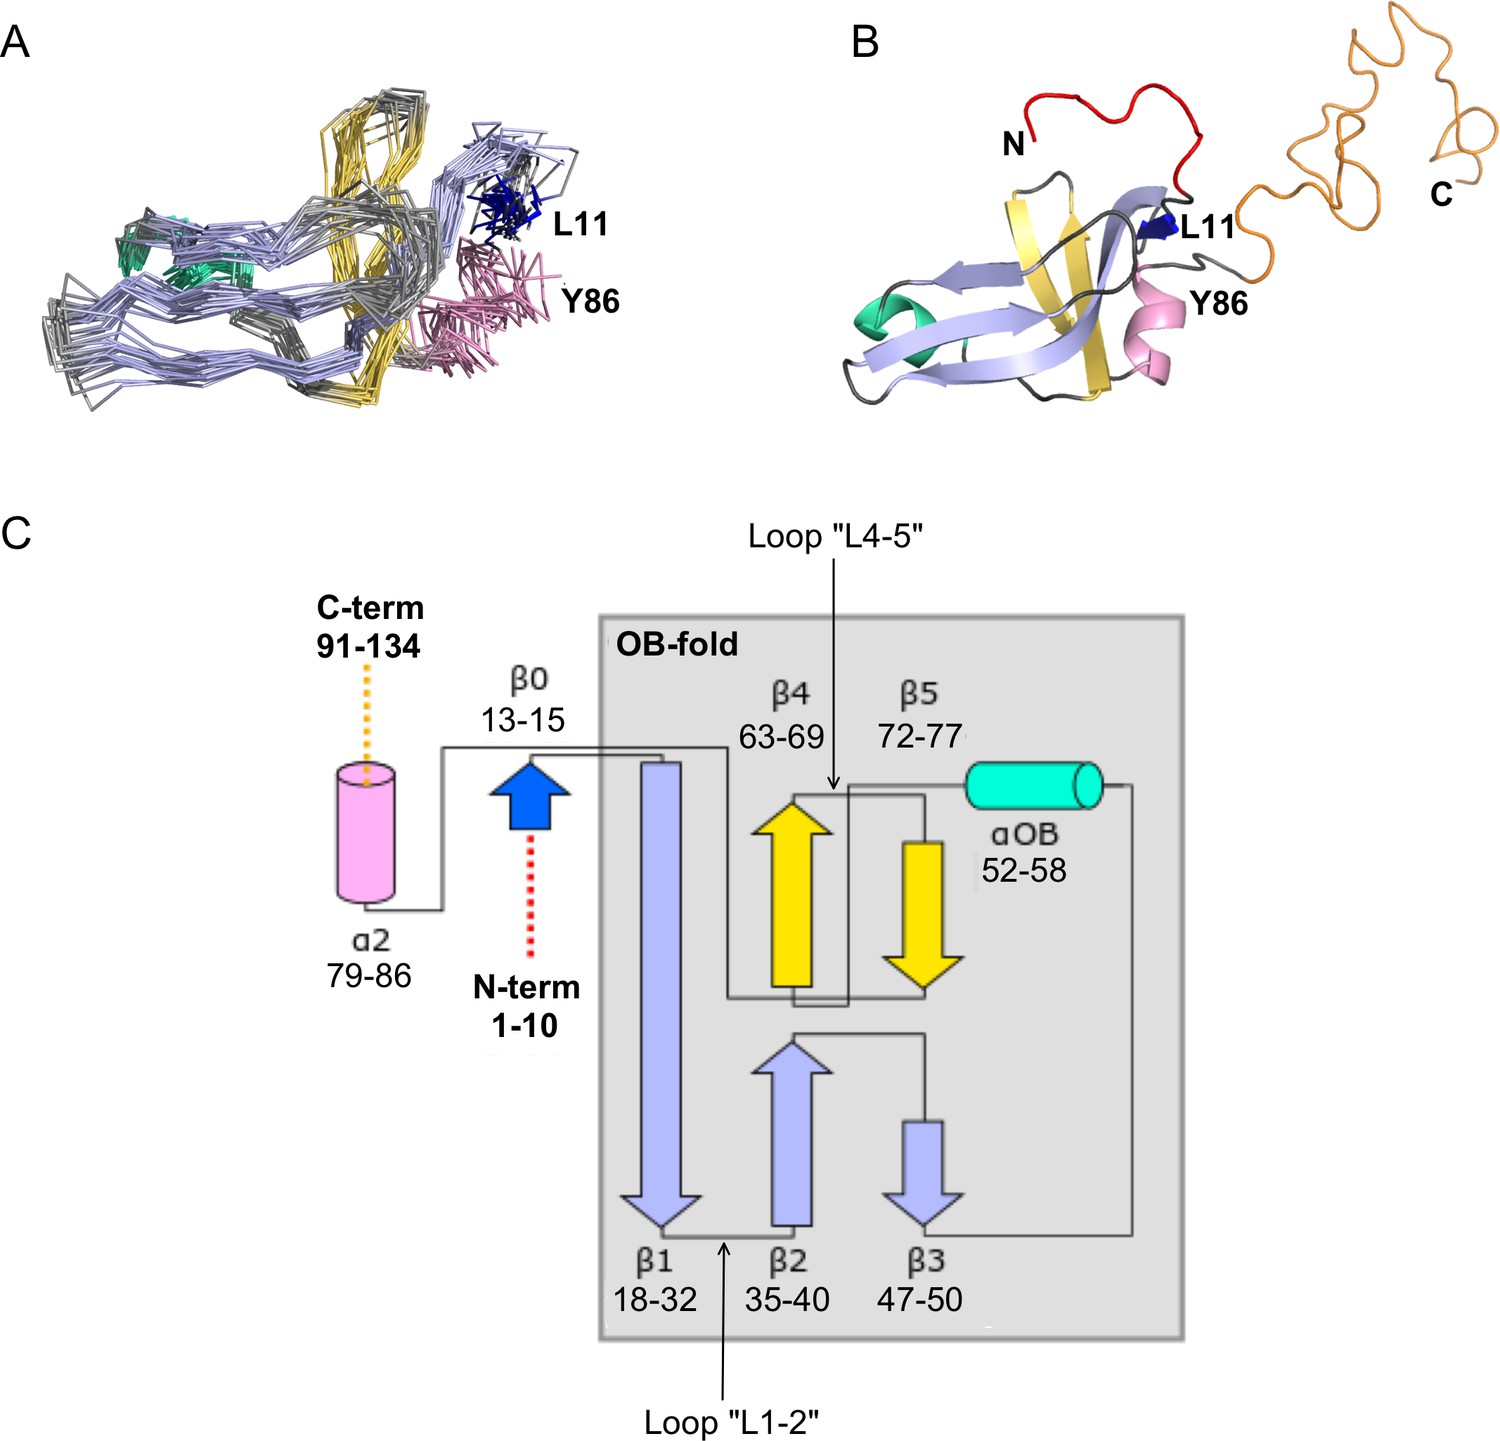
NMR structure of the Dec monomer.
(A) Ensemble of the 20 lowest-energy NMR structures. For clarity, the disordered N- and C-termini are not shown. The folded globular part of Dec has an OB-fold consisting of a β1-β3 meander (sky blue) and a β4-β5 hairpin (yellow), with an α-helix (green) intervening between strands β3 and β4. Additional secondary structure outside of the OB-fold incudes the short N-terminal strand β0 (dark blue), and a C-terminal α-helix (pink). (B) Ribbon diagram showing the structure closest to the NMR average. The first 10 N-terminal residues and the last ~45 C-terminal residues, which are unstructured in the Dec monomers are colored red and orange, respectively. The coloring scheme for the protein in this and subsequent panels is the same as in A. (C) Diagram summarizing the topology and secondary structure limits of the Dec monomers.
Figure 3 with 2 supplements
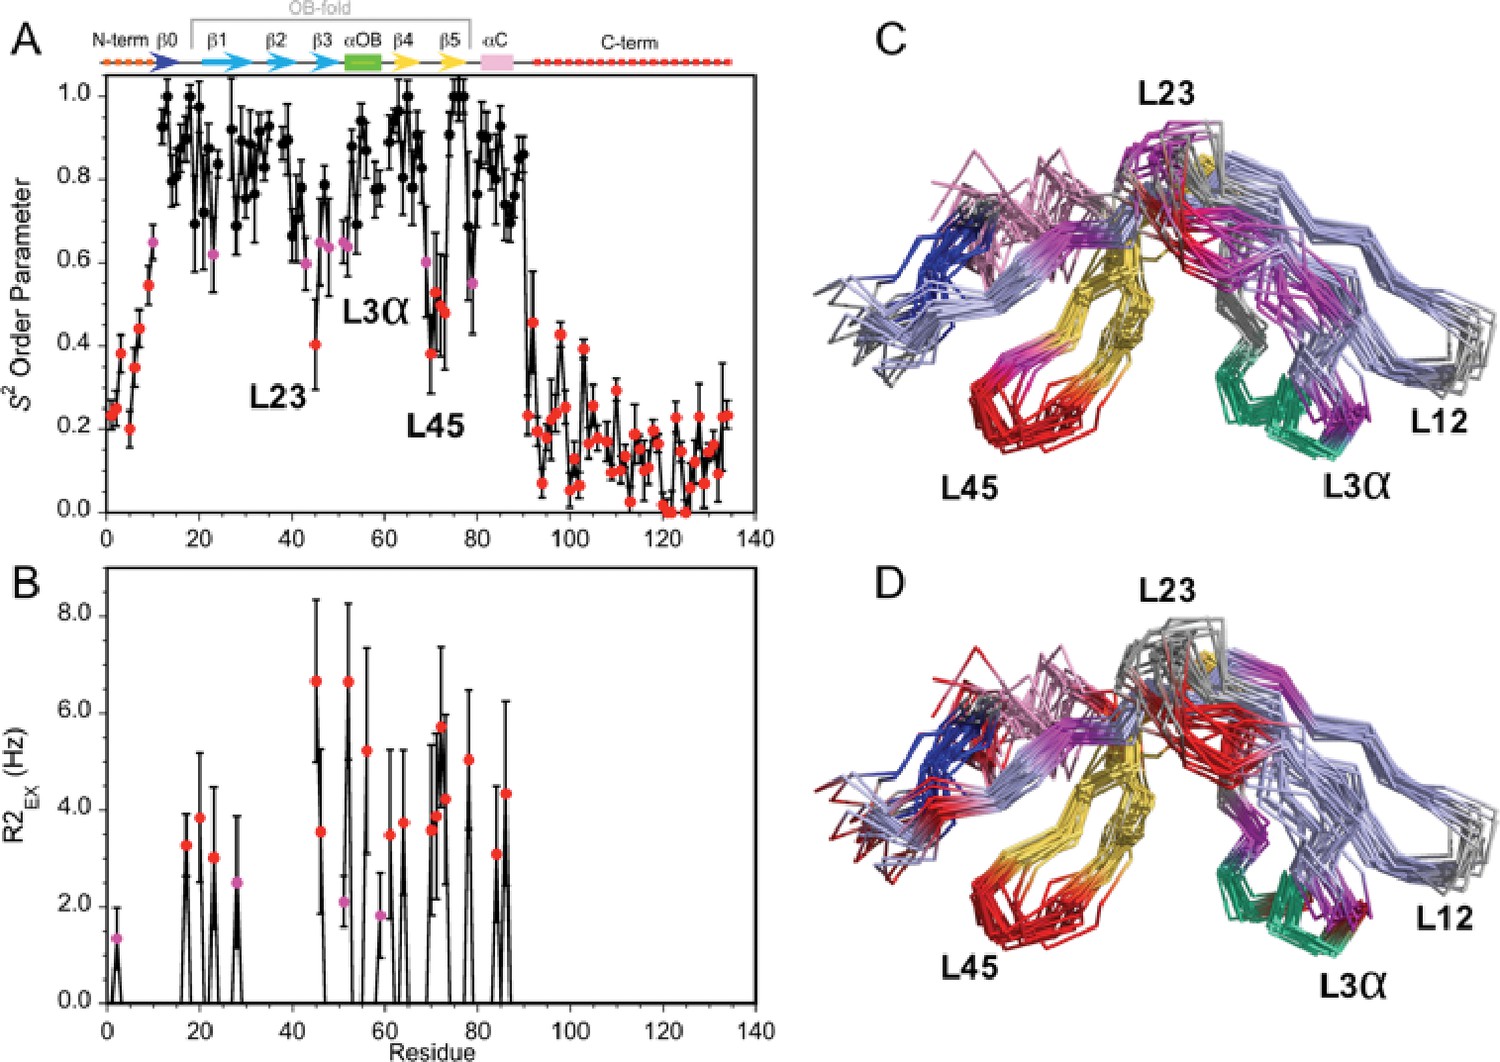
Dynamics of the Dec monomer.
(A) S2 order parameters describing the amplitude of fast motions on the ps-ns timescale. Rigid (S2 >0.65), moderately flexible (0.65 ≥ S2>0.55), and highly flexible (0.55 ≥ S2) sites are indicated by black, purple, and red symbols respectively. The secondary structure of Dec is given at the top of panel A. (B) Contributions to R2 relaxation from slow conformational exchange on the µs-ms timescale. Amide protons with moderate R2ex values smaller than 3 Hz are shown in purple, those with large contributions above 3 Hz in red. The S2 and R2ex parameters were obtained from a Model-Free analysis (Lipari and Szabo, 1982) of 15N R1, R2, and 1H-15N NOE relaxation data for Dec (Figure 3—figure supplement 1) using the program TENSOR 2.0 (Dosset et al., 2000). In (C) and (D) the S2 and R2ex values are mapped onto the NMR structure ensembles for Dec. Residues 1–10 and 90–134 which are unfolded and thus have the lowest S2 values, are not shown in the structures.
Figure 3—figure supplement 1
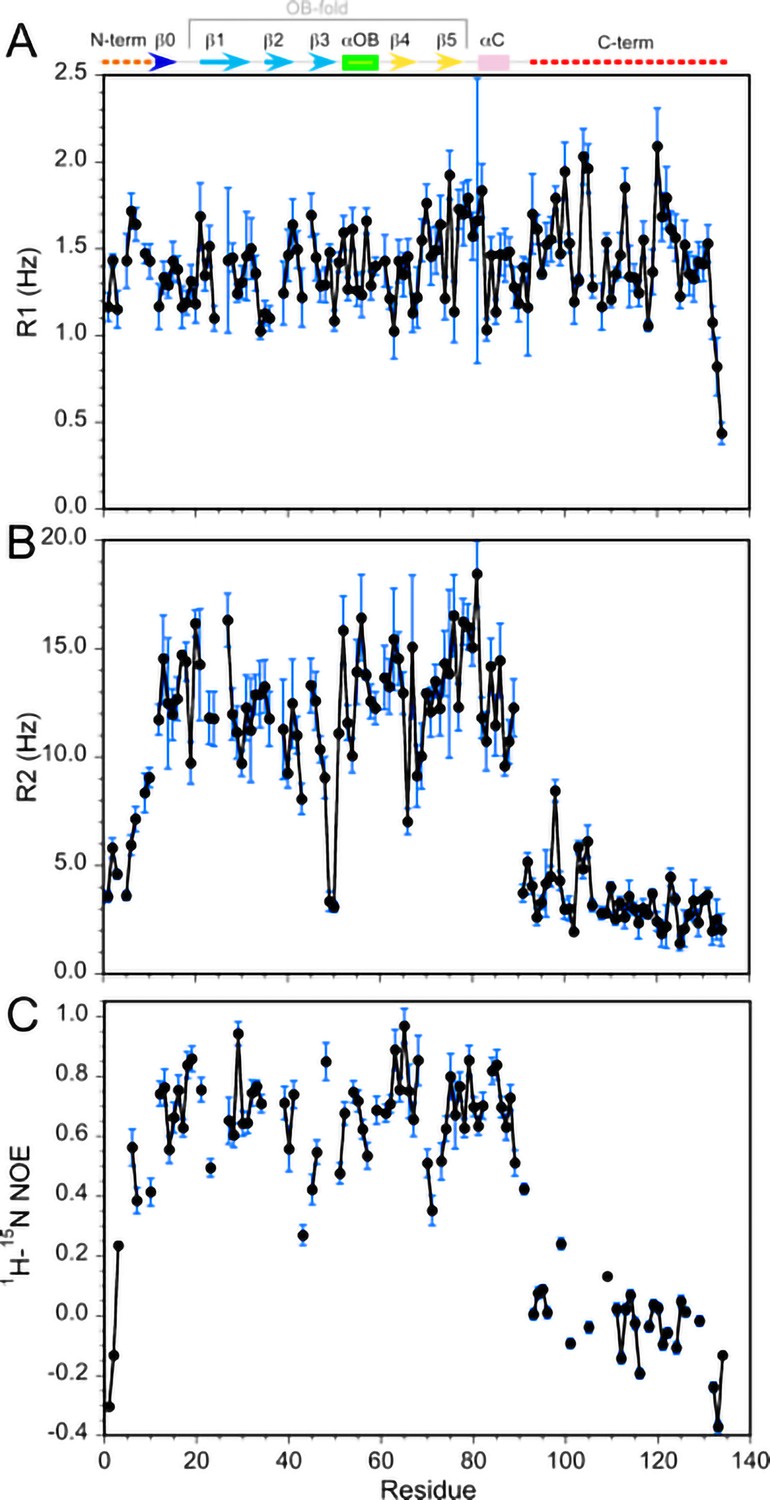
15N relaxation values for monomeric Dec.
(A) R1, (B) R2, (C) 1H-15N NOE. All data were recorded at 800 MHz, with a sample temperature of 33°C. The secondary structure of Dec, derived from its NMR structure, is indicated at the top of the first panel. The average R2 and R1 values for the folded portions of Dec are about 13 Hz and 1.4 Hz, respectively. For comparison, a Dec trimer with the expected theoretical MW of 43 KDa should have R2 and R1 values near 50 Hz and 0.4 Hz, respectively (Kumar et al., 2018). Thus, the 15N relaxation data for Dec samples subjected to our unfolding/refolding protocol are more consistent with a 14.4 KDa Dec monomer than a trimer. Similarly, the Model-Free analysis of the 15N relaxation data gives an optimum global correlation time for isotropic rotational diffusion of 7.4 ns, consistent with a Dec monomer. For a 43 KDa trimer the value of the correlation time should be about 21 ns.
Figure 3—figure supplement 2
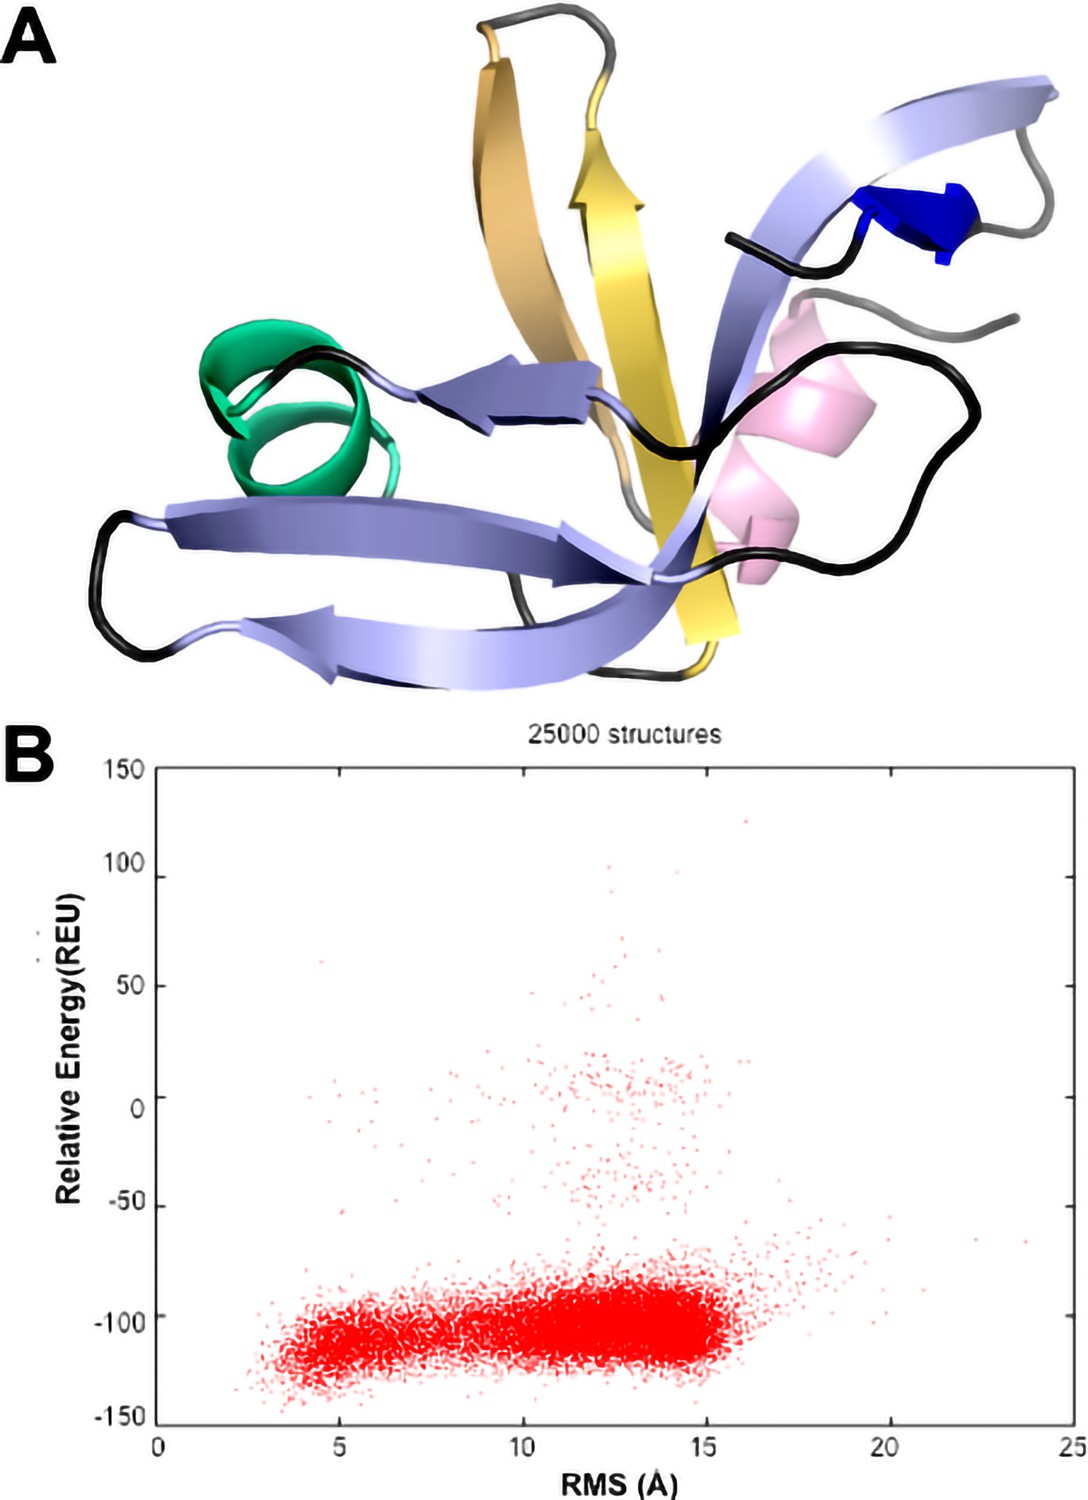
CS-ROSETTA modeling of the Dec monomer structure.
(A) The lowest energy model based on the assigned NMR chemical shifts of Dec (Newcomer et al., 2018) has an OB-fold topology. Only residues 10–88 were included in the CS-ROSETTA simulations (Shen et al., 2009), since the program predicted that residues 1–9 and 89–134 are disordered, based on the assigned NMR chemical shifts. The 5-stranded, Greek Key β-barrel OB-fold motif (Murzin, 1993) is formed from a β1-b3 meander (light blue) and a β4-β5 hairpin (yellow), with an α-helix (green) intervening between strands β3 and β4. (B) Graph showing convergence of the CS-ROSETTA simulations. The statistics indicated that the CS-ROSETTA simulations did not fully converge. In spite of this, nine of the top 10 lowest energy structures had an OB-fold structure with an average RMSD of 2.5 Å to the structure shown in (A).
Figure 4
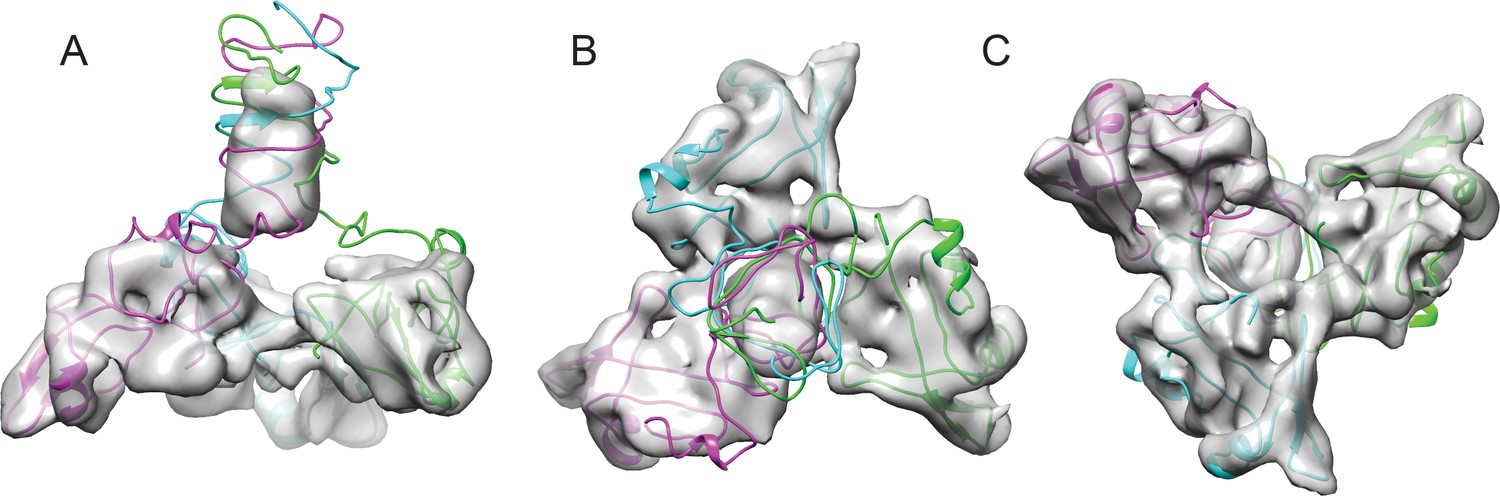
Fitting the NMR OB-fold into the cryo-EM map and model of the trimer.
(A) Side B) top-down, and C) bottom-up views of the Dec trimer model fit into the cryo-EM density map with individual chains colored magenta, cyan, and green.
Figure 5
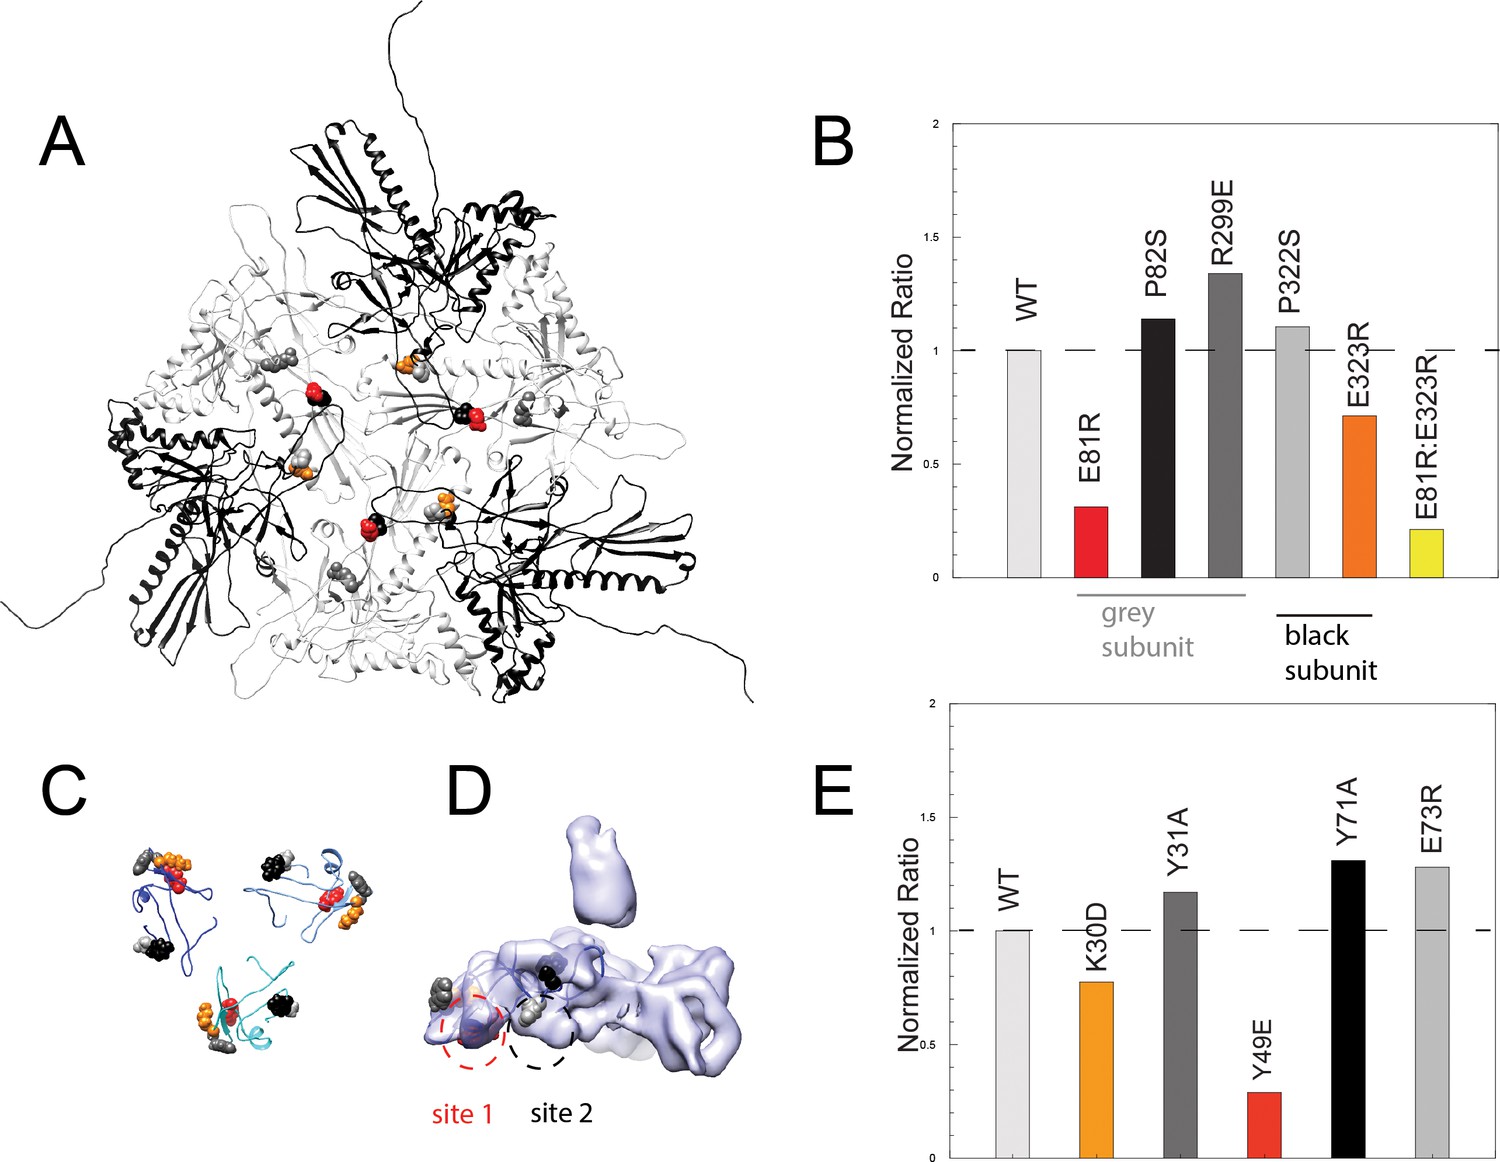
Binding assays of variant coat proteins and Dec to probe the interaction interface.
(A) Coat protein subunits depicted as ribbon diagrams around a quasi three-fold axis Dec-binding site. Three coat subunits directly surrounding a quasi three-fold axis are shown in light grey, and three neighboring coat proteins are shown in black. Residues selected for mutagenesis are shown as spheres. (B) Normalized binding data of the ratio of variant coat protein bound to WT Dec, color-coded to match the corresponding residues in panel A. (C) Portions of Dec highlighting the OB-fold (residues 10–77) shown as ribbons, with each monomer a different shade of blue. Residues selected for mutagenesis are shown as spheres. (D) Enlarged side view of the Dec cryo-EM density with the OB-fold (residues 10–77) from one monomer shown as a ribbon, with the two different capsid-binding sites indicated. (E) Normalized binding data of the ratio of WT coat protein bound to variant Dec, and color-coded to match the corresponding residues in panels C and D.
Figure 6

Comparison of Dec-binding residues at various three-fold symmetry sites on the phage L capsid.
The topology of six coat protein subunits surrounding the different three-fold positions were compared using the Match tool in Chimera. The quasi three-fold site between coat protein hexamers that binds a Dec trimer was chosen as the reference structure and aligned to the three-fold site between a pentamer and neighboring hexamers (dark blue) that does not bind Dec. The cartoon schematic shows the location of residue E81 with a small magenta circle on three coat protein subunits that comprise the Dec binding interface (label ‘A’ designates the specific coat protein subunit used for anchoring the structures in Chimera). The relative displacement of E81 in subunits labeled ‘1’ or ‘2’ when in an icosahedral three-fold or the quasi three-fold surrounding pentamers was measured and the distances are shown in the table. A side view of the quasi three-fold site between hexamers that binds Dec (light blue) with the quasi three-fold site between a penatmer and neighboring hexamers (dark blue) is shown as a ribbon diagram. The box shows an enlarged and tilted view of the binding interface with residue E81 shown as spheres. Additionally, the Dec density is shown in lavender at the position of the quasi three-fold site between hexamers.
Figure 7
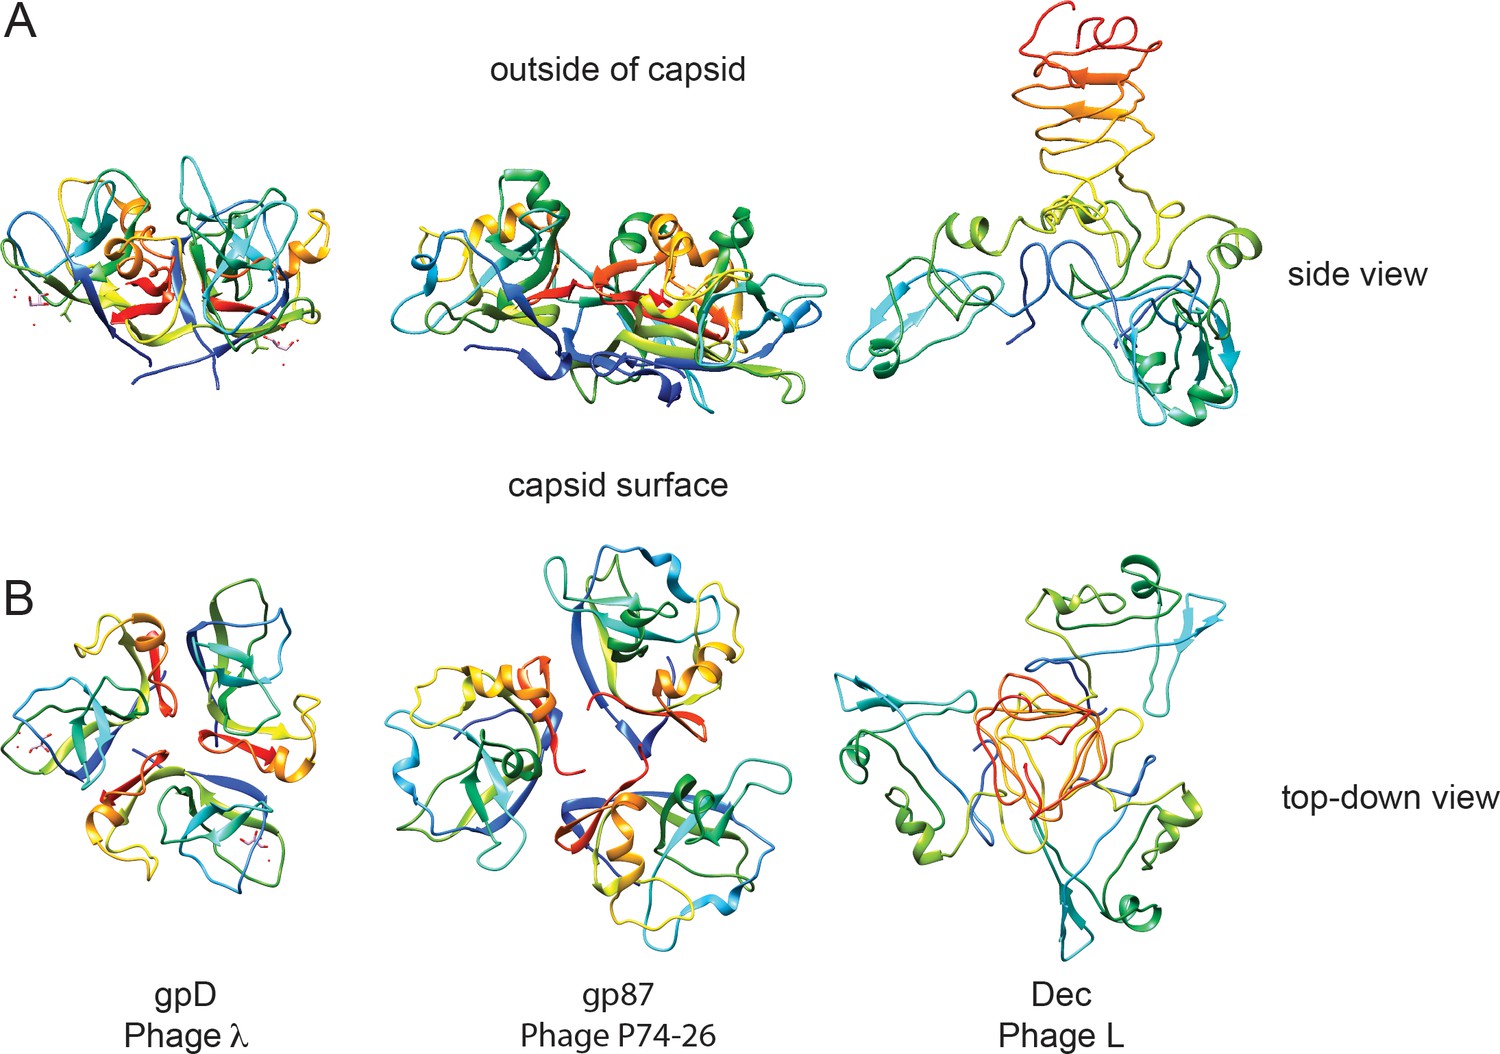
Comparison of decoration proteins.
(A) Side and B) top-down views of decoration proteins gpD (PDB ID 1C5E), gp87 (PDB ID 6BL5) and Dec (PDB ID 6D2D). Chains of each trimer are rainbow colored from N-terminus (blue) to C-terminus (red).
Videos
Video 1
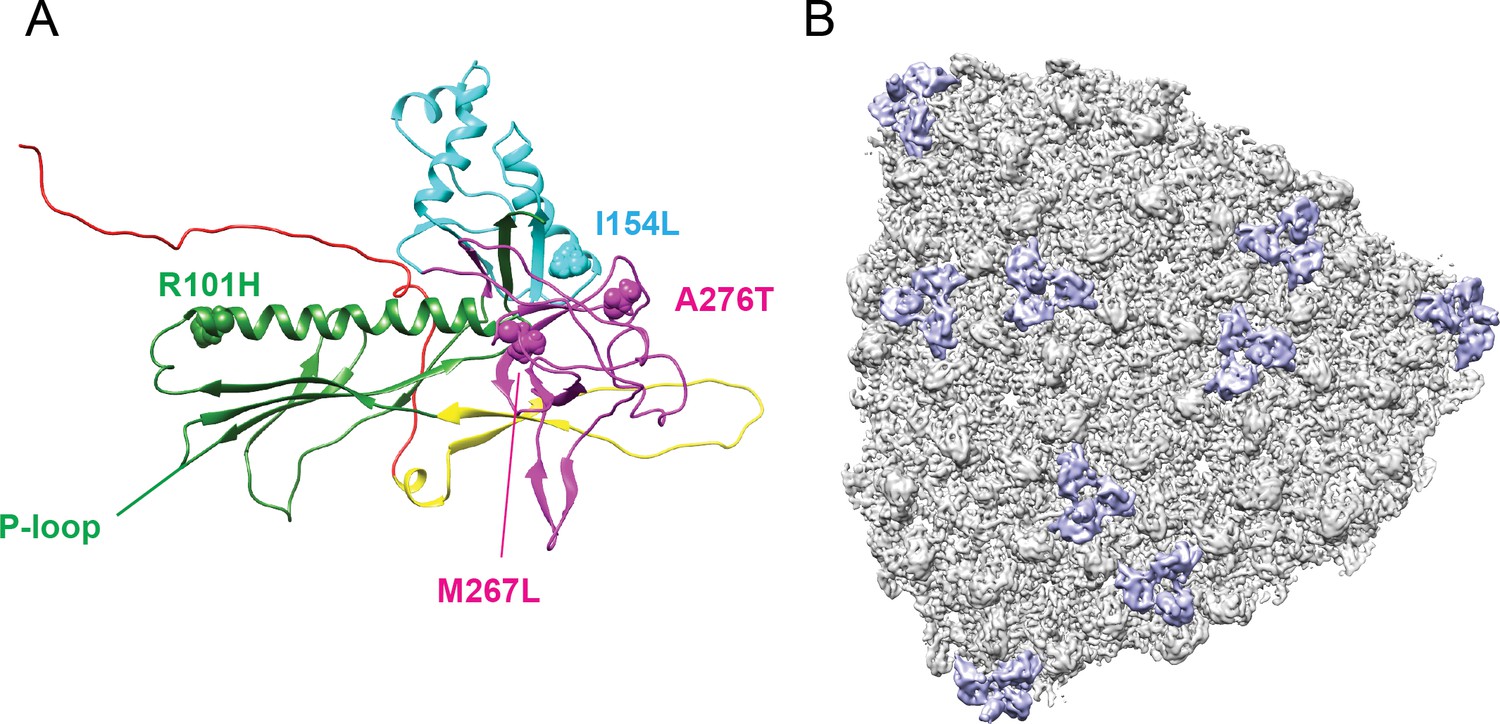
Location of the amino acid differences between phage L and P22, relative to the Dec binding interface.
A single segmented Dec density is shown in lavender, and coat protein subunits that comprise the binding interface are shown as grey ribbons. The amino acid substitutions between phage L and P22 are shown as spheres color-coded to match the protein domains as shown in Figure 1—figure supplement 2: R101H (green), I154L (cyan), A276 and M267 (magenta).
Video 2
Definition of different regions of the Dec monomer NMR structure.
To illustrate the precision of the structure all 20 members of the NMR ensemble are shown. The movie then flips through the 20 individual NMR structures to show the differences in precision between the structured OB-fold component, and the unstructured N- (yellow) and C-termini (orange). In the second half of the movie, the N- and C-termini are not shown to better illustrate differences in structural definition of the OB-fold component.
Video 3
Key residues that modulate Dec-binding affinity.
View of the binding interactions between Dec and coat protein at a quasi-three-fold symmetry axis. Coat protein is shown in grey density and Dec is shown in lavender. Six coat subunits are fit within this density and three Dec OB-fold domains from the NMR structure were fit to the Dec density. Individual protein chains are shown are ribbons; amino acid sites that were chosen for mutagenesis are shown as spheres, and color coded to match the data in Figure 5 of the main text.
Tables
Table 1
Cryo-EM data collection and model refinement statistics.
https://doi.org/10.7554/eLife.45345.005| Data collection | ||
| EM equipment | FEI Titan Krios | |
| Voltage (kV) | 300 | |
| Detector | DE-20 | |
| Pixel size (Å) | 1.26 | |
| Electron Dose (e-/Å2) | 27 | |
| Defocus range (μm) | 0.35–2.49 | |
| Reconstruction | ||
| Software | AUTO3DEM | |
| Number of particles | 7879 | |
| Symmetry | 532 | |
| Map resolution (Å) at FSC = 0.143 | 4.2 | |
| Model building and Refinement | ||
| Software | COOT, Phenix | |
| Model Statistics and Validation | Coat | Dec |
| No. protein chains in ASU | 7 | 3 |
| No. residues per protein | 430 | 134 |
| Model resolution (Å) at FSC = 0.5 | 4.30 | 5.80 |
| Cross-correlation coefficient (CC) | 0.61 | 0.40 |
| MolProbity Score | 2.21 | 1.93 |
| Clashscore | 2.20 | 0.87 |
| R.m.s. deviations | ||
| Bond length (Å) | 0.021 | 0.018 |
| Bond angle (˚) | 2.62 | 2.21 |
| Preferred | 92.42 | 77.53 |
| Allowed | 5.41 | 13.69 |
| Outlier | 2.17 | 8.59 |
Table 2
Statistics for the top 20 NMR structures of Dec.
https://doi.org/10.7554/eLife.45345.007| Experimental restraints | ||
|---|---|---|
| Total number of NMR restraints | 1009 | |
| Total number of NOE distance restraints | 767 | |
| Ambiguous | 73 | |
| Unambiguous | 694 | |
| Long range (|i-j| > 4) | 124 | |
| Medium range (|i-j|)≤4) | 93 | |
| Sequential (|i-j|)=1) | 281 | |
| Intra-residue NOEs | 269 | |
| Total number of dihedral restraints | 174 | |
| φ/ ψ | 127 | |
| χ1 | 47 | |
| Hydrogen bond restraints (34*2) | 68 | |
| RMSD from experimental restraints* | ||
| NOE distance (Å) | 0.054 ± 0.003 | |
| Dihedral (°) | 0.42 ± 0.14 | |
| RMSD from ideal geometry | ||
| Bonds (Å) | 0.0042 ± 0.0001 | |
| Angles (°) | 0.55 ± 0.02 | |
| Improper angles (°) | 1.68 ± 0.12 | |
| EL-J (kcal/mol) | - 316 ± 44 | |
| RMSD from mean NMR structure | Backbone† | All Heavy Atoms |
| Entire protein 1–134 (Å) | >9.5 | >9.5 |
| Folded regions 12–86 (Å) | 1.33 ± 0.21 | 1.95 ± 0.32 |
| OB-fold 18–77 (Å) | 1.08 ± 0.18 | 1.66 ± 0.25 |
| OB-fold 2o structure‡ (Å) | 0.84 ± 0.15 | 1.57 ± 0.31 |
| Procheck Ramachandran Plot Statistics§ | ||
| Most favored (%) | 89.1 | |
| Additionally allowed (%) | 10.9 | |
| Generously allowed (%) | 0.0 | |
| Disallowed (%) | 0.0 | |
| Quality Z Scores from PSVSe | ||
| Procheck (ϕ,ψ) | −2.64 | |
| Molprobity Clash | −1.19 |
-
* Structures had no NOE violations > 0.5 Å nor dihedral violations > 5 degrees.
† Atoms: Cα, N, C, O.
-
‡ Calculated over residues in the OB-fold portion: 21–32 (β1), 35–40 (β2), 47–50 (β3), 52–59 (αOB), 63–68 (β4), 73–77 (β5), a total of 41 amino acids.
§ Calculated with the PSVS server (http://psvs-1_5-dev.nesg.org) using only the folded parts of Dec (residues 12–89).
Key resources table
| Reagent type (species) or resource | Designation | Source or reference | Identifiers | Additional information |
|---|---|---|---|---|
| Strain, strain background (Salmonella enterica) | DB7136 (Salmonella enterica serovar Typhimurium; used to purify phages) | PMID: 15743953 | Host for phages P22 and L | |
| Strain, strain background (Escherichia coli) | BL21/DE3/pLysS (Escherichia coli; used for protein purification) | Invitrogen | Protein expression system | |
| Strain, strain background (Phage P22) | Phage P22 (P22 5-am N114) | PMID: 4773026 | Phage, clear plaque mutant | |
| Strain, strain background (Phage L) | Phage L | PMID: 15743953 | Phage, clear plaque mutant | |
| Recombinant DNA reagent | pMS11 (plasmid-coat protein; used in binding assays) | PMID: 24126914 | Plasmid for coat protein complementation | |
| Recombinant DNA reagent | pDec (plasmid-Dec protein; used in binding assays) | PMID: 22575828 | Plasmid for Dec protein purification-C-terminal his tag | |
| Recombinant DNA reagent | pDec-NMR (plasmid- Dec protein; used in NMR experiments) | PMID: 30109462 | ||
| Sequence- based reagent | Primers-coat protein mutants: E81R (gtaaacatgggaccgccggataacgacttcttccagttgcg); P82S (gcggtaaacatgggagagtccgataacgacttcttccagttgcg); R299E (gcgactttctccgtagtcgaagttgttgacggtactcatgttg); P322S (gatgtttccctgtcttccgagcagcgtgcctacgccaacgtt); E323R (gatgtttccctgtctccgcgccagcgtgcctacgccaacgtt) | IDT | ||
| Sequence- based reagent | Primers-Dec protein mutants: K30D (gtgtctgcgcttccgattaaagctatcgagtacgctaatgacgg); Y31A (tgtctgcgcttccgattaaagctatcaaagccgctaatgacgga); Y49E (ggcccgtatgctgaccaggagatgtcagcgcaaacagtagcc); Y71A (ggatatctgttccggagccaggccggcgagctgctctatatgagc); E73R (ggatatctgttccggagccagtacggcaggctgctctatatgagc) | IDT | ||
| Commercial assay or kit | Quikchange | Agilent | ||
| Commercial assay or kit | Mini prep kits | Qiagen | ||
| Compound, chemical or drug | Isopropyl β-D-1-thiogalactopyranoside | GoldBio | Protein expression | |
| Compound, chemical or drug | Ampicillin | Amresco | Selection media | |
| Other | LB (broth and agar) | Invitrogen | Media | |
| Other | 15N- Ammonium Chloride | Cambridge Isotope Laboratories | Isotopic labeling | |
| Other | Deuterium Oxide (99.8%) | Sigma Aldrich | Isotopic labeling | |
| Other | 13C6 Glucose | Cambridge Isotope Laboratories | Isotopic labeling | |
| Other | D-Glucose-13C6,1,2,3,4,5,6,6-d7 | Cambridge Isotope Laboratories | Isotopic labeling | |
| Other | Quantifoil R2/2 | Ted Pella | Cryo-EM support film | |
| Software, algorithm | Leginon | PMID: 11121305 | RRID:SCR_016731 | Cryo-EM data collection |
| Software, algorithm | SerialEM | PMID: 16182563 | Cryo-EM data collection | |
| Software, algorithm | auto3dem | PMID: 17029842 | Cryo-EM 3D reconstruction | |
| Software, algorithm | RobEM | Timothy S Baker's lab, UCSD | Cryo-EM 3D reconstruction | |
| Software, algorithm | Phenix | PMID: 29872004 | RRID:SCR_014224 | Cryo-EM map fitting and analysis |
| Software, algorithm | UCSF Chimera | PMID: 15264254 | RRID:SCR_004097 | cryo-EM image visualization |
| Software, algorithm | NAMD | PMID: 16222654 | RRID:SCR_014894 | Homology modeling |
| Software, algorithm | CHARMM | PMID: 19444816 | RRID:SCR_014892 | Homology modeling |
| Software, algorithm | MMTSB Tool Set | PMID: 15099834 | Homology modeling | |
| Software, algorithm | ccpNmr analysis | PMID: 15815974 | RRID:SCR_016983 | NMR data analysis |
| Software, algorithm | Aria | PMID: 17121777 | NMR data analysis | |
| Software, algorithm | CS-ROSETTA | PMID: 19034676 | RRID:SCR_015701 | NMR data analysis |
| Software, algorithm | TALOS-N | PMID: 23728592 | NMR data analysis | |
| Software, algorithm | Tensor-2 | PMID: 10718609 | NMR data analysis | |
| Software, algorithm | Dali | PMID: 20457744 | RRID:SCR_013433 | NMR data analysis |
| Software, algorithm | NMRbox | PMID: 28445744 | RRID:SCR_014827 | NMR data analysis |
Additional files
-
Transparent reporting form
- https://doi.org/10.7554/eLife.45345.018
Download links
A two-part list of links to download the article, or parts of the article, in various formats.
Downloads (link to download the article as PDF)
Open citations (links to open the citations from this article in various online reference manager services)
Cite this article (links to download the citations from this article in formats compatible with various reference manager tools)
The phage L capsid decoration protein has a novel OB-fold and an unusual capsid binding strategy
eLife 8:e45345.
https://doi.org/10.7554/eLife.45345


