Replication Study: Wnt activity defines colon cancer stem cells and is regulated by the microenvironment
- PhenoVista Biosciences, United States
- Explora BioLabs Inc, United States
Figures
Figure 1 with 1 supplement

Analysis of CSC marker expression in TOP-GFP cultures.
(A) Representative images of the three independent single-cell-cloned CSC cultures, lentivirally transduced with TOP-GFP. Phase contrast (top) and fluorescence microscopy (bottom) for each of the cultures indicated. Bar = 90 µm. (B) Single parameter histograms for GFP intensity for each of the TOP-GFP single-cell-cloned CSC cultures with the TOP-GFPlow (10% lowest) and TOP-GFPhigh (10% highest) populations indicated. (C) Single parameter histograms for the indicated cell surface markers for each of the indicated cultures. Gray denotes TOP-GFPlow (10% lowest) and green denotes TOP-GFPhigh (10% highest) populations. (D) Density plots for CD29/CD24 and CD44/CD166 from TOP-GFPlow (gray) and TOP-GFPhigh (green) populations of each culture. Additional details for this experiment can be found at https://osf.io/tfy28/.
Figure 1—figure supplement 1
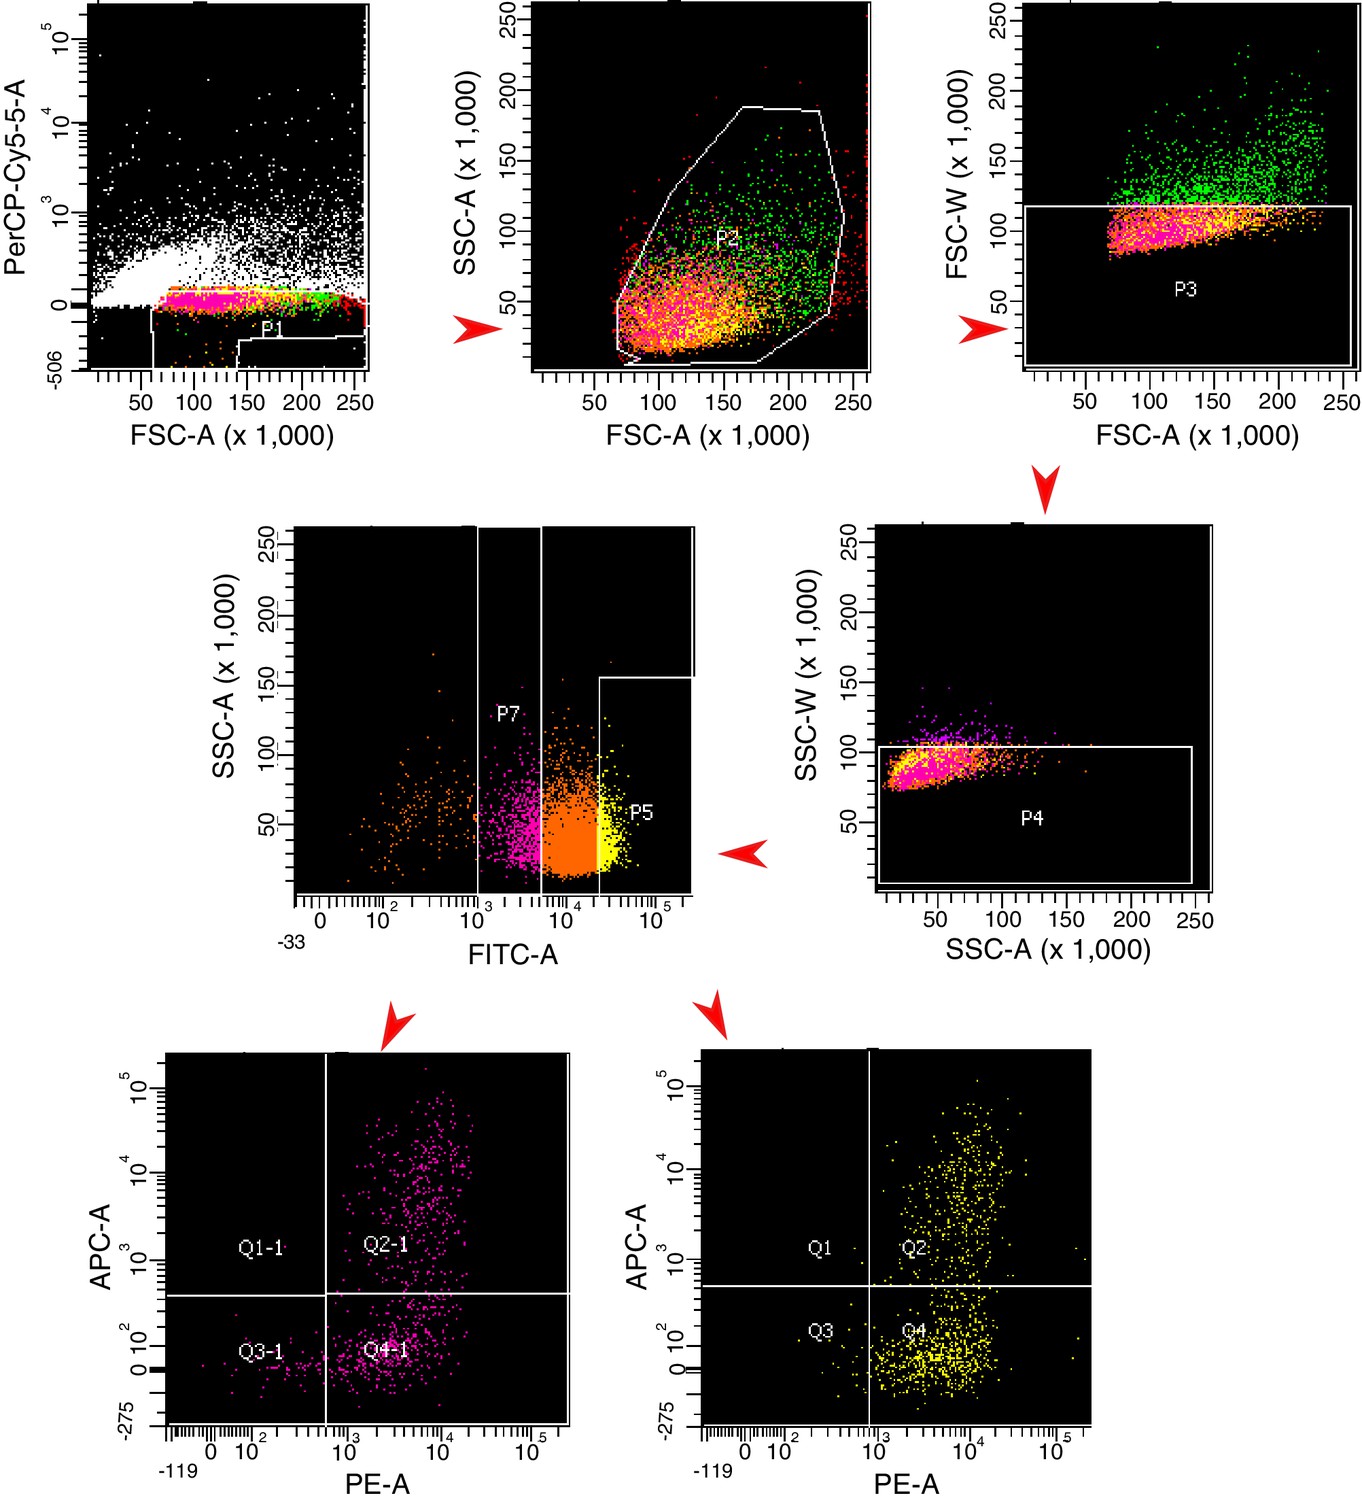
Flow cytometry gating strategy.
Representative density plots of gating strategy to assess cell surface markers from TOP-GFPlow and TOP-GFPhigh populations. Forward scatter area (FSC-A) and PerCP-Cy5.5 was used to gate on viable cells (PI negative cells), followed by forward verses side scatter area (FSC-A vs SSC-A) to identify cells of interest and exclude debris, which were then analyzed by FSC-A and forward scatter width (FSC-W), and then SSC-A and side scatter width (SSC-W) to exclude doublet cells. From the single-cell population, SSC and FITC were used to gate on the TOP-GFPlow (10% lowest) and TOP-GFPhigh (10% highest) populations. TOP-GFPlow and TOP-GFPhigh populations were then assessed for PE and APC to detect the fluorophores conjugated to antibodies against the cell surface markers analyzed in this study. Additional details for this experiment can be found at https://osf.io/tfy28/.
Figure 2 with 1 supplement
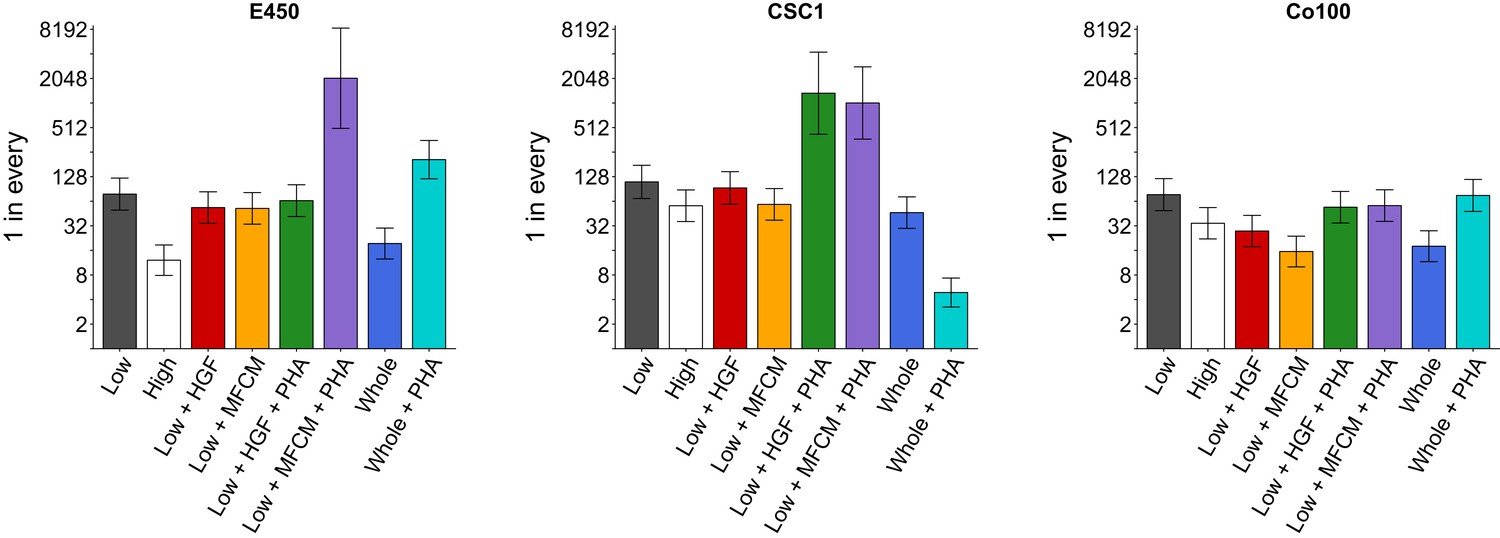
Clonogenicity assay of TOP-GFP cultures.
A limiting-dilution assay was performed on the TOP-GFPlow, TOP-GFPhigh, or TOP-GFPwhole populations of the three indicated TOP-GFP cultures. Cells were left untreated, or treated with 25 ng/ml HGF, 1:2 dilution of MFCM, or 500 nM PHA-665752 (PHA), as indicated. The bar graphs present the clonogenic potential of each culture with error bars representing 95% confidence intervals (y-axis is log2 scale). This experiment was performed once for each culture. See Materials and methods and Registered Report (Evans et al., 2015) for details on limiting-dilution statistics and scheme. Planned contrast between TOP-GFPlow vs TOP-GFPhigh: E450 (χ2 = 39.8, uncorrected p=2.82×10⁻¹⁰, corrected p=1.69×10⁻⁹); CSC1 (χ2 = 4.82, uncorrected p=0.028, corrected p=0.169); Co100 (χ2 = 7.59, uncorrected p=0.0059, corrected p=0.035). Planned contrast between TOP-GFPlow vs TOP-GFPlow + HGF: E450 (χ2 = 1.49, uncorrected p=0.223, corrected p>0.99); CSC1 (χ2 = 0.337, uncorrected p=0.562, corrected p=0.99); Co100 (χ2 = 12.7, uncorrected p=3.70×10⁻⁴, corrected p=0.0022). Planned contrast between TOP-GFPlow vs TOP-GFPlow + MFCM: E450 (χ2 = 1.96, uncorrected p=0.162, corrected p=0.969); CSC1 (χ2 = 4.18, uncorrected p=0.041, corrected p=0.245); Co100 (χ2 = 28.7, uncorrected p=8.26×10⁻⁸, corrected p=4.96×10⁻⁷). Planned contrast between TOP-GFPlow + HGF vs TOP-GFPlow + HGF + PHA: E450 (χ2 = 0.376, uncorrected p=0.540, corrected p>0.99); CSC1 (χ2 = 34.0, uncorrected p=5.64×10⁻⁹, corrected p=3.39×10⁻⁸); Co100 (χ2 = 5.13, uncorrected p=0.024, corrected p=0.141). Planned contrast between TOP-GFPlow + MFCM vs TOP-GFPlow + MFCM + PHA: E450 (χ2 = 61.0, uncorrected p=5.71×10⁻¹⁵, corrected p=3.43×10⁻¹⁴); CSC1 (χ2 = 43.5, uncorrected p=4.14×10⁻¹¹, corrected p=2.48×10⁻¹⁰); Co100 (χ2 = 17.6, uncorrected p=2.67×10⁻⁵, corrected p=1.60×10⁻⁴). Planned contrast between TOP-GFPwhole vs TOP-GFPwhole + PHA: E450 (χ2 = 68.3, uncorrected p=1.43×10⁻¹⁶, corrected p=8.56×10⁻¹⁶); CSC1 (χ2 = 72.2, uncorrected p=1.96×10⁻¹⁷, corrected p=1.17×10⁻¹⁶); Co100 (χ2 = 20.2, uncorrected p=6.91×10⁻⁶, corrected p=4.14×10⁻⁵). Additional details for this experiment can be found at https://osf.io/k9vce/.
Figure 2—figure supplement 1
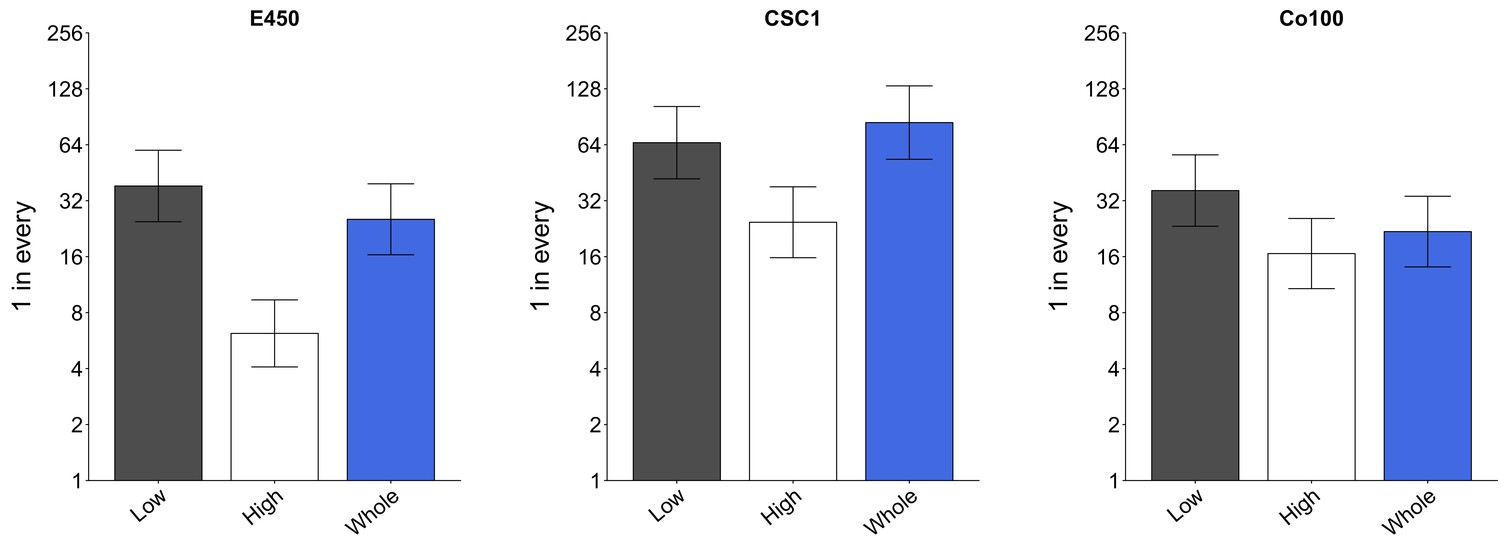
Pilot of clonogenicity assay.
A limiting-dilution assay was performed on the TOP-GFPlow, TOP-GFPhigh, or TOP-GFPwhole populations of the three indicated TOP-GFP cultures. Cells were left untreated. The bar graphs present the clonogenic potential of each culture with error bars representing 95% confidence intervals (y-axis is log2 scale). The pilot experiment was performed once for each culture. See Methods and Registered Report (Evans et al., 2015) for details on limiting-dilution scheme. Additional details for this experiment can be found at https://osf.io/k9vce/.
Figure 3
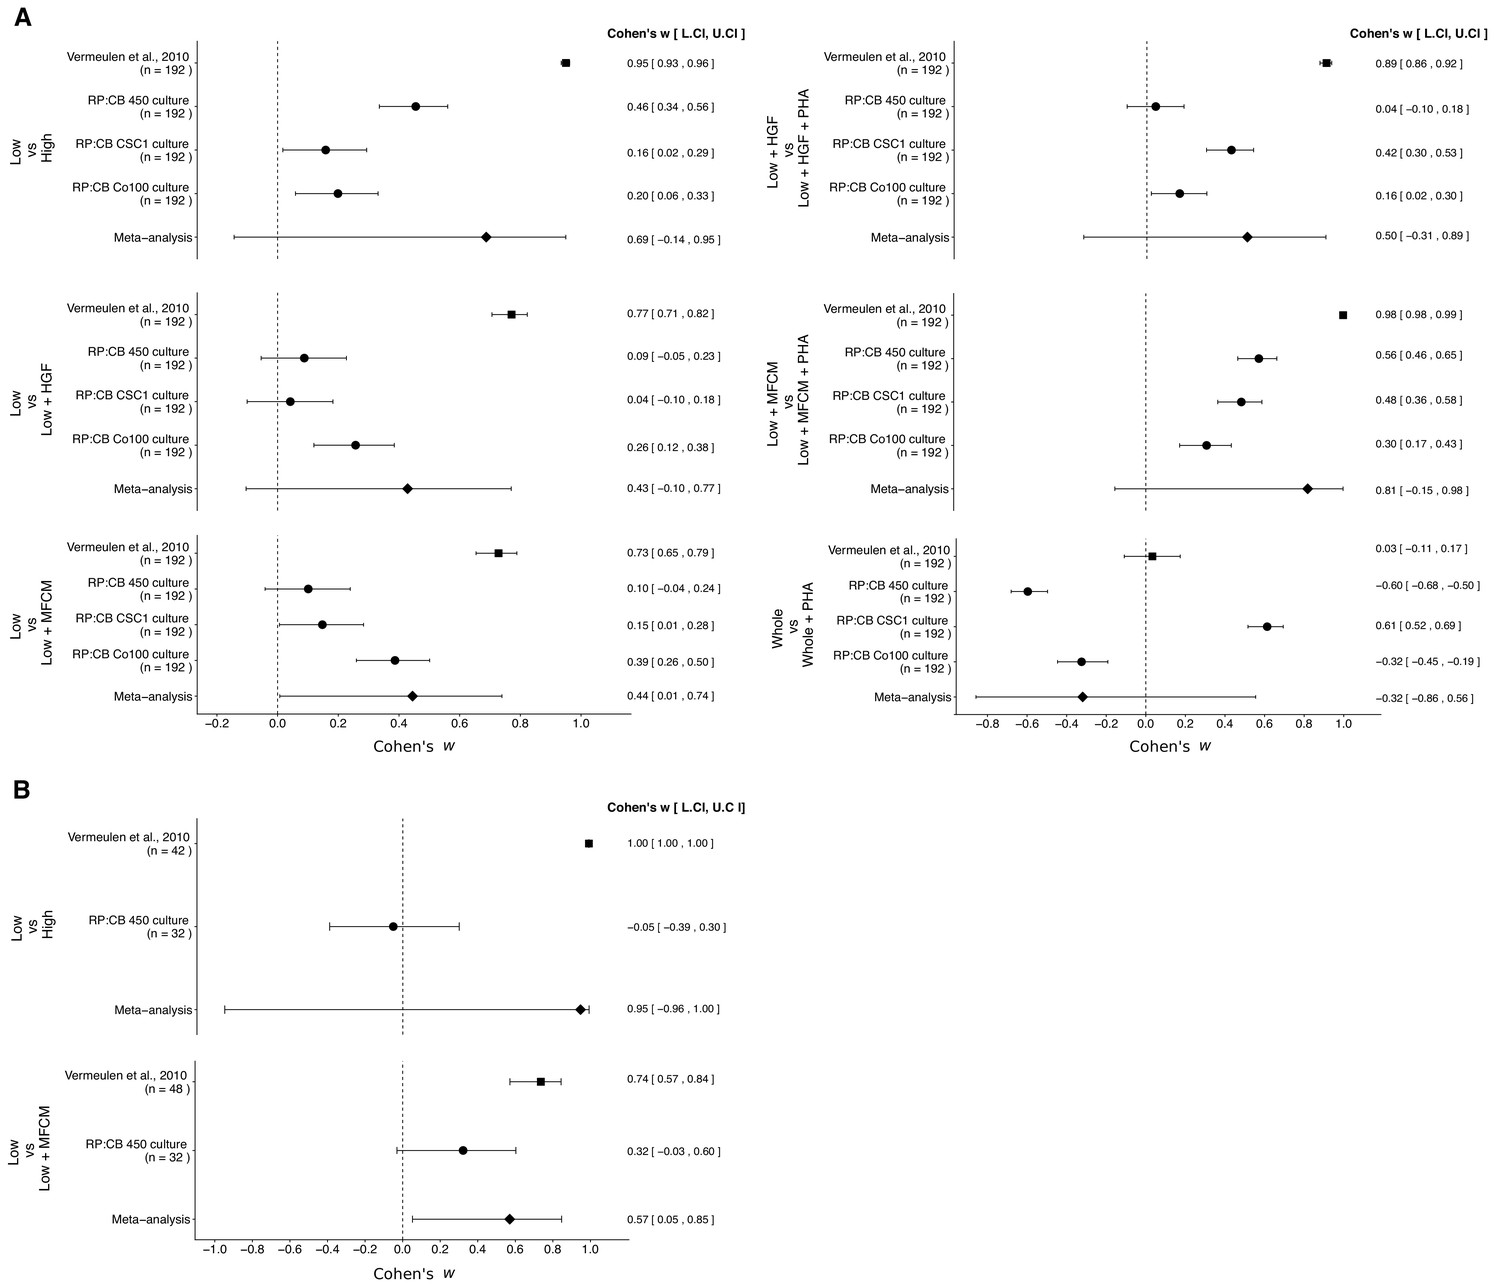
Meta-analyses of each effect.
Effect size and 95% confidence interval are presented for Vermeulen et al. (2010), the results from this replication study (RP:CB), and a random effects meta-analysis of the effects. Cohen’s ω is a standardized measure of the association between the cells tested and clonogenic, or tumorigenic, frequency. The higher the value, the stronger the association, with an effect size of zero indicating there was no association. Sample sizes used in Vermeulen et al. (2010) and RP:CB are reported under the study name. (A) Comparison of clonogenic frequency between the indicated treated, or untreated, populations of TOP-GFP CSC cultures. TOP-GFPlow vs TOP-GFPhigh (meta-analysis p=0.094); TOP-GFPlow vs TOP-GFPlow + HGF (meta-analysis p=0.110); TOP-GFPlow vs TOP-GFPlow + MFCM (meta-analysis p=0.047); TOP-GFPlow + HGF vs TOP-GFPlow + HGF + PHA (meta-analysis p=0.218); TOP-GFPlow + MFCM vs TOP-GFPlow + MFCM + PHA (meta-analysis p=0.085); TOP-GFPwhole vs TOP-GFPwhole + PHA (meta-analysis p=0.498). (B) Comparison of frequency of tumorigenicity between the indicated treated, or untreated, populations of TOP-GFP CSC cultures injected into mice. TOP-GFPlow vs TOP-GFPhigh (meta-analysis p=0.330); TOP-GFPlow vs TOP-GFPlow + MFCM (meta-analysis p=0.033). Additional details for these meta-analyses can be found at https://osf.io/g4ewk/.
Tables
Table 1
Tumorigenicity assay of TOP-GFP culture.
Cell numbers from the indicated populations were injected into female athymic nude mice. Cells were left untreated or treated with 1:2 dilution of MFCM for 2 hr before injection. The number of successful tumor initiations after nine weeks out of four injected mice for each condition is reported. Planned contrast between TOP-GFPlow vs TOP-GFPhigh (χ2 = 0.084, uncorrected p=0.772, corrected p>0.99). Planned contrast between TOP-GFPlow vs TOP-GFPlow + MFCM (χ2 = 3.32, uncorrected p=0.069, corrected p=0.137). Additional details for this experiment can be found at https://osf.io/j73xu/.
| Line | Condition | 10 | 100 | 1000 | 5000 |
|---|---|---|---|---|---|
| E450 | TOP-GFP Low | 0/4 | 0/4 | 2/4 | 3/4 |
| TOP-GFP High | 0/4 | 0/4 | 3/4 | 2/4 | |
| TOP-GFP Low + MFCM | 0/4 | 2/4 | 2/4 | 4/4 |
Key resources table
| Reagent type (species) or resource | Designation | Source or reference | Identifiers | Additional information |
|---|---|---|---|---|
| Cell line (Homo sapiens) | Co100 | doi:10.1038/ncb2048 | shared by Medema lab, University of Amsterdam | |
| Cell line (H. sapiens, female) | CSC1 | ProMab Biotechnologies | cat# CC100103 | |
| Cell line (H. sapiens, female) | E450 | this paper | ||
| Cell line (H. sapiens, female) | 18Co | ATCC | cat# CRL-1459; RRID:CVCL_2379 | |
| Strain, strain background (Mus musculus, Athymic Nude, female) | athymic nude | Charles River | Strain code: 490; RRID:IMSR_CRL:490 | |
| Recombinant DNA reagent | TOP-GFP | doi:10.1038/nature01593 | RRID:Addgene_14715 | shared by Medema lab, University of Amsterdam |
| Chemical compound, drug | HGF | Sigma-Aldrich | cat# H5791 | lot# MKBT3102V |
| Chemical compound, drug | PHA-665752 | Sigma-Aldrich | cat# PZ0147 | |
| Other | Matrigel | Corning | cat# 356230 | |
| Antibody | PE-conjugated anti-CD133 | Miltenyi Biotec | cat# 130-098-826; clone: AC133; RRID:AB_2660882 | 1:100 dilution |
| Antibody | PE-conjugated anti-CD24 | BD Biosciences | cat# 560991; clone ML5; RRID:AB_10563074 | 1:100 dilution |
| Antibody | APC-conjugated anti-CD29 | BD Biosciences | cat# 561794; clone: MAR4; RRID:AB_10898163 | 1:100 dilution |
| Antibody | PE-conjugated anti-CD166 | R and D Systems | cat# FAB6561P; clone: 105902; RRID:AB_2223887 | 1:100 dilution |
| Antibody | APC-conjugated anti-CD44 | BD Biosciences | cat# 560890; clone: G44-26; RRID:AB_2033959 | 1:100 dilution |
| Antibody | PE-conjugated mouse IgG1 isotype control | Miltenyi Biotec | cat# 130-098-106; clone: X-56; RRID:AB_2661463 | 1:100 dilution |
| Antibody | APC-conjugated mouse IgG2b, κ isotype control | BD Biosciences | cat# 555745; clone: 27–35; RRID:AB_398612 | 1:100 dilution |
| Antibody | PE-conjugated mouse IgG2a, κ isotype control | BD Biosciences | cat# 555574; clone: G155-178; RRID:AB_395953 | 1:100 dilution |
| Antibody | APC-conjugated mouse IgG1 isotype control | BD Biosciences | cat# 555751; clone: MOPC-21; RRID:AB_398613 | 1:100 dilution |
| Software, algorithm | FACS Sortware sorter | BD Biosciences | RRID:SCR_016722 | version 1.2.0.142 |
| Software, algorithm | HCS Studio Cell Analysis | Thermo Fisher Scientific | RRID:SCR_016787 | version 6.6.0 |
| Software, algorithm | FACSDiva | BD Biosciences | RRID:SCR_016722 | version 6.1.3 or 8.0.1 |
| Software, algorithm | FlowJo | Tree Star, Inc | RRID:SCR_008520 | version 10 |
| Software, algorithm | R Project for statistical computing | https://www.r-project.org | RRID:SCR_001905 | version 3.5.1 |
Additional files
-
Transparent reporting form
- https://doi.org/10.7554/eLife.45426.008
-
Reporting standard 1
The ARRIVE guidelines checklist.
- https://doi.org/10.7554/eLife.45426.009
Download links
A two-part list of links to download the article, or parts of the article, in various formats.
Downloads (link to download the article as PDF)
Open citations (links to open the citations from this article in various online reference manager services)
Cite this article (links to download the citations from this article in formats compatible with various reference manager tools)
Replication Study: Wnt activity defines colon cancer stem cells and is regulated by the microenvironment
eLife 8:e45426.
https://doi.org/10.7554/eLife.45426


