Cooperation of mitochondrial and ER factors in quality control of tail-anchored proteins
- Centre for Molecular Biology of Heidelberg University (ZMBH), DKFZ-ZMBH Alliance, Germany
- Institute of Molecular Biology (IMB), Germany
- Calico Life Sciences LLC, United States
- German Cancer Research Center (DKFZ), Germany
Figures
Figure 1 with 1 supplement
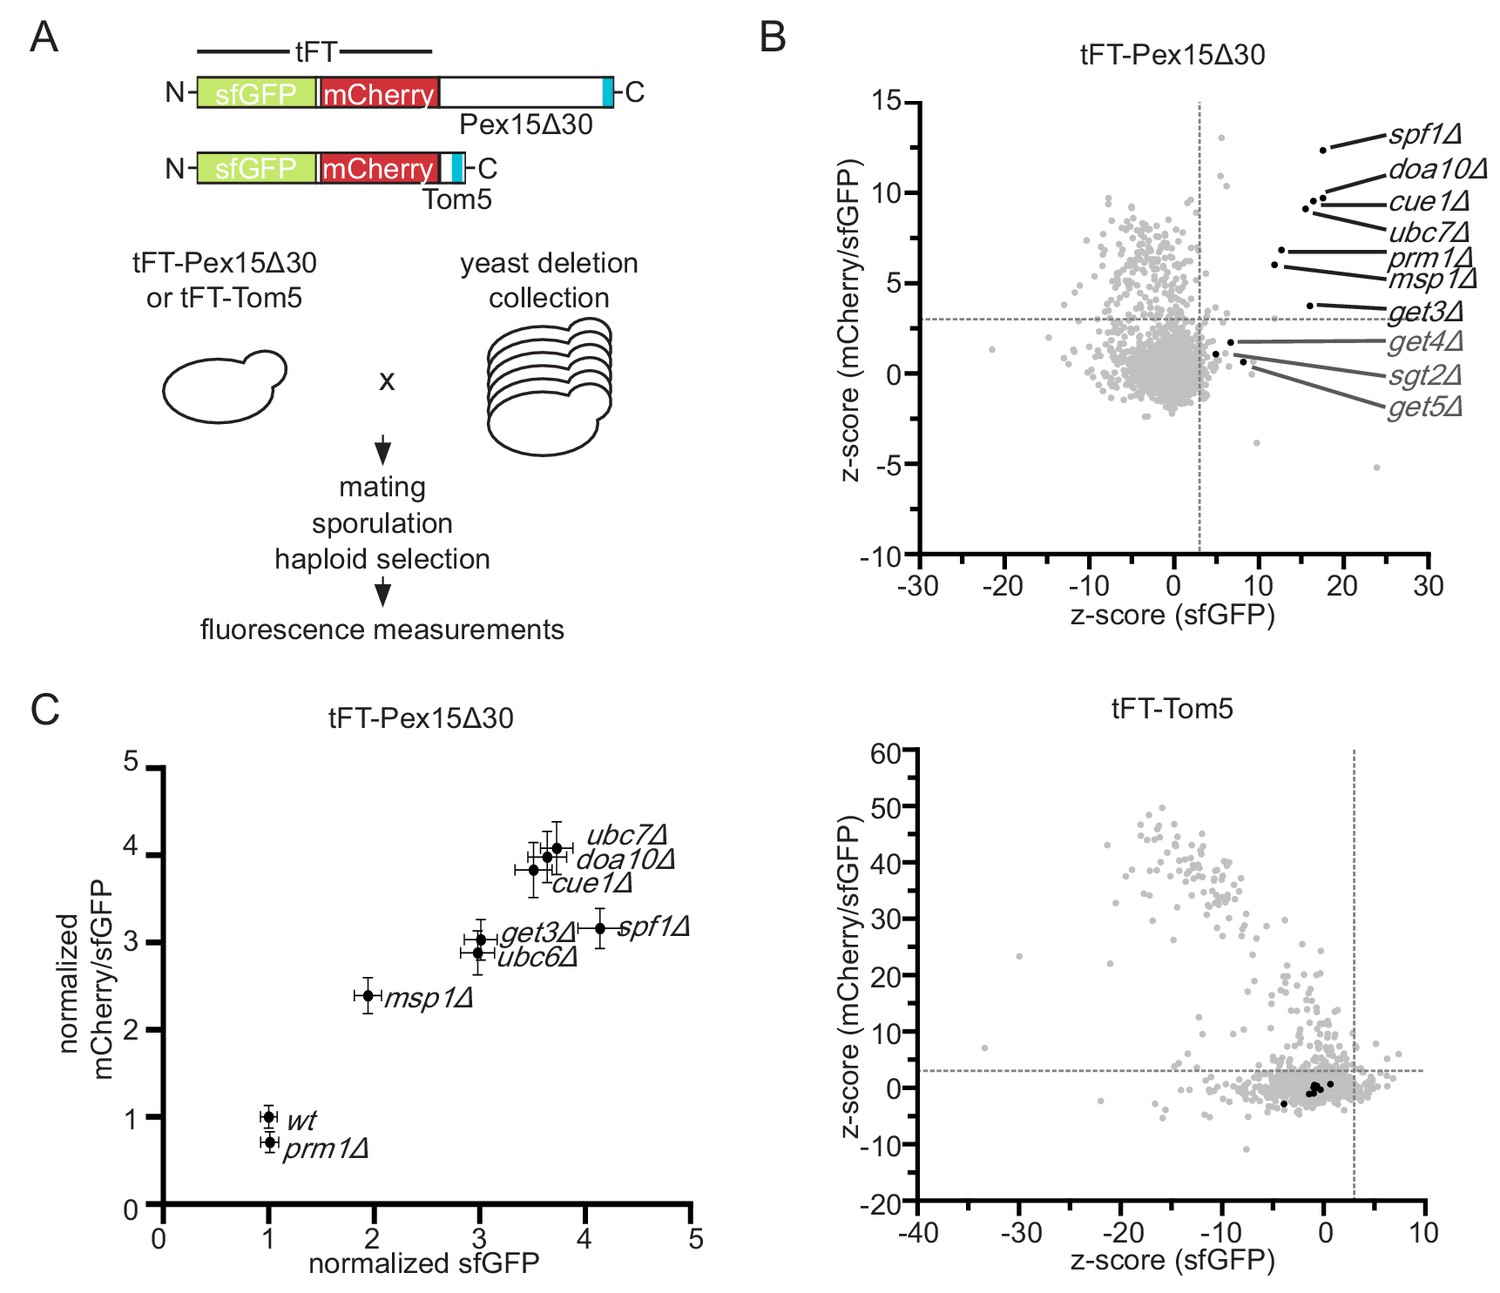
Genome-wide screen to identify factors stabilizing Pex15Δ30 TA protein.
(A) Overview of the tFT-Pex15Δ30 and tFT-Tom5 TA protein reporters. Tail-anchor is highlighted in blue. Strains, expressing either tFT-Pex15Δ30 or tFT-Tom5 from the TEF1 promoter were crossed into the yeast non-essential gene deletion collection (Winzeler et al., 1999) using automated mating and selection procedure. sfGFP and mCherry fluorescence was acquired from arrayed colonies grown on agar (n = 4). (B) sfGFP signal and mCherry/sfGFP ratio of the tFT-Pex15Δ30 and tFT-Tom5 reporters of each mutant shown as z-score (which resembles the standard deviations from the mean a data point is). Mutants with z-scores > 3 for sfGFP and mCherry/sfGFP ratio (at 5% false discovery rate) for Pex15Δ30 and not affecting Tom5 are highlighted in black. Dashed gray lines indicate the thresholds. GET mutants below the threshold are highlighted in dark gray. (C) Flow cytometry validation of generated yeast mutants as indicated. Mean sfGFP intensities and mCherry/sfGFP ratios normalized to wt (n = 4, ± SEM).
Figure 1—figure supplement 1
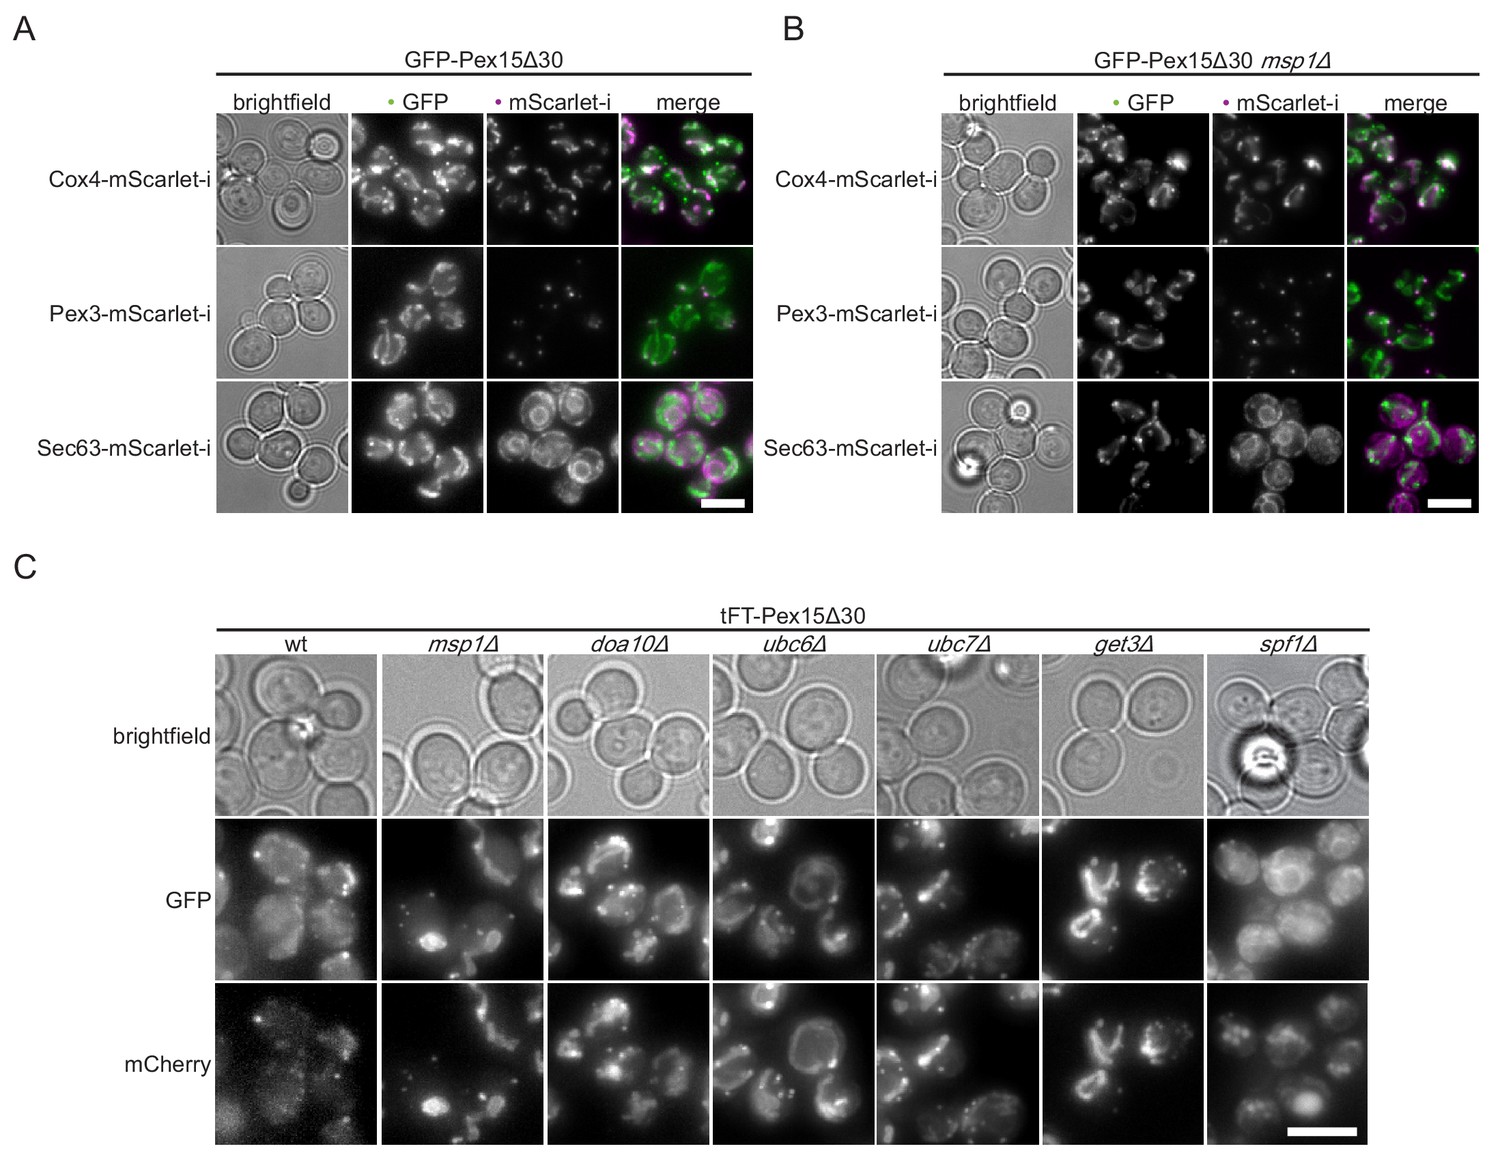
Colocalization of Pex15Δ30 reporter with cellular markers.
(A) Colocalization studies of wt yeast expressing GFP-Pex15Δ30 (green) with markers for mitochondria (Cox4-mScarlet-i, magenta), peroxisomes (Pex3-mScarlet-i, magenta) and ER (Sec63-mScarlet-i, magenta). Colocalization colored in white in merge. Scale bar, 5 μm. (B) Strains from (A) with msp1Δ. Scale bar: 5 μm. (C) Microscopy images of tFT-Pex15Δ30 in msp1Δ, doa10Δ, ubc6Δ, ubc7Δ, get3Δ, and spf1Δ Images are displayed with optimal display range. Scale bar: 5 μm.
Figure 2 with 1 supplement
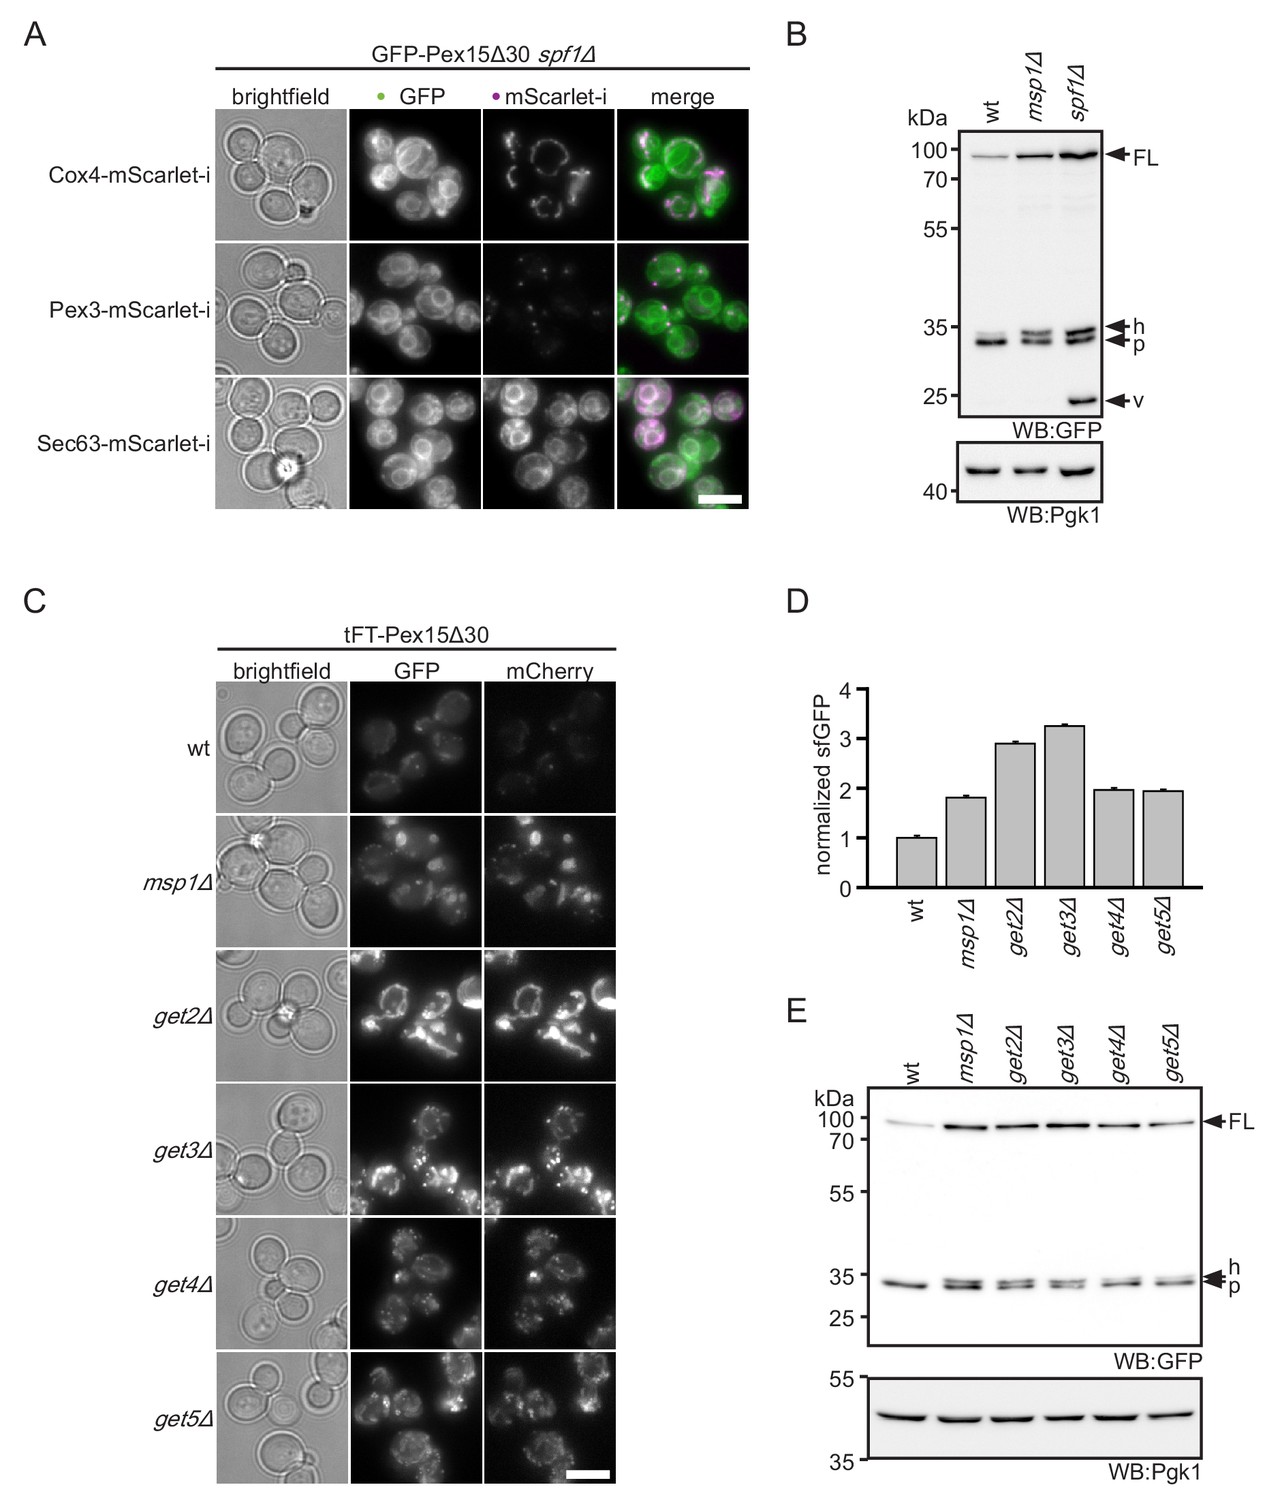
ER insertion and mitochondrial accumulation impedes efficient Pex15Δ30 degradation in spf1Δ and get3Δ.
(A) Microscopy analysis of spf1Δ strains expressing GFP-Pex15Δ30 from the TEF1 promoter. Co-expression of chromosomally tagged cellular marker proteins: Cox4-mScarlet-i, mitochondria; Pex3-mScarlet-i, peroxisomes; Sec63-mScarlet-i, ER. Images are adjusted for optimal display range. Colocalization is colored in white in merge (green - GFP, magenta - mScarlet-i). Scale bar: 5 μm. (B) Western blot (WB) analysis of log phase grown wt, msp1Δ, and spf1Δ strains expressing tFT-Pex15Δ30. Probing with anti-GFP antibody detects full length protein (FL) and degradation resistant tFT intermediates (Khmelinskii et al., 2016): h, SDS-induced mCherry hydrolysis product; p, proteasomal-degradation resistant fragment; v, vacuolar degradation-resistant fragment. Pgk1 serves as loading control. (C) Microscopy analysis of get2Δ, get3Δ, get4Δ, and get5Δ strains expressing tFT-Pex15Δ30 compared to wt and msp1Δ. Scale bar: 5 μm. (D) Flow cytometry GFP measurement of strains from (C) normalized to wt (n = 3, ± SEM). (E) WB analysis of log phase grown strains from (C) with detection of degradation resistant tFT intermediates.
Figure 2—figure supplement 1
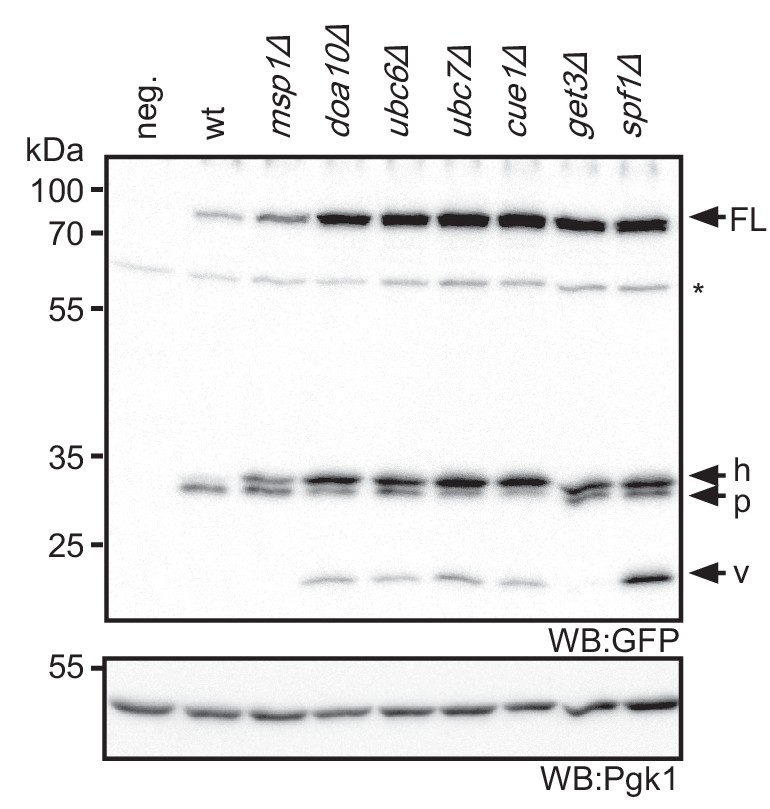
Steady state level of tFT-Pex15Δ30 in yeast mutants.
Lysate of wt yeast and indicated mutants probed with anti-GFP antibody to reveal full length tFT-Pex15Δ30 (FL) and degradation resistant tFT intermediates (h, p, v, see Figure 2B for further explanation). WB, western blot. Unspecific bands are marked with star. Pgk1 serves as loading control.
Figure 3 with 1 supplement
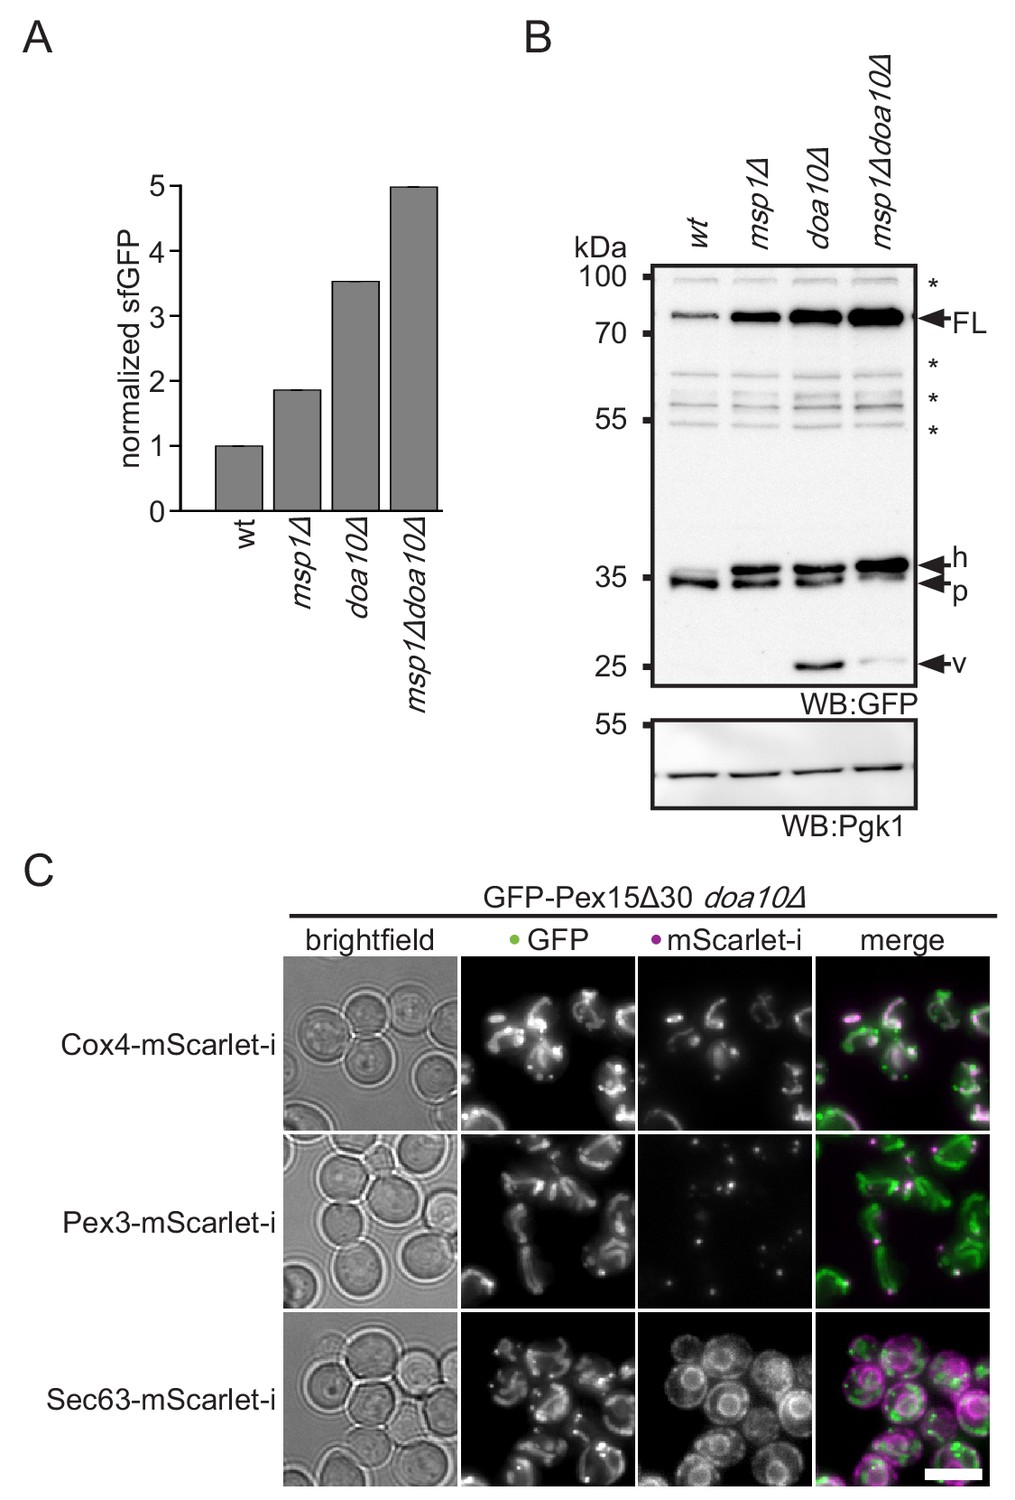
Doa10 triggers degradation of cytoplasmic Pex15Δ30.
(A) Flow cytometry measurements of wt, msp1Δ, doa10Δ and msp1Δdoa10Δ strains expressing tFT-Pex15Δ30. Mean GFP intensities normalized to wt (n = 4, ± SEM). (B) Western blot (WB) analysis from log phase grown yeast of (A) with full-length tFT-Pex15Δ30 (FL) and degradation resistant tFT intermediates: h, SDS-induced mCherry hydrolysis product; p, proteasomal-degradation resistant fragment; v, vacuolar degradation-resistant fragment. Unspecific bands are marked with star. Pgk1 serves as loading control. (C) Microscopy analysis of DOA10 deletion strains co-expressing GFP-Pex15Δ30 and mitochondrial marker protein Cox4-mScarlet-i, peroxisomal marker protein Pex3-mScarlet-i or ER marker protein Sec63-mScarlet-i. Colocalization is highlighted in white in merge image. Images are shown with optimal display range. Scale bar: 5 μm.
Figure 3—figure supplement 1
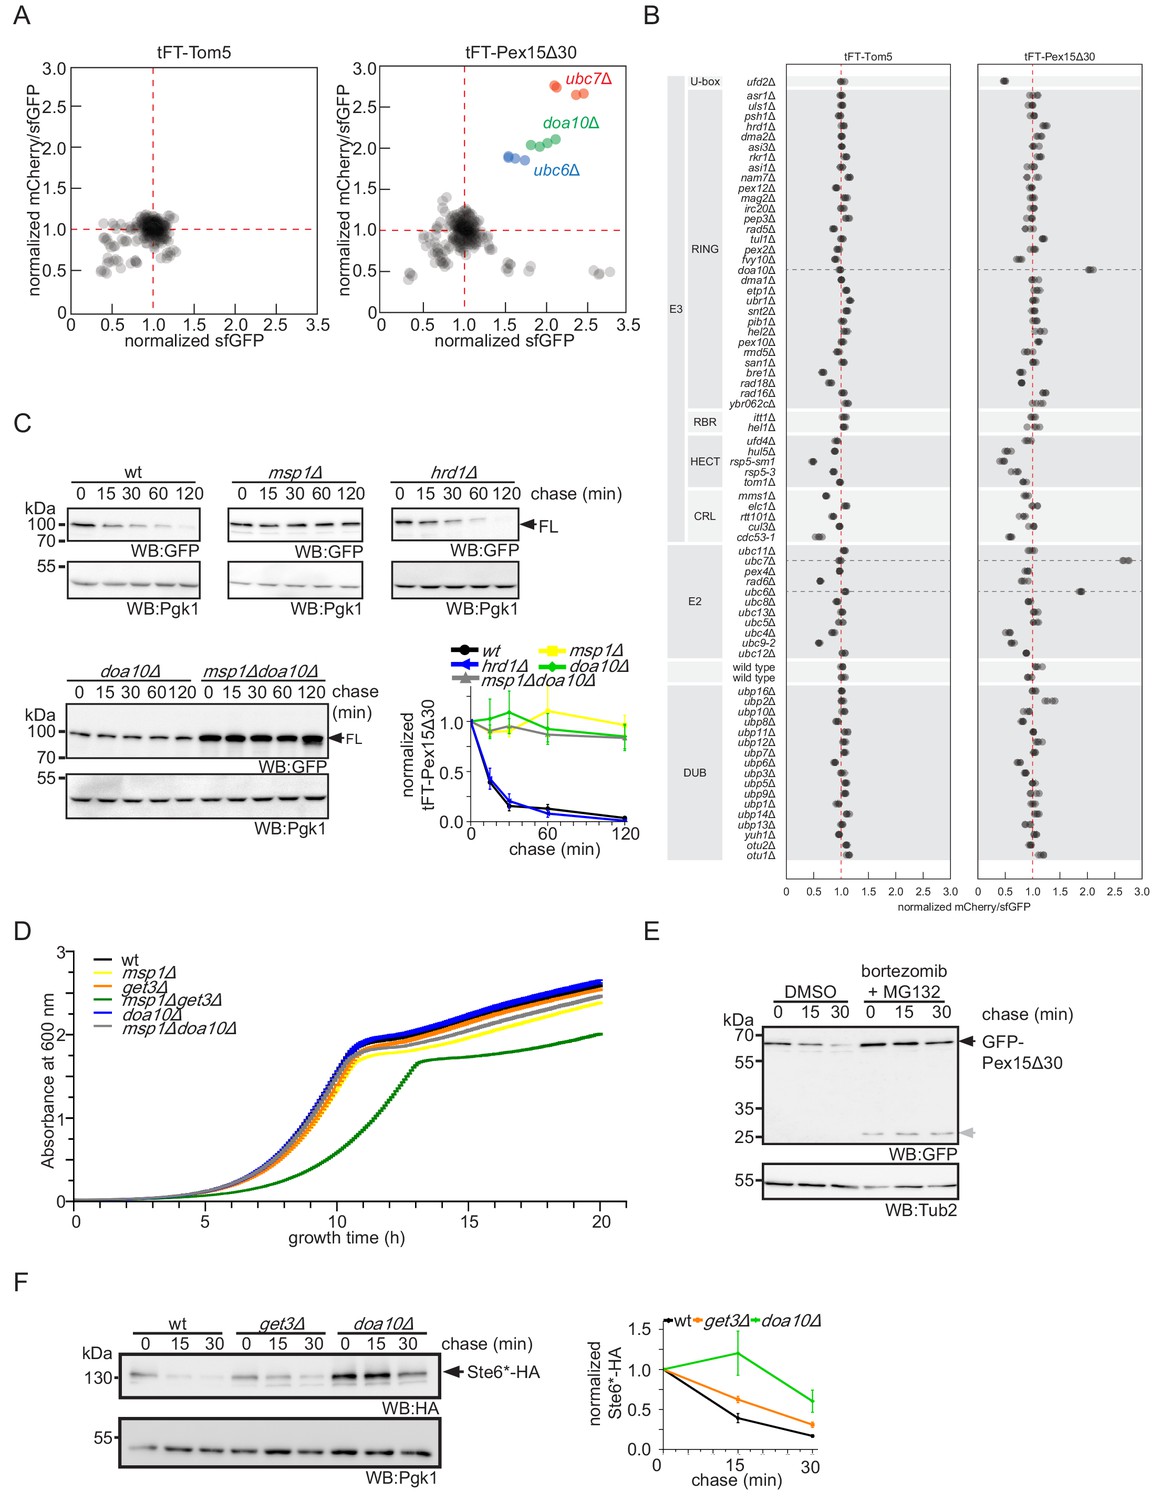
Targeted screen in ubiquitin-proteasome system mutants emphasizes role of Doa10 in Pex15Δ30 turnover.
(A) sfGFP intensities and mCherry/sfGFP ratios (n = 4), normalized to the median of each screen, for tFT-Pex15Δ30 and tFT-Tom5 expressed in an array of mutants in the ubiquitin-proteasome system. (B) Normalized mCherry/sfGFP ratios for the indicated mutants in each screen. DUB, deubiquitinating enzymes, E2, ubiquitin-conjugating enzymes, E3, ubiquitin ligases. Red dashed lines mark the median of each screen. (C) Cycloheximide chase analysis and quantification (n = 3, ± SEM) of tFT-Pex15Δ30 (FL) expressed in wt, msp1Δ, doa10Δ, and msp1Δdoa10Δ, and hrd1Δ strains. WB, western blot. Pgk1 serves as loading control. (D) Growth curves of indicated yeast strains expressing tFT-Pex15Δ30 during 20 hr of growth (n = 3, ± SEM). (E) Cycloheximide chase of pdr5Δ yeast strains expressing sfGFPcp8-Pex15Δ30 pre-treated with the proteasome inhibitors MG132 (80 μM) and bortezomib (100 μM). Gray arrow, uncharacterized sfGFP degradation intermediate. (F) Cycloheximide chase of plasmid expressed Ste6*-HA in wt, get3Δ and doa10Δ strains with quantification (n = 3, ± SEM).
Figure 4 with 1 supplement
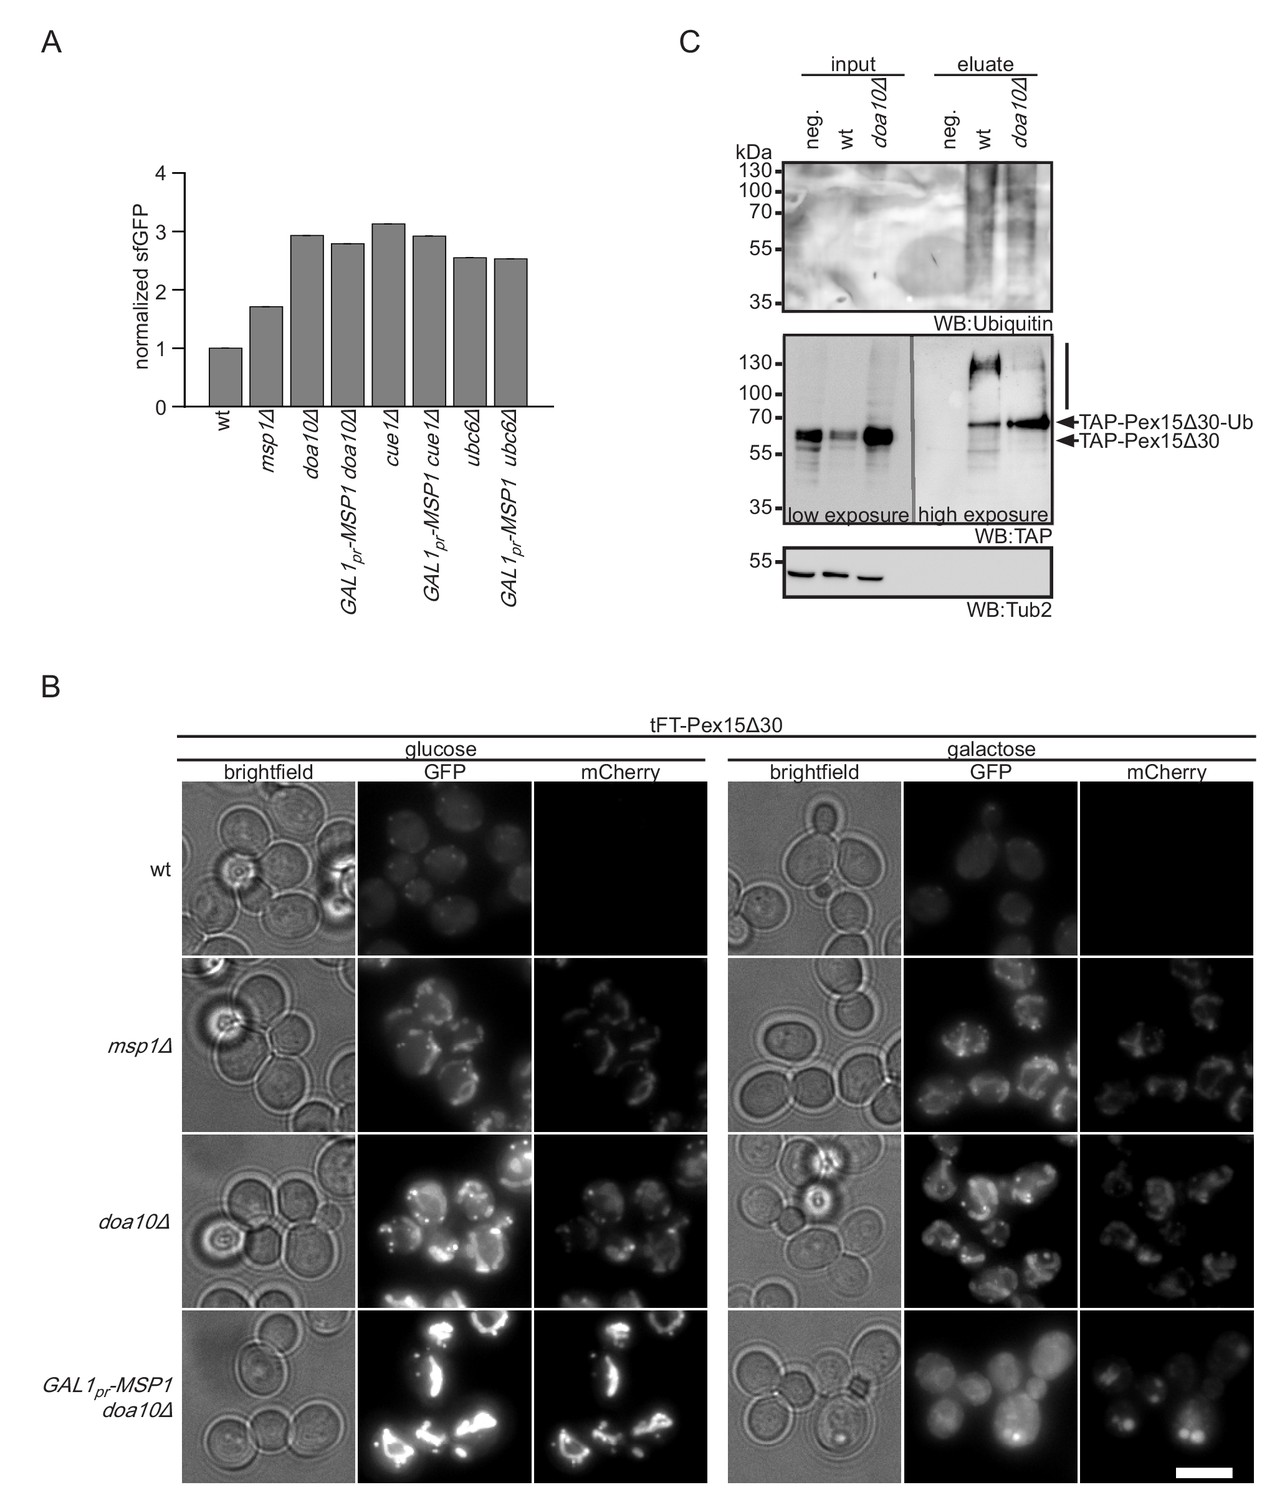
Msp1 overexpression clears mitochondrial accumulated Pex15Δ30 in doa10Δ.
(A) Flow cytometry GFP measurements of tFT-Pex15Δ30 expressed in wt, DOA10, CUE1, UBC6 and MSP1 mutant yeast (n = 4, ± SEM). Msp1 protein expression is controlled from the galactose-inducible GAL1 promoter (GAL1pr-MSP1). (B) Localization of tFT-Pex15Δ30 in strains of (A) with and without Msp1 overexpression. Scale bar: 5 μm. (C) Ubiquitylation of TAP-Pex15Δ30 in wt and doa10Δ strains expressing 10xhistidine-tagged ubiquitin as assessed by Ni-NTA affinity purification and western blotting (WB). neg. refers to a strain expressing TAP-Pex15Δ30 but not 10xhistidine-tagged ubiquitin. Tub2 is used as loading control.
Figure 4—figure supplement 1
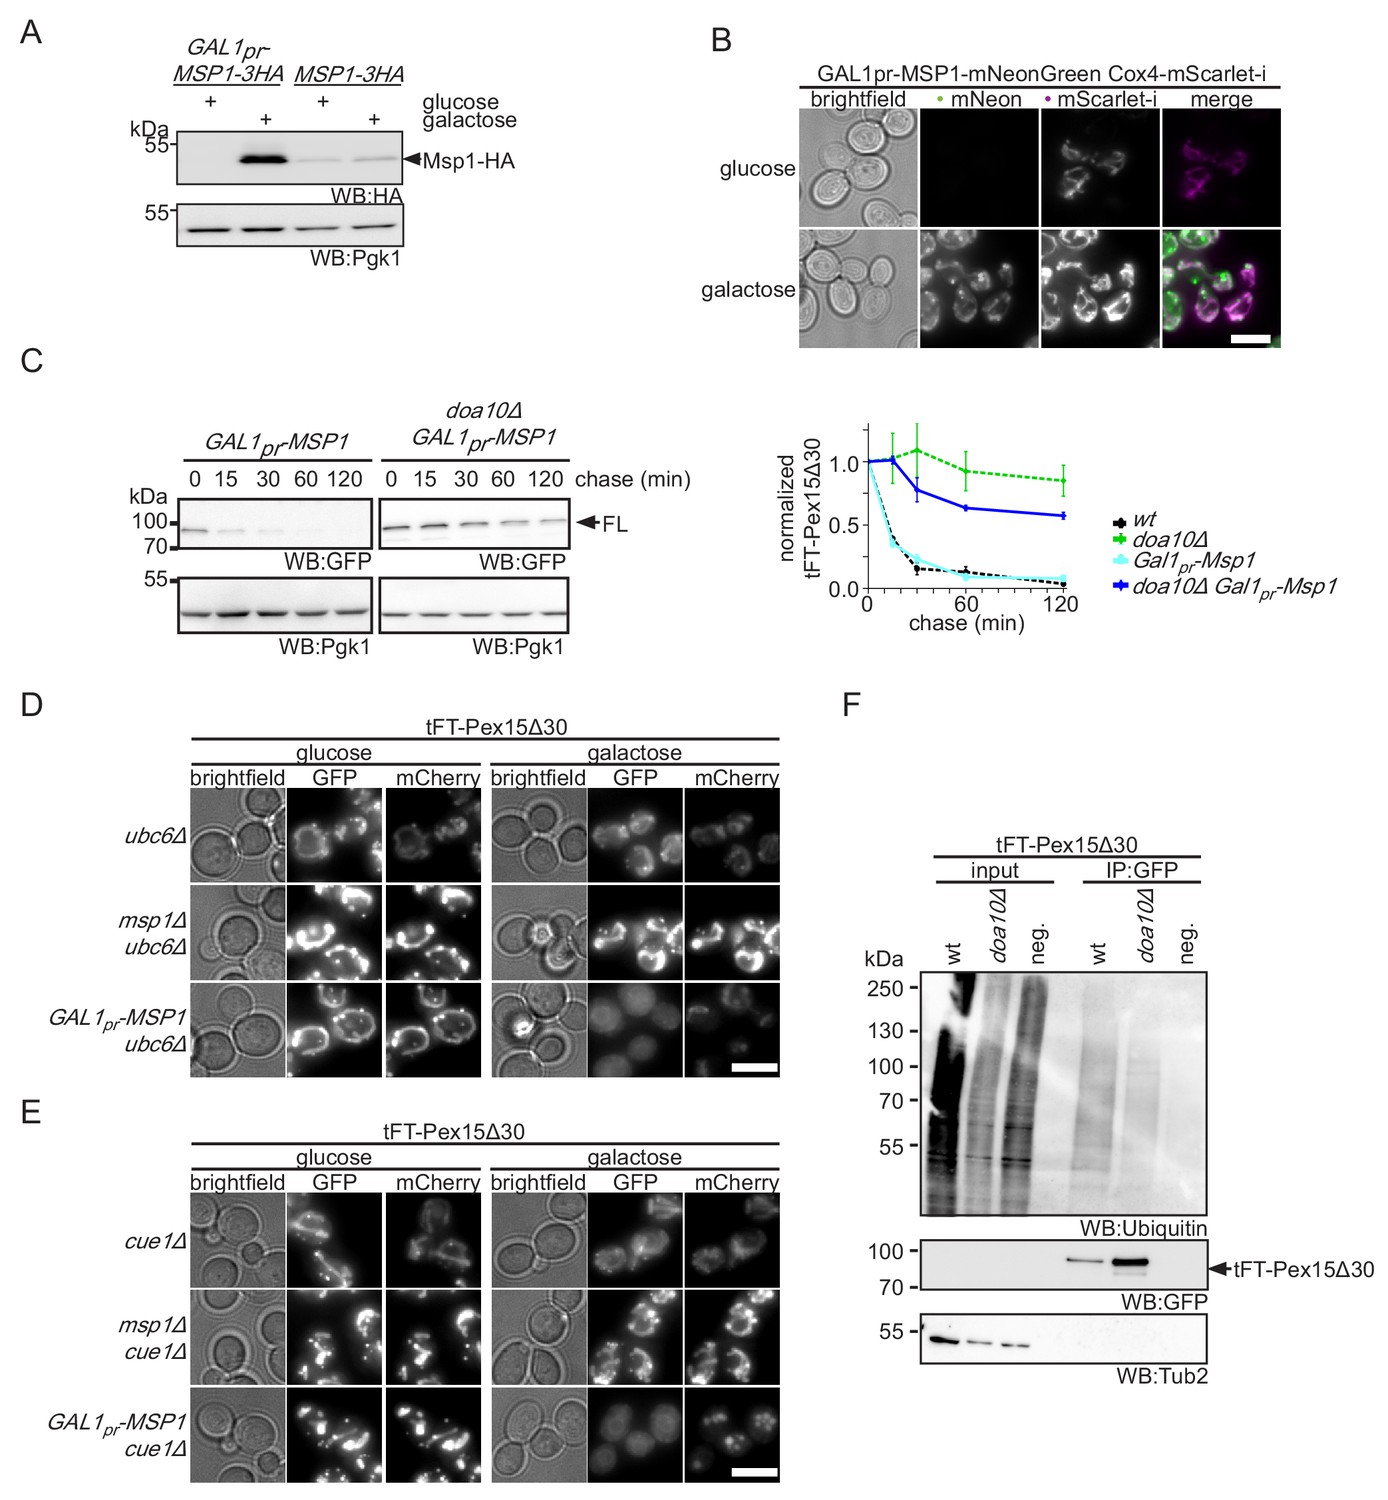
Overexpression of Msp1 restores cellular Pex15Δ30 level.
(A) Lysate of yeast strains expressing 3HA-tagged Msp1 from endogenous (MSP1-3HA) and GAL1-inducible promoter (GAL1pr-MSP1-3HA) cultured in Msp1 expression restrictive (glucose) and permissive (galactose) conditions. Expression of Msp1-3HA was induced for 4 hr. Pgk1 is used as loading control. (B) Localization of Msp1-mNeonGreen under the control of GAL1 promoter. Msp1 expression was induced for 4 hr prior imaging. Mitochondrial structures are visualized by Cox4-mScarlet-i expression, magenta. Colocalization of Msp1 and Cox4 is highlighted in white in merge. Scale bar: 5 μm. (C) Cycloheximide chase of tFT-Pex15Δ30 expressing wt and doa10Δ strains overexpressing Msp1 from the GAL1-inducible promoter cultured in culture medium supplemented with galactose and quantification (n = 3, ± SEM). For comparison of tFT-Pex15Δ30 level with endogenous Msp1 expression and doa10Δ quantification from cycloheximide chases of Figure 3—figure supplement 1C is projected with dashed lines. (D) Microscopy analysis of CUE1 deficient strains expressing tFT-Pex15Δ30 in yeast in combination with msp1Δ and Msp1 overexpression for 4 hr (GAL1pr-MSP1). Scale bar: 5 μm. (E) Microscopy analysis of UBC6 deficient strains expressing tFT-Pex15Δ30 in combination with Δmsp1 and Msp1 overexpression for 4 hr similar as in (D). (F) Immunoprecipitation of tFT-Pex15Δ30 from indicated strains. Membrane was probed against GFP and ubiquitin in order to determine the ubiquitination status of the tFT-Pex15Δ30. Of note, degradation resistant lower molecular weight tFT intermediates (Khmelinskii et al., 2016) were not detected on the western blot shown (see Figure 2B for details).
Figure 5 with 1 supplement
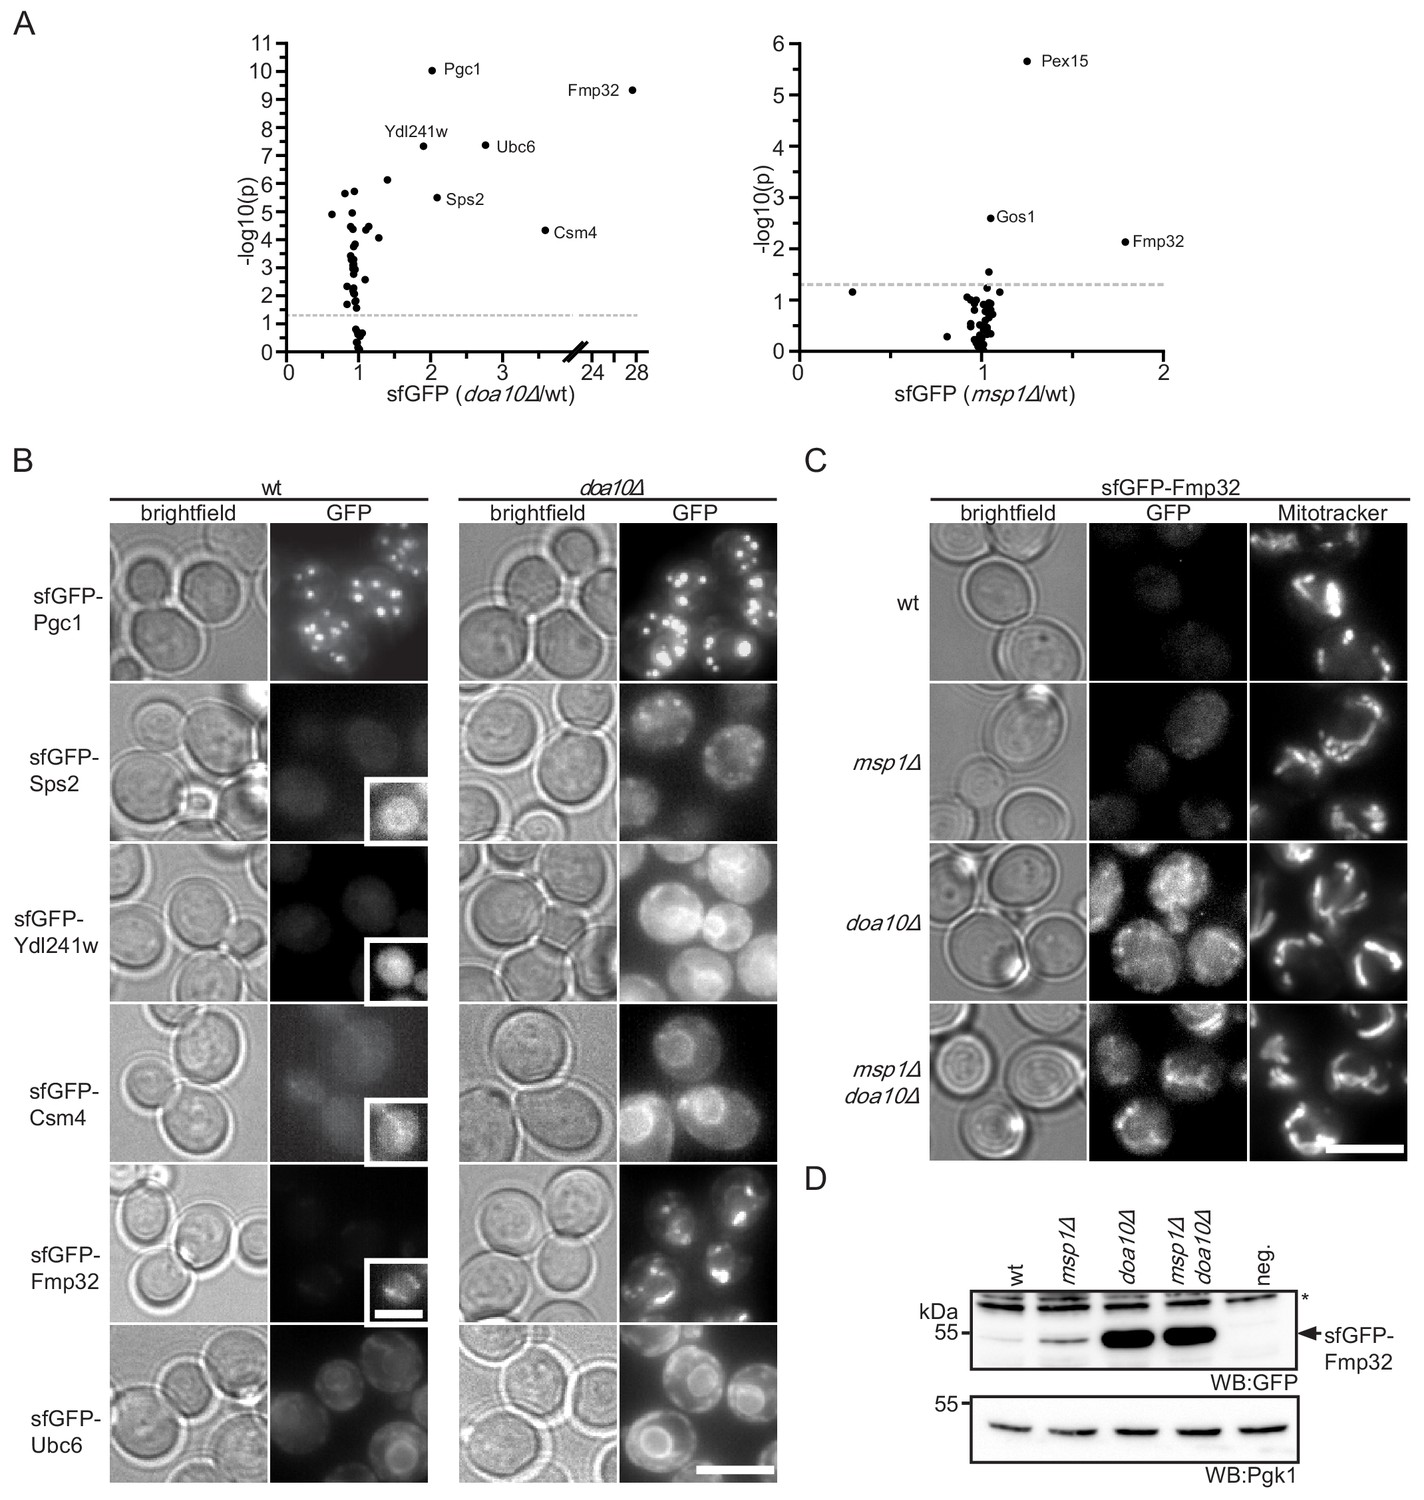
Doa10 controls targeting fidelity of mitochondrial TA proteins.
(A) Mean GFP fluorescence of 55 N-terminally GFP-tagged TA proteins expressed from NOP1 promoter deleted for DOA10 or MSP1 compared to wt. Measurements were taken from colonies grown on agar (n = 4). Highlighted proteins are significantly enriched (Student’s t-test p<0.05, threshold gray dashed line). (B) Microscopy validation of significantly enriched proteins from (A) in wt compared to doa10Δ. Images for each protein investigated are shown with the same display range for wt and doa10Δ. Insets show optimized display range. Scale bar: 5 μm. (C) Microscopy analysis of sfGFP-tagged Fmp32 under its endogenous promoter. Mitochondria are stained with the mitochondrial dye Mitotracker Red. Scale bar, 5 μm. (D) Western blot (WB) analysis of log phase growing yeast from (C). neg. is a wt yeast referring to GFP specific bands. Unspecific bands are marked with star. Pgk1 is used as loading control.
Figure 5—figure supplement 1
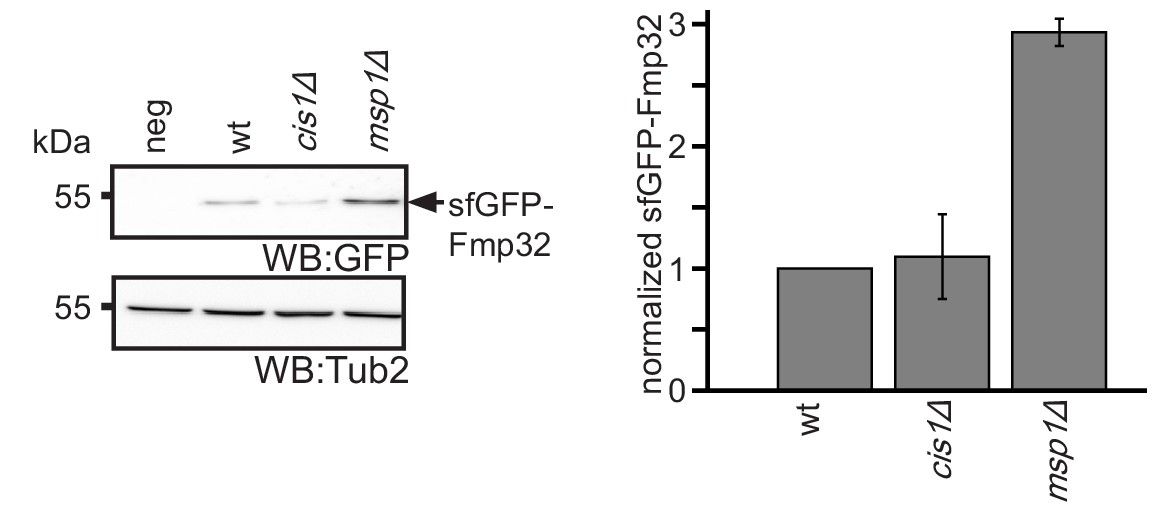
Msp1 does not require Cis1 for Fmp32 turnover.
Steady state analysis of wt, msp1Δ and cis1Δ strains expressing sfGFP-Fmp32 from its endogenous locus and quantification (n = 3, ± SEM).
Figure 6 with 1 supplement
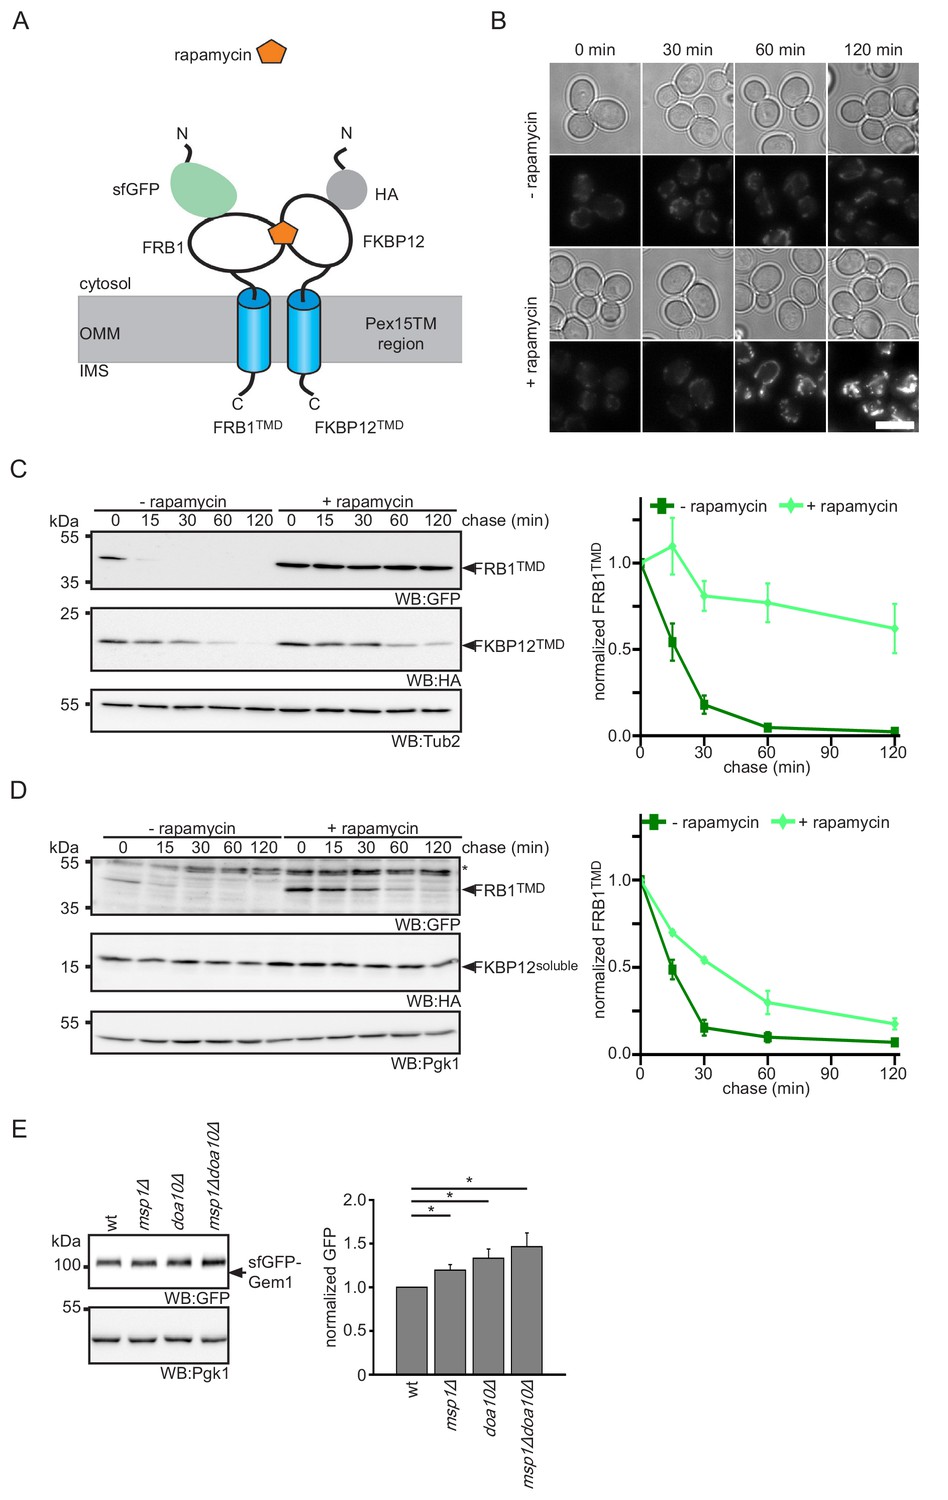
Protein dimerization impedes Msp1-dependent extraction.
(A) Scheme of rapamycin-induced dimerization for the two reporter proteins FRB1TMD and FKBP12TMD. (B) Microscopy analysis of wt yeast expressing FRB1TMD and FKBP12TMD. Images were taken with and without rapamycin treatment for the indicated time. Scale bar: 5 μm. (C) Cycloheximide chase of strains from (B) with and without rapamycin pre-treatment for 30 min. Quantification of FRB1TMD (n = 3, ± SEM) normalized to t = 0 of untreated sample. WB, western blot. Tub2 is used as loading control. (D) Cycloheximide chase of strains expressing FRB1TMD and cytosolic FKBP12 (FKBP12soluble) with and without rapamycin pre-treatment for 30 min. Quantification of FRB1TMD (n = 3, ± SEM) normalized to t = 0 of untreated sample. Unspecific bands are marked with star. Pgk1 is used as loading control. (E) Steady state analysis of sfGFP-Gem1 expressed from the NOP1 promoter in wt, msp1Δ, doa10Δ and msp1Δdoa10Δ with quantification (n = 6 ± SEM, star indicates Student’s t-test p<0.05).
Figure 6—figure supplement 1
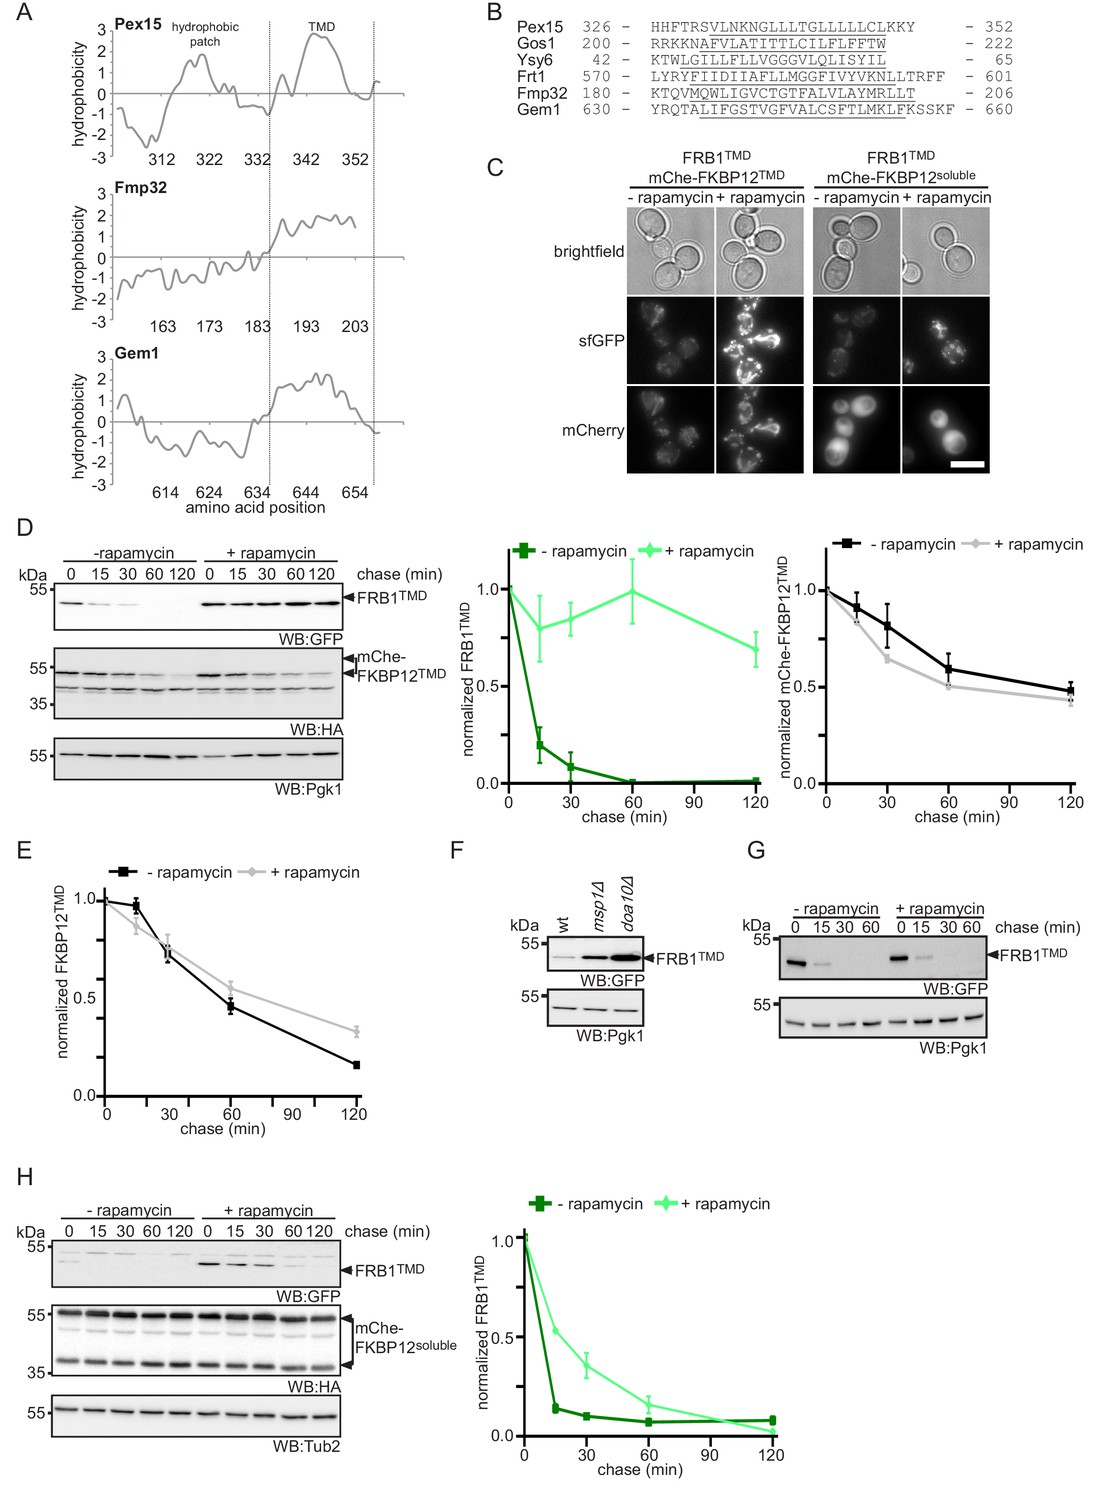
Enhanced membrane association impedes Msp1-dependent extraction of Pex15-derived reporters from mitochondria.
(A) Hydrophobicity blots of Msp1 substrates Pex15, Fmp32 and Gem1 calculated using ProtParam (Gasteiger et al., 2005). TM region (TMD) and putative juxtamembrane hydrophobic patch are indicated. Numbers indicate amino acid position in native proteins. (B) Alignment of membrane regions from known Msp1 clients. TM domain underlined (see Chen et al., 2014; Li et al., 2019; Okreglak and Walter, 2014 and this study). Numbers indicate amino acid position. (C) Microscopy analysis of yeast strains co-expressing FRB1TMD and mChe-FKBP12TMD, or mChe-FKBP12soluble, with and without rapamycin treatment for 30 min as indicated. Scale bar: 5 μm. (D) Cycloheximide chase of strains co-expressing FRB1TMD and mChe-FKBP12TMD with and without rapamycin pre-treatment for 30 min with quantification of FRB1TMD and mChe-FKBP12TMD (n = 3, ± SEM). Tub2 serves as loading control. (E) Quantification of FKBP12TMD from Figure 6C. (F) Steady state analysis of FRB1TMD in wt, msp1Δ and doa10Δ strains. Pgk1 serves as loading control. Pgk1 serves as loading control. (F) Strains expressing FRB1TMD after 30 min rapamycin treatment followed by a cycloheximide chase. Pgk1 serves as loading control. (G) Cycloheximide chase of strains co-expressing FRB1TMD and mChe-FKBP12soluble with and without rapamycin pre-treatment for 30 min with quantification of FRB1TMD (n = 3, ± SEM). Tub2 serves as loading control.
Figure 7
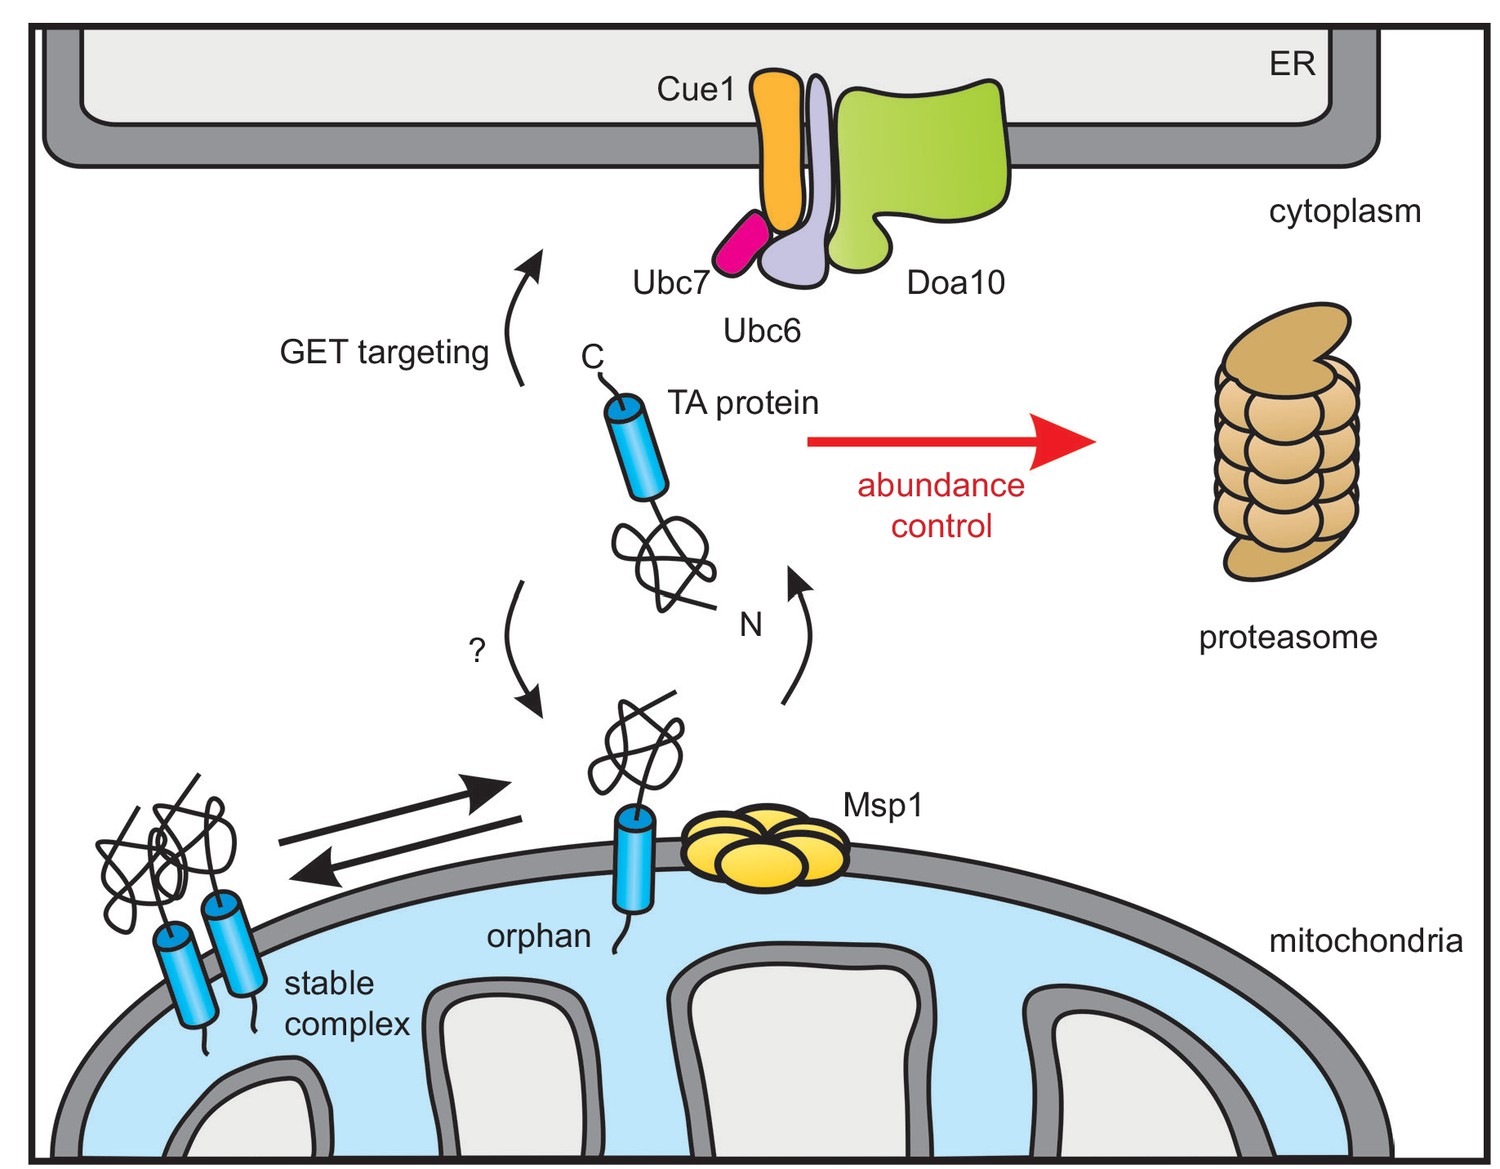
Model of Doa10-mediated TA protein abundance control increasing targeting fidelity and removing clients of Msp1 dislocase.
TA proteins are post-translationally targeted to the ER by the GET pathway or insert into the OMM by an so far unknown mechanism. In the OMM, TA proteins become subject for Msp1-mediated extraction unless they dimerize or form hetero-oligomers (not shown). The ER-resident E3 ubiquitin ligase Doa10 together with its complex partners targets surplus TA proteins including Msp1-clients from the cytosol for proteasomal degradation in order to improve targeting fidelity and abundance control.
Additional files
-
Supplementary file 1
sfGFP and mCherry/sfGFP ratio z-scores measured for tFT-Pex15Δ30 and tFT-Tom5 in the non-essential yeast deletion collection.
- https://doi.org/10.7554/eLife.45506.015
-
Supplementary file 2
Array of investigated TA proteins according to Burri and Lithgow (2004).
- https://doi.org/10.7554/eLife.45506.016
-
Supplementary file 3
Yeast strains used in this study.
- https://doi.org/10.7554/eLife.45506.017
-
Supplementary file 4
Plasmids used in this study.
- https://doi.org/10.7554/eLife.45506.018
-
Transparent reporting form
- https://doi.org/10.7554/eLife.45506.019
Download links
A two-part list of links to download the article, or parts of the article, in various formats.
Downloads (link to download the article as PDF)
Open citations (links to open the citations from this article in various online reference manager services)
Cite this article (links to download the citations from this article in formats compatible with various reference manager tools)
Cooperation of mitochondrial and ER factors in quality control of tail-anchored proteins
eLife 8:e45506.
https://doi.org/10.7554/eLife.45506


