Reconstruction of Par-dependent polarity in apolar cells reveals a dynamic process of cortical polarization
- Kyoto University, Japan
- RIKEN Center for Biosystems Dynamics Research, Japan
- The University of Tokyo, Japan
Figures
Figure 1
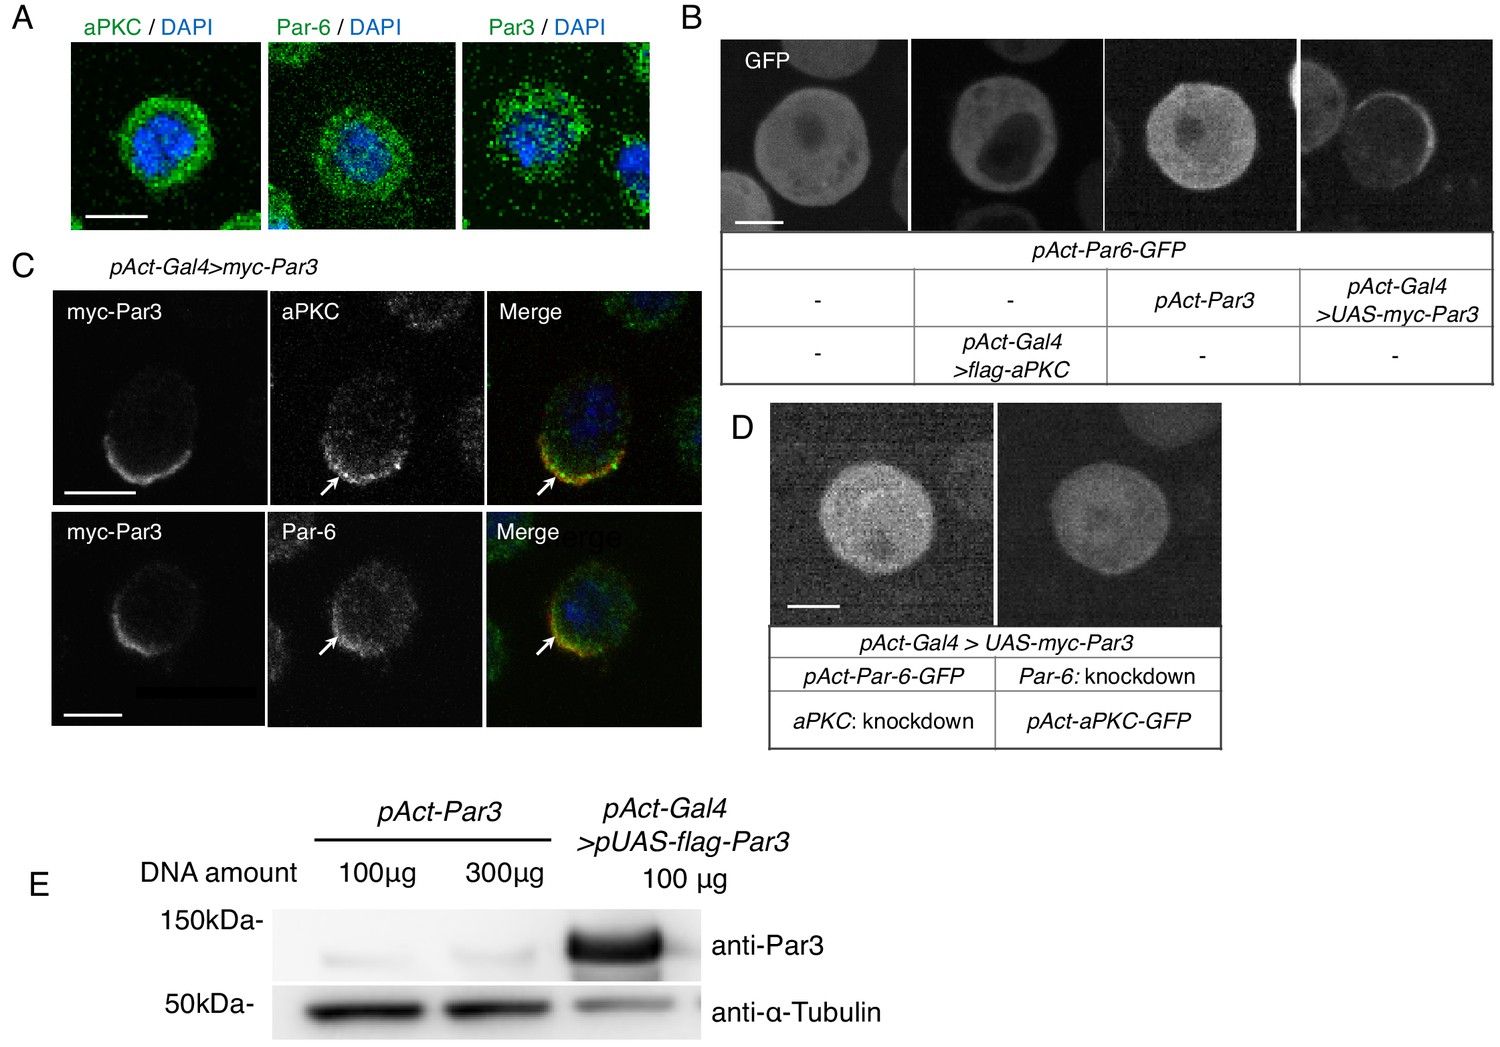
S2 cells polarize due to elevated Par3 expression.
(A) Immunostaining of endogenous aPKC, Par6, and Par3 in S2 cells 2 days following transfection of the empty vector. Blue indicates DAPI staining. Images in A-D were at the equatorial plane of cells. Scale bar, 5 μm in all panels in this figure. (B) Live-imaging of Par6-GFP in S2 cells (top), 2 days following transfection of a combination of expression plasmids as described in the table (bottom). (C) Localization of endogenous aPKC and Par6 in cells overexpressing myc-Par3, stained with anti-myc-tag and anti-aPKC or anti-Par6 antibodies, and with DAPI, 2 days after transfection. Arrows indicate co-localized Par components. (D) Live-imaging of Par6-GFP (left) or aPKC-GFP (right) in Par3-overexpressing cells containing aPKC or Par6 RNAi knockdown, respectively, at 2 days post-transfection. (E) Comparison of the expression level of Par3-GFP driven by the actin promoter with that driven by the actin-promoter-Gal4 x UAS system. Western blotting was performed for S2 cells transfected with pAct-Par3-GFP (100 µg and 300 µg/106 cells) and with pAct-Gal4 and pUAS-Par3-GFP, and the blot was stained with the anti-Par3 antibody to quantify the ratio of Par3-GFP amount driven by two different methods.
Figure 2
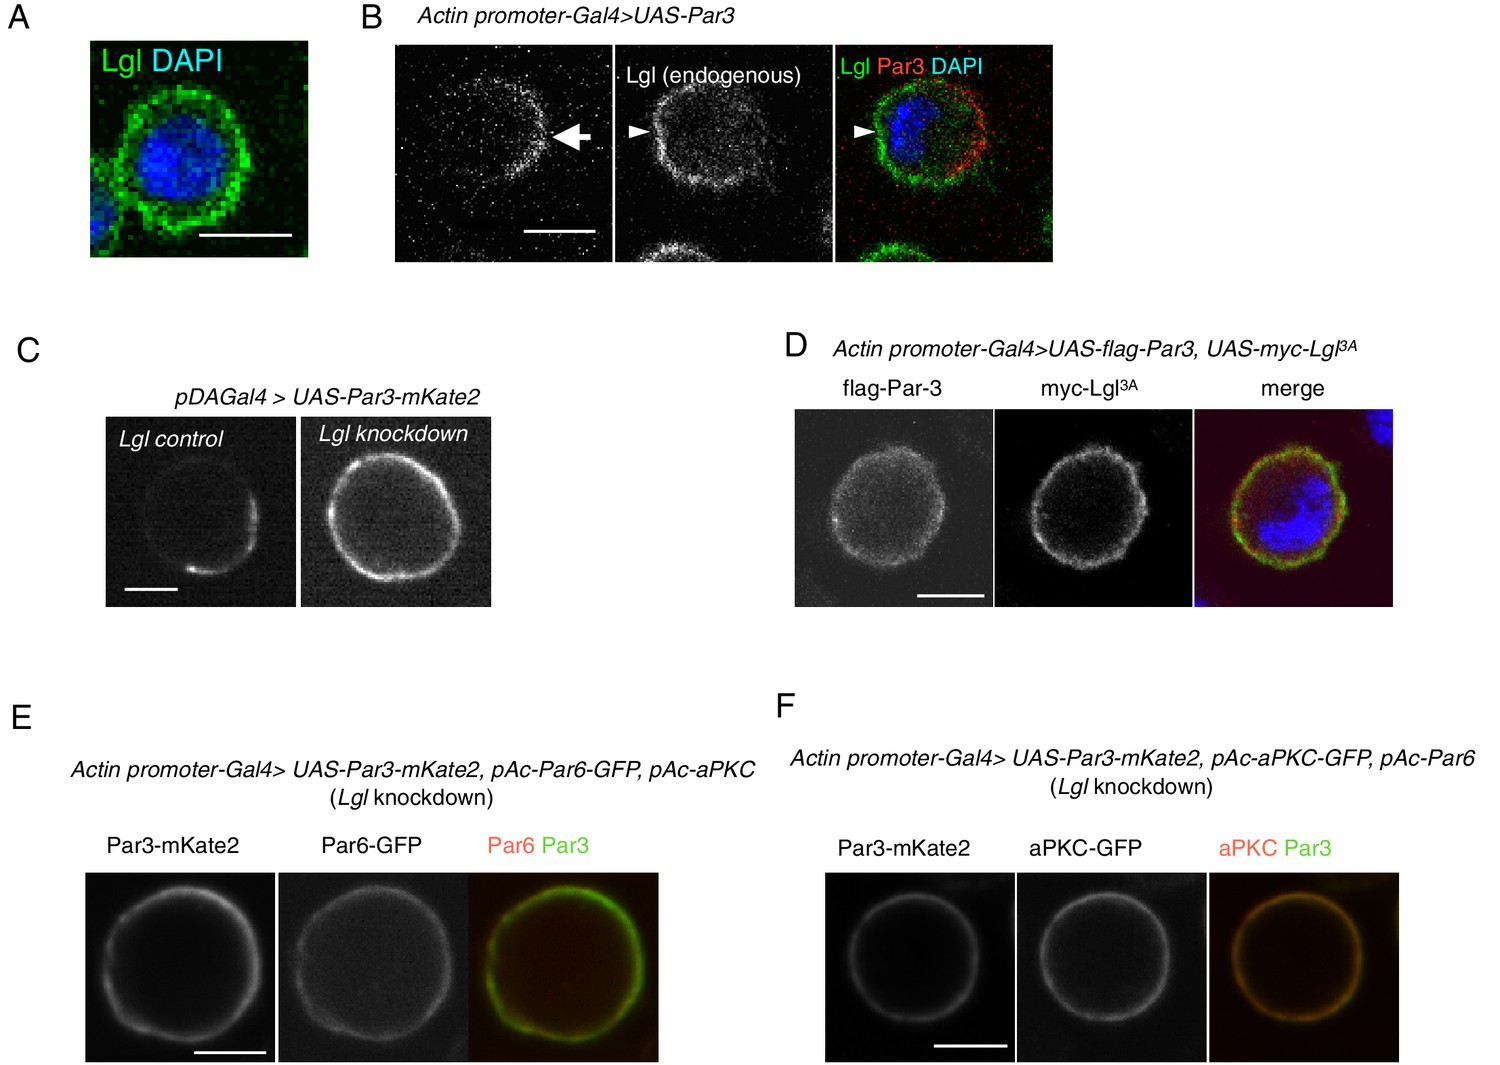
Par3 localization requires Lgl in S2 cells.
(A) Endogenous expression of Lgl in S2 cells stained with anti-Lgl and DAPI at 2 days post-transfection of the empty vector. (B) Par3 and endogenous Lgl localize complementarily in 71% of cells (n = 24) where overexpressed Par3 was asymmetrically localized. Arrow, Par3 crescent. Arrowhead, Lgl. (C) Live-imaging of myc-Par3-mKates without (left) or with (right) Lgl knockdown by RNAi at 2 days post-transfection. (D) S2 cells over-expressing flag-Par3 and myc-Lgl3A, stained with anti-flag-tag, anti-myc-tag and DAPI. Lgl3A was cortically uniform in contrast to cytoplasmic Par3 distribution. (E) Live-imaging of myc-Par3-mKates and Par6-GFP with Lgl knockdown by RNAi at 2 days post-transfection. Myc-Par3-mKate2 co-localized with Par6-GFP in 100% of cells (n = 109) where the overexpressed Par3 was uniformly distributed. (F) Live-imaging of myc-Par3-mKates and aPKC-GFP with Lgl knockdown by RNAi at 2 days post-transfection. Myc-Par3-mKate2 co-localized with aPKC-GFP in 97.8% of cells (n = 137) where overexpressed Par3 was uniformly distributed.
Figure 3
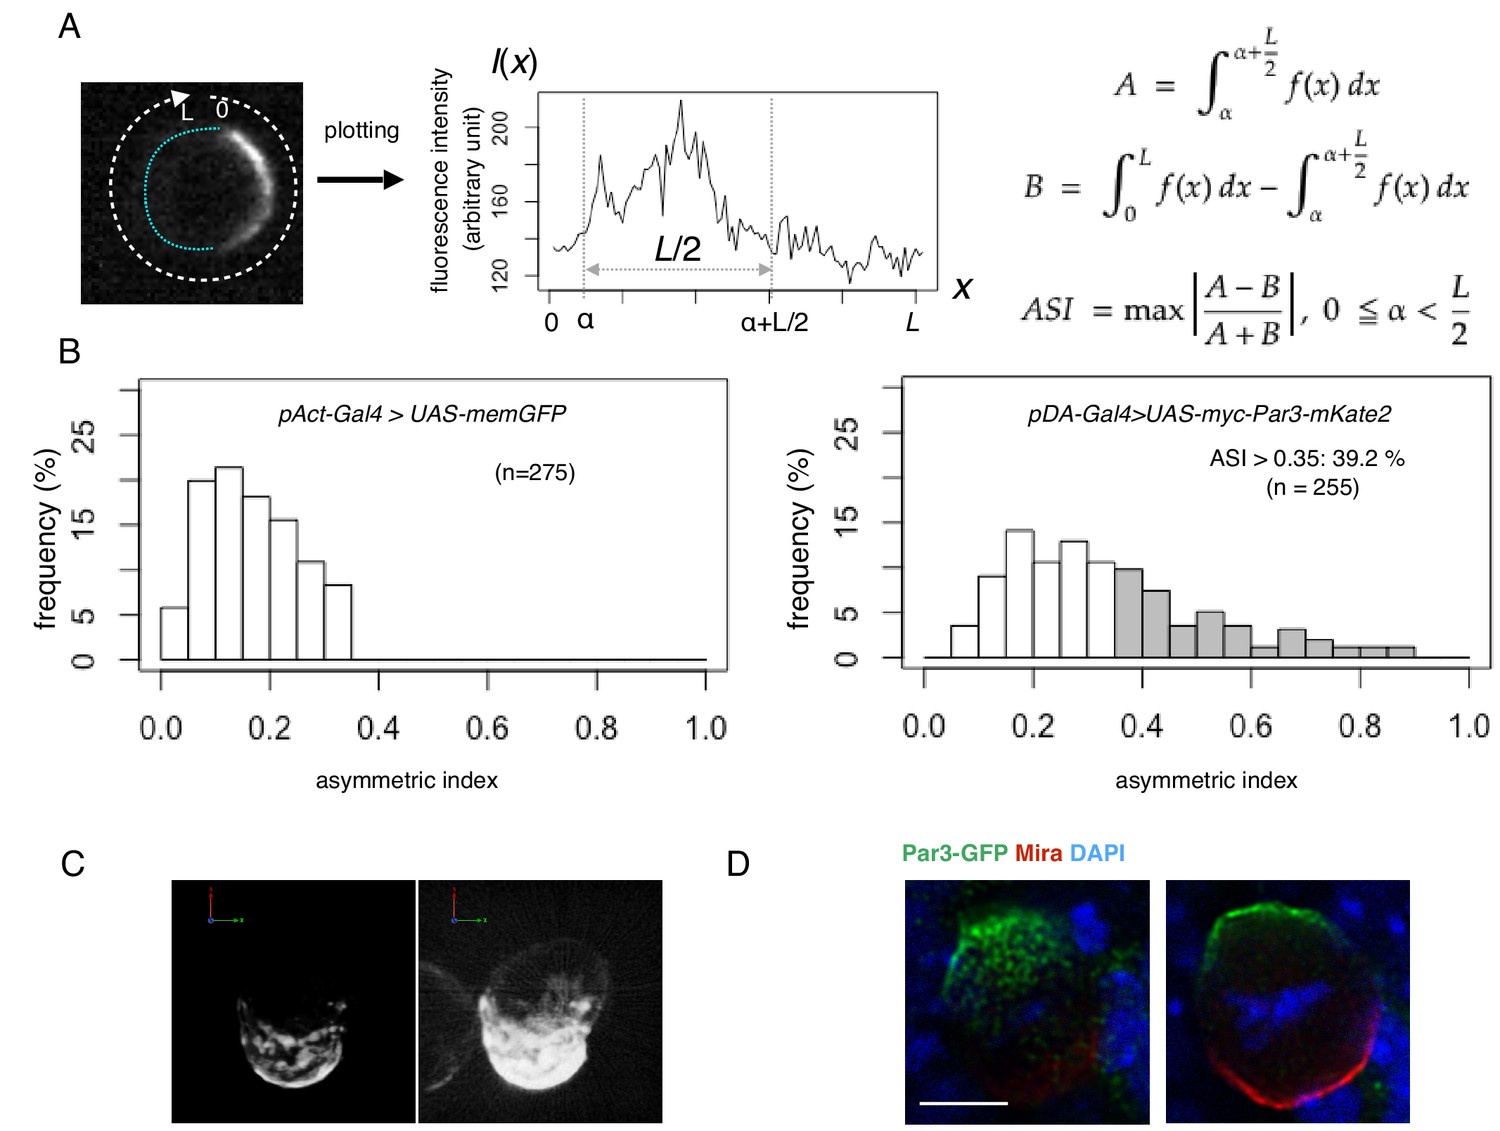
Quantification of cell polarity and 3D imaging.
(A) Definition of the asymmetric index (ASI). ASI is defined by the maximum difference in the cumulative intensity of fluorescence (such as Par3-mKate2 and Par6-GFP) between a half cell perimeter and the other half at the equatorial plane of the cell, normalized via dividing by the cumulative intensity of the entire cell perimeter. (B) ASI distribution was compared between cells expressing memGFP and those expressing Par3-mKate2 at the cell cortex, both of which were driven by the Act-Gal4xUAS system. ASI value of memGFP is distributed broadly and ranges from 0 to 0.35. The mean value = 0.17 ± 0.08 (s.d.). In the all following figures, the numerical value after ± is s.d.. Since memGFP, in principle, has no ability to polarize, such a wide distribution originated from the fluctuation of random distribution along the equatorial cell perimeter and also from the existence of local membrane flairs. Distribution of ASI for cells showing cortical Par3 distribution (mean = 0.34 ± 0.18) may be categorized into two groups (Figure 3A, B); a group of cells show low ASIs overlapping with those of cells expressing memGFP in the range from 0 to 0.35, indicating that cells belonging to this group are essentially non-polarized. The ASI values of the other group (approximately 39%), are broadly distribute, but display ASI values larger than the ASI distribution of mem-GFP cells (ASI > 0.35, mean value = 0.52 ± 0.14). (C) 3-D reconstructed image of a cell overexpressing myc-Par3-mKate2 (left). In the right side image, brightness and contrast were adjusted to visualize the outline of the same cell. The time-lapse movie of a different cell is shown as Video 1. (D) Localization of the Par3-GFP in a mitotic neuroblast of a Drosophila brain expressing Par3-GFP, taken from a third instar larvae and stained for GFP (green) and Miranda (red, Ikeshima-Kataoka et al., 1997). The image were deconvolved. This neuroblast is tilted so that the apical pole (where Par3-GFP distributed) is on the near side, and the basal pole (where Miranda distributed) is on the far side. The left panel shows the image of a single focal plane near an apico-lateral surface. The right panel shows the image of the equatorial plane. Scale bar, 5 μm.
-
Figure 3—source data 1
Source data for the histogram in Figure 3.
- https://doi.org/10.7554/eLife.45559.005
-
Figure 3—source data 2
The individual histogram in each experiment in Figure 3.
- https://doi.org/10.7554/eLife.45559.006
Figure 4 with 1 supplement
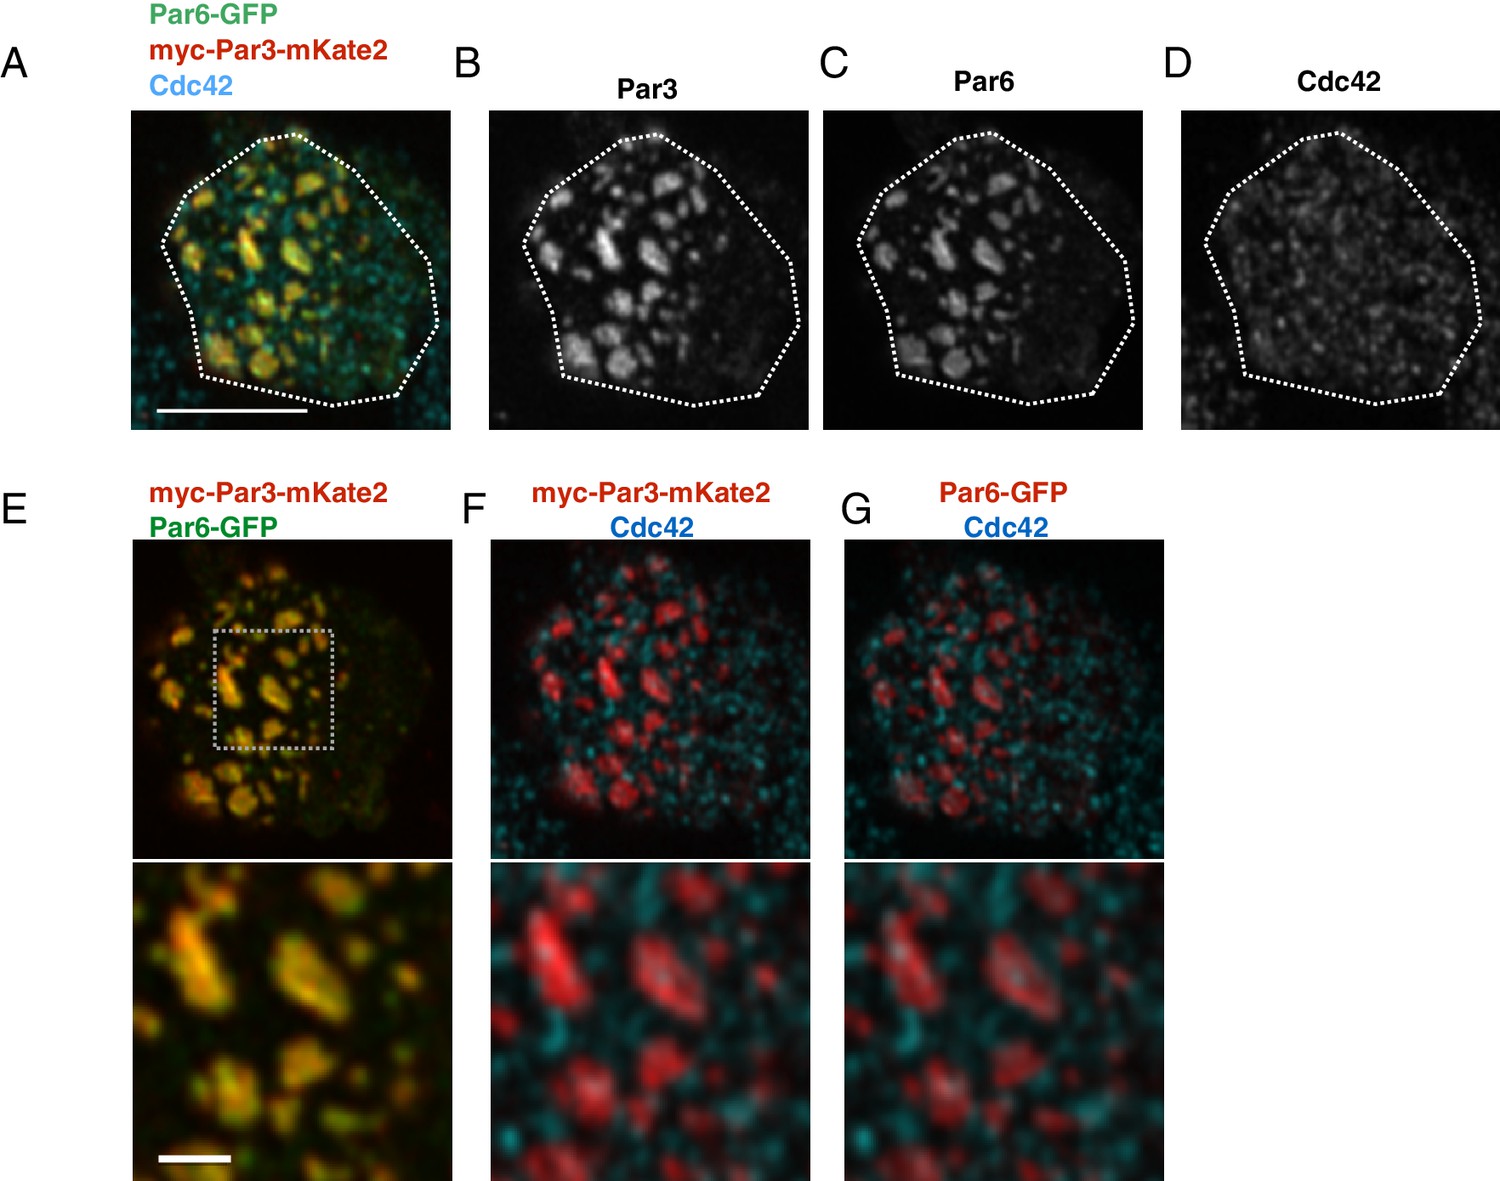
The localization of Par6, Par3 and Cdc42 in the Par-islands.
(A–D) An image of a S2 cell expressing both myc-Par3-mKate2 and Par6-GFP, immunostained for myc, GFP and Cdc42. (A) Triple staining image for myc-Par3-mKate2, Par6-GFP and Cdc42. (B-D) Images showing each single immunostaining. The image was taken by focusing on a surface plane of the cell. Scale bar, 5 µm. (E–G) The double staining image of the cell shown in A-D. (E) myc-Par3-mKates (red) and Par6-GFP (green). (F) The image showing double staining for myc-Par3-mKate2 (red) and Cdc42 (blue). (G). The image showing double staining for Par6-GFP (red) and Cdc42 (blue). Lower panels of E-G show the magnified images of the dotted square. Scale bar, 1 µm. S2 cells are transfected with expression plasmids of actin-promoter-Par6-GFP, actin-promoter-aPKC, and pMT-myc-Par3-mKate2. Two days after transfection, CuSO4 was administrated to induce myc-Par3-mKate2. Three hours post-induction, cells were fixed and immunostained.
Figure 4—figure supplement 1

Temporal pattern of Par6 expression level.
Temporal pattern of the fluorescence intensity of Par6-GFP expressed in S2 cells transfected with pAct-Par6-GFP. The fluorescence intensity of Par6-GFP was measured for 6 cells every 1 hr from 2 days following transfection. Expression levels did not drastically change from 6 hr onward following transfection, indicating that Par6-GFP is an appropriate marker for the Par complex distribution in cells, when Par3-mKate2 was induced.
Figure 5
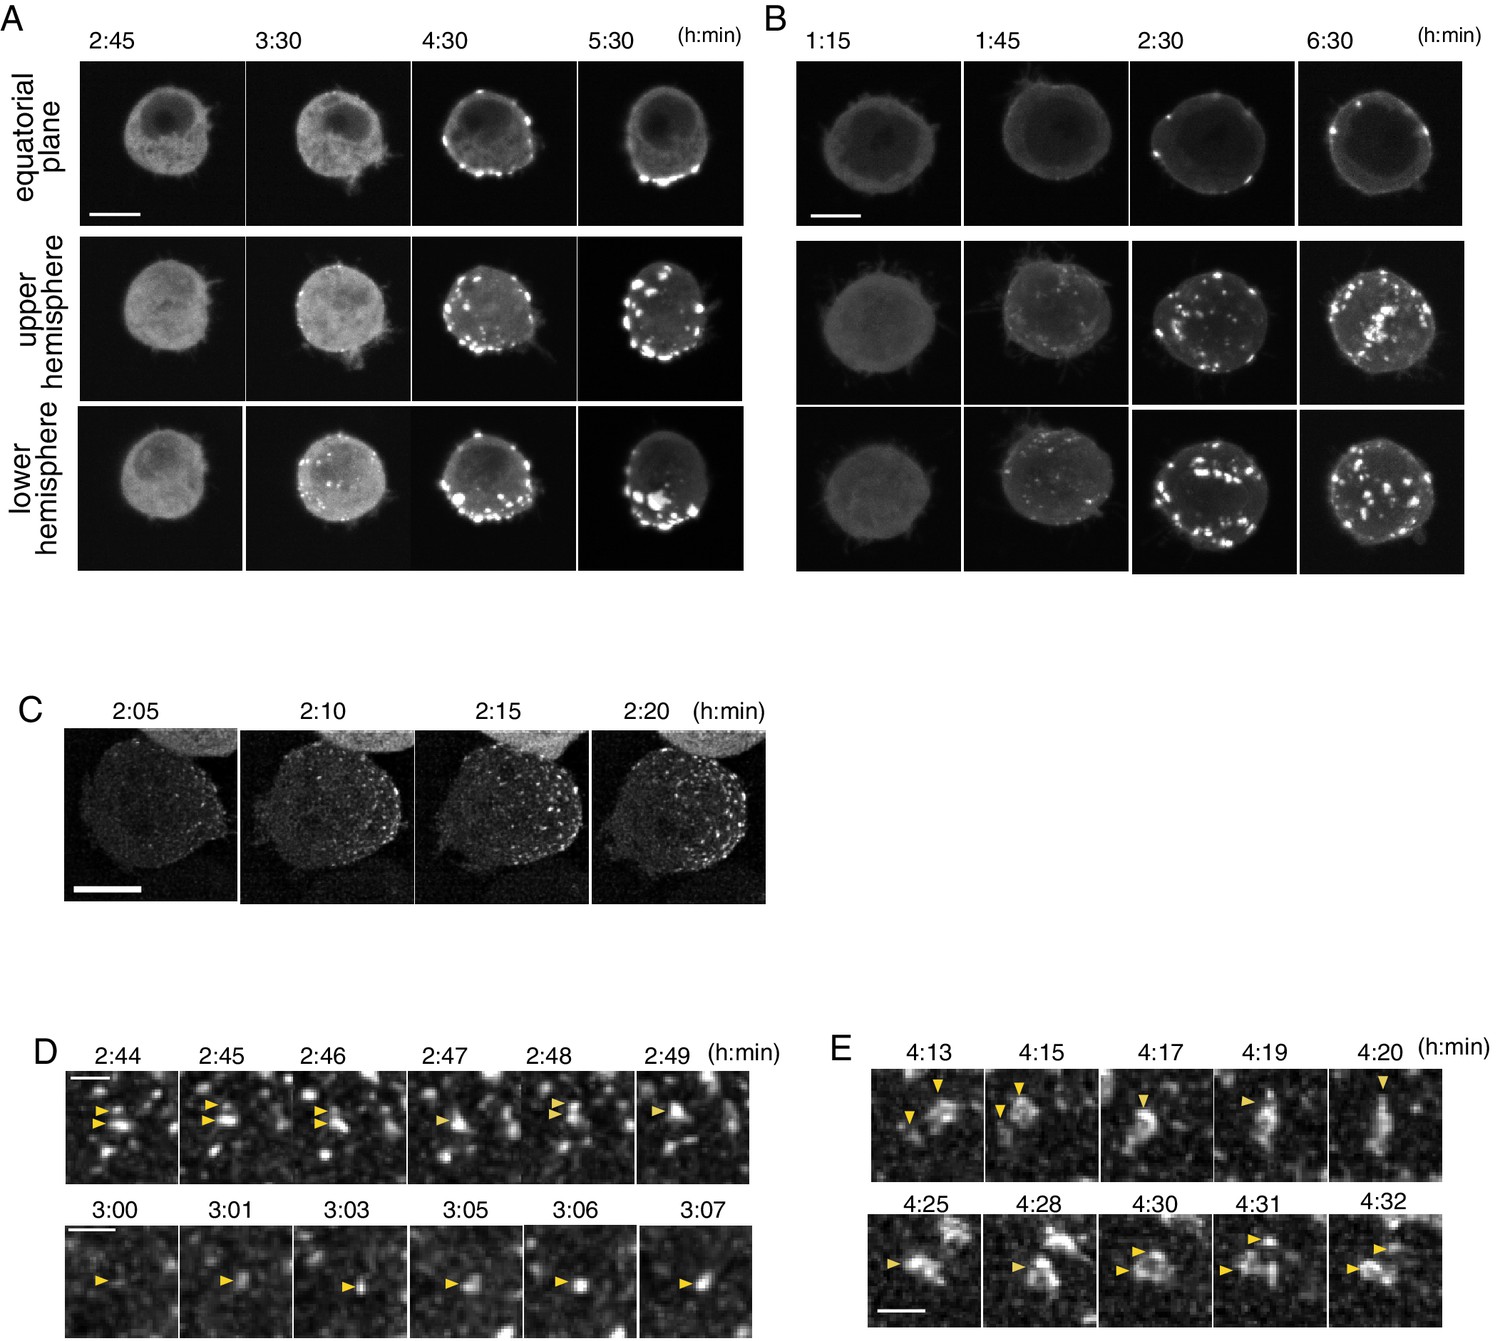
Temporal pattern of Par complex clustering.
(A and B) Time-lapse images of S2 cells inducing Par3-mKate2 expression via the Metallothionein promoter, leading to polarized (A) or non-polarized (B) Par3 distribution. Time 0 (h: min) was at the time of induction by CuSO4 addition in these and subsequent panels. The top row shows images at the equatorial plane. The middle and bottom rows show the max intensity projection images of the upper and lower hemispheres of the cell, respectively. Scale bar, 5 μm. (C) Time-lapse images of Par6-GFP showing the emergence and development of Par-dots. The images are 6 μm max intensity projection covering the entire cell. Scale bar, 5 μm. (D) Time-lapse imaging of Par6-GFP showing the fusion and fission of Par-dots (arrowheads in the upper panel), and the growth of a Par-dot (arrowheads in the lower panel). In E and F, scale bar, 1 μm. (E) Time-lapse image of Par-islands visualized by Par6-GFP. Arrowheads indicate dynamic shape changes, fusion (arrowheads, upper panel) and the dissociation of Par-islands (arrowheads, lower panel).
Figure 6 with 1 supplement
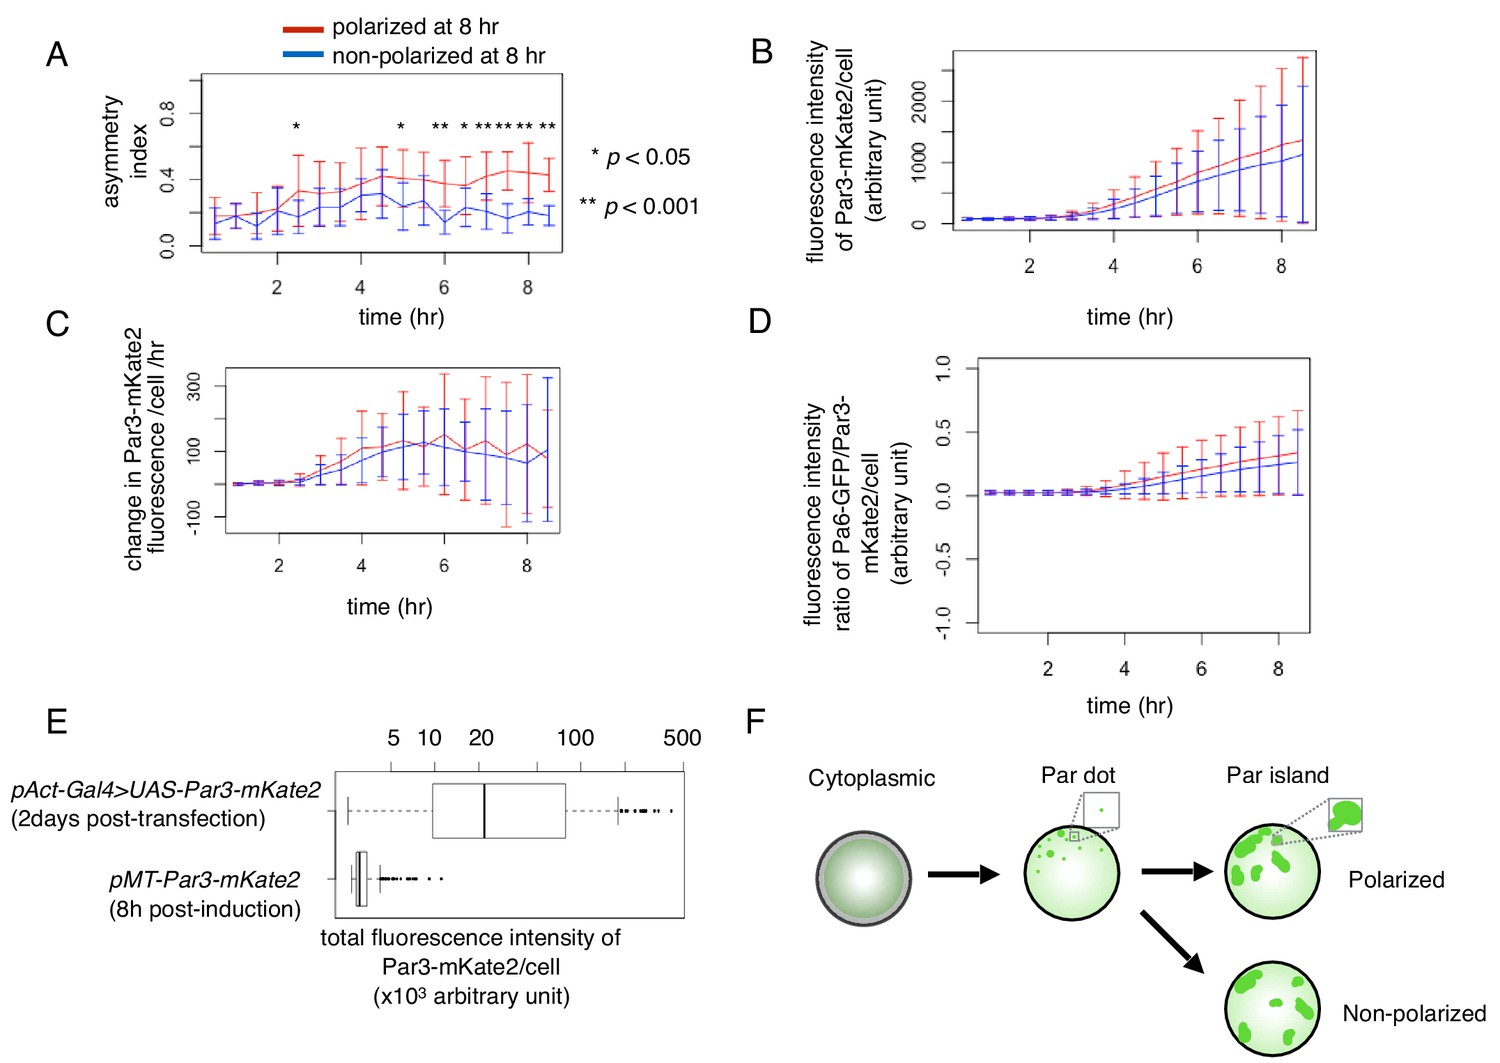
Temporal changes in cell polarity toward the two steady states.
(A–D) Temporal pattern of the asymmetric index (A), fluorescence intensity of Par3-mKate2 (B), its rate of change (B) and the ratio of Par6-GFP/Par3-mKate2 (D) of S2 cells that were transfected with pMT-Par3-mKate2 and pAct-Par6-GFP, followed by induction by CuSO4 addition 2 days after plasmid transfection. Time 0 is the timing of CuSO4 addition (2 days following plasmid transfection). Measurements were taken every 30 min. The blue and red line respectively indicates the averaged values of 10 cells showing a non-polarized Par6-GFP distribution (ASI around 0.2), and that of 13 cells with a polarized Par6-GFP distribution at 8 hr after induction (ASI around 0.4). Fluorescence intensity reached the steady level around 8 hr after induction (B, D). Bars indicate s.d. The temporal pattern of the fluorescence intensity/cell of Par3-mKate2 and Par6-GFP/Par3-mKate2 ratio are not significantly different between the polarized cell group (red line) and non-polarized cell group (blue line). The ASI value began to increase immediately after the rise of Par3-mKate2 levels (approximately 2 hr after induction) in the polarized cells (blue line) in (A), and maintained a high level afterwards, while the non-polarized cells (red line) initially showed a slight increase in the ASI value and subsequently a decrease from 5 hr after induction onwards. The timing of the increase in ASI roughly corresponded to that of Par-dot emergence (2–4 hr after induction; see Figure 4A–C), and the timing of a decrease in ASI value in non-polarized cells roughly corresponds to the late period of Par-island formation (4–6 hr after induction), although there are cell-to-cell variations in these timings. in (A), t test, p=5.6×10⁻⁵, 0.04, 5.5 × 10⁻⁴, 1.1 × 10⁻⁶, 5.5 × 10⁻⁴, and 4.3 × 10⁻⁷ for every 30 min time point from 6 hr after induction. (E) Comparison of Par3-mKate2 expression level induced by the Metallothionein promoter, pMT-Par3-mKate2, and that promoted by the pAct-Gal4xUAS system. The mKate2 fluorescence intensity of the individual S2 cells was measured 2 days after transfection of pAct-Gal4 and UAS-Par3-mKate2, or at 8 hr post-CuSO4 induction of pMT-Par3-mKate2, 2 days after transfection of the plasmid. The expression level of Par3-mKate2 per cell was approximately 16-fold higher when it was driven by the UAS-Gal4 system (Mean 5.5 × 10⁴ ± 7.1 × 10⁴) than that of the steady state level induced by the Metallothionein promoter (3.4 × 10³ ± 9.8 × 10²). We also estimated the ratio of overexpressed Par3 protein level to endogenous Par3 in S2 cells to be approximately 300-fold and 20-fold for the Gal4-UAS system and Metallothionein promoter, respectively (Figure 6—figure supplement 1). (F) Schematic presentation of S2 cell polarization process from Par-dot formation to clustering of Par-islands.
-
Figure 6—source data 1
Source data for the temporal change of S2 cells.
- https://doi.org/10.7554/eLife.45559.014
Figure 6—figure supplement 1
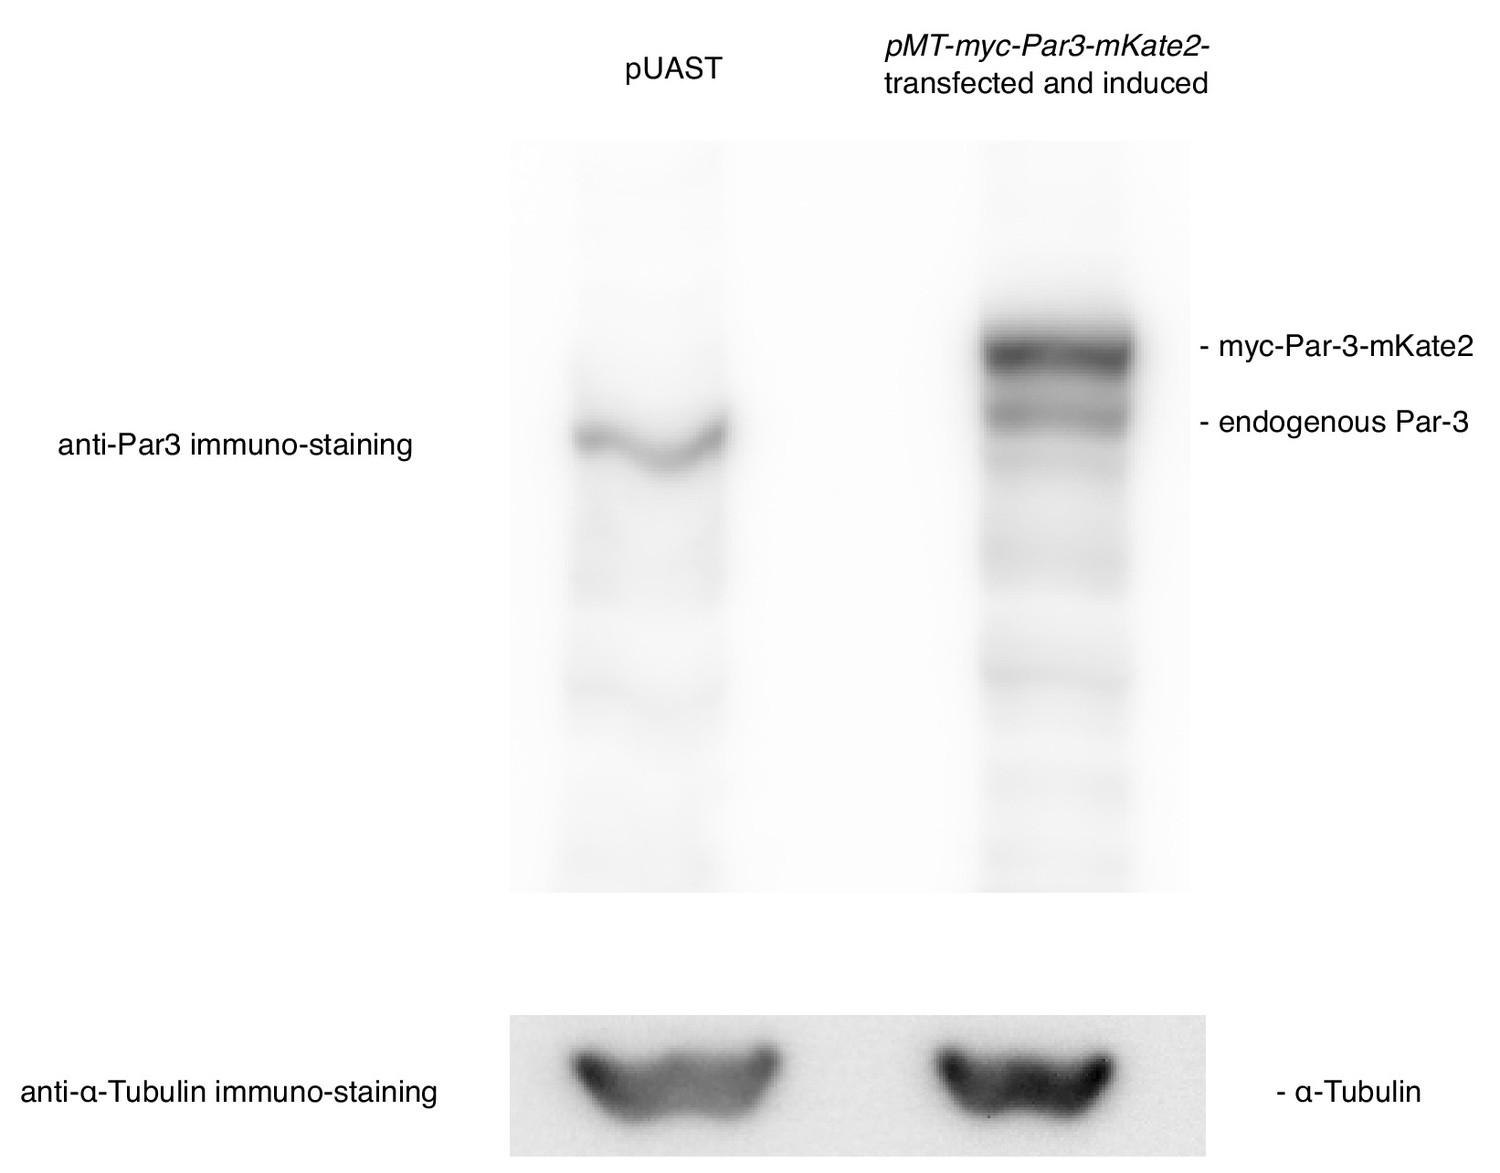
Comparison in the expression level between the endogenous Par3 and the induced Par3.
The expression levels were compared between Par3-induced by the MT promoter and the endogenous Par3 by western blotting. S2 cells were transfected with pMT-myc-Par3-mKate2, and induced for 8 hr using CuSO4 from 2 days post-transfection for western blotting. Right lane: 8 h-induction of myc-Par3-mKate2 by the MT promoter, left lane: transfection of pUAST instead of pMT-myc-Par3-mKate2 as a control.
Figure 7
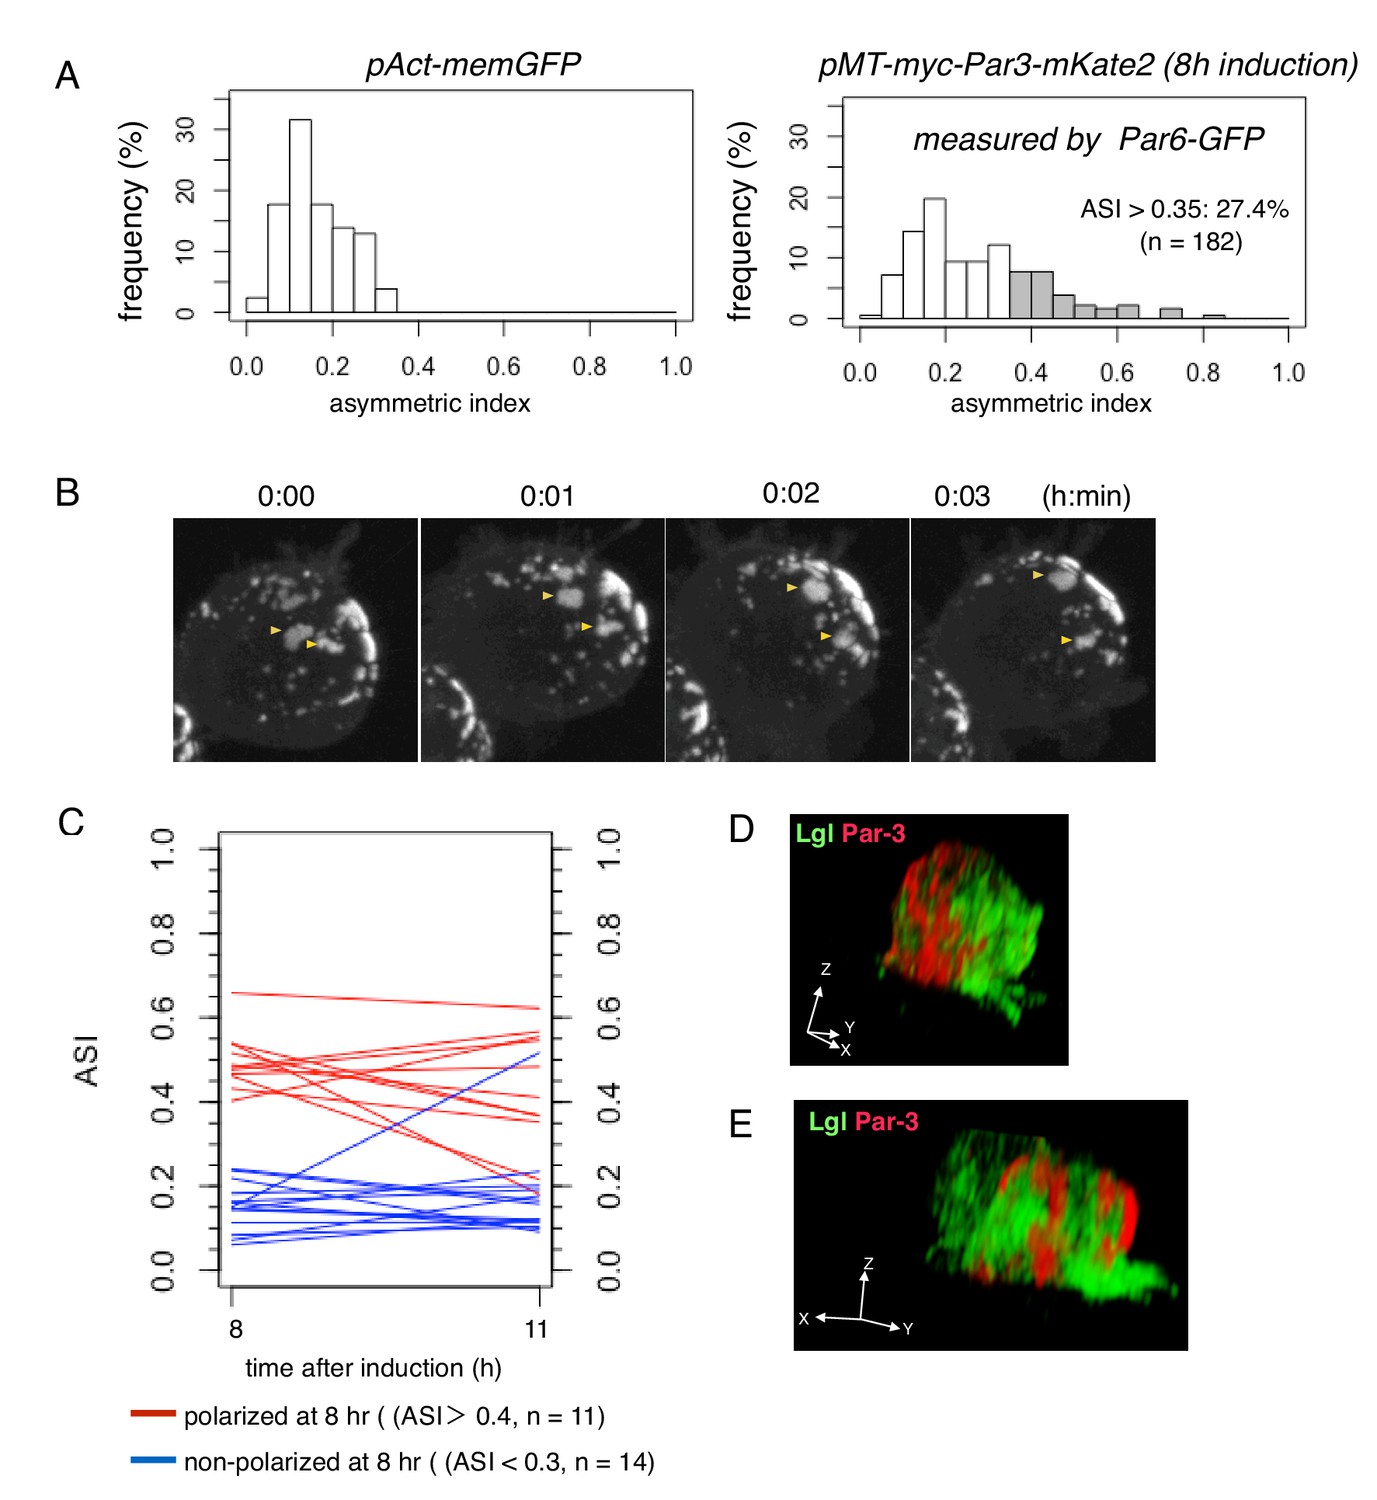
Steady state dynamics of polarized Par complex.
(A) The distribution of ASI among cells with memGFP (left) driven by the Act5C promoter and Par-3-mKate2 (right) induced MT promoter. ASI was measured for the equatorial plane of cells 8 hr after CuSO4 addition. The mean ASI value was 0.17 ± 0.08 (s.d.) for cells expressing memGFP (n = 209 cells), and 0.27 ± 0.15 (s.d.) for cells localizing Par3-mKate2 along the cell cortex (n = 182 cells). Cells showing ASI in the range outside the ASI distribution for memGFP expressing cells (ASI > 0.35) were 27.4% of the cells with cortical Par3-mKate2 (approximately 52% of the transfected cells localize mKate2 cortically). Mean ASI value for those cells was 0.43 ± 0.12 (s.d.). In all figures and the main text, s.d. is shown following the mean value. (B) Time-lapse imaging of Par-islands at the steady state, taken 8 hr after the induction of Par3-mKate2 by CuSO4 addition and onwards. Par-islands in a polarized cell were visualized by Par6-GFP that had been expressed by the actin-promoter for 2 days prior to Par3-mKate2 induction. See also Video 3. (C) Stability of polarized and non-polarized cells. ASI values 11 hr post-induction were measured for cells polarized 8 hr post-induction (ASI > 0.4, n = 11) and for non-polarized cells (ASI < 0.3, n = 14). ASI values were measured using induced Par6-GFP. (D and E) 3D images of the distribution of myc-Par3-mKate2 and endogenous Lgl in cells showing polarized (D) and non-polarized (E) Par3 localization. The distribution of Lgl and myc-Par3-mKate2 is essentially non-overlapped in both cases. See Videos 4 and 5 for the 3D-rotation movies.
-
Figure 7—source data 1
Source data for the histogram in the steady state.
- https://doi.org/10.7554/eLife.45559.016
Figure 8

Cell autonomous formation of the Par complex polarization.
(A) Time-lapse imaging of Par3 distribution during mitosis. Time indicates hr:min after CuSO4 addition. Images of equatorial plane (upper panels), and the max projection of the whole cell (lower panels) are shown. Scale bar, 5 µm. (B–D) Relationship between the Par-complex crescent and the position of the centrosome. The centrosome was visualized via Spd-GFP, which was expressed by the transfection of pUbq-Spd-2-GFP and pDA-Gal4 together with pUAS-Par3. Spd-2-GFP and aPKC were immunostained (B). The radial angle the aPKC crescent from the cell center (θ1) and the angle between an edge of the crescent and the centrosome (θ2) in the clock-wise direction were measured at the equatorial plane (C). In 32 out of 40 cells (80%, the sum of independent experiments), the centrosome was located within the fan shape made by the aPKC crescent and the cell center (D). Data shown in black dots and red dots were obtained by immunostaing and live-imaging, respectively.
-
Figure 8—source data 1
Source data for the position of centrosome.
- https://doi.org/10.7554/eLife.45559.021
Figure 9
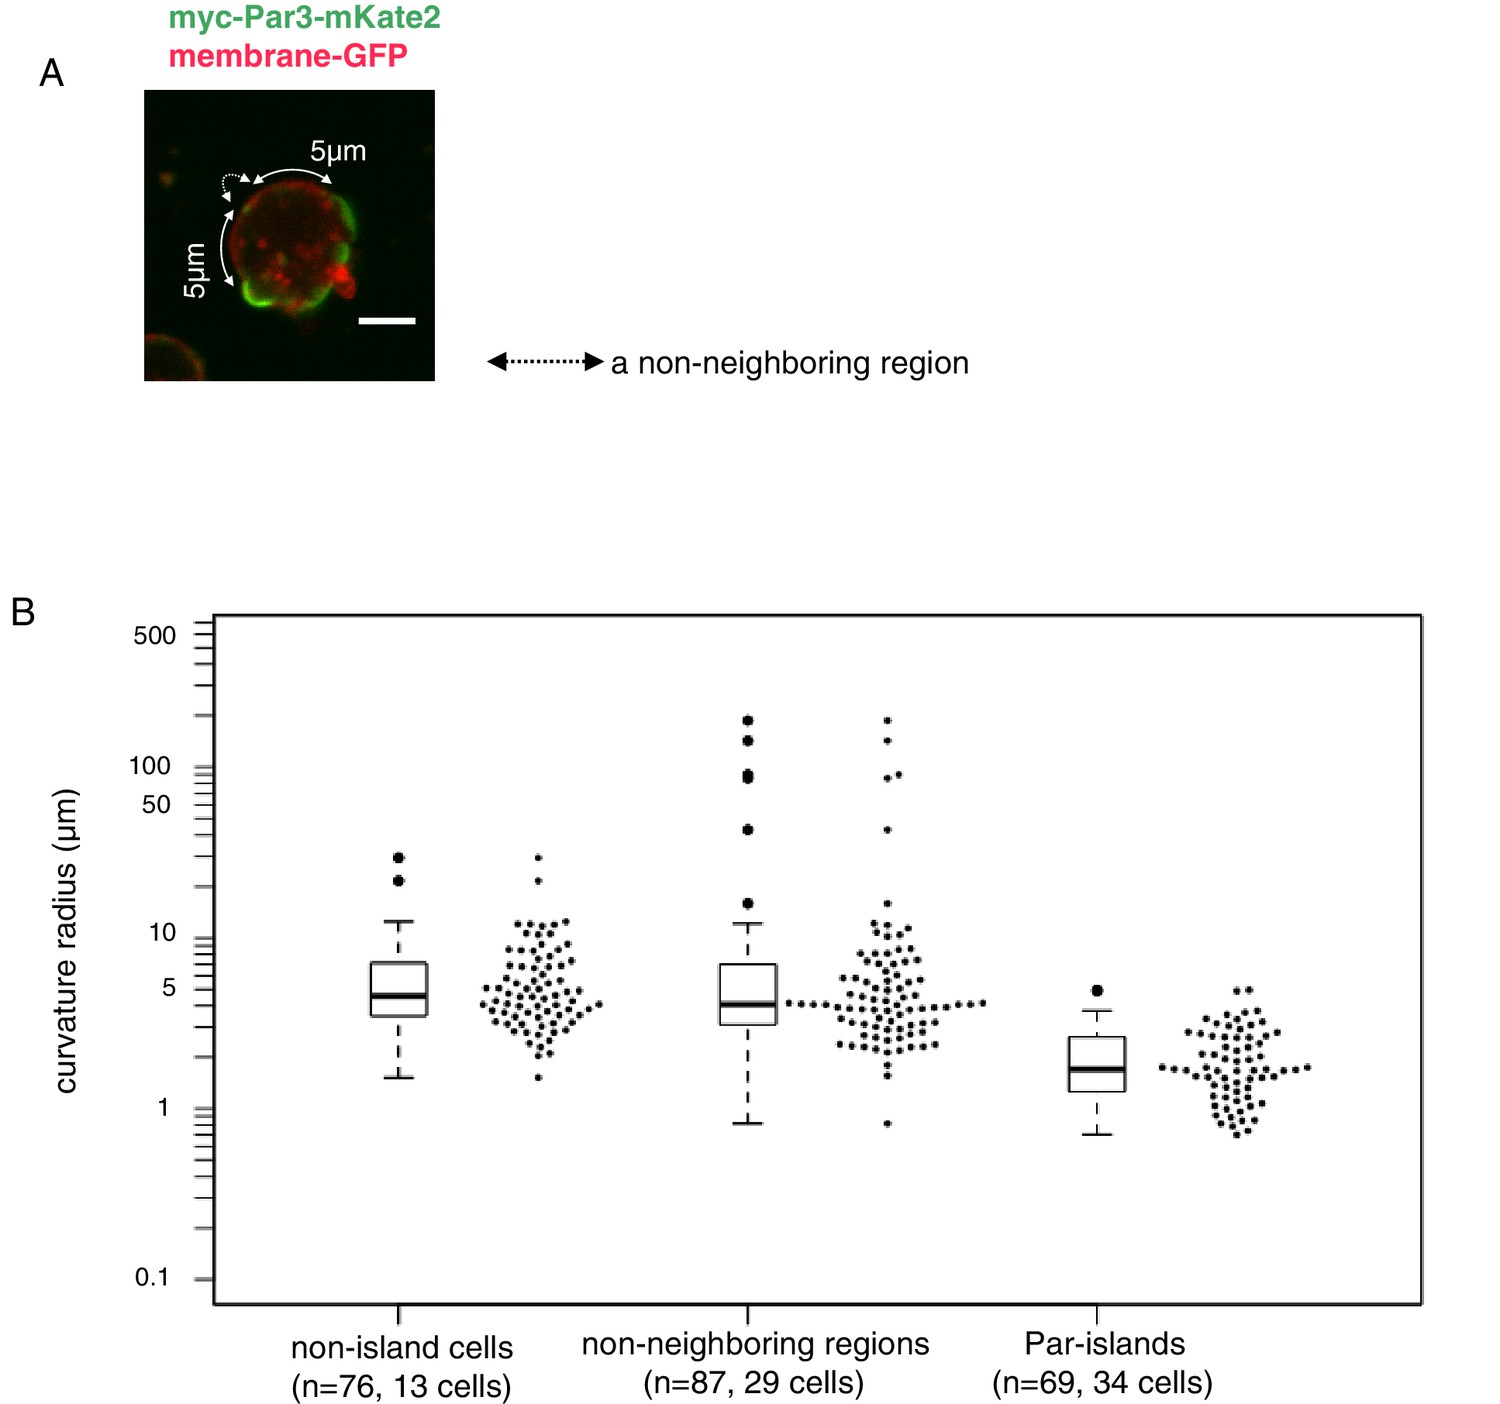
Curvature of Par-islands.
(A) Cell membrane regions along the equatorial contour were visualized by memGFP and classified into three regions, Par-islands, neighboring regions, and non-neighboring regions. A Par-island region was defined as the bright mKate2 fluorescence region where a Par island crossed the equatorial plane, with over 1 µm in length along the equatorial contour. A ‘non-neighboring region’ was defined as a region more than 5 µm away from an edge of Par-islands along the cell contour. In each Par-island and non-neighboring membrane region, the three coordinates, both edges and a mid point along the memGFP contour were selected, and the curvature radius was calculated by the values of coordinates of the three points. Non-islands cells are those lacking Par-islands (see Materials and methods for details). The live-imaging data were taken 8 hr after CuSO4 addition. In most cells, both Par-islands and non-neighboring membrane regions were able to be selected from each single cell. Scale bar, 5 µm. (B) Curvature radii of Par islands, non-neigboring membrane region of cells bearing Par-islands, and of non-island cells. The median of curvature radii are 4.56 µm for non-island cells (n = 76 for 13 cells), 4.07 µm for the non-neighboring-region (n = 87 for 29 cells) and 1.70 µm for the Par-islands (n = 69 for 34 cells). The median curvature radius of Par-islands is significantly smaller than that of the non-neighboring region (p=6.55×10⁻¹⁵, Kolmogorov-Smirnov test) and the non-island cells (p=4.44×10⁻¹⁶, Kolmogorov-Smirnov test).
-
Figure 9—source data 1
Source data for the membrane curvature.
- https://doi.org/10.7554/eLife.45559.023
Figure 10
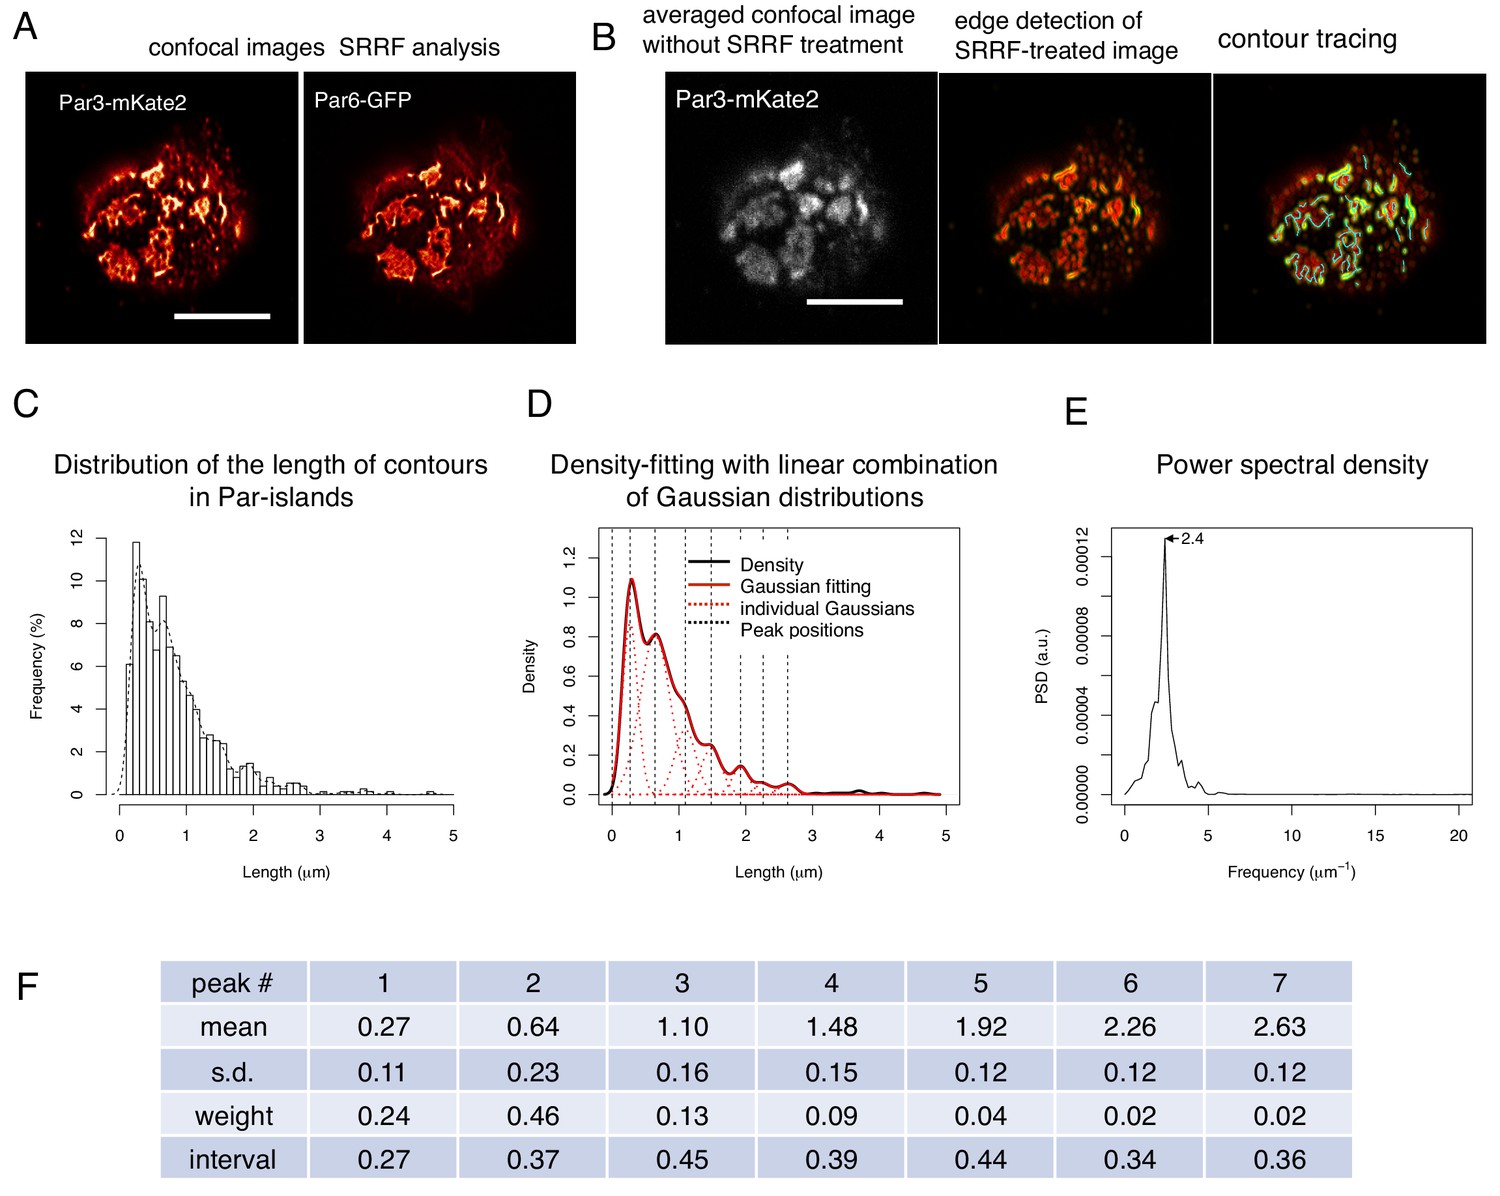
SRRF-processed confocal images reveals a unit-like segment in Par-islands.
(A) SRRF-processed confocal images of cells expressing both Par3-mKate2 and Par6-GFP. Scale bar, 5 μm. (B) Left. the average of 200 confocal images of Par3-mKate2 distribution in a cell that expresses Par3-mKate2 and Par6-GFP. Those 200 images were used for SRRF analysis (Figure 8A). The middle Panel shows the SRRF-processed image (Figure 8A) that was processed with edge detection (see Materials and methods). By this process, the continuous contours become clearly visible. Edges in the image were visualized in green. The right panel shows tracing of continuous contours in the edge-detected image (middle) (light blue lines). Scale bar, 5 μm. (C) The histogram showing the distribution of the continuous contour line lengths in the right panel of Figure 8B and its density plot (dot line). (D) Gaussian fitting of the density plot (Figure 8C). The density plot of the histogram (Figure 8C) was fitted with 7 Gaussian curves via the least square method. The averaged mean of individual Gaussian curves was 0.38 ± 0.062 (s.d.) μm for 754 contours from 28 cells. (E) Power spectral density for the second derivative of the contour distribution plot shown in Figure 8C. The major frequency was 2.4 μm–1. (F) The list of means and s.d. of the 7 Gaussian curves, whose combination best fitted the density plot of the continuous contour lengths distribution shown in Figure 8C,D (see Materials and methods).
-
Figure 10—source data 1
Source data for the contour line length of SRRF images.
- https://doi.org/10.7554/eLife.45559.025
Figure 11
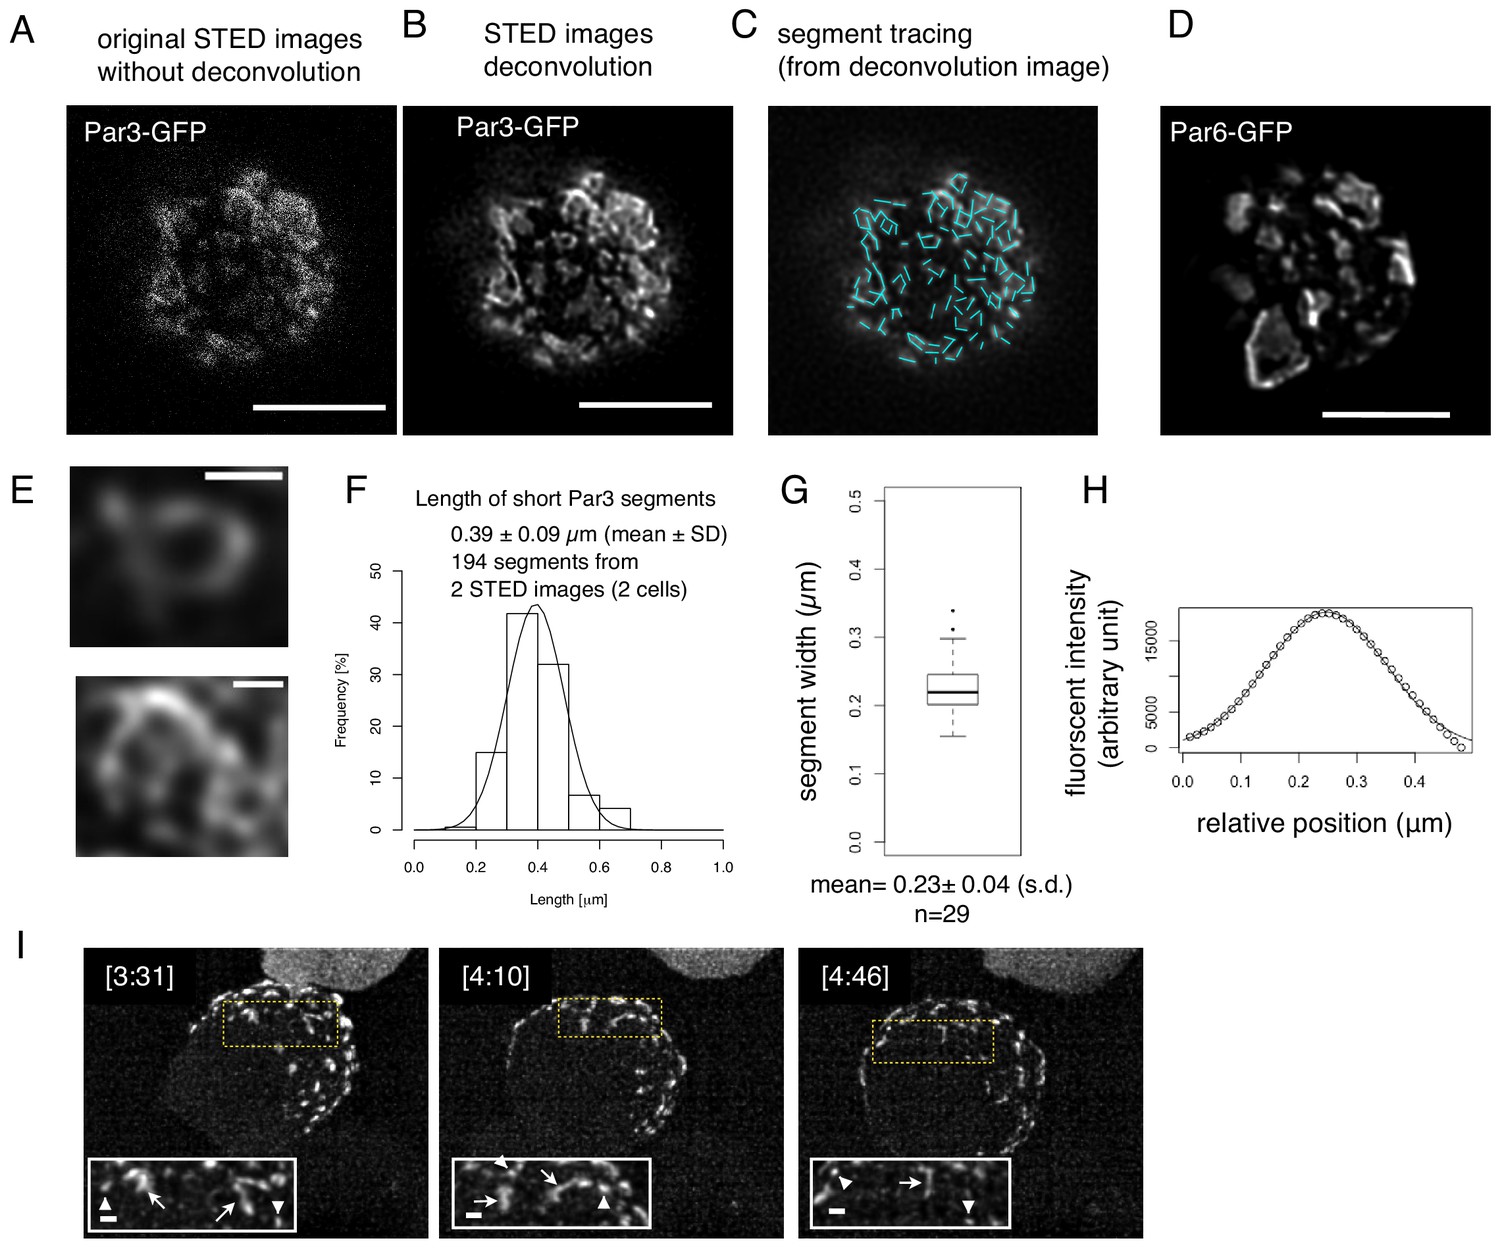
Structual analysis of the assembly state of the Par-complex using STED microscopy.
(A) STED image of a cell that expresses Par3-GFP. The distribution of GFP was detected via indirect immunofluorescence staining. Scale bar, 5 μm for (A–D). (B) Deconvoluted image of the super-resolution (STED) image (A). (C) Tracing of the segments is indicated as light blue straight lines in the deconvoluted STED image (B). See Materials and methods for details. (D) Deconvoluted STED images of cells that expressed Par6-GFP together with pMT-myc-Par3, followed by GFP immunostaining. (E) Magnified views of the cell in (B) visualize the meshwork composed of unit-like segments. Scale bar, 0.5 μm. (F) Distribution of the length of individual segments constructing Par-islands visualized by Par3-GFP and its Gaussian fitting. See Figure 8 for measurements. The mean value of the single segment lengths was 0.39 ± 0.09 (s.d.) μm based on 194 segments from 2 STED images for two cells including (A). (G) Distribution of half widths of segments composing Par-islands that were visualized by GFP staining in the two cells containing the cell shown in (A). The mean is 0.23 ± 0.04 μm (n = 29). (H) An example of Gaussian fitting of the fluorescence intensity distribution across the segment width visualized by immunofluorescence-staining for GFP. The mean half width = 0.23 ± 0.04 (s.d.) μm. (I) Rod and string structures of the Par3-mKate2 appearing in 3D time-lapse images of a cell expressing Par3-mKate2 during the period of Par-dot formation and development. Four time points were selected from Video 2. Scale bar, 2 μm. Insets display the magnification of a part of the image. Arrowheads indicate Par-dots, arrows, rods, and strings. Scale bar, 0.5 μm.
-
Figure 11—source data 1
Source data for the length of segment of STED images.
- https://doi.org/10.7554/eLife.45559.027
Figure 12 with 2 supplements
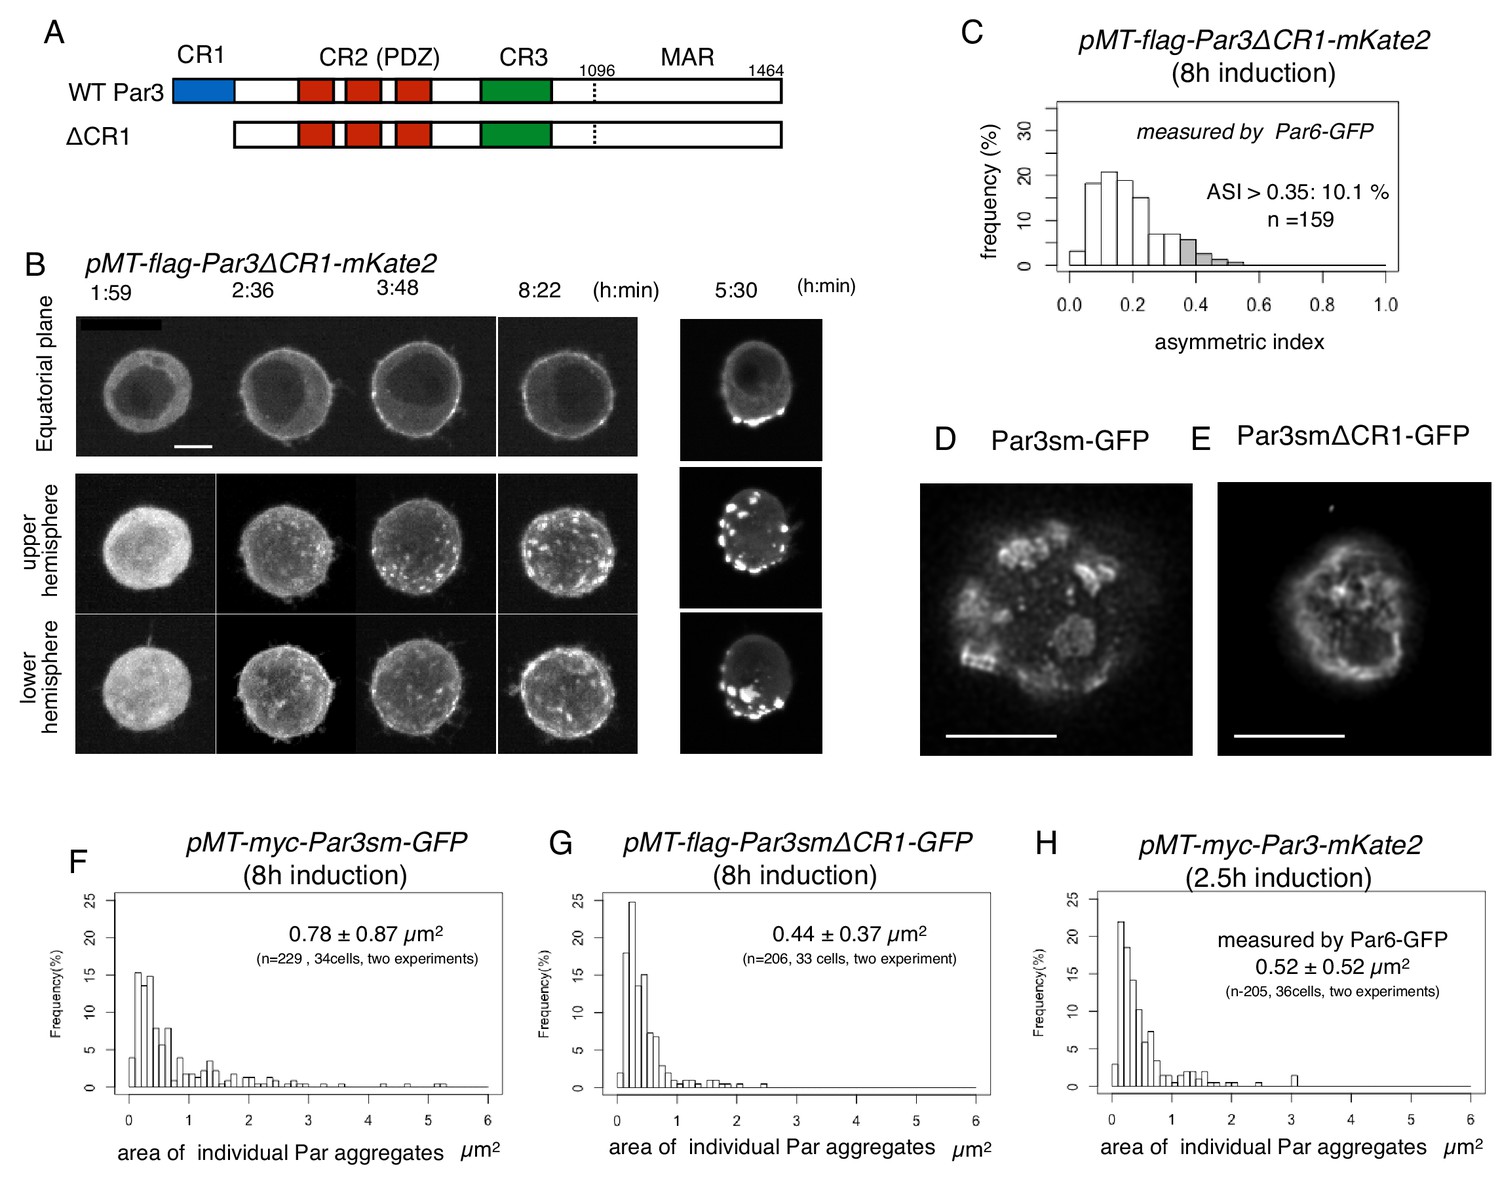
CR1 domain of Par3 is required for the formation of large regular meshwork of Par-islands.
(A) Schematic representation of the functional domains of Par3 and ΔCR1 mutant constructs. (B) Time-lapse imaging of the distribution of Par6-GFP in cells inducing the expression of Par3ΔCR1-mKate2 under the same condition for Par3WT-mKate2. The right column is the same as that of Figure 4A for comparison with the case for Par3WT-mKate2 expression. Time is indicated in hr:min after CuSO4 addition. In (B), images at the equatorial plane (top panels), and stacked images of the upper hemisphere (middle panels), and the lower hemisphere (bottom panels) are shown. Scale bar, 5 μm. (C) The distribution of ASI for cells that have induced Par3ΔCR1-mKate2 (Left, the mean value = 0.19 ± 0.10 for n = 159 cells). The gray part of histograms indicates the fraction of cells having ASI in the range out of the ASI distribution for memGFP-expressing cells (ASI > 0.35, see Figure 3B, and Figure 7A). Cells in this range are 10.1% of cells with cortical Par3ΔCR1-mKate2 (mean ASI value = 0.40 ± 0.05). This polarized cell population (ASI > 0.35) is significantly different (p=1.1×10⁻⁸, Fisher’s exact test with post-hoc Bonferroni correction) from that for wild type myc-Par3-mKate2 (Figure 7A). Quantification was performed 8 hr after CuSO4 addition. (D and E) The deconvolved STED images of the cells that expressed Par3smWT-GFP (D) and Par3smΔCR1-GFP (E). In both cells, the endogenous Par3 was knocked down by dsRNA. The distribution of GFP was detected by indirect immunofluorescence staining. Scale bar, 5 μm. (F–H) The distribution of the size of Par aggregates in cells that have induced (F) flag-Par3sm-GFP (0.78 ± 0.87 µm2 for 34 cells), or (G) flag-Par3smΔCR1-GFP (0.44 ± 0.37 µm2 for 33 cells). Quantification was performed 8 hr after CuSO4 addition onwards. The endogenous Par3 had been knocked down by dsRNA. The size of Par aggregates in Par3ΔCR1-expressing cells is significantly smaller than that of Par3-expressing cells (p=0.000207, Kolmogorow-Smirnov test). (H). The distribution of the size of Par aggregates in cells expressing myc-Par3-mKate2 (0.52 ± 0.52 µm2 for 36 cells) at 2.5 hr after CuSO4 addition onwards, where the majority of Par aggregates are at the dotty state. The distribution is not significantly different from (G) (p=0.63, Kolmogorow-Smirnov test). In (F–H) CuSO4 was added at 2 days post-transfection.
-
Figure 12—source data 1
Source data for the ASI and island size of Par3ΔCR1 mutant.
- https://doi.org/10.7554/eLife.45559.032
Figure 12—figure supplement 1
The suppression of the endogenous Par3 by RNAi.
The estimation of knock down efficiency for the endogenous Par3 by western blotting. S2 cells were transfected with the empty vector. Western blotting was performed two-days post-transfection and the addition of dsRNA. Left lane: no RNAi as a control, Right lane: knocked down of the endogenous Par3 with RNAi.
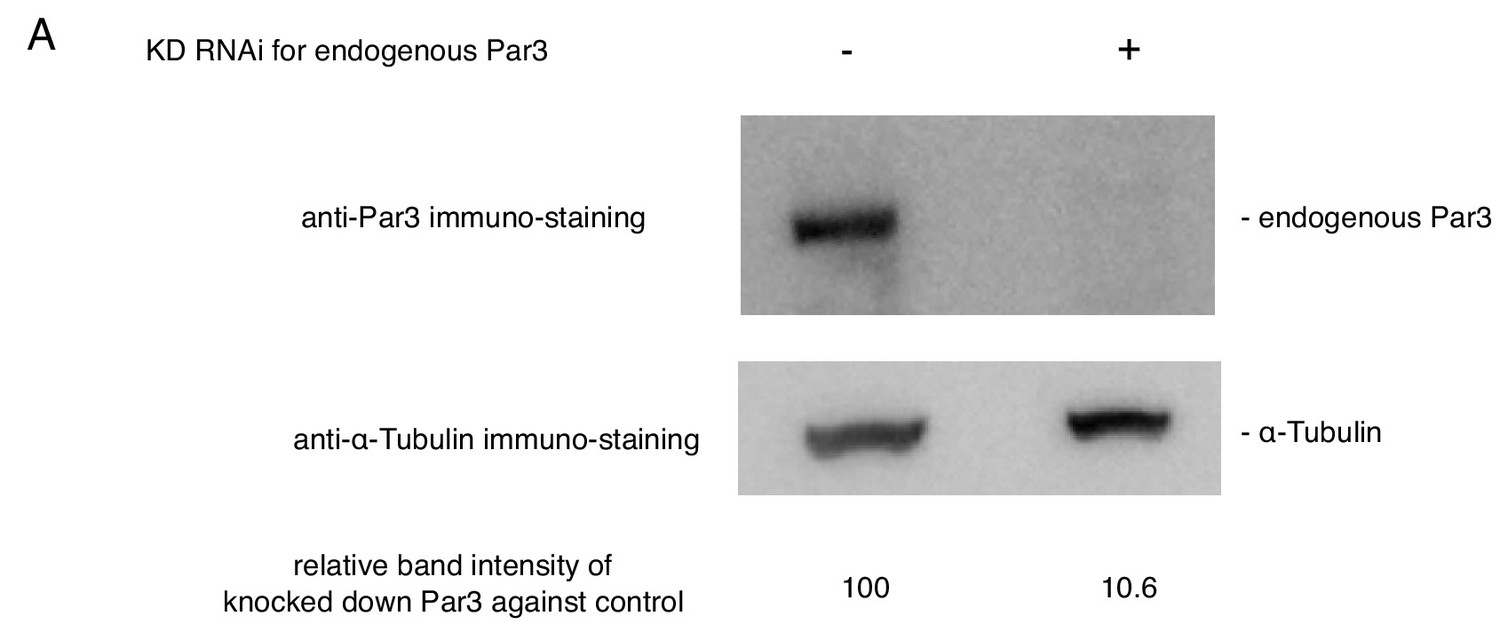
Figure 12—figure supplement 2

Expression level of myc-Par3sm-GFP and flag-Par3ΔCR1sm-GFP, and effect of RNAi.
(A) The estimation of knock down efficiency for the endogenous Par3 by western blotting. S2 cells were transfected with the empty vector. Western blotting was performed 2-days post-transfection and the addition of dsRNA. Left lane: no RNAi as a control, Right lane: knocked down of the endogenous Par3 with RNAi. (B) Comparison of expression levels between the endogenous Par3 and the exogenous Par3ΔCR1 induced by the MT promoter by western blotting. S2 cells were transfected with pMT-flag-Par3smΔCR1-GFP, and induced for 8 hr by CuSO4 addition 2 days post-transfection. Left lane: transfection with pUAST as a control, middle lane. 8 h-induction of flag-Par3smΔCR1-GFP without RNAi, right lane: 8 h-induction of flag-Par3smΔCR1-GFP with RNAi. C-D. Comparison of expression levels between the endogenous Par3 and the exogenous Par3 induced by the MT promoter by western blotting. S2 cells were transfected with pMT-myc-Par3sm-GFP, and induced for 8 hr by CuSO4 addition 2 days post-transfection. Left lane: transfection with pUAST as a control, middle lane. 8 hr-induction of myc-Par3sm-GFP without RNAi, right lane: 8 hr-induction of myc-Par3sm-GFP with RNAi. The band of endogenous Par3 overlaps with that of degraded myc-Par3-GFP in C. In D, myc-Par3-GFP was detected with the anti-Myc-antibody so that there is no overlapping band. From blot C, the ratio of the degraded Par3 and non-degraded Par3 was calculated. By using these values, the true intensities of the endogenous Par3 bands in C were revised.
-
Figure 12—figure supplement 2—source data 1
Source data for the Western blotting image.
- https://doi.org/10.7554/eLife.45559.031
Figure 13
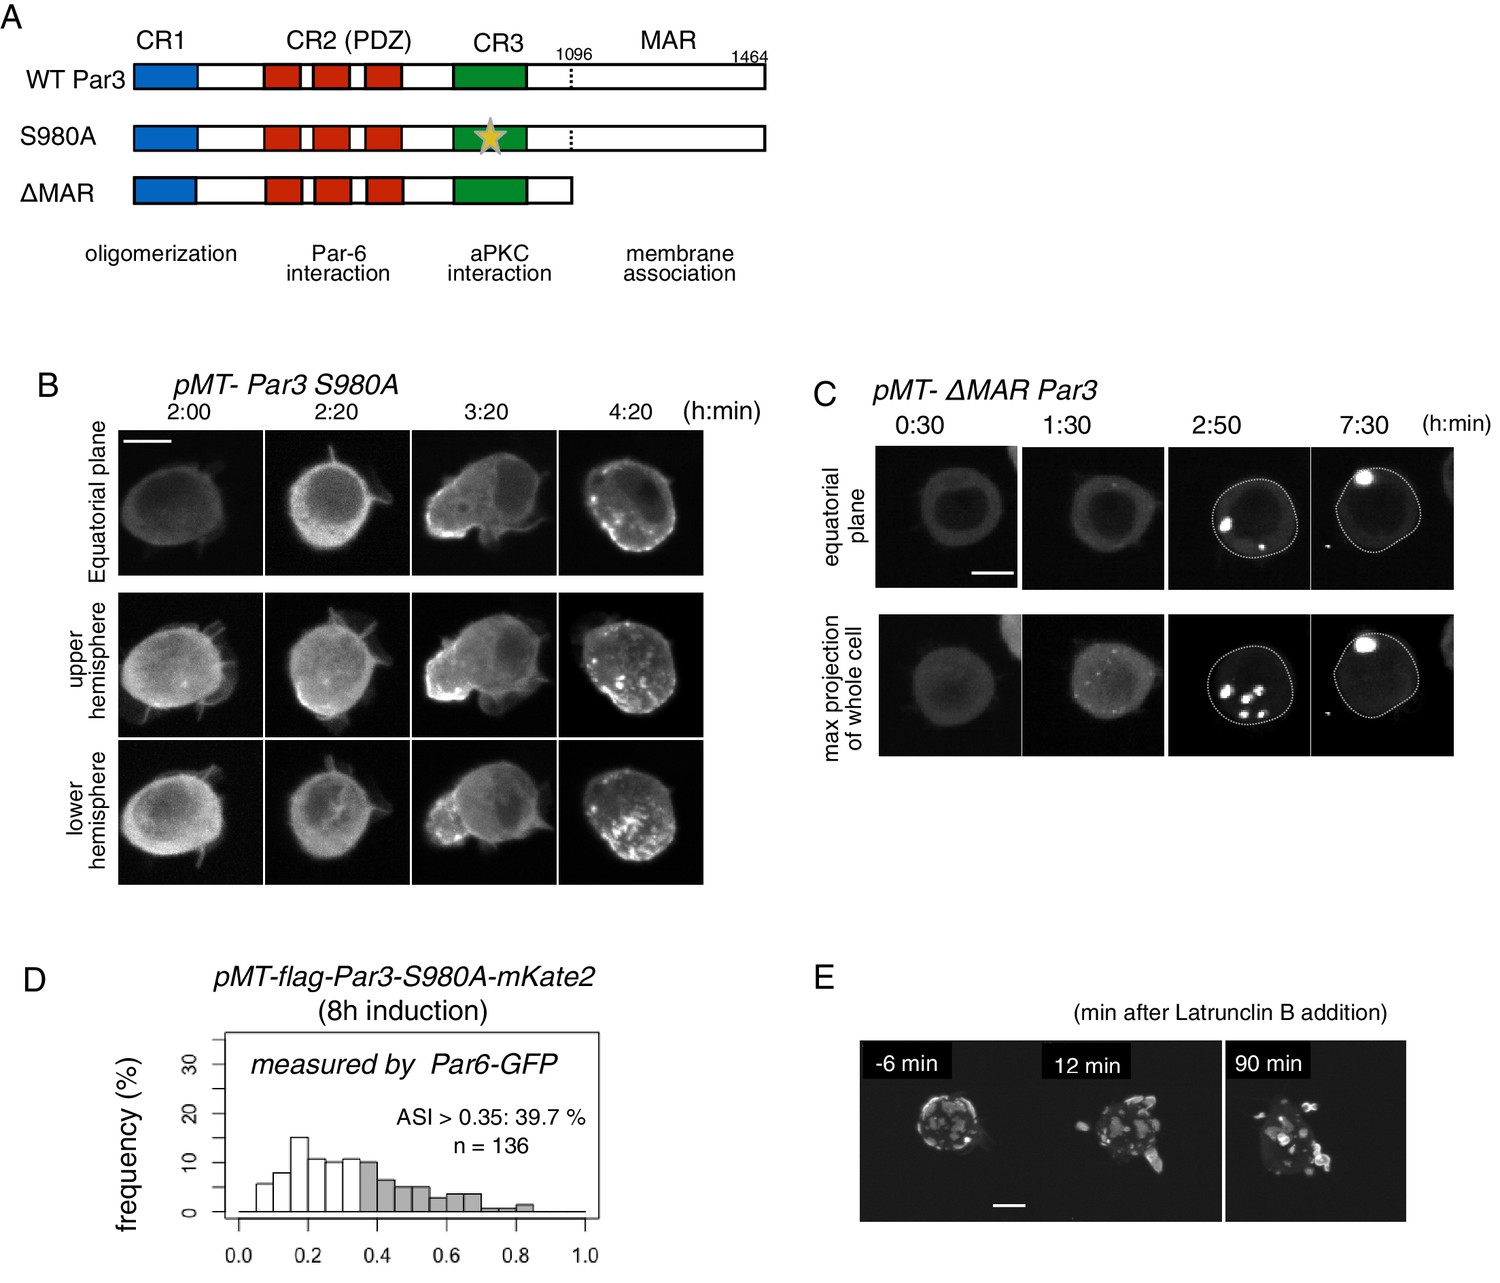
Role of the phosphorylation of Par3 and membrane binding.
(A) Schematic representation of the functional domains of Par3 and S980A and ΔMAR mutant constructs used in this study. (B–C) Time-lapse imaging of the distribution of Par6-GFP in cells where Par3S980A-mKate2 (B) and Par3ΔMAR-mKate2 (C) were induced by the Metallothionein promoter. Time is indicated in h:min after CuSO4 addition. In (B), images at the equatorial plane (top panels), and stacked images of the upper hemisphere (middle panels), and the lower hemisphere (bottom panels) are shown. In (C), the lower panels show maximum-projection images of the whole cell. Scale bar, 5 μm. (D) The distribution of ASI is shown for cells that have induced Par3S980A-mKate2 (F, the mean value = 0.33 ± 0.18 for n = 139 cells). The gray part of histograms indicates the fraction of cells having ASI in the range out of the ASI distribution for memGFP-expressing cells (ASI > 0.35, see Figure 3B, and Figure 6A). Cells in this range are 39.7% for Par3S980A-mKate2 (mean ASI value = 0.52 ± 0.13). The polarized cell population (ASI > 0.35) is significantly altered (p=0.04486 for Par-3S980A-mKate2, Fisher’s exact test with post-hoc Bonferroni correction) compared with that of wild-type myc-Par3-mKate2. Quantification was performed 8 hr after CuSO4 addition. In all images, CuSO4 was added at 2 days post-transfection. (G) Time-lapse imaging of the effects of actin disruption on the Par-islands. At 8 hr after Par3-mKate2 induction, cells were treated with Latrunculin B. Par-islands rapidly became round and/or promoted membrane protrusion. Faint fluorescent islands face the bottom of the dish. See Video 6. Scale bar, 5 μm.
-
Figure 13—source data 1
Source data for the ASI of Par3S980A mutant.
- https://doi.org/10.7554/eLife.45559.034
Videos
Video 1
3D time-lapse movie of a polarized S2 cell monitored by Par6-GFP 2 days after transfection of pAct-Gal4 >UAS-myc-Par3-mKate2, pAct-Par6-GFP, and pAct-aPKC.
Par-islands are clustered with dynamic movements.
Video 2
3D time-lapse movie of a S2 cell monitored by Par6-GFP following induction of myc-Par3-mKate2 from Metallothionein promoter.
Induction started at time 0 by the addition of CuSO4 2 days after transfection of pMT-myc-Par3-mKate2, pAct-Par6-GFP, and pAct-aPKC.
Video 3
3D time-lapse movie of a polarized S2 cell monitored by Par6-GFP at 8 hr induction of myc-Par3-mKate2 with the co-expression of pAct-Par6-GFP and pAct-aPKC.
https://doi.org/10.7554/eLife.45559.017
Video 4
3D movie of a polarized S2 cell stained for myc-Par3-mKate2 and Lgl at 8 hr induction of myc-Par3-mKate2 with the co-expression of pAct-Par6-GFP and pAct-aPKC.
https://doi.org/10.7554/eLife.45559.018
Video 5
3D movie of a nonpolarized S2 cell stained for myc-Par3-mKate2 and Lgl at 8 hr induction of myc-Par3-mKate2 with the co-expression of pAct-Par6-GFP and pAct-aPKC.
A part of the adjacent cell is included in the movie.
Video 6
3D time-lapse movie of a S2 cell monitored by Par6-GFP, 3 min after the addition of Latrunculin B, at 8 hr induction of myc-Par3-mKate2, following 2 days transfection of pMT-myc-Par3-mKate2, pAct-Par6-GFP, and pAct-aPKC.
https://doi.org/10.7554/eLife.45559.035Tables
Key resources table
| Reagent type (species) or resource | Designation | Source or reference | Identifiers | Additional information |
|---|---|---|---|---|
| Genetic reagent (D. melanogaster) | y, w, Baz-GFP | Bloomington Drosophila Stock Center | BDSC:51572; FLYB:FBtc0099880 | FlyBase symbol: P{PTT-GC}baz CC01941 |
| Cell line (D. melanogaster) | S2 | Invitrogen, Thermo Fisher Scientific | Invitrogen:R69007 | |
| Antibody | Rabbit polyclonal anti-aPKC | Santa Cruz | Santa_Cruz:sc-216 | IHC (1:1000) WB (1:3000) |
| Antibody | Mouse monoclonal anti-Par3 | Ohshiro et al. (2000) | IHC (1:100) | |
| Antibody | Rabbit polyclonal anti-Par3 | Ohshiro et al. (2000) | IHC (1:1000) WB (1:3000) | |
| Antibody | Rabbit polyclonal anti-Par6 | Izumi et al. (2004) | IHC (1:1000) | |
| Antibody | Chicken polyclonal anti-Myc | Bethyl | Bethyl:A190-103A | IHC (1:1000) |
| Antibody | Mouse monoclonal anti-Miranda | Ohshiro et al. (2000) | IHC (1:100) | |
| Antibody | Rabbit polyclonal anti-Lgl | Ohshiro et al. (2000) | IHC (1:1000) WB (1:1000) | |
| Antibody | Guinea pig polyclonal anti-Cdc42 | Ulrich Tepass (University of Tronto) | IHC (1:100) | |
| Antibody | Chicken polyclonal anti-GFP | aves | aves:GFP-1020 | IHC (1:1000) |
| Antibody | Mouse monoclonal anti-GFP | chemicon | chemicon:MAB3580 | IHC (1:1000) |
| Antibody | Rabbit polyclonal anti-GFP | MBL | MBL:598 | IHC for Larva brain (1:1000) WB (1:2000) |
| Antibody | Mouse monoclonal anti-Flag | Sigma | Sigma:F3165 | IHC (1:1000) |
| Antibody | Alexa 488, Cyanin3, Cyanin5 secondaries | Jackson Immuno Research | IHC for S2 cells (1:4000) IHC for Larva brain (1:200) | |
| Antibody | anti-alpha tubulin | sigma | Sigma:T9026 | WB (1:15000) |
| Chemical compound, drug | Latrunclin B | Wako | Wako:129–05101 | final concentration, 1 µM |
| Chemical compound, drug | CuSO4 | Wako | Wako:034–04445 | final concentration, 1 mM |
| Recombinant DNA reagent | pMT/V5-His B (Gateway vector) | Invitrogen, Thermo Fisher Scientific | Invitrogen:V412020 | |
| Recombinant DNA reagent | pAc5.1/V5-His B (Gateway vector) | Invitrogen, Thermo Fisher Scientific | Invitrogen:V411020 | |
| Recombinant DNA reagent | pAc-Gal4 (Gateway vector) | Addgene | Addgene:24344 | provided from Liqun Luo (Stanford University) |
| Recombinant DNA reagent | pDAMCS (Gateway vector) | this paper | Progenitors: pAct5C0 plasmids (BglII-XhoI fragment); Gateway vector pUC19 | |
| Recombinant DNA reagent | pUAST | Brand and Perrimon (1993) | ||
| Recombinant DNA reagent | Par6-GFP (plasmid) | this paper | Progenitors: Par6 and GFP (cDNA); Gateway vector pAc5.1/V5-His B | |
| Recombinant DNA reagent | aPKC-GFP (plasmid) | this paper | Progenitors: aPKC and GFP (cDNA); Gateway vector pAc5.1/V5-His B | |
| Recombinant DNA reagent | myc-Par3-mKate2 (plasmid) | this paper | Progenitors: Par3 and mKate2 (cDNA); Gateway vector pMT/V5-His B, pAc-Gal4 or pDAMCS | |
| Recombinant DNA reagent | myc-Par3-GFP (plasmid) | this paper | Progenitors: Par3 and GFP (cDNA); Gateway vector pMT/V5-His B, pAc-Gal4 or pDAMCS | |
| Recombinant DNA reagent | membrane-GFP | this paper | Progenitors: myristoylation tag from Fyn and GFP (cDNA); Gateway vector pAc5.1/V5-His B | |
| Software, algorithm | Huygens Professional | Scientific Volume Imaging | ver. 17.10 | |
| Other | DAPI | nacalai tesque | nacalai_tesque: 11034–56 | IHC for S2 cells (1:4000) IHC for Larva brain (1:200) |
Additional files
-
Transparent reporting form
- https://doi.org/10.7554/eLife.45559.036
Download links
A two-part list of links to download the article, or parts of the article, in various formats.
Downloads (link to download the article as PDF)
Open citations (links to open the citations from this article in various online reference manager services)
Cite this article (links to download the citations from this article in formats compatible with various reference manager tools)
Reconstruction of Par-dependent polarity in apolar cells reveals a dynamic process of cortical polarization
eLife 8:e45559.
https://doi.org/10.7554/eLife.45559


