A virtual burrow assay for head–fixed mice measures habituation, discrimination, exploration and avoidance without training
- Howard Hughes Medical Institute, Columbia University, United States
Figures
Figure 1 with 4 supplements
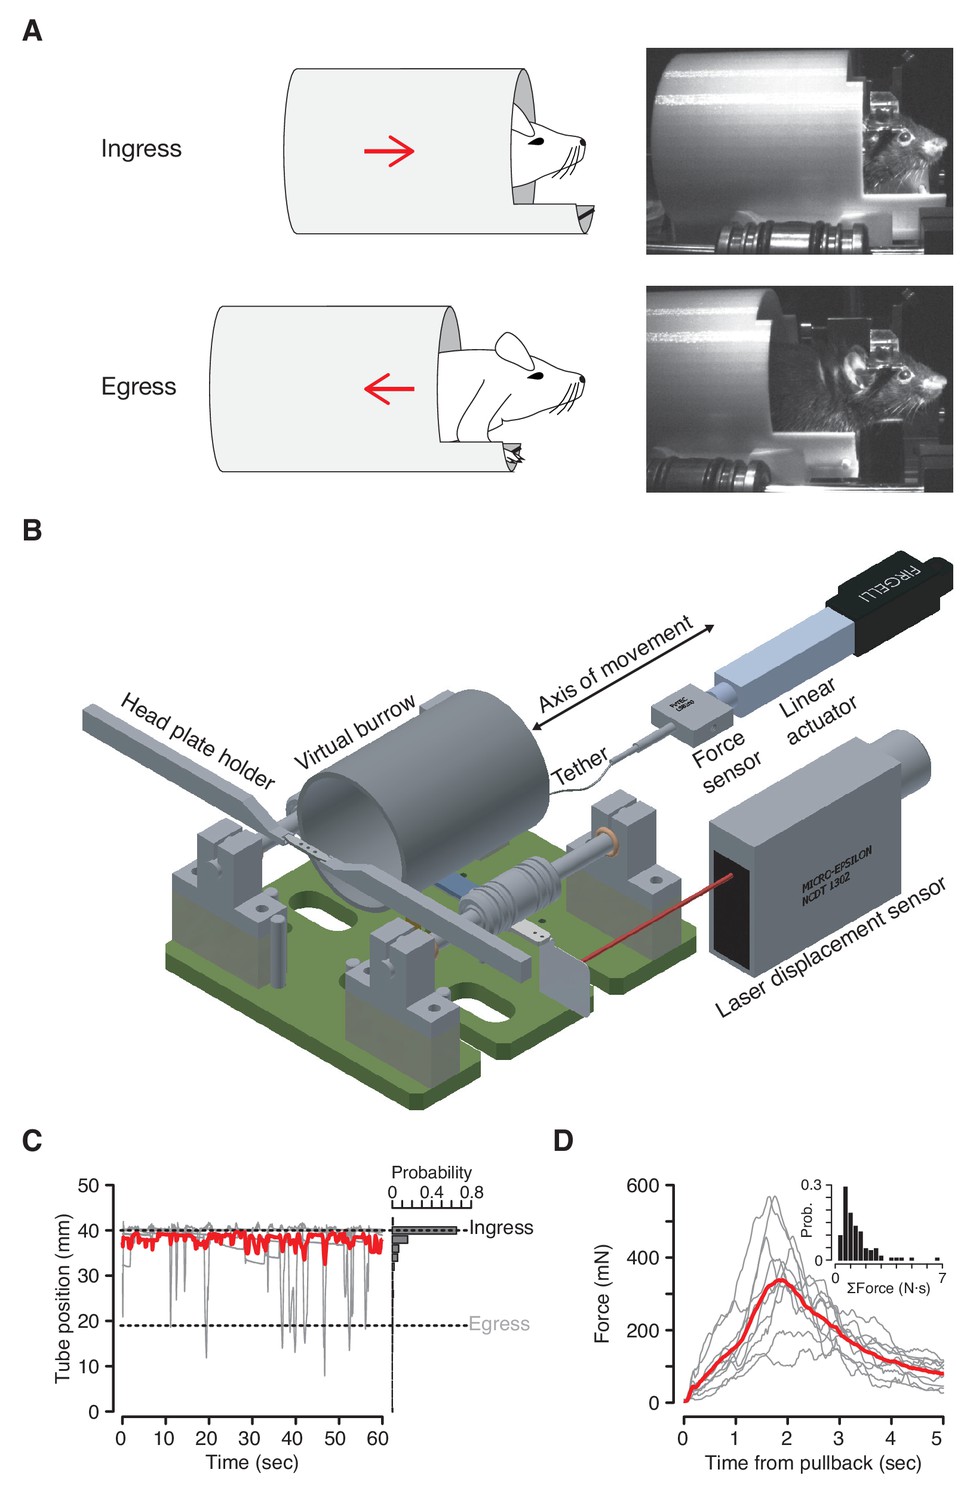
The Virtual Burrow Assay.
(A) Left; diagram of ingress (top) and egress (bottom). Right, photograph of mouse in ingress position (top) and egress position (bottom). (B) Instrument diagram. The mouse’s head is fixed by a headplate holder while it stands inside a virtual burrow. The burrow’s movement is constrained to the animal’s anterior-posterior axis by a pair of near-frictionless air bearings. A linear actuator can retract the burrow, pulling the animal out of the enclosure. A laser displacement sensor measures burrow position and a force sensor measures any resistance the animal exerts against the tether. (Rendering courtesy of T. Tabachnik, Advanced Instrumentation, Zuckerman Mind Brain Behavior Institute). (C) Tube position during 60 s of open loop mode. Gray, individual animals; red, mean across N = 10 mice. For visual clarity only five randomly selected individual (gray) traces are shown. Dashed lines indicate ingress and egress positions. Histogram at right shows distribution of tube position during the same epoch across all animals. (D) Force (in millinewtons) generated during first 5 s after pullback to egress position for N = 10 mice (gray traces, mean force generated across all pull-backs for each individual animal; red trace, mean across all animals). Inset: distribution of total force exerted each time the animals were pulled back. Force was integrated after each pullback until the animal ceased resisting and the tether was slackened.
Figure 1—figure supplement 1
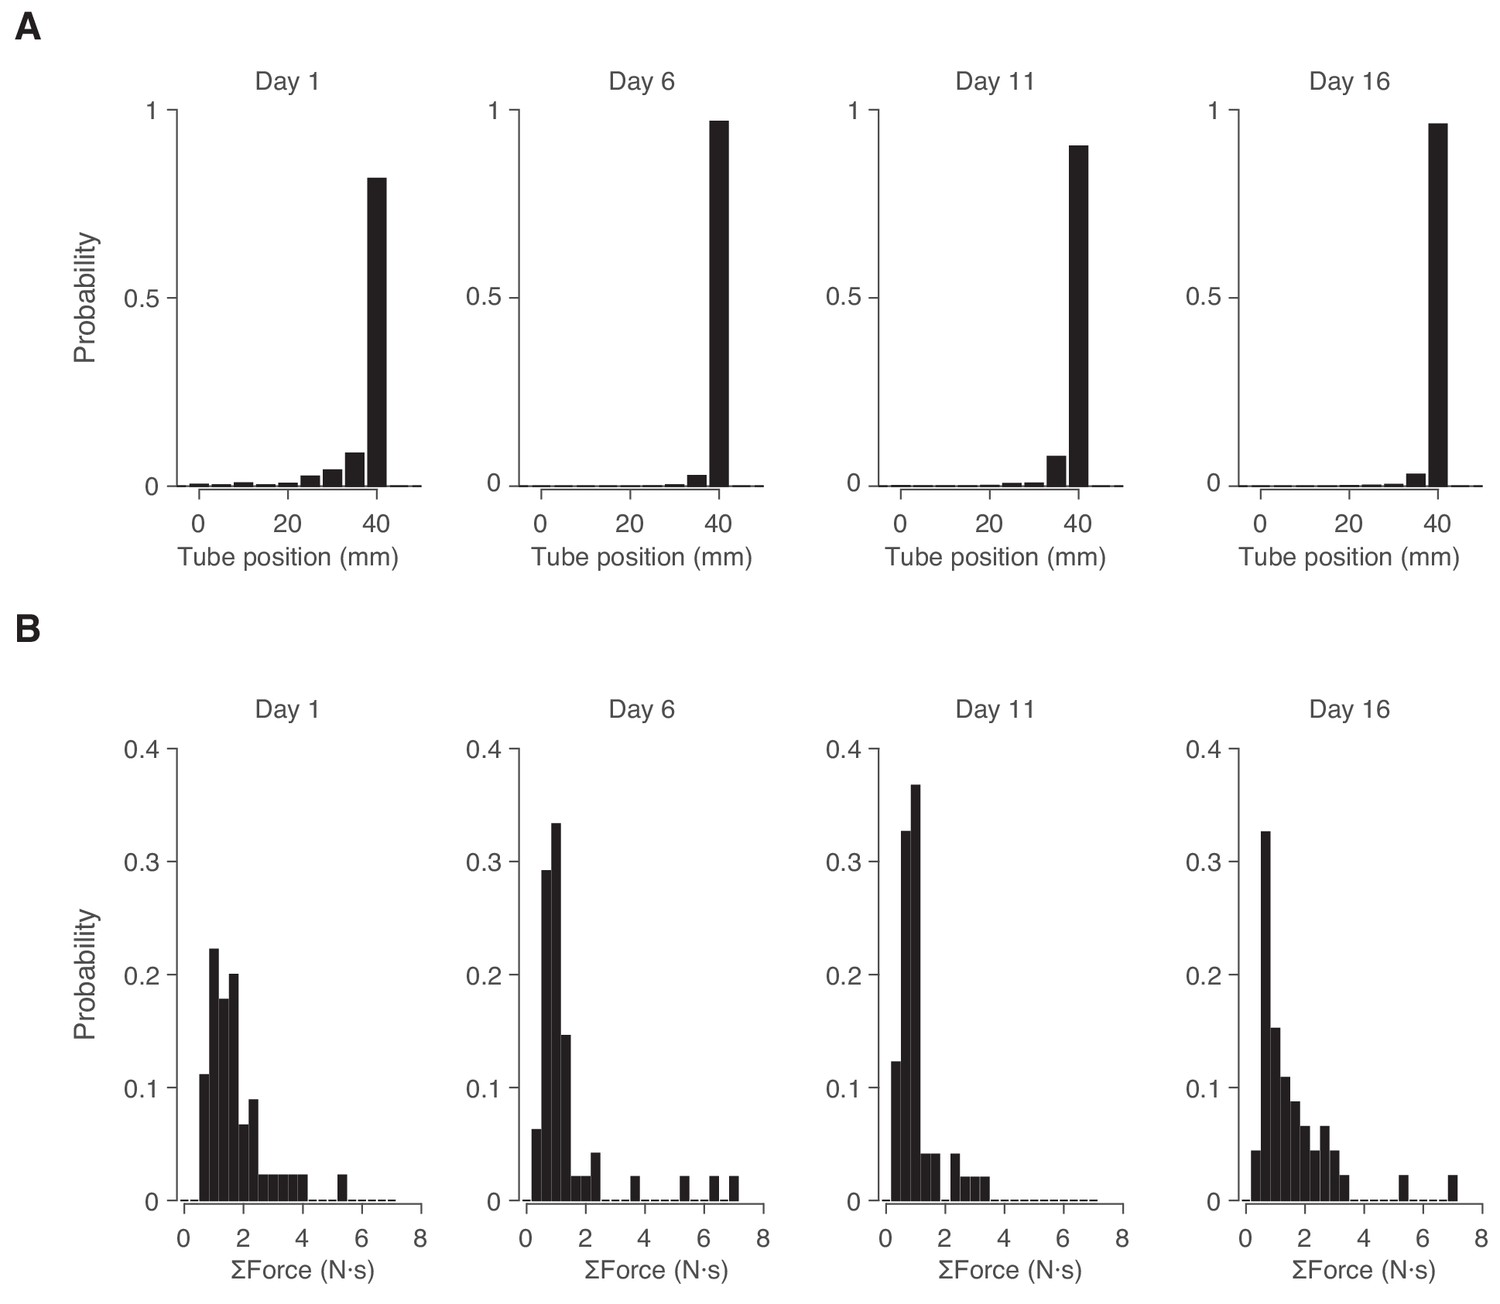
Persistence of stereotyped behavior across multiple days.
(A) Distribution of tube position during open loop mode on four separate days over a 16 day interval for the same cohort of N = 5 mice. We used a Wilcoxon rank-sum test to evaluate whether burrow position differed significantly across all pair-wise combination of days, and failed to find statistical significance at α = 0.05. (B) Distribution of total force exerted each time the animals were pulled back on each of the four days. We used a Wilcoxon rank-sum test to evaluate whether force differed significantly across all pair-wise combination of days, and failed to find statistical significance at α = 0.05.
Figure 1—figure supplement 2
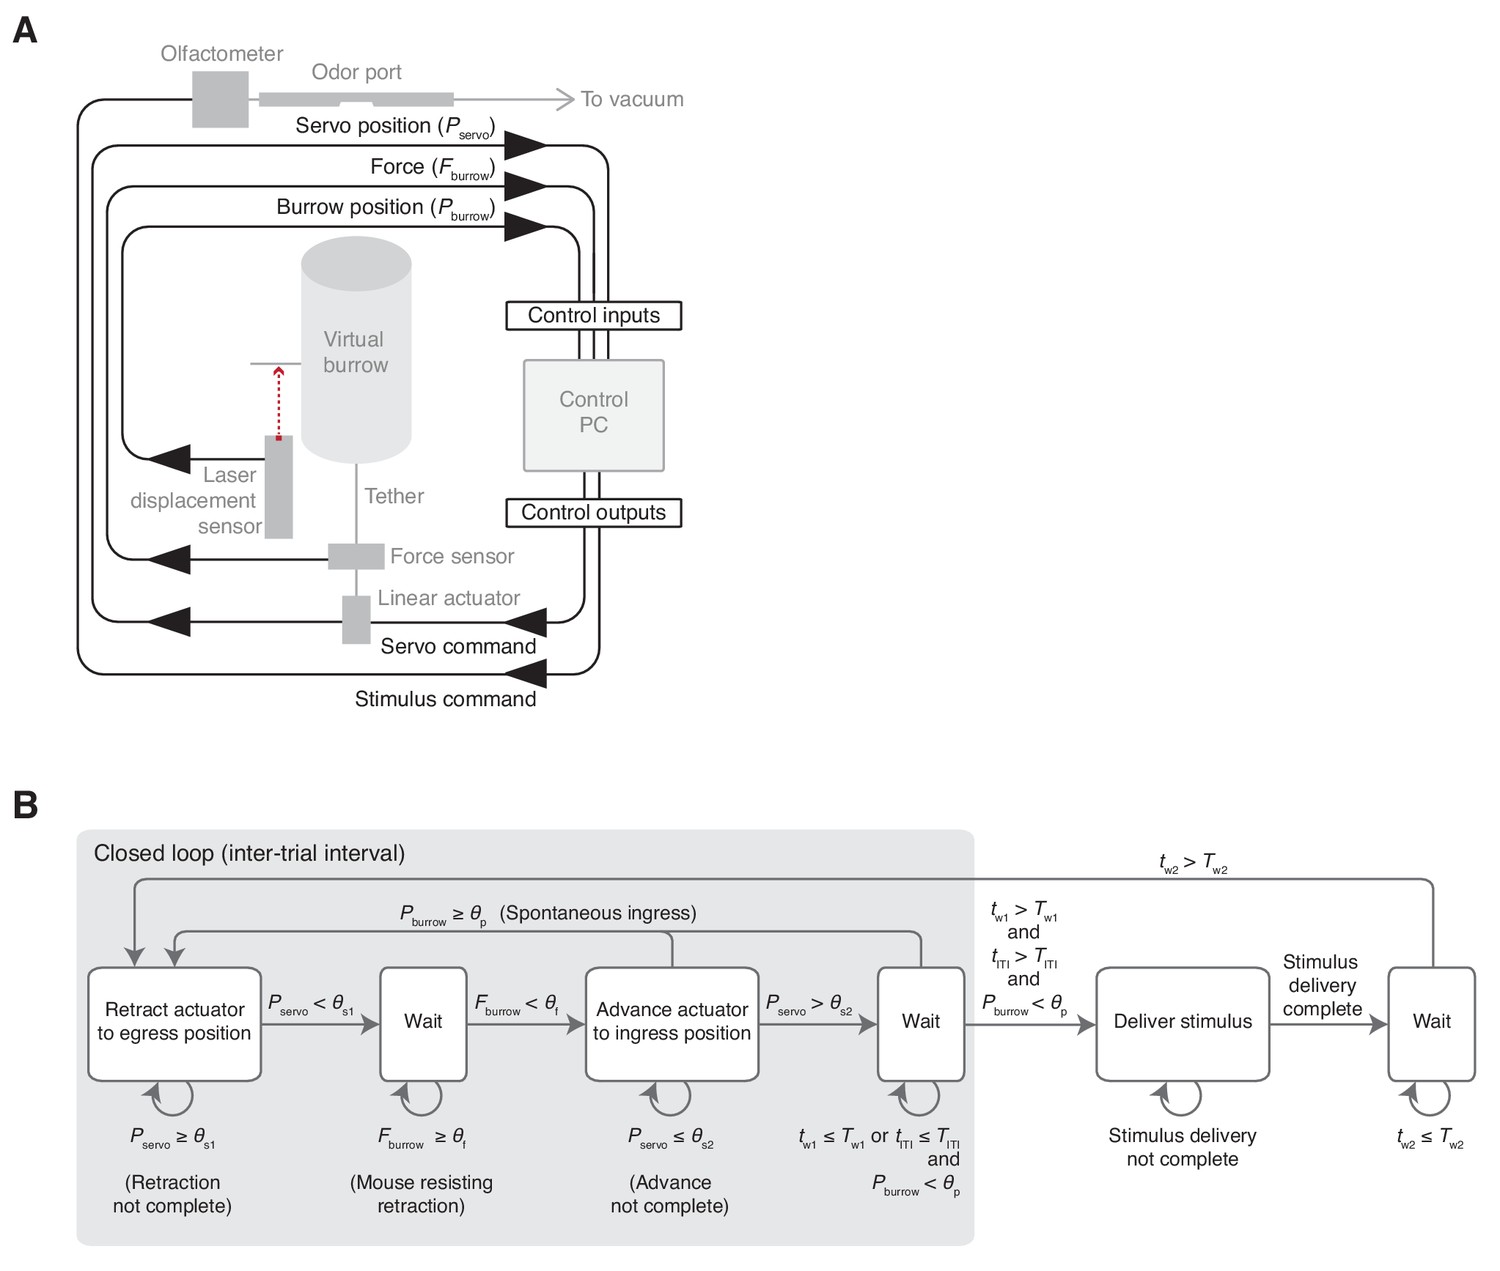
Schematic and flow diagram.
(A) Schematic of the virtual burrow control system. Control inputs and outputs, black. Devices, gray. (B) Finite state machine diagram. During the intertrial interval (ITI), a linear actuator retracts the burrow to the egress position (‘Retract actuator to egress position’). The retraction is complete once the position of the servo motor (Pservo) is less than the specified retraction position (θs1). As long as the force against the tether (Fburrow) is greater than or equal to a preset threshold (θf), the linear actuator remains in the retracted position (‘Wait’). Once Fburrow < θf, the linear actuator advances to the ingress position (‘Advance actuator to ingress position’), slackening the tether and freeing the animal to ingress. Once Pservo reaches the slackened position (θs2), the system waits (‘Wait’). If at any point the position of the burrow (Pburrow) exceeds a specified threshold (θp), the burrow is again retracted and the system returns to the initial state. If, however, the animal remains in the egress position and Pburrow < θp for a duration (tITI) exceeding both the ITI (TITI) and an enforced delay (Tw1) following advance of the linear actuator to the ingress position (tw1), then the ITI concludes and a stimulus is delivered (‘Deliver stimulus’). Throughout the period of stimulus delivery, the linear actuator remains in the advanced position, leaving the animal in complete control of burrow position. Following stimulus delivery (tw2), once a second delay period (Tw2) has elapsed, the system returns to the initial state and the linear actuator retracts the burrow. See Figure 1—video 2 for an example of operation in closed loop mode.
Figure 1—video 1
Spontaneous behavior of a mouse in the Virtual Burrow Assay.
Video recorded immediately following the mouse’s first introduction into the Virtual Burrow Assay.
Figure 1—video 2
Burrow pulled to egress position.
Left: video of the same mouse shown in Figure 1—video 1 taken approximately two minutes later during the first instances in which it was pulled out to the egress position when the command software was switched to closed loop mode. Right: simultaneous visualization of key behavioral variables in the control software’s graphical user interface. Middle panel depicts burrow position (Pburrow) in blue, threshold (θp) in green, and servo position (Pservo) in red; bottom panel depicts the force the animal exerts on the tether (Fburrow) and threshold (θf). See panel B of Figure Supplement 1 to Figure 1 for details.
Figure 2 with 1 supplement
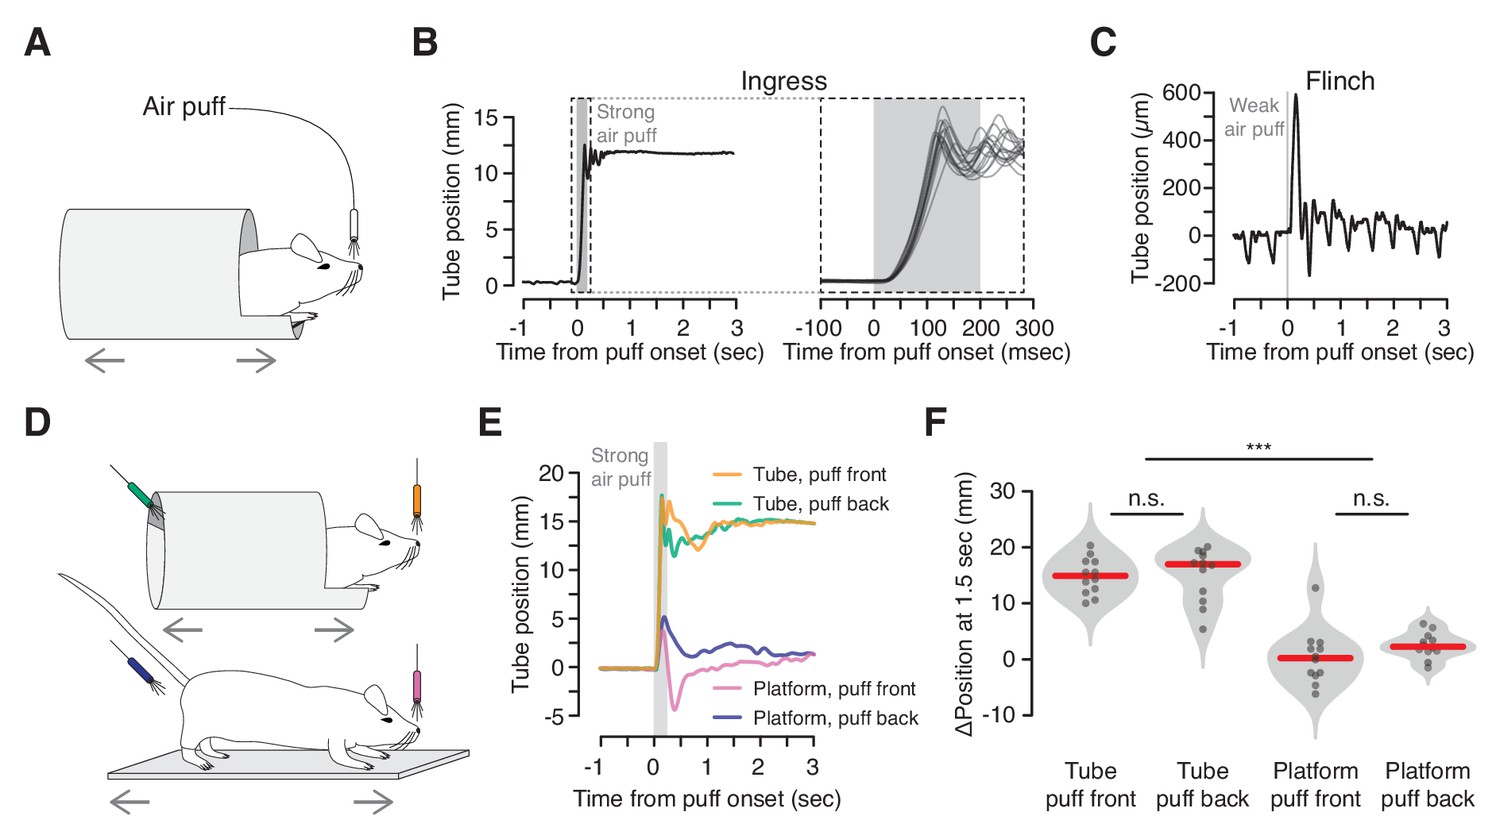
Reliable, short-latency ingress to noxious air puff.
(A) Diagram of experimental set up. The mouse is head-fixed in the virtual burrow and an air puff is delivered to the nose. (B) Left, burrow position over time showing a single ingress in response to a strong air puff (gray box, 200 msec, 80 psi). Upward deflections correspond to burrow movement towards the animal’s head (ingress). Right, 15 ingress responses from a single animal to 15 air puffs. Dashed box at left demarcates epoch in which time scale is expanded at right. (C) Example of flinch in response to weak air puff. Downward going, approximately 2 Hz oscillations correspond to the animal’s breathing cycle. Upward going low-amplitude, transient deflection corresponds to startle in response to air puff (gray box, 20 msec, 2 psi). (D) Diagram of tube (top) and platform (bottom) variants. Air puffs are directed either at the snout (top, orange and bottom, pink) or at the hindquarters (top, green and bottom, blue). (E) Mean change in burrow position in response to air puff (gray box) across all animals and all trials (N = 4 animals, three trials each, per condition); same color scheme as in previous panel. (F) Change in burrow position at T = 1.5 s relative to pre-stimulus epoch, pooled across animals and trials. A Wilcoxon rank-sum test was employed to evaluate whether the change in burrow position differed significantly (p(tube-front,tube-back)=0.71, p(tube-front,platform-front)=9.7×10−05, p(tube-front,platform-back)=3.7×10−05, p(tube-back,platform-front)=9.7×10−05, p(tube-back,platform-back)=6.0×10−05, p(platform-front,platform-back)=0.078, N = 4 mice, three trials each, per condition). Individual trials, gray points. Normalized, smoothed histogram, light gray shading. Median, red line. *** indicates p<0.001, n.s. indicates p≥0.05.
Figure 2—video 1
Ingress in response to strong air puff.
White square: stimulus epoch (250 msec, 80 psi, 2 mm distance from the snout).
Figure 3 with 1 supplement
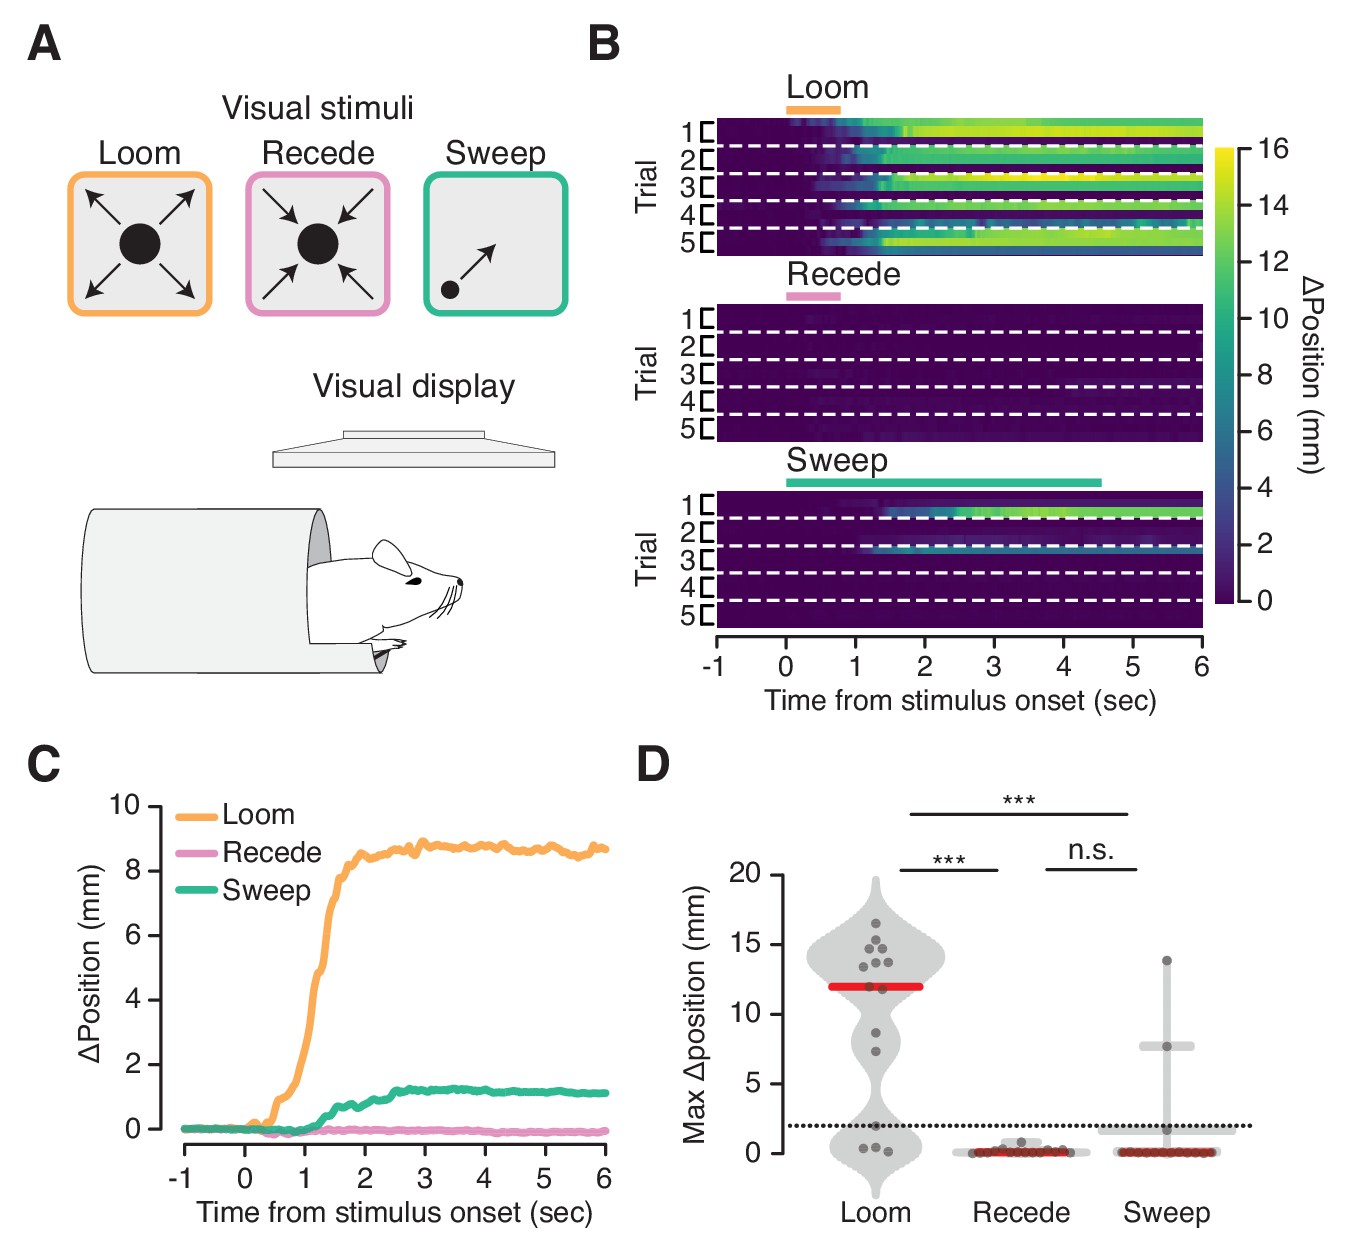
Flight-inducing visual stimuli selectively elicit ingress.
(A) An expanding black disk (left, orange), a contracting black disk (middle, pink), and a sweeping black disk of constant size (right, green), were presented on a visual display positioned directly over a mouse head-fixed in the virtual burrow (bottom). (B) Responses of all mice on all trials to three visual stimuli (three mice per condition, five trials each) ordered by mouse within each trial: Expanding (‘Loom’), disk widening from 2° to 50° over 250 msec, holding the 50° disk for 500 msec; Contracting (‘Recede’), disk diminishing from 50° to 2° over 250 msec, holding the 2° disk for 500 msec; Sweeping (‘Sweep’), 5° disk sweeping smoothly across the diagonal of the screen at a rate of 21°/sec. Color map corresponds to change in burrow position with respect to baseline. Dashed lines separate trials. (C) Mean change in burrow position per condition across all animals and all trials. (D) Maximum change in burrow position in the 6 s following stimulus onset per condition across all animals and all trials. Ingress was defined as a maximum displacement of the burrow relative to the pre-stimulus baseline position >2 mm, indicated by the dashed line. The likelihood of ingress was 0.73, 0.00 and 0.13 for loom, recede, and sweep, respectively. Individual trials, gray points. Normalized, smoothed histogram, light gray shading. Median, red line. A two-proportion z-test pooled across all mice (N = 3) was employed to evaluate whether the probability of ingress differs significantly across stimulus conditions. p(loom,recede)=1.5×10−05, p(loom,sweep)=4.6×10−04, p(recede,sweep)=0.072. *** indicates p<0.001, n.s. indicates p≥0.05.
Figure 3—video 1
Ingress in response to visual looming stimulus.
Top left panel: visual stimulus presented on a screen positioned above the animal’s head (see diagram in Figure 3A); bottom panel: video of a mouse head-fixed in the VBA; top right panel: position of the virtual burrow measured by a laser displacement sensor (gray rectangle indicates the stimulus epoch). The videos in the three panels are approximately synchronous.
Figure 4 with 1 supplement
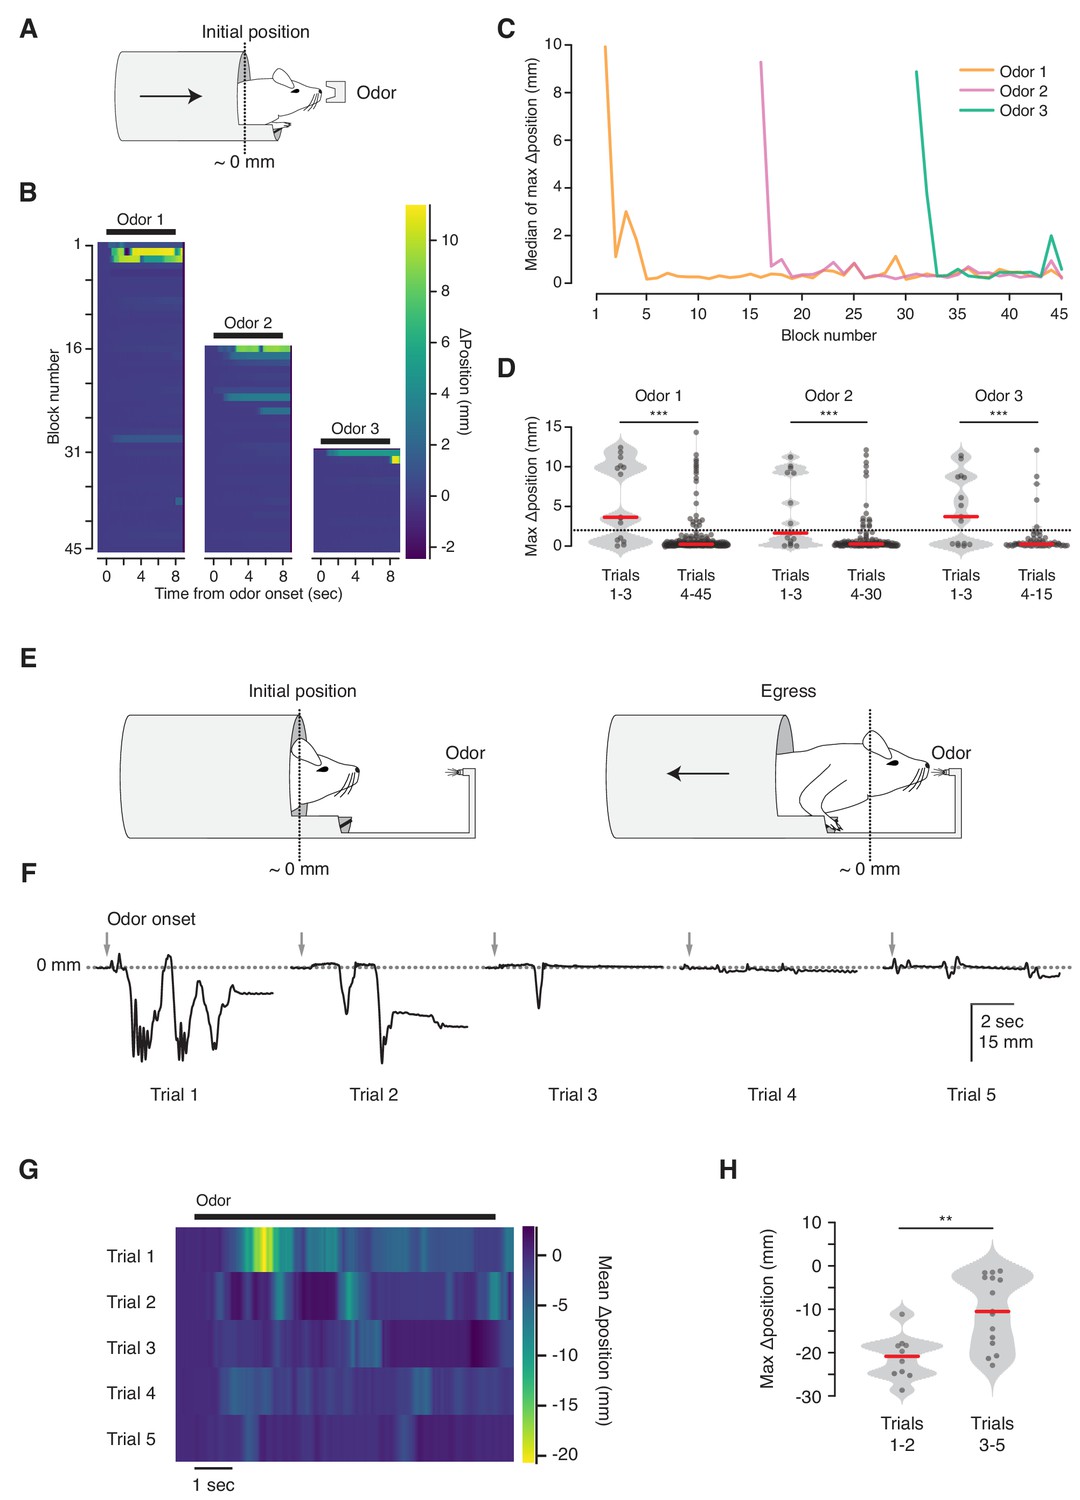
Habituation to unanticipated stimuli.
(A) Three odorant stimuli were delivered to mice in the virtual burrow assay. (B) Habituating responses to repeated presentation of odorant stimuli from a representative mouse. Color map corresponds to change in burrow position with respect to baseline. Black lines indicate odorant stimulus epoch (8 s duration). (C) Median value across mice (N = 5) of maximum change in burrow position, per odor condition, per block. (D) Maximum change in burrow position for each odorant during the first three trials (left) and all later trials (right), pooled across animals. Individual trials, gray points. Normalized, smoothed histogram, light gray shading. Median, red line. A two-proportion z-test on ingress probability pooled across all mice (N = 5) was employed to evaluate whether the probability of ingress differed significantly between the first three presentations of each odorant stimulus and all subsequent presentations of that odorant; ingress defined as maximum displacement >2 mm during the 8 s stimulus epoch, indicated by the dashed line. p(Odor1 trials 1–3, Odor1 trials 4–45)=8.8×10⁻¹⁰, p(Odor2 trials 1–3, Odor2 trials 4–30)=1.9×10−04, p(Odor3 trials 1–3, Odor3 trials 4–15)=2.2×10−06. *** indicates p<0.001. (E) Diagram of the odor port coupled to the virtual burrow; the mouse is required to egress in order to draw the odor source closer to its nose. (F) Habituating response of a representative mouse to repeated presentations of an odorant stimulus. Downward-going traces correspond to egress. Gray arrows indicate odorant stimulus onset (8 s duration). (G) Average response of all mice tested (N = 5) per trial. Color map as above, except that warmer colors depict egress rather than ingress. Note that, as above, 0 mm corresponds to the virtual burrow’s position prior to stimulus presentation; however in these experiments the animals began each trial in the ingress position rather than in the egress position. (H) Maximum change in burrow position during the first two trials (left) and the subsequent three trials (right), pooled across animals. A Wilcoxon rank-sum test was employed to evaluate whether the maximum change in burrow position differed significantly (p(trials1-2,trials3-5)=0.0021, N = 5 mice). Individual trials, gray points. Normalized, smoothed histogram, light gray shading. Median, red line. ** indicates p<0.01.
Figure 4—video 1
Egress in response to unanticipated odorant stimulus.
Responses to the first two presentations of an odorant stimulus. White square: stimulus epoch (8 s).
Figure 5 with 2 supplements
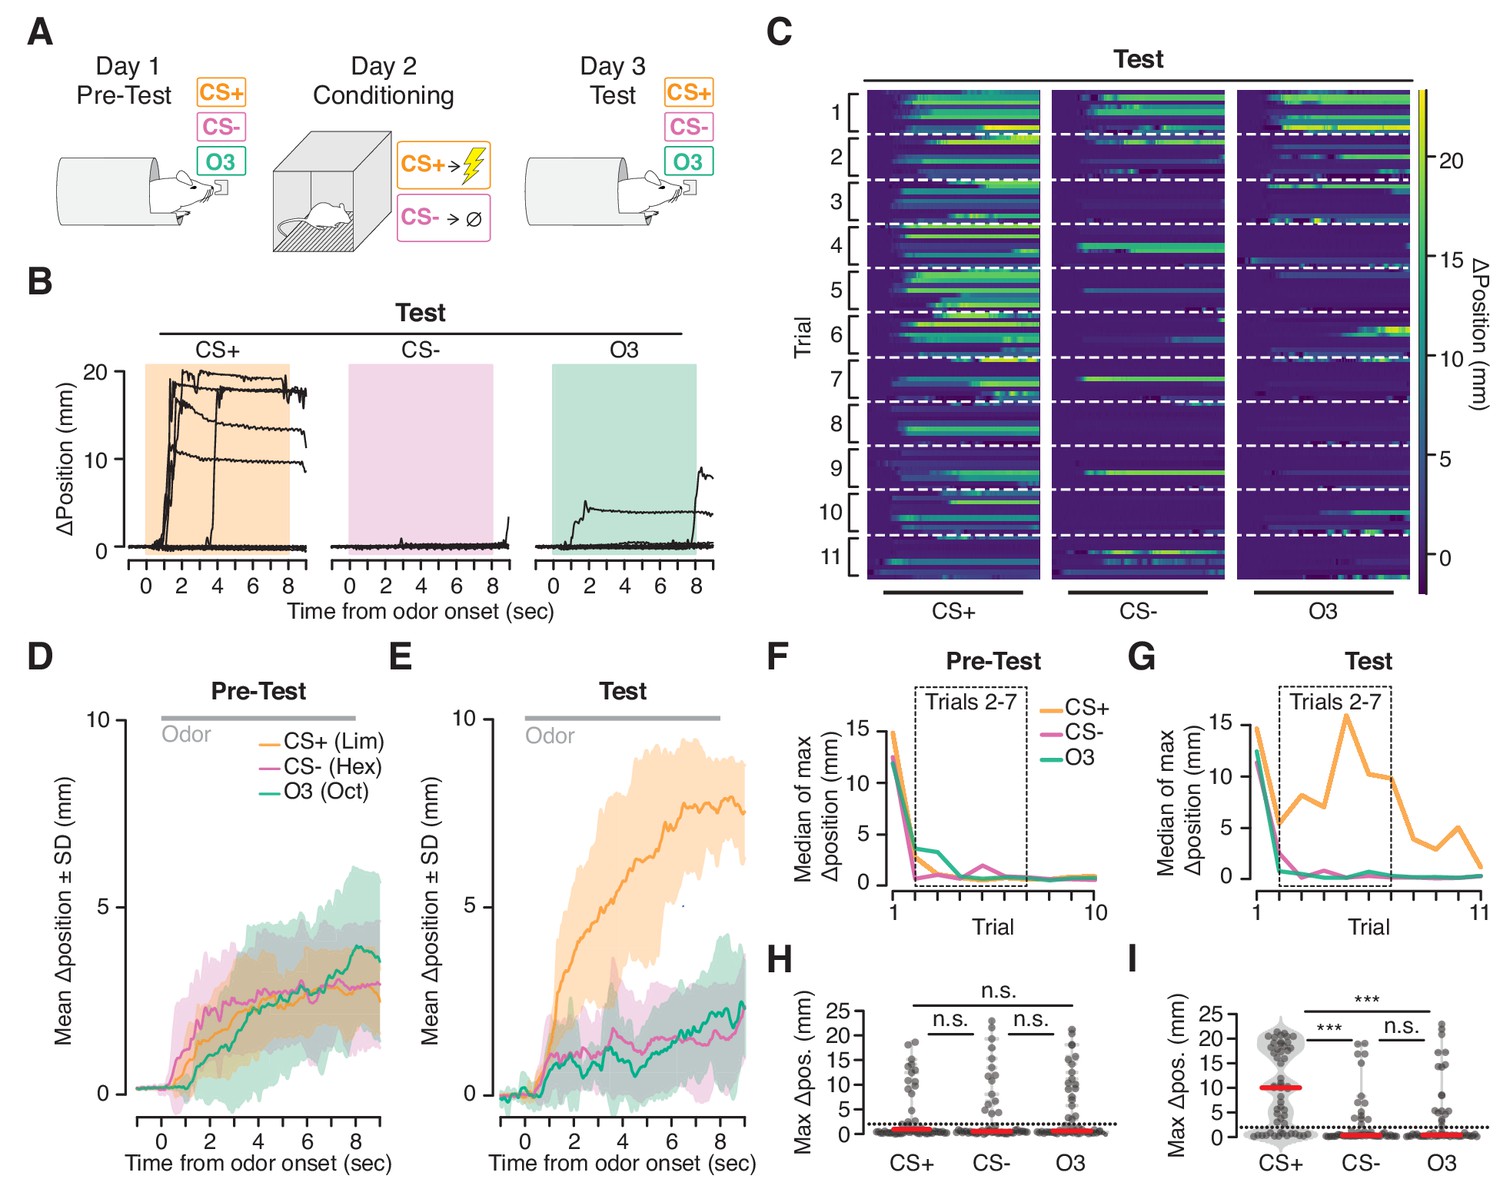
Ingress in response to aversively conditioned odorant stimuli.
(A) Three odorant stimuli were presented to mice head fixed in the VBA on day 1 (Pre-test) and day 3 (Test). On day 2 (Conditioning), animals were placed in a fear conditioning chamber and two of the odorant stimuli were presented: a CS +odorant, paired with shock, and a CS- odorant, never paired with shock. A third odorant Odor3 (O3) was presented on days 1 and 3 but not during conditioning on day 2. (B) Change in burrow position relative to pre-stimulus baseline on individual trials after odor-shock conditioning from a representative mouse. Colored box demarcates odorant stimulus epoch. CS+: paired with shock; CS-: presented in chamber without shock; Odor3: not presented in fear conditioning chamber. (C) Test responses of all mice on all trials to the three stimuli, ordered by mouse within each trial. Lines at bottom indicates odorant stimulus epoch (8 s duration). D, E. Mean change in burrow position during Pre-test (D) and Test (E) relative to pre-stimulus baseline per odor condition during trials 2–7 (shading indicates ±1 standard deviation, N = 9 mice). Gray line at top corresponds to odorant stimulus epoch. F, G. Median value across mice of maximum change in burrow position, per odorant condition, per trial during Pre-test (F) and Test (G). Dashed boxes demarcate trials 2–7, used to compute mean responses in D and E, and to perform statistical tests in H and I. H, I. Maximum change in burrow position during the odorant stimulus, per condition across all animals on trials 2 through seven during Pre-test (H) and Test (I). Individual trials, gray points. Normalized, smoothed histogram, light gray shading. Median, red line. The probability of ingress for each odorant stimulus during Test was 0.72 for CS+, 0.26 for CS-, and 0.33 for Odor3. A two-proportion z-test on ingress probability on trials 2–7 (6 trials per mouse, pooled across N = 9 mice) was employed to evaluate whether the probability of ingress differed significantly; statistical analysis was restricted to trials 2–7 to mitigate the effects of recovery observed on the first trial and extinction observed on the last four trials; ingress defined as maximum displacement >2 mm during the 8 s stimulus. p(CS+,CS-)=1.0×10−05, p(CS+,O3)=5.0×10−05, p(CS-,O3)=0.35. Ingress threshold indicated by the dashed line; *** indicates p<0.001, n.s. indicates p>0.05. This result is robust to the choice of ingress threshold over a range of 0.5 to 10 mm (Figure 5—figure supplement 2).
Figure 5—figure supplement 1
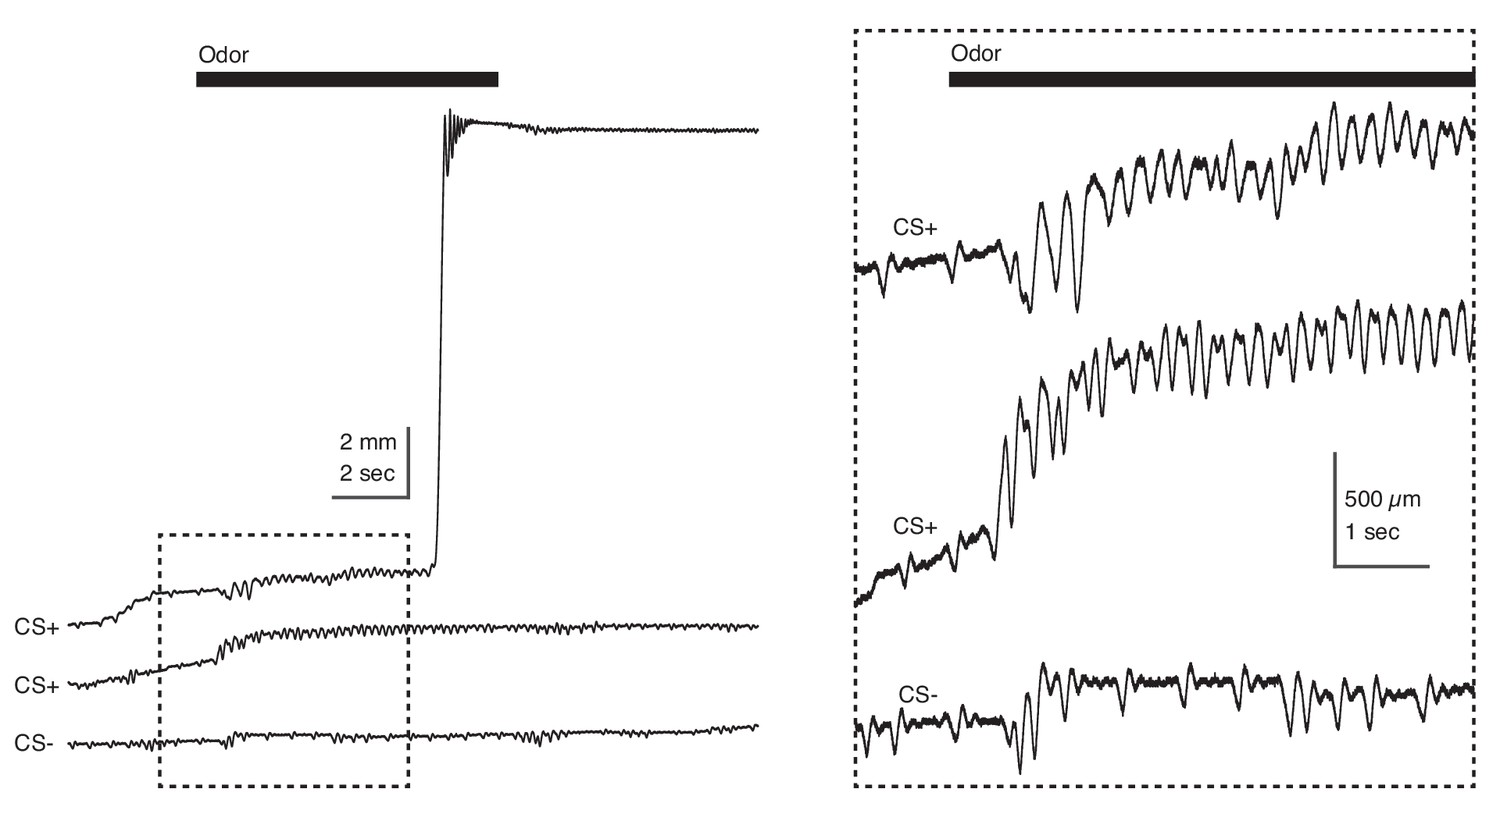
Trembling in response to aversively conditioned odorant stimuli.
Tube position during three individual trials recorded during Test in response to CS + and CS-. Odorant stimulus epoch denoted by the black bar (top); dashed box at left demarcates epoch in which time scale is expanded at right. High frequency and amplitude oscillation is observed during presentation of the CS+ (top, middle) but not the CS- (bottom).
Figure 5—figure supplement 2
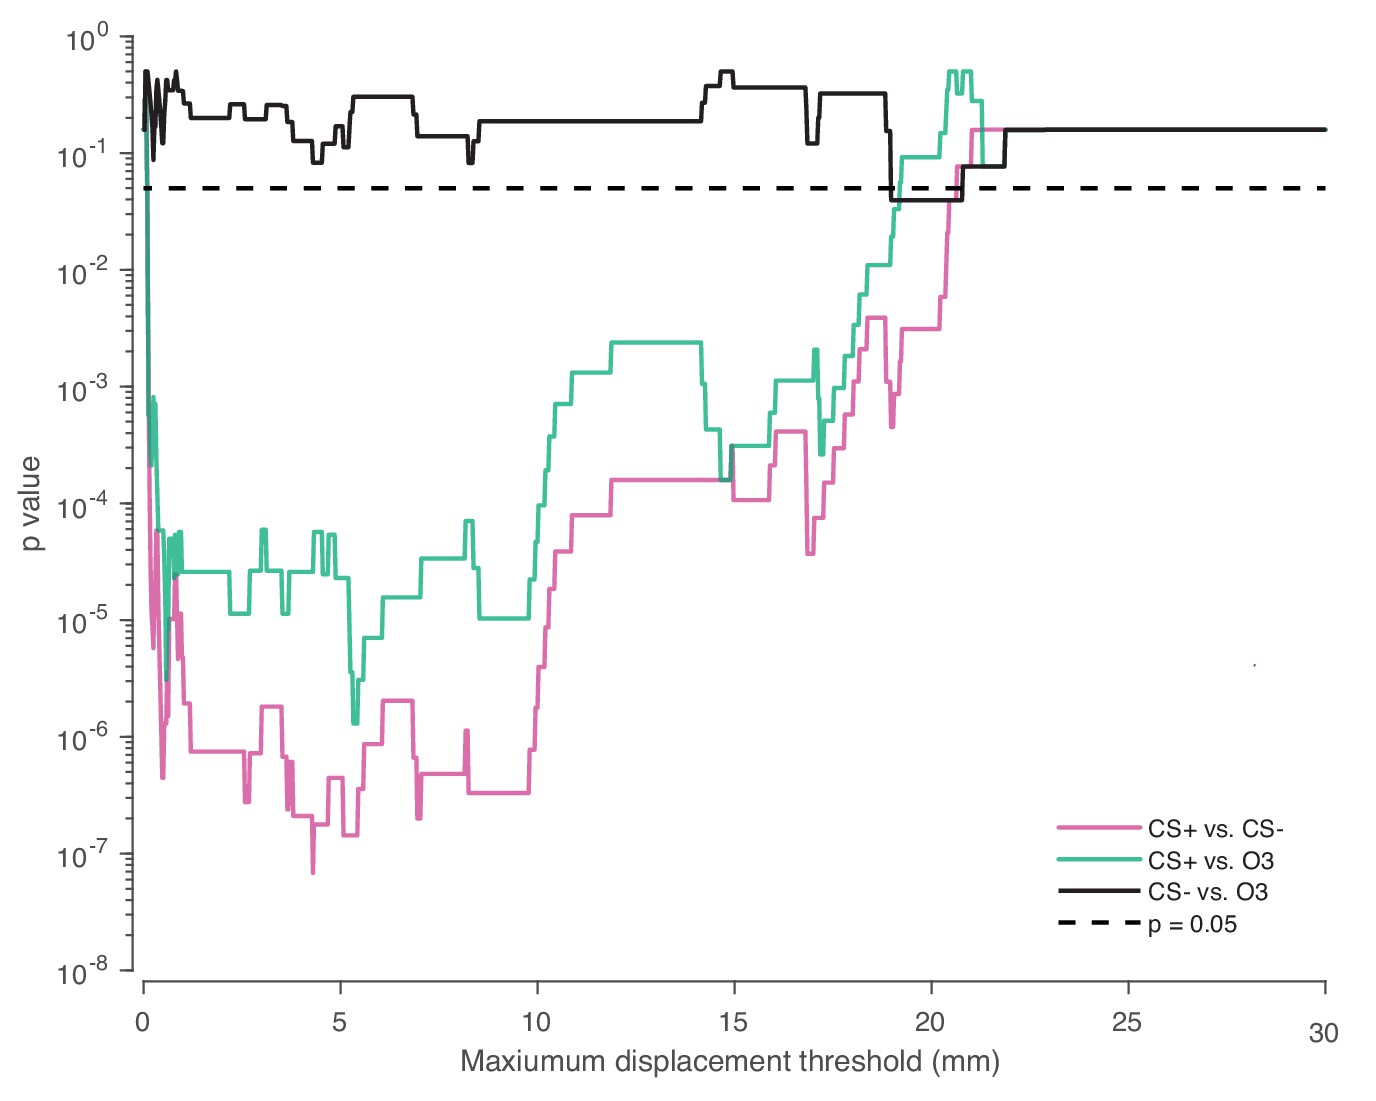
Robustness of statistical test to choice of ingress threshold.
Effect of maximum displacement threshold on the two-proportion z-test p value for the pooled test data (nine mice, six trials per mouse). Dashed line indicates p=0.05.
Figure 6
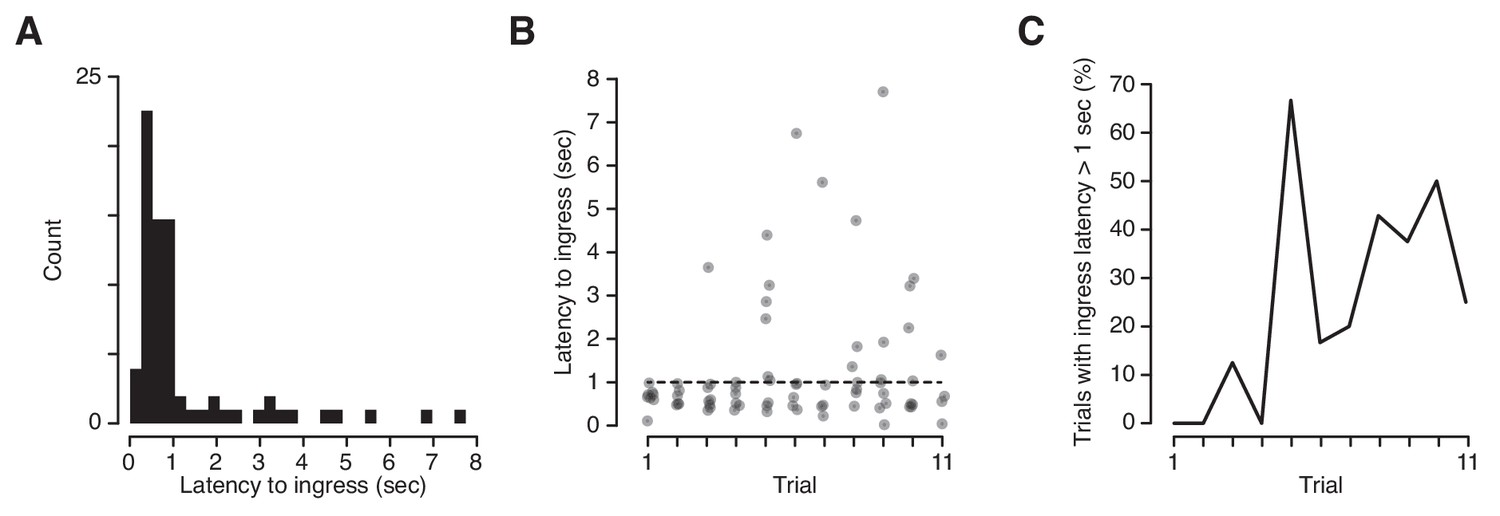
Latency of ingress to aversively conditioned odorant stimuli.
(A) Distribution of ingress onset latency during CS+ trials for all mice. Ingress onset defined as the first sample in which displacement exceeded 0.75 mm following stimulus onset. (B) Ingress onset latency for all mice as a function of trial number. Dashed line indicates threshold for high latency ingresses (1 s). (C) Percentage of ingresses whose latency exceeded 1 s. The Spearman’s rank correlation coefficient was computed to measure the strength of the relationship between the fraction of high-latency ingress and trial number (rs = 0.72, p=0.013).
Figure 7
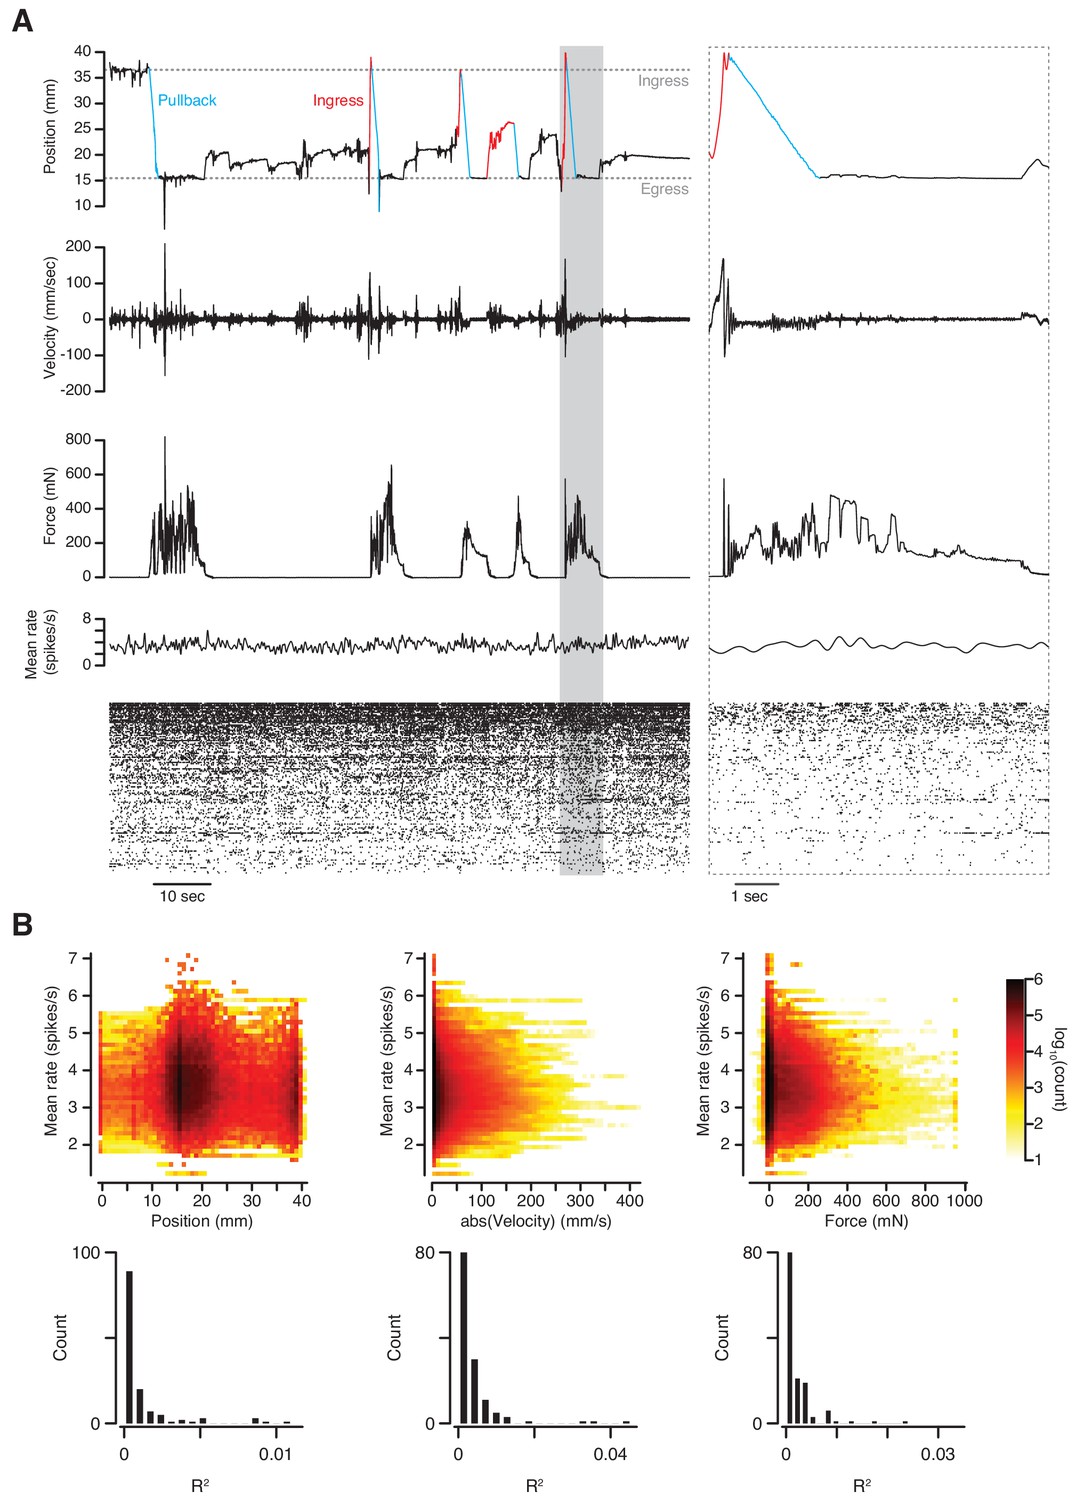
Simultaneous measurement of behavior and neuronal activity.
(A) Top to bottom: position, velocity, force, mean firing rate and raster plot of 133 simultaneously recorded single-units in anterior piriform cortex of an awake mouse in the VBA. Left; 2 min epoch that includes the first pullback following transition to closed-loop mode at approximately T = 10 s; grayed-out box at left demarcates epoch in which time scale is expanded at right; blue portions of position trace correspond to pullbacks, red portions to spontaneous ingresses that exceeded θp, resulting in pullback. (B) Top: three-dimensional histograms of mean firing rate vs. position (left), absolute velocity (middle) and force (right) during an 89-mn recording. Bottom, R2 of linear regressions of firing rate on position, absolute velocity, and force for individual single-units.
Tables
Table 1
Animals used in this study.
Identifying information for all animals used in this study.
| Animal number | Age at surgery | Age at expt. | Data | Notes |
|---|---|---|---|---|
| 2017022711 | 17 wks | 31 wks | Ingress, Figure 1C,D | - |
| 2017022712 | 17 wks | 31 wks | Ingress, Figure 1C,D | Also used for air puff expt. |
| 2017031302 | 10 wks | 22 wks | Ingress, Figure 1C,D | Also used for air puff expt. |
| 2017032101 | 11 wks | 22 wks | Ingress, Figure 1C,D | - |
| 2017032401 | 8 wks | 19 wks | Ingress, Figure 1C,D | - |
| 2017032402 | 11 wks | 22 wks | Ingress, Figure 1C,D | - |
| 2017033001 | 9 wks | 20 wks | Ingress, Figure 1C,D | Also used for air puff expt. |
| 2017033002 | 9 wks | 20 wks | Ingress, Figure 1C,D | Also used for air puff expt. |
| 2017042103 | 12 wks | 20 wks | Ingress, Figure 1C,D | - |
| 2017042105 | 12 wks | 20 wks | Ingress, Figure 1C,D | Also used for air puff expt. |
| 2018032602 | 8 wks | 14–16 wks | Figure 1—figure supplement 1 | |
| 2018040204 | 9 wks | 15–17 wks | Figure 1—figure supplement 1 | |
| 2018040206 | 9 wks | 15–17 wks | Figure 1—figure supplement 1 | |
| 2018040208 | 9 wks | 15–17 wks | Figure 1—figure supplement 1 | |
| 2018040212 | 9 wks | 15–17 wks | Figure 1—figure supplement 1 | |
| 2016082207 | 11 wks | 18 wks | Air puff, Figure 2 | Figure 2B,C from this animal |
| 2017022712 | 17 wks | 31 wks | Air puff, Figure 2 | Also used for Figure 1C,D |
| 2017031302 | 10 wks | 22 wks | Air puff, Figure 2 | Also used for Figure 1C,D |
| 2017033001 | 9 wks | 20 wks | Air puff, Figure 2 | Also used for Figure 1C,D |
| 2017033002 | 9 wks | 20 wks | Air puff, Figure 2 | Also used for Figure 1C,D |
| 2017042105 | 12 wks | 20 wks | Air puff, Figure 2 | Also used for Figure 1C,D |
| 2018061501 | 7 wks | 15 wks | Air puff, Figure 2 | - |
| 2018061201 | 7 wks | 15 wks | Air puff, Figure 2 | - |
| 2018061202 | 7 wks | 15 wks | Air puff, Figure 2 | - |
| 2018061301 | 7 wks | 15 wks | Air puff, Figure 2 | - |
| 2016071401 | 15 wks | 21 wks | Visual stimuli, Figure 3 | Expanding disk |
| 2016072401 | 16 wks | 21 wks | Visual stimuli, Figure 3 | Expanding disk |
| 2016072702 | 17 wks | 21 wks | Visual stimuli, Figure 3 | Expanding disk |
| 2016081901 | 10 wks | 11 wks | Visual stimuli, Figure 3 | Receding disk |
| 2016081902 | 10 wks | 11 wks | Visual stimuli, Figure 3 | Receding disk |
| 2016081903 | 10 wks | 11 wks | Visual stimuli, Figure 3 | Receding disk |
| 2015111301 | 15 wks | 56 wks | Visual stimuli, Figure 3 | Sweeping disk |
| 2015111602 | 12 wks | 52 wks | Visual stimuli, Figure 3 | Sweeping disk |
| 2015111701 | 12 wks | 52 wks | Visual stimuli, Figure 3 | Sweeping disk |
| 2016082302 | 11 wks | 18 wks | Odor habituation, Figure 4A–D | O1: Lim. O2: Oct. O3: Hex. |
| 2016082401 | 14 wks | 21 wks | Odor habituation, Figure 4A–D | O1: Oct. O2: Hex. O3: Lim. |
| 2016082402 | 14 wks | 21 wks | Odor habituation, Figure 4A–D | O1: Hex. O2: Oct. O3: Lim. |
| 2016082404 | 14 wks | 21 wks | Odor habituation, Figure 4A–D | O1: Hex. O2: Oct. O3: Lim |
| 2016082405 | 14 wks | 21 wks | Odor habituation, Figure 4A–D | O1: Oct. O2: Hex. O3: Lim. |
| 2017071603 | 13 wks | 34 wks | Odor habituation, Figure 4E–H | - |
| 2017071401 | 13 wks | 34 wks | Odor habituation, Figure 4E–H | - |
| 2017071605 | 13 wks | 34 wks | Odor habituation, Figure 4E–H | - |
| 2017071601 | 13 wks | 34 wks | Odor habituation, Figure 4E–H | - |
| 2017071602 | 13 wks | 34 wks | Odor habituation, Figure 4E–H | - |
| 2016082006 | 11 wks | 21 wks | Aversive odor learning, Figure 5, 6 | - |
| 2016082005 | 11 wks | 21 wks | Aversive odor learning, Figure 5, 6 | - |
| 2016082003 | 11 wks | 21 wks | Aversive odor learning, Figure 5, 6 | - |
| 2016082001 | 11 wks | 21 wks | Aversive odor learning, Figure 5, 6 | - |
| 2016071401 | 15 wks | 30 wks | Aversive odor learning, Figure 5, 6 | Also used for Figure 3 |
| 2016081903 | 10 wks | 20 wks | Aversive odor learning, Figure 5, 6 | Also used for Figure 3 |
| 2016081902 | 10 wks | 20 wks | Aversive odor learning, Figure 5, 6 | Also used for Figure 3 |
| 2016081901 | 10 wks | 20 wks | Aversive odor learning, Figure 5, 6 | Also used for Figure 3 |
| 2016082602 | 14 wks | 23 wks | Aversive odor learning, Figure 5, 6 | - |
| 2017092101 | 15 wks | 26 wks | Neurophysiology recording, Figure 7 |
Additional files
-
Transparent reporting form
- https://doi.org/10.7554/eLife.45658.019
Download links
A two-part list of links to download the article, or parts of the article, in various formats.
Downloads (link to download the article as PDF)
Open citations (links to open the citations from this article in various online reference manager services)
Cite this article (links to download the citations from this article in formats compatible with various reference manager tools)
A virtual burrow assay for head–fixed mice measures habituation, discrimination, exploration and avoidance without training
eLife 8:e45658.
https://doi.org/10.7554/eLife.45658


