Endothelial EphB4 maintains vascular integrity and transport function in adult heart
- Max Planck Institute for Molecular Biomedicine, Germany
- University Hospital Münster, Germany
- University of Münster, Germany
- AstraZeneca, Sweden
Figures
Figure 1 with 7 supplements
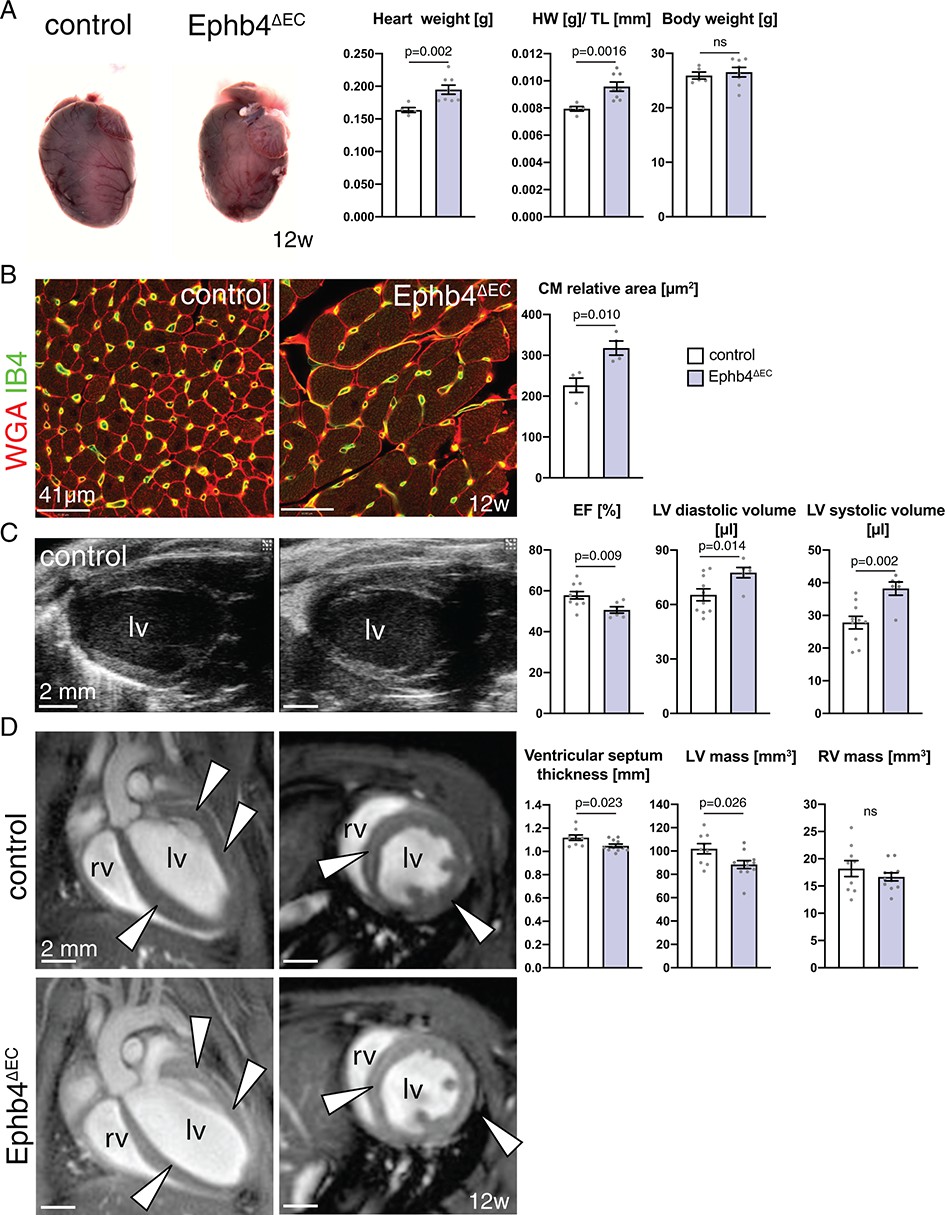
Heart defects in adult Ephb4 mutants.
(A) Freshly dissected Ephb4∆EC and littermate control hearts at 12 weeks of age. Heart weight and heart weight/tibia length index (HW/TL) ratio are increased in Ephb4∆EC mutants, whereas body weight remains unchanged. N = 5 for control and N = 8 for Ephb4∆EC. (B) Immunohistochemistry on cross sections of control and Ephb4∆EC hearts at 12 weeks. Panels show the inner part of the left ventricular wall with significantly increased cardiomyocyte relative area in Ephb4∆EC samples. N = 4 for both genotypes. (C) Echocardiography analysis of 12 week-old animals. Ejection fraction (EF) is significantly reduced in mutant mice while left ventricle diastolic and systolic volumes are increased. lv, left ventricle. N = 10 for control and N = 6 for Ephb4∆EC (D) CMRI sections of hearts showing four-chamber (left) and short axis (right) views of control and Ephb4∆EC at 12 weeks of age. Arrowheads indicate the ventricular septum and the wall of the left ventricle. rv, right ventricle; lv, left ventricle. Ventricular septum thickness and left ventricular (lv) mass are significantly reduced in Ephb4∆EC mice, whereas right ventricular (rv) mass remains unchanged. N = 9 for control and N = 11 for Ephb4∆EC. Data represented as mean ± s.e.m. P values calculated by unpaired two-tailed t test with Welch’s correction. ns, not significant.
-
Figure 1—source data 1
Source data for Figure 1A,B,C,D.
- https://cdn.elifesciences.org/articles/45863/elife-45863-fig1-data1-v1.xlsx
Figure 1—figure supplement 1
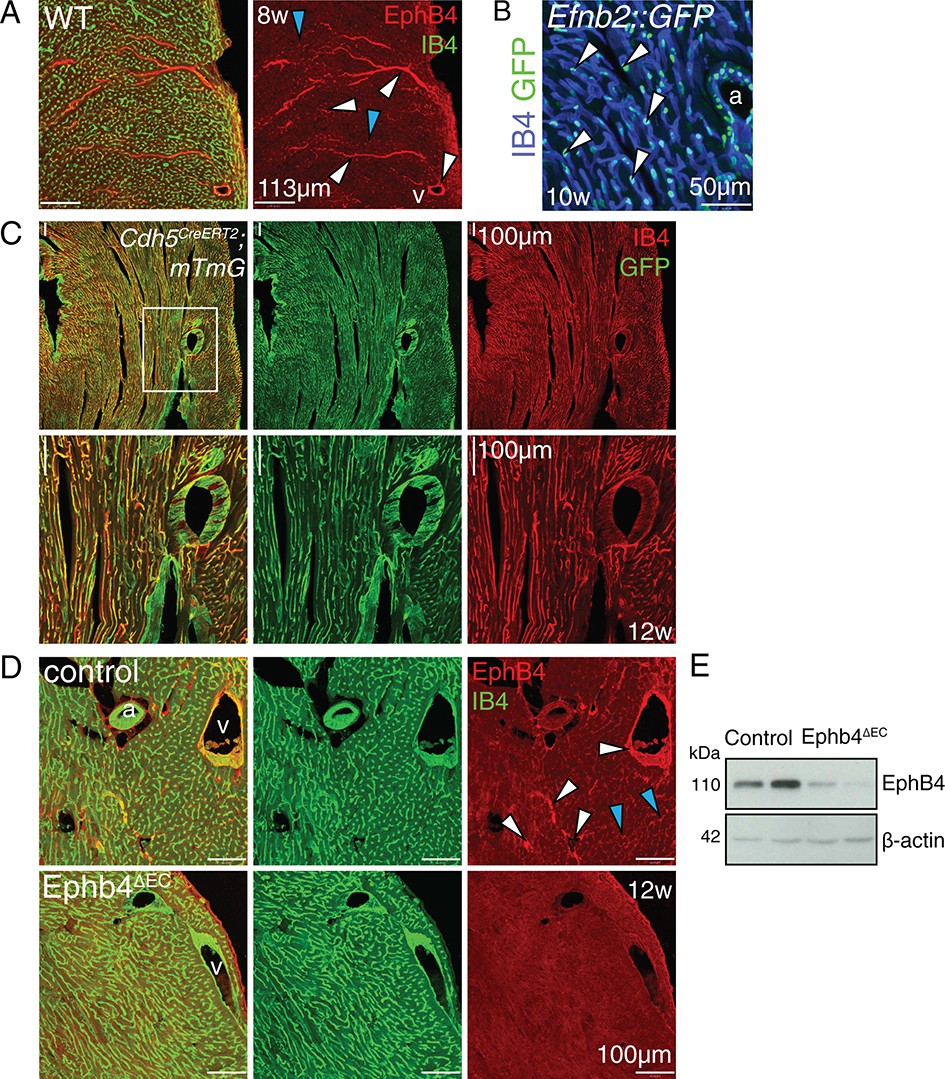
Inactivation of Ephb4 in adult ECs.
(A–D) Immunohistochemistry on cross sections of hearts. Panels show the outer part of the wall of the left ventricle. (A) EphB4 is expressed in veins, venules (white arrowheads) and small capillaries (blue arrowheads) in the adult heart ventricle. (B) Concomitant expression of GFP shows that ephrin-B2 is expressed in the small capillaries of the ventricular wall (arrowheads) and in arteries. a, artery; v, vein. (C) Cdh5CreERT2 R26-mTmG double heterozygous mice show GFP expression throughout the cardiac endothelium at 4 weeks after tamoxifen induction. (D) EphB4 protein expression is abolished in Ephb4∆EC cardiac veins, venules (white arrowheads) and capillaries (blue arrowheads). (E) Western blot analysis of total heart lysate at 12 weeks confirms strongly reduced EphB4 expression in Ephb4∆EC mutants. Molecular weight marker (kDa) is indicated. a, artery; v, vein.
Figure 1—video 1
Left ventricle long axis view.
Figure 1—video 2
Left ventricle long axis view.
Figure 1—video 3
Four chamber view.
Figure 1—video 4
Short axis view.
Figure 1—video 5
Four chamber view.
Figure 1—video 6
CMRI 12 week-old Ephb4∆EC mutant.
Short axis view.
Figure 2 with 3 supplements
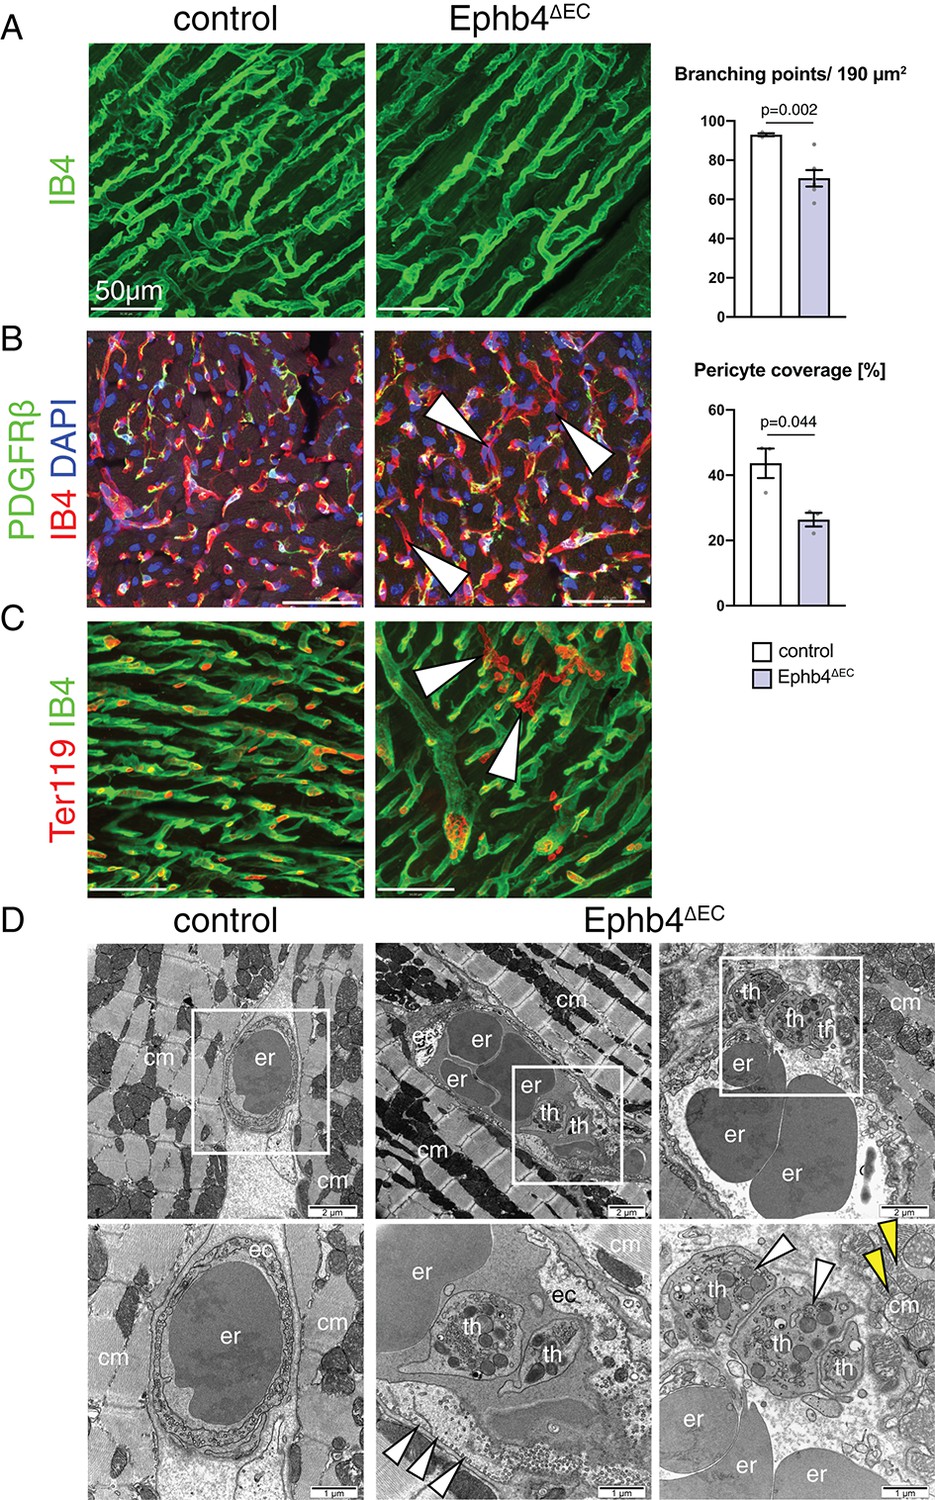
Ephb4 inactivation compromises cardiac vascular integrity.
(A–C) Immunostaining of cross sections through 12 week-old control and Ephb4∆EC hearts. Confocal images show the outer (A, C) and inner part (B) of the left ventricle. (A) Vascular density, measured by number of branching points, is significantly reduced in Ephb4∆EC samples. N = 3 for control and N = 6 for Ephb4∆EC. (B) Pericyte coverage is reduced in Ephb4∆EC hearts (arrowheads mark affected capillaries). N = 3 per genotype. (C) Presence of microhemorrhages (arrowheads mark erythrocytes in the mutant myocardium). (D) Electron micrographs of control and Ephb4∆EC capillaries. Bottom images are higher magnifications of boxed areas in upper panels. White arrowheads indicate accumulation of caveolar vesicles at the mutant endothelial basolateral membrane (center) and thrombocytes in a vascular rupture (right). Yellow arrowheads indicate mitochondrial glycogen accumulation. Erythrocytes (er), thrombocytes (th), cardiomyocytes (cm) and endothelial cells (ec) are indicated. Data represented as mean ± s.e.m. P values calculated by unpaired two-tailed t test with Welch’s correction.
-
Figure 2—source data 1
Source data for Figure 2A,B.
- https://cdn.elifesciences.org/articles/45863/elife-45863-fig2-data1-v1.xlsx
Figure 2—figure supplement 1
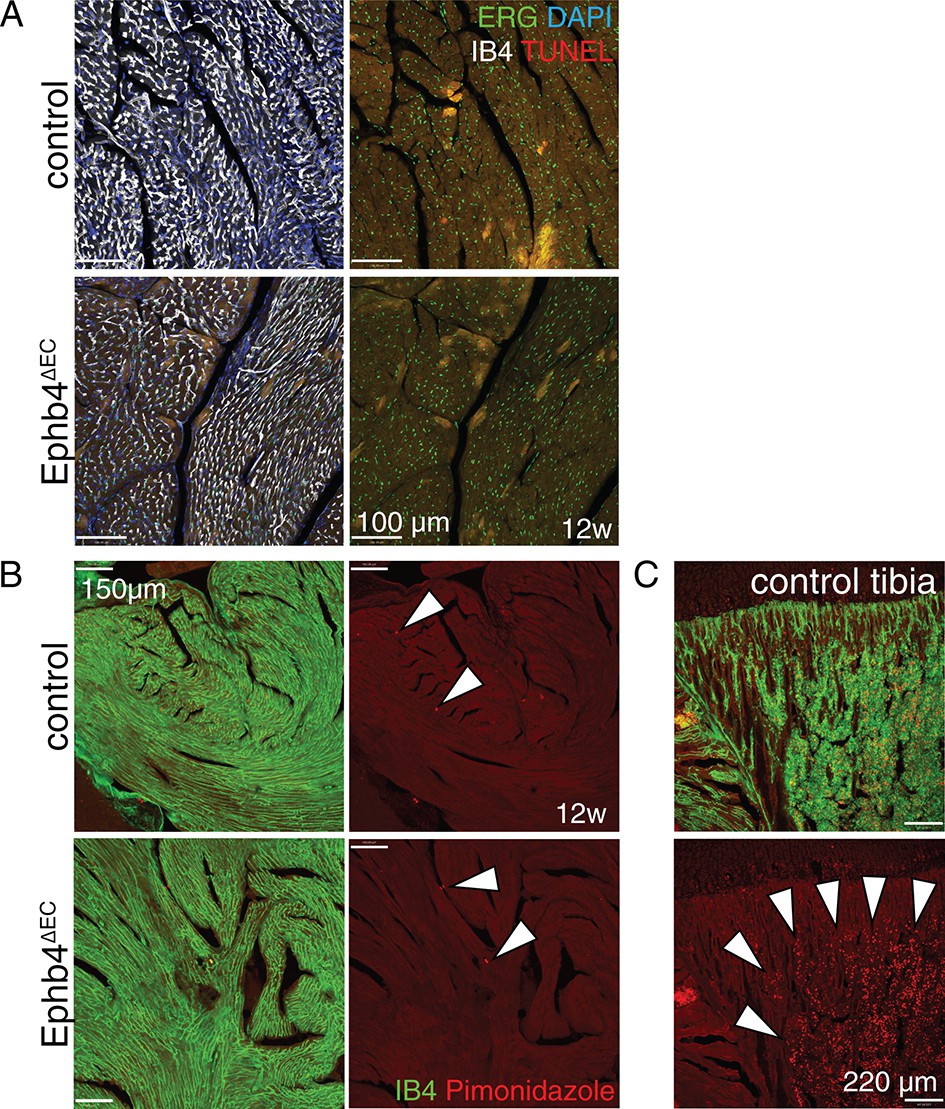
Analysis of cell death and hypoxia.
(A) TUNEL assay in Ephb4∆EC hearts. There is no detectable cell death in mutant ECs of the ventricular wall. (B) Hypoxia assay using Pimonidazole shows that Ephb4∆EC hearts are not hypoxic. Hearts were compared to a known hypoxic tissue (C), namely bone marrow in long bone, as a positive control. Arrowheads indicate positive signal (red).
Figure 2—figure supplement 2
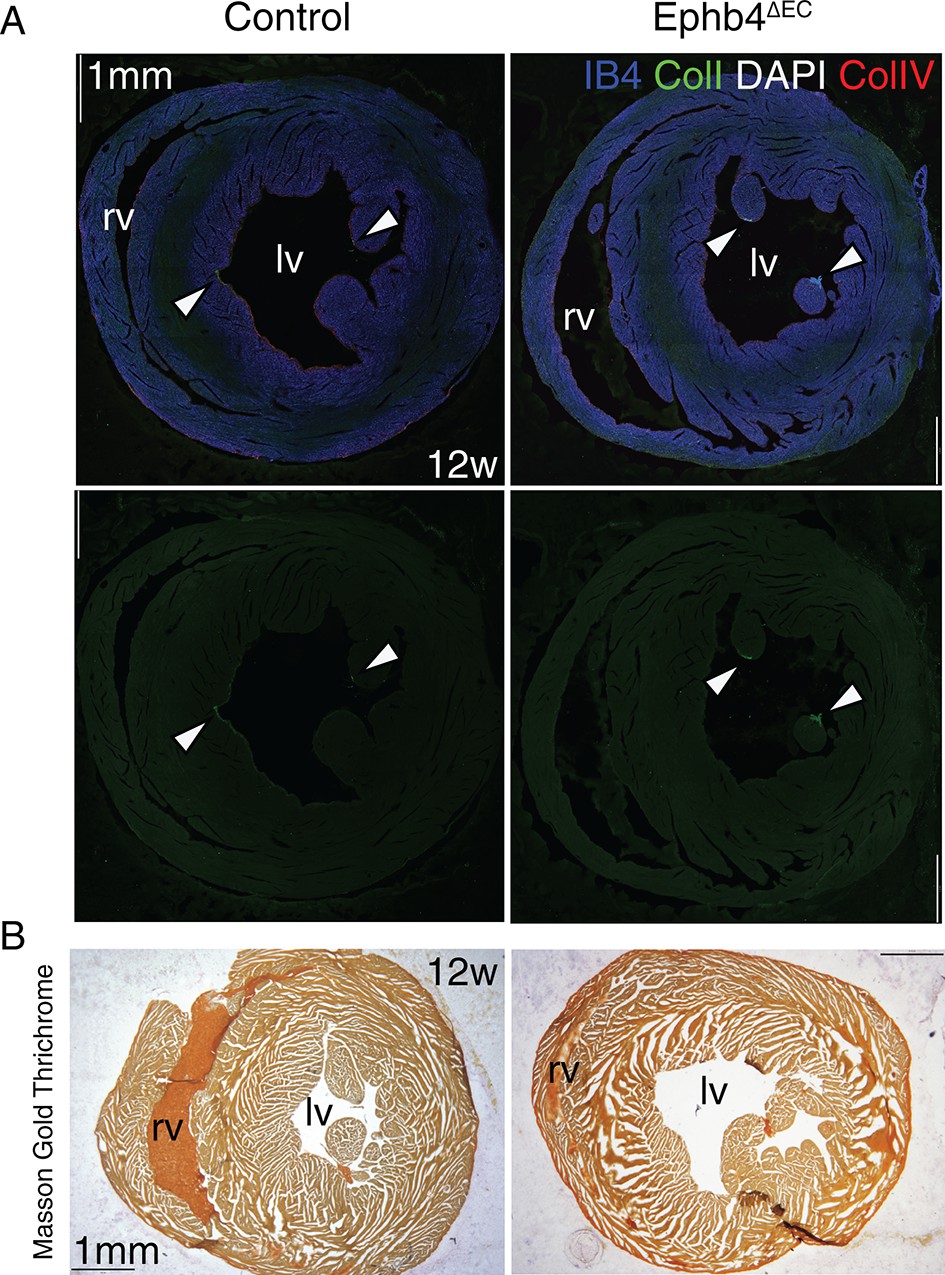
Ephb4 inactivation does not induce fibrosis in heart.
(A) Immunohistochemistry on for Collagen I (ColI, green) and Collagen IV (ColIV, green) in transverse sections of control and Ephb4∆EC heart showing both ventricles. Arrowheads mark normal signal. ECs are stained by isolectin B4 (IB4, blue), nuclei by DAPI (white). (B) Masson’s Gold Trichrome staining on cross sections of hearts. No fibrosis is observed. lv, left ventricle, rv, right ventricle.
Figure 2—figure supplement 3
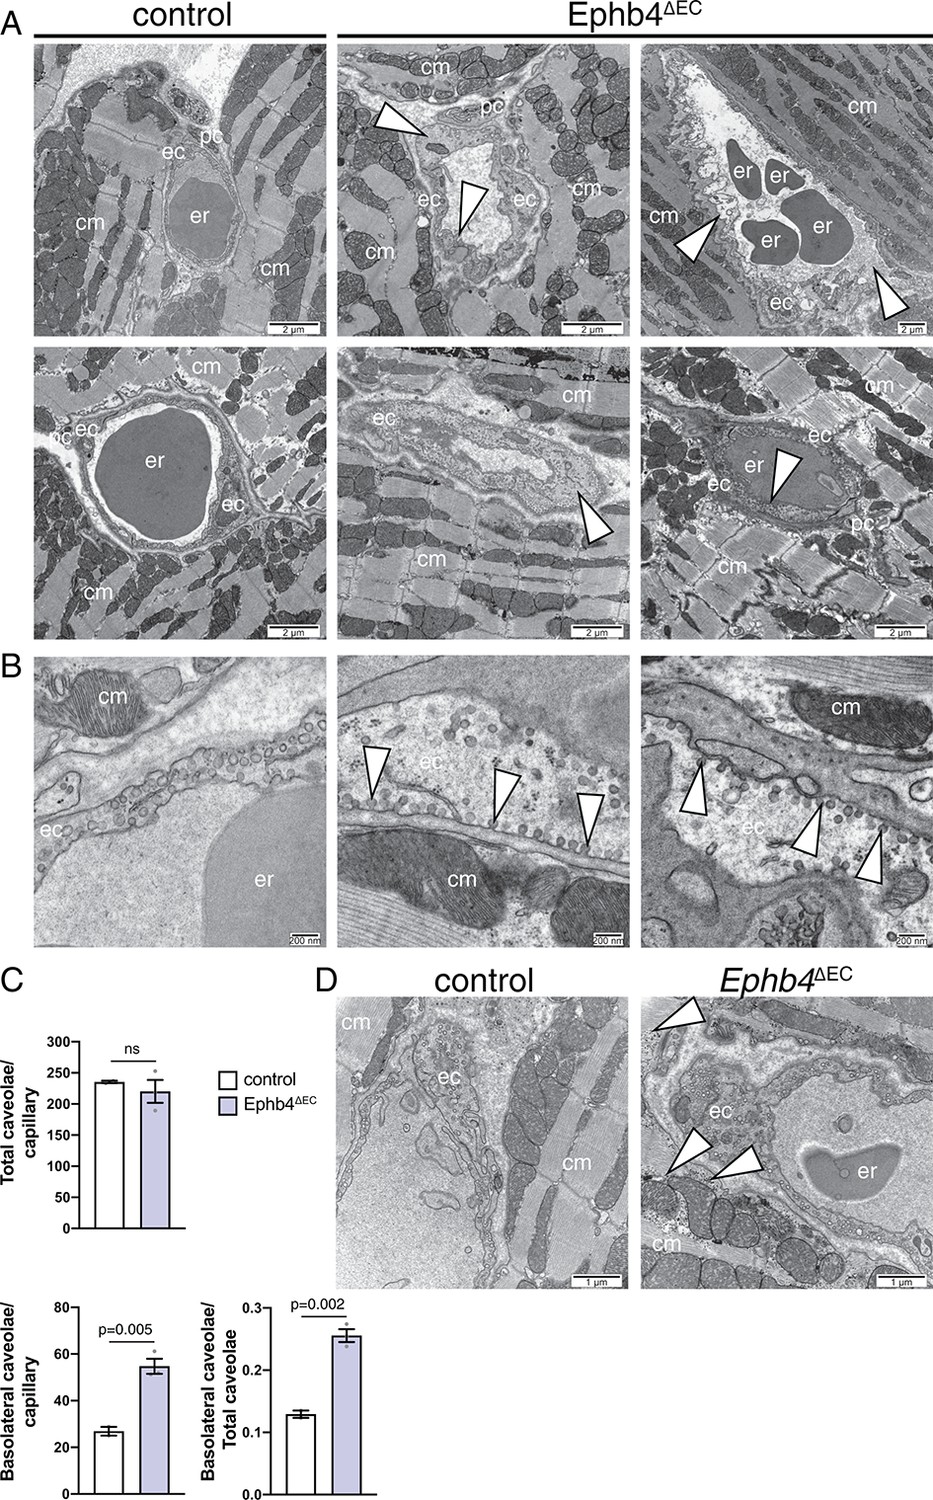
Ultrastructural analysis of Ephb4 mutant hearts.
(A–C) Electron micrographs show details of the ventricular wall of the left ventricle. (A) Mutant endothelial cells are thickened and present irregular lining (arrowheads). (B) Accumulation of caveolae at the basolateral membrane of mutant ECs. Middle panel shows higher magnification of the bottom middle panel in Figure 2D. (C) Quantification of total caveolae and basolateral-associated caveolae in capillaries. N = 2 for control (five images/control mouse) and N = 3 for Ephb4∆EC (4/6/5 images/mutant mouse). Data represented as mean ± s.e.m. P values calculated by unpaired two-tailed t test with Welch’s correction. (D) Cardiomyocytes in mutant hearts show accumulation of glycogen (arrowheads) close to mitochondria. Erythrocytes (er), thrombocytes (th), cardiomyocytes (cm) and endothelial cells (ec), and pericytes (pc) are indicated. ns, not significant.
-
Figure 2—figure supplement 3—source data 1
Source data for Figure 2—figure supplement 3C.
- https://cdn.elifesciences.org/articles/45863/elife-45863-fig2-figsupp3-data1-v1.xlsx
Figure 3 with 2 supplements
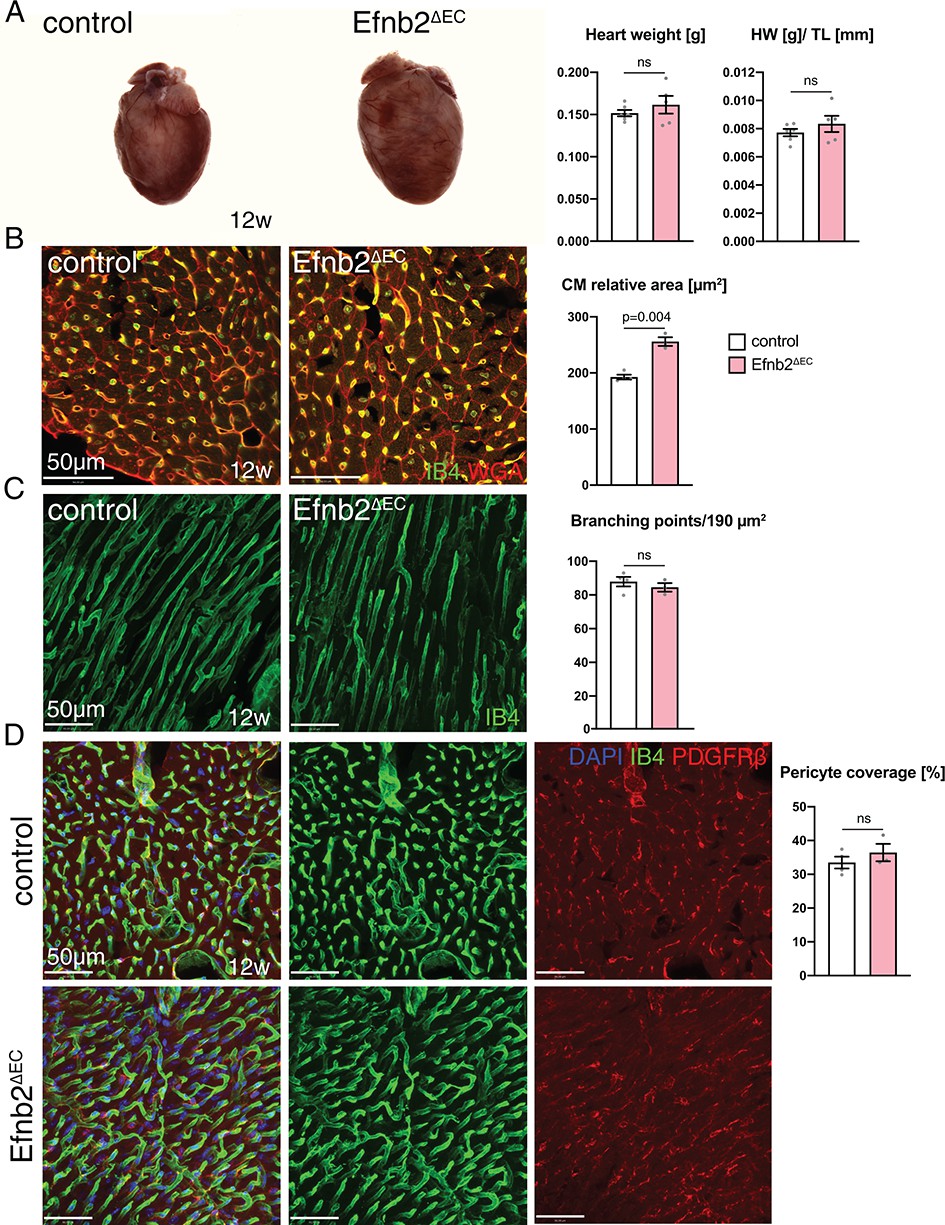
Heart phenotype after Efnb2 inactivation in the vascular endothelium.
(A) Efnb2∆EC and littermate control hearts at 12 weeks of age. Heart weight and heart weight/tibia length index (HW/TL) remain unaffected in Efnb2∆EC mutants. N = 6 for control and N = 5 for Efnb2∆EC. (B–D) Immunohistochemistry on sections of control and Efnb2ΔEC hearts. Panels show the inner (B, D) and the outer part (C) of the wall of the left ventricle. (B) Cardiomyocyte (CM) relative area is significantly increased in Efnb2∆EC hearts. N = 4 for control and N = 3 for Efnb2∆EC. (C) Vascular density, measured by number of branching points, remains unchanged in Efnb2∆EC samples. N = 4 for control and N = 3 for Efnb2∆EC. (D) Cardiac pericyte coverage is not reduced in Efnb2∆EC mutants. N = 4 for control and N = 3 for Efnb2∆EC. Data represented as mean ± s.e.m. P values calculated by unpaired two-tailed t test with Welch’s correction. ns, not significant.
-
Figure 3—source data 1
Source data for Figure 3A,B,C,D.
- https://cdn.elifesciences.org/articles/45863/elife-45863-fig3-data1-v1.xlsx
Figure 3—figure supplement 1
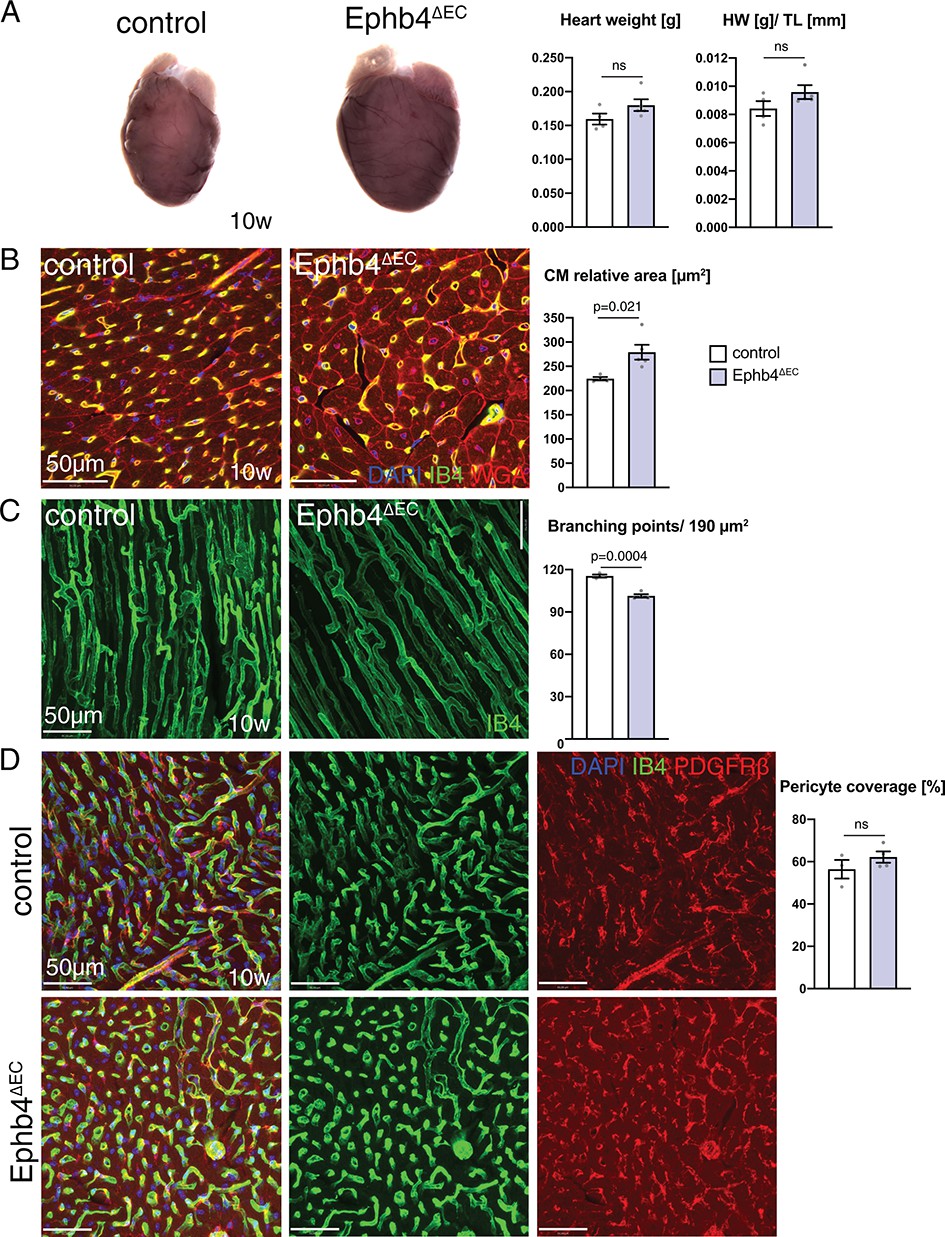
Cardiomyocyte hypertrophy at 2 weeks after Ephb4 inactivation.
(A) Control and Ephb4∆EC hearts at 10 weeks of age. Heart weight and heart weight/tibia length index (HW/TL) are unchanged in mutants. (B–D) Immunohistochemistry on cross sections of 12 week-old control and Ephb4∆EC hearts. Panels show the inner (B, D) and the outer part (C) of the left ventricular wall. (B) Cardiomyocyte (CM) relative area is significantly increased in mutant hearts. N = 4 for control and N = 5 for Ephb4∆EC. (C) Vascular density, measured by number of branching points, is significantly reduced in Ephb4∆EC hearts. N = 3 for control and N = 4 for Ephb4∆EC, whereas (D) pericyte coverage is not significantly altered. N = 3 for control and N = 4 for Ephb4∆EC. Data represented as mean ± s.e.m. P values calculated by unpaired two-tailed t test with Welch’s correction. ns, not significant.
-
Figure 3—figure supplement 1—source data 1
Source data for Figure 3—figure supplement 1A,B,C,D.
- https://cdn.elifesciences.org/articles/45863/elife-45863-fig3-figsupp1-data1-v1.xlsx
Figure 3—figure supplement 2
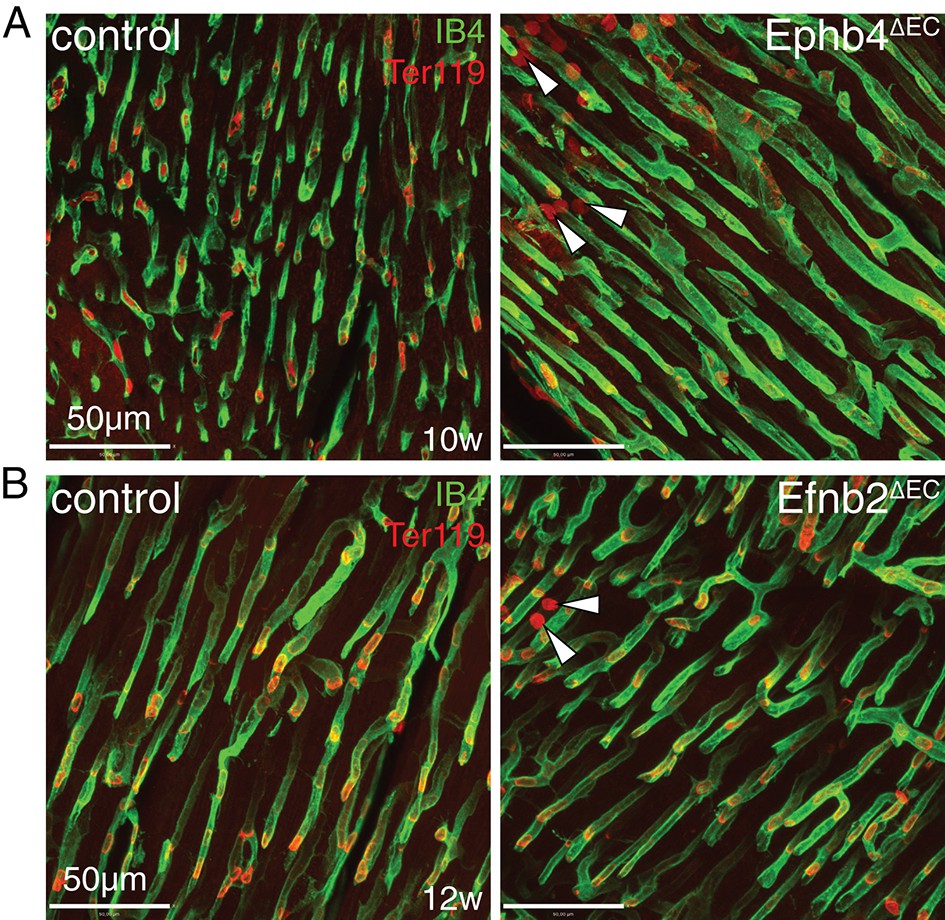
Microhemorrhages in Ephb4 and Efnb2 mutant hearts.
(A, B) Immunostaining on cross sections of the outer wall of the left ventricle. (A) Presence of microhemorrhages in the myocardium of Ephb4∆EC mice at 10 weeks. (B) Presence of Ter119+ red blood cells (red) in the myocardium of Efnb2∆EC mice at 12 weeks. Arrowheads indicate erythrocytes outside of blood vessels.
Figure 4 with 2 supplements
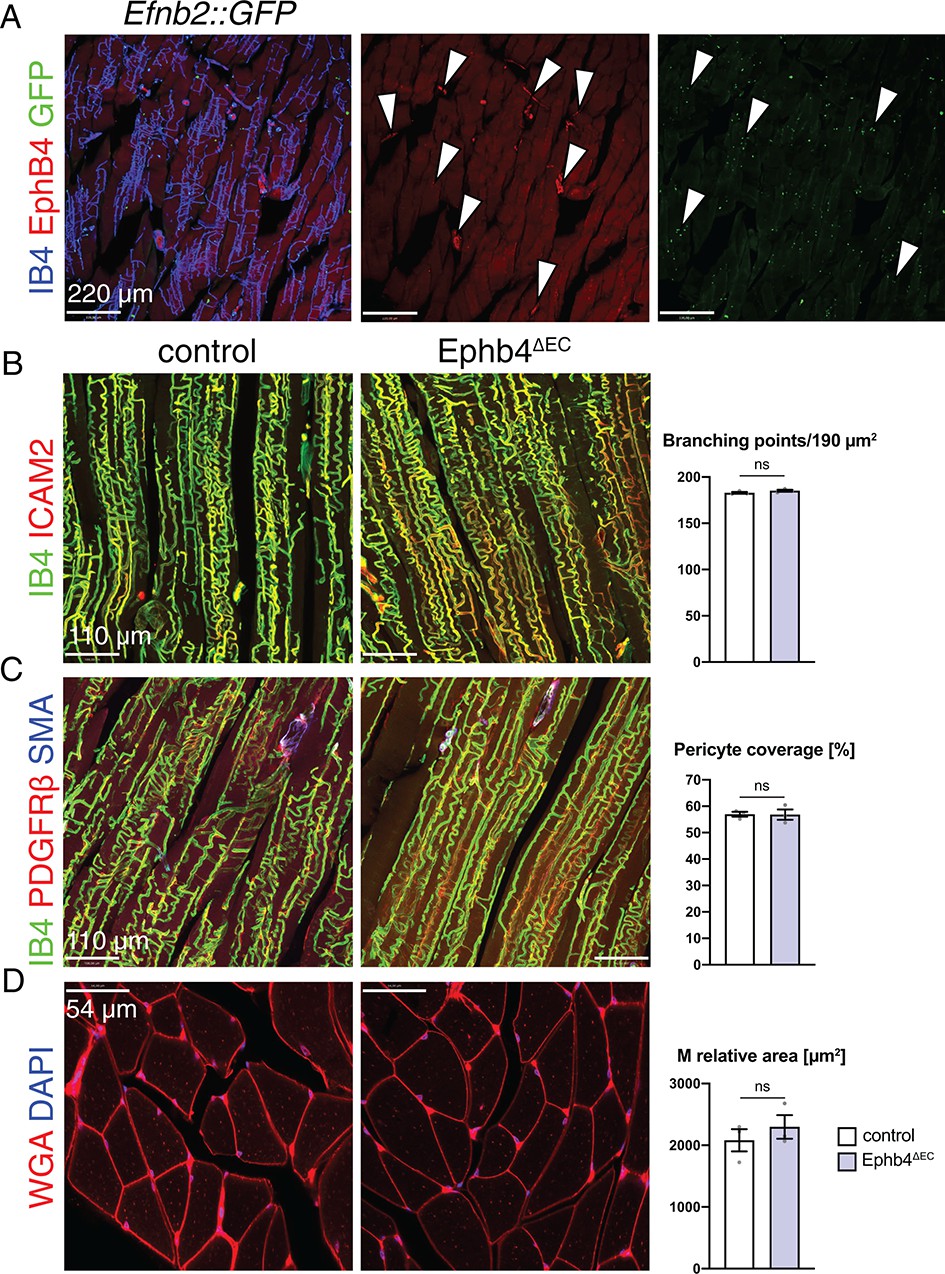
EphB4 inactivation does not affect the skeletal muscle.
(A–D) Immunohistochemistry on longitudinal sections of control and Ephb4∆EC gastrocnemius at 12 weeks of age. (A) EphB4 and ephrin-B2 (GFP in Efnb2::GFP reporter line) are expressed in capillaries (arrowheads). (B) Vascular density, measured by number of branching points, is not changed in Ephb4∆EC gastrocnemius. (C) Pericyte coverage and (D) myocyte (M) relative area is not reduced in Ephb4∆EC gastrocnemius. N = 3 for both genotypes. Data represented as mean ± s.e.m. P values calculated by unpaired two-tailed t test with Welch’s correction. ns, not significant.
-
Figure 4—source data 1
Source data for Figure 4B,C,D.
- https://cdn.elifesciences.org/articles/45863/elife-45863-fig4-data1-v1.xlsx
Figure 4—figure supplement 1
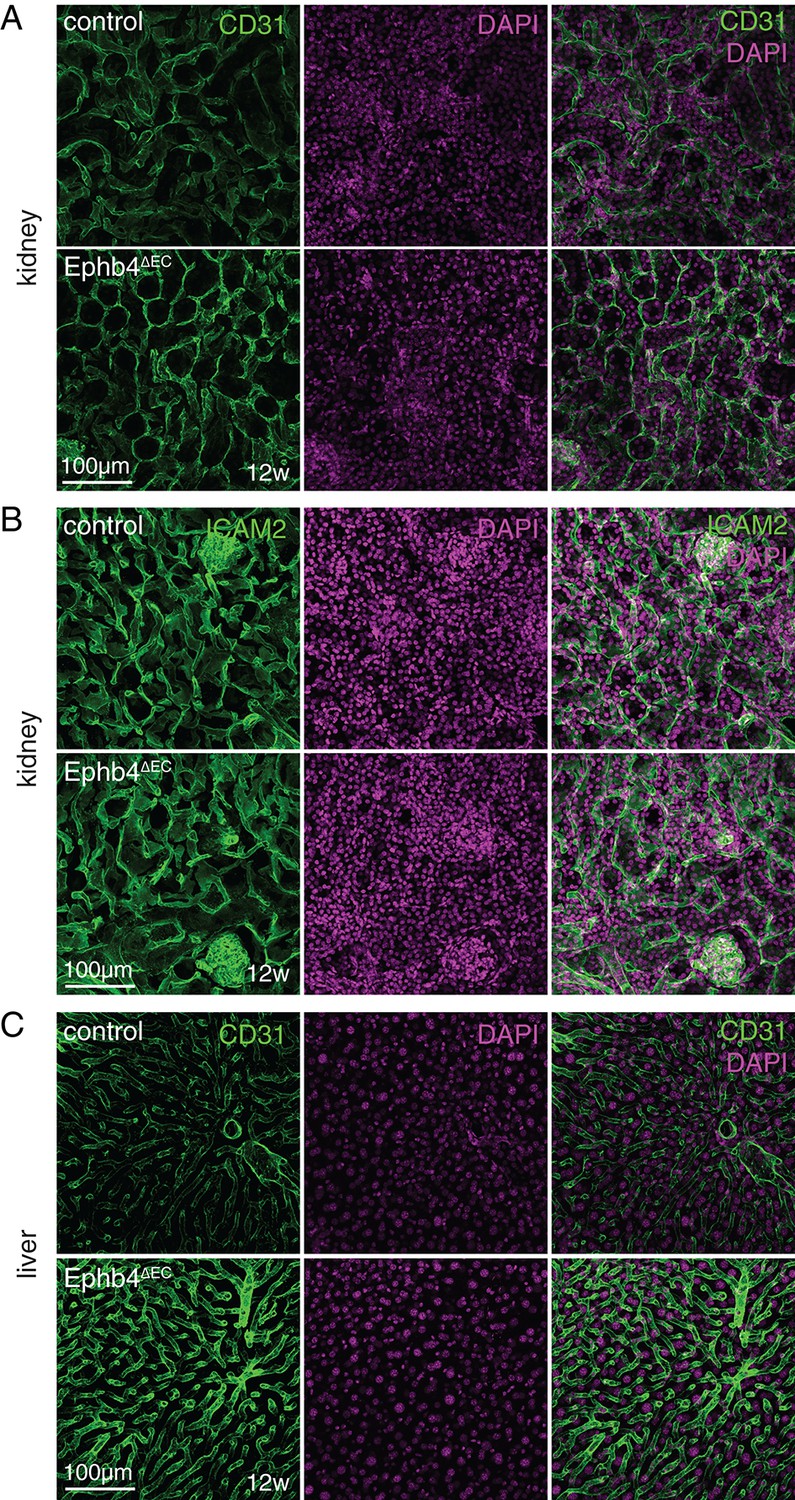
Liver and kidney vasculature after Ephb4 inactivation.
(A, B) Immunostaining on sections (150 µm thick) of the right kidney of 12 week-old Ephb4∆EC mutants and control littermates. No significant changes in kidney vasculature are visible after staining of CD31 (A) or ICAM (B) (B), green) and DAPI (nuclei, magenta). (C) Immunostaining of CD31 (green) in the sections (150 µm thick) from the Ephb4∆EC and control right median liver lobe does not reveal any overt differences in the hepatic vasculature. DAPI (nuclei, magenta).
Figure 4—figure supplement 2
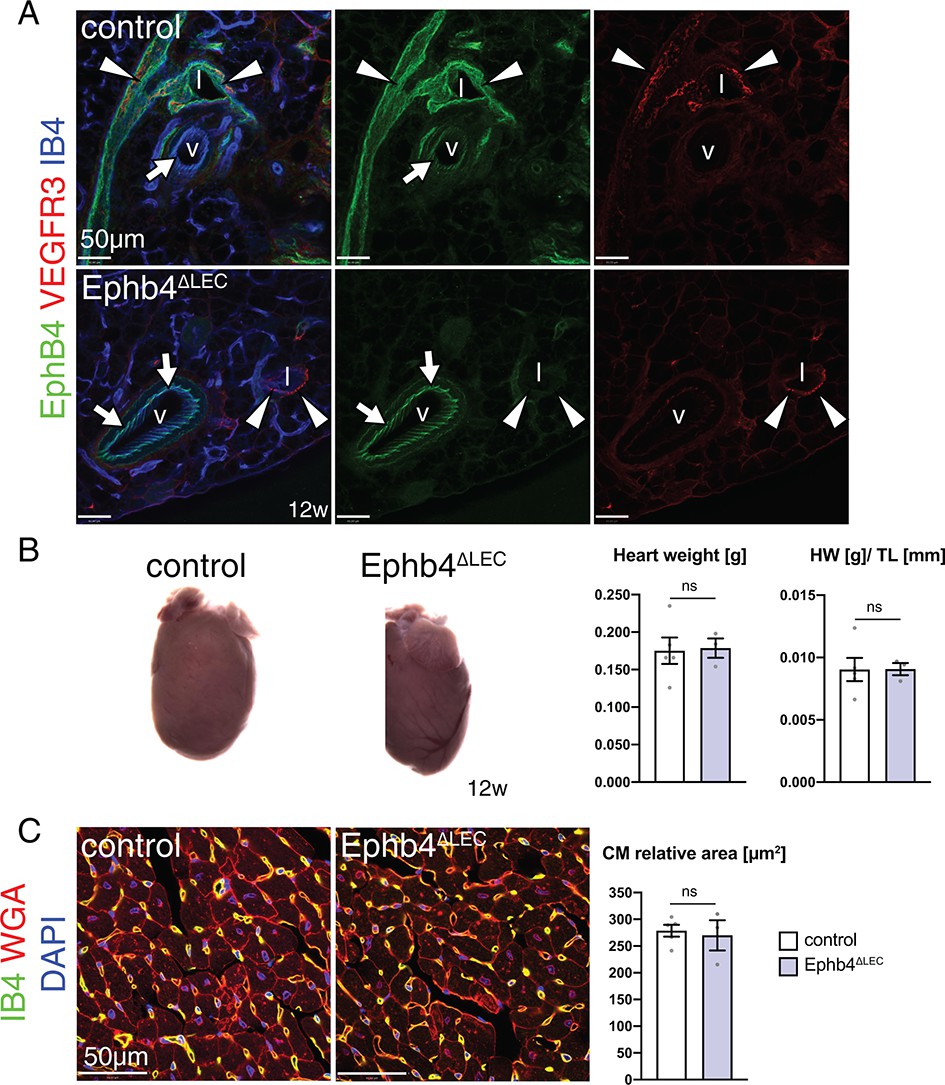
Lymphatic inactivation of Ephb4 in adults does not produce cardiac defects.
(A) Immunohistochemistry of lymphatic vessel in the intestinal mesentery. EphB4 immunosignal is lost in lymphatic vessels (arrowheads) but maintained in Ephb4∆LEC veins (arrows). (B) Control and Ephb4∆LEC hearts at 12 weeks of age. Heart weight and heart weight/tibia length index (HW/TL) are unchanged in Ephb4∆LEC mutants. N = 5 for control and N = 3 for Ephb4∆LEC. (C) Immunostaining of the inner part of the wall of the left ventricle. Cardiomyocyte (CM) relative area remains unaffected in Ephb4∆LEC hearts. N = 5 for control and N = 3 for Ephb4∆LEC. Data represented as mean ± s.e.m. P values calculated by unpaired two-tailed t test with Welch’s correction. ns, not significant.
Figure 5 with 1 supplement
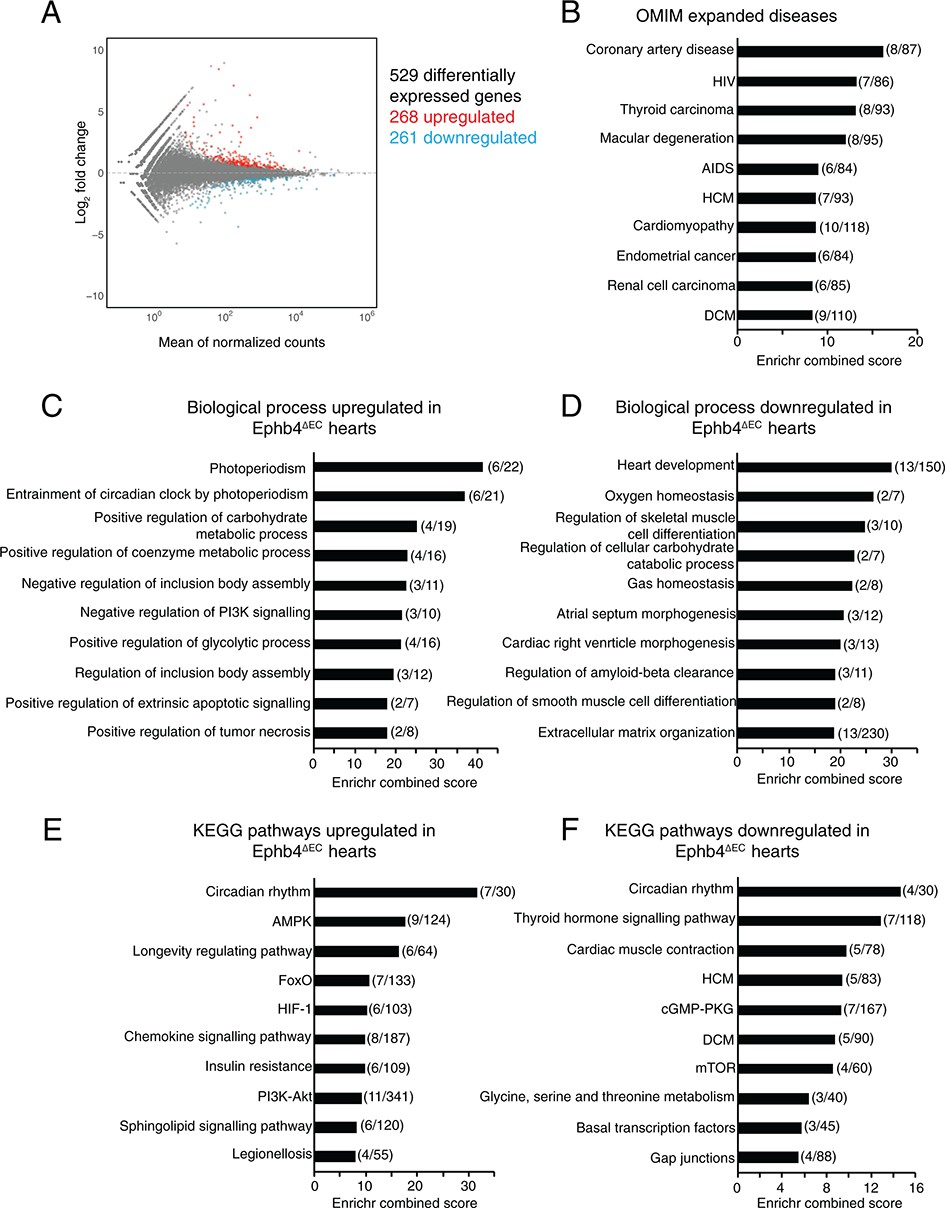
RNA-seq analysis of total heart suggests a metabolic shift in Ephb4 mutants.
(A–F) Global gene expression analysis of Ephb4∆EC ventricles by RNA sequencing at 12 weeks. (A) MA plot representing the 529 differentially expressed genes (p<0.05) including 268 upregulated genes (red) and 261 downregulated genes (blue). (B–F) Representation of the ten most significant functional categories in each group revealed by gene ontology analysis using the Enrichr data base. Graphs represent Enrichr combined score that combines P value and Z score. Numbers in brackets represent the number of differentially expressed genes in the corresponding category. (B) Human disease enriched terms according to the Online Mendelian Inheritance in Man (OMIM). Biological processes upregulated (C) and downregulated (D) in Ephb4∆EC ventricles. Kyoto Encyclopedia of Genes and Genomes (KEGG) pathways upregulated (E) and downregulated (F) in Ephb4∆EC ventricles. HCM, hypertrophic cardiomyopathy; DCM, dilated cardiomyopathy.
-
Figure 5—source data 1
RNA-seq analysis of Ephb4∆EC and control mouse heart ventricles.
The table indicates all the transcripts significantly upregulated and downregulated in Ephb4 mutant hearts.
- https://cdn.elifesciences.org/articles/45863/elife-45863-fig5-data1-v1.xlsx
-
Figure 5—source data 2
Global proteome analysis of Ephb4∆EC and control mouse heart ventricles.
The table indicates all the proteins significantly upregulated and downregulated in Ephb4 mutant hearts.
- https://cdn.elifesciences.org/articles/45863/elife-45863-fig5-data2-v1.xlsx
Figure 5—figure supplement 1
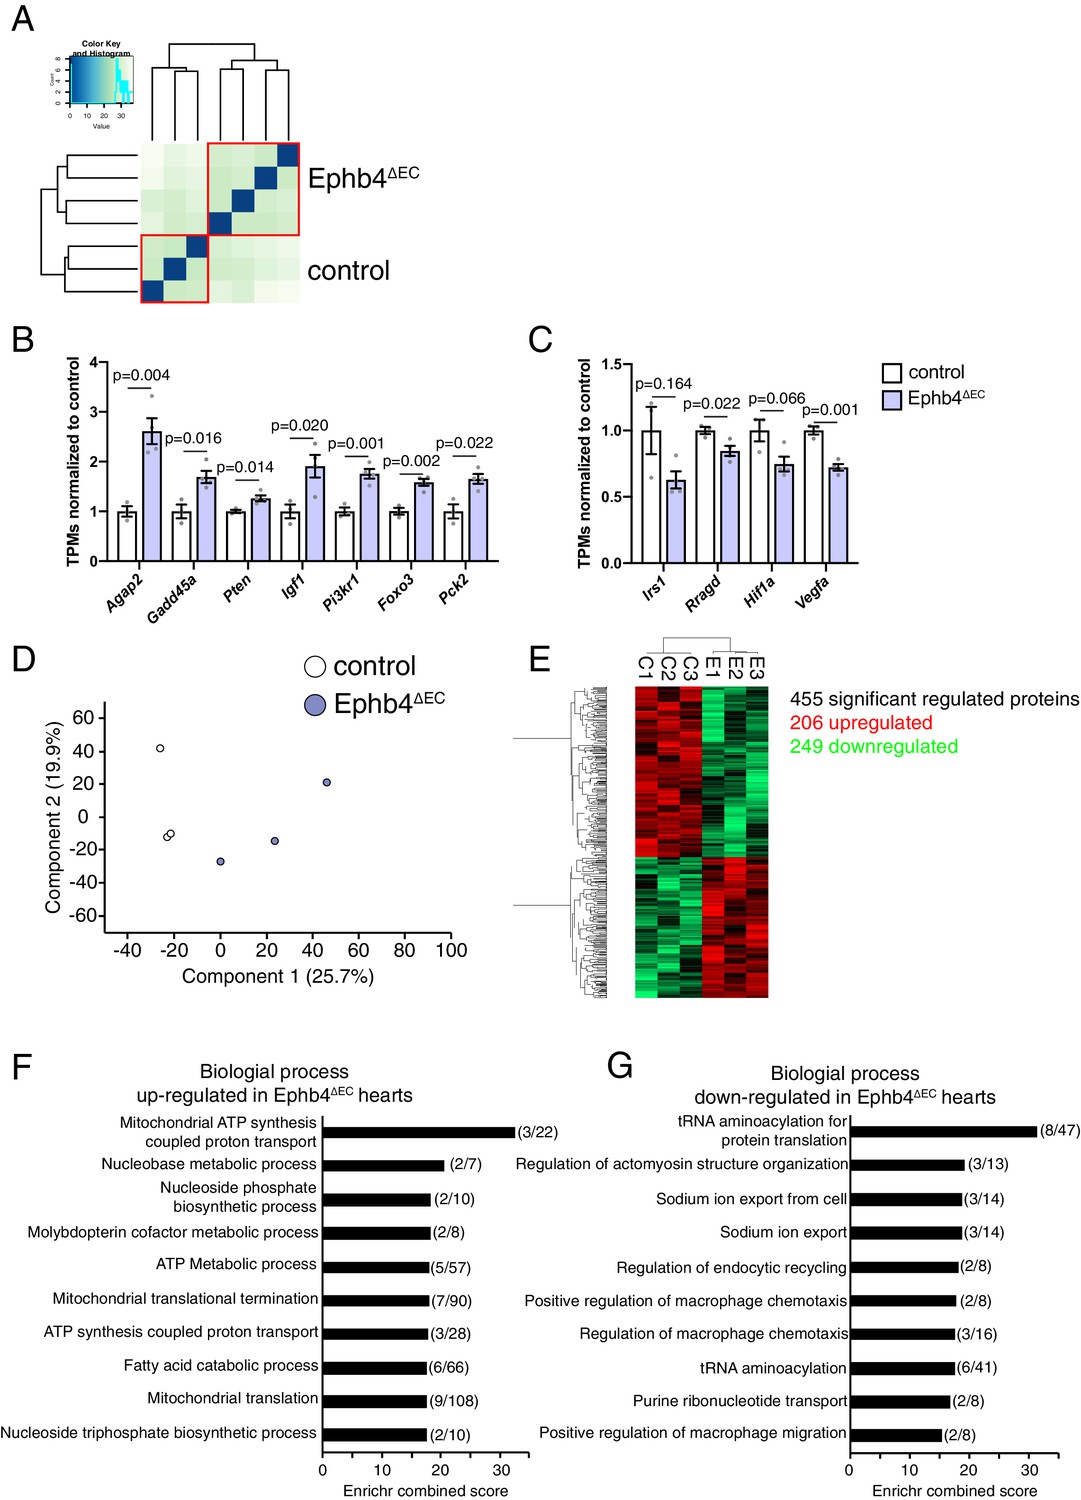
Genome and Proteome analysis of adult Ephb4 mutant ventricles.
(A–C) Global gene expression analysis of 12 week-old Ephb4∆EC ventricles by RNA sequencing. (A) Sample distance analysis of RNA-seq samples. N = 3 for controls and N = 3 for Ephb4∆EC. (B) TPM (Transcripts Per Million) values normalized to control of upregulated genes corresponding to the FoxO signaling pathway by gene ontology analysis (see Figure 5E). (C) TPM values normalized to control of downregulated genes corresponding to the mTOR signaling pathway by gene ontology analysis (see Figure 5F). (B, C) N = 3. Data represented as mean ± s.e.m. P values calculated by unpaired two-tailed t test with Welch’s correction. (D–G) Global proteome analysis of Ephb4∆EC ventricles at 12 weeks. (D) Principal components analysis of the variance in between samples. N = 3 for control and Ephb4∆EC mice. (E) Heat map representing the 455 significantly regulated proteins (p<0.05), of which 206 are upregulated (red) and 249 downregulated (green). (C: control samples; E: Ephb4∆EC samples) (F, G) Representation of the ten most significant functional categories in each group revealed by gene ontology analysis using the Enrichr data base. Graphs represent Enrichr combined score that combines P-value and Z-score. Numbers in brackets represent the number of genes involved in the corresponding category. Biological processes that are upregulated (F) or downregulated (G) in Ephb4∆EC mutants.
-
Figure 5—figure supplement 1—source data 1
Source data for Figure 5—figure supplement 1B,C.
- https://cdn.elifesciences.org/articles/45863/elife-45863-fig5-figsupp1-data1-v1.xlsx
Figure 6
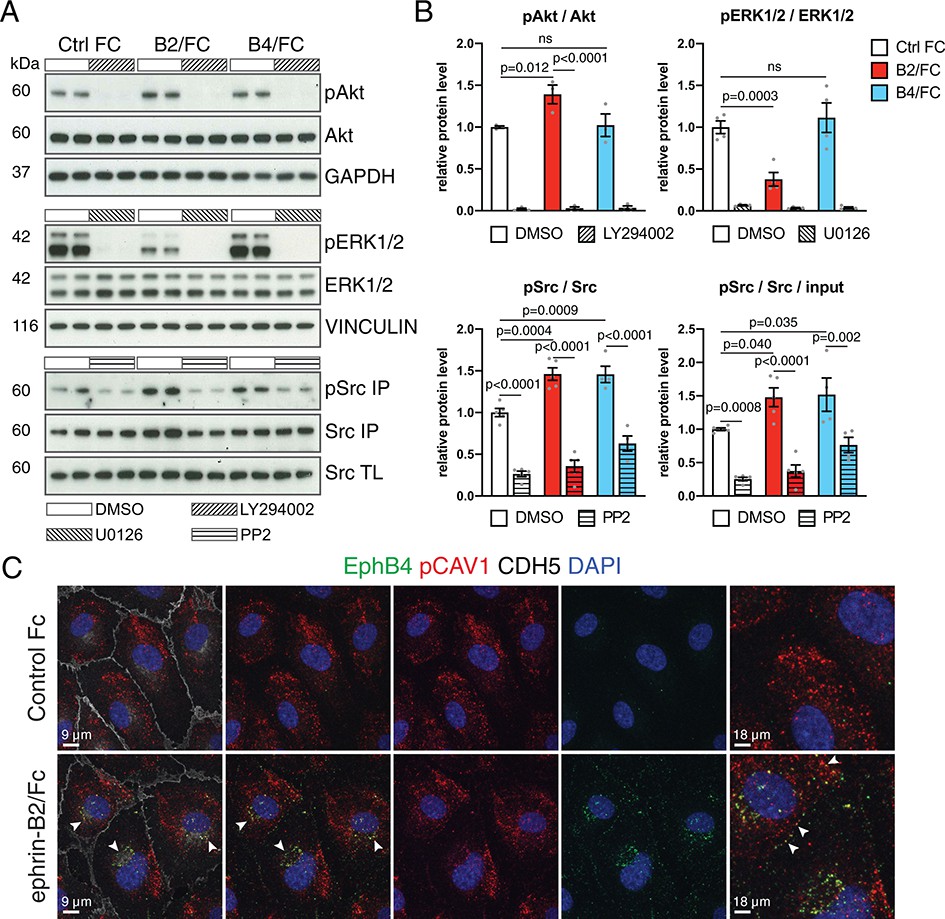
EphB4-induced signaling in cultured ECs.
(A) Western blot analysis of lysates from cultured HUVECs stimulated with control human IgG/Fc (Ctrl Fc), human ephrin-B2/Fc (B2/Fc) or mouse EphB4/Fc (B4/Fc) (4 µg/ml, preclustered with 10µg/ml goat anti-human IgG), concurrently treated with inhibitors (LY294002, U0126, PP2) or DMSO for 30 min. Active Src (pSrc) was determined by anti-Src immunoprecipitation (IP) followed by anti-Src or anti-phosphotyrosine (4G10) immunoblotting. Bottom panel indicates Src input in total cell lysate (TL). Molecular weights (kDa) are indicated. N = 3 for all treatments. (B) Graphs show relative quantitation of pAkt/Akt, pERK1/2/ERK1/2, pSrc/Src and pSrc/Src/input. N = 3 for LY294002 and U0126 experiments. For PP2 experiment N = 4 for Ctrl Fc/DMSO, B4/Fc/DMSO and B4/Fc/PP2 and N = 5 for all the other conditions. Data represented as mean ± s.e.m. P values calculated by ordinary one-way ANOVA with Sidak’s multiple comparisons test. (C) Colocalization (arrowheads) of EphB4 (green) and phospho-CAV1 (pCAV1, red) in HUVECs 30 min after stimulation with human IgG/Fc or ephrin-B2-Fc. Rightmost panels show higher magnification of selected areas. Cell junctions, VE-Cadherin (CDH5, white); nuclei, DAPI (blue). ns, not significant.
-
Figure 6—source data 1
Source data for Figure 6B.
- https://cdn.elifesciences.org/articles/45863/elife-45863-fig6-data1-v1.xlsx
Figure 7 with 1 supplement

Alterations after knockdown of EPHB4 expression in ECs.
(A) Western blot analysis of HUVECs transfected with siControl, siEPHB4 or siCAV1, as indicated. Knockdown cells showed a reduction of CAV1 and pCAV1 protein levels. N = 3 for all treatments. (B) Src input total cell lysate (TL) and tyrosine phosphorylation of immunoprecipitated (IP) Src in siRNA-treated HUVECs. Bottom panels show levels of CD36 and GAPDH (loading control). N = 3 for all treatments. (C) Quantitation of immunoblots for levels of EphB4, CAV1, pCAV1, CD36, pSrc/Src and ratio of pSrc/Src/ input. N = 3 for all treatments. Data represented as mean ± s.e.m. P values calculated by ordinary one-way ANOVA with Sidak’s multiple comparisons test. (D) Confocal images of siRNA-transfected HUVECs stained with CAV1 or pCAV1 (red), GM130 (green), VE-Cadherin (CDH5; white) and nuclei (DAPI; blue). Bottom panels show surface CD36 (red), Phalloidin (white), and nuclei (DAPI; blue). (E) Quantitation of CAV1, pCAV1 and CD36 MFI per whole cell and of surface CD36 signal of immunostained HUVECs, as shown in (D). N = 3 experiments for CAV1 and pCAV1, in each of them 30 cells were quantified from three images (10 cells/ image). N=3 for CD36 surface staining, in which three images/experiment were quantified for all siRNA conditions. Data represented as mean ± s.e.m. P values calculated by ordinary one-way ANOVA with Sidak’s multiple comparisons test. MFI, mean fluorescence intensity; ns, not significant.
-
Figure 7—source data 1
Source data for Figure 7C.
- https://cdn.elifesciences.org/articles/45863/elife-45863-fig7-data1-v1.xlsx
-
Figure 7—source data 2
Source data for Figure 7E.
- https://cdn.elifesciences.org/articles/45863/elife-45863-fig7-data2-v1.xlsx
Figure 7—figure supplement 1
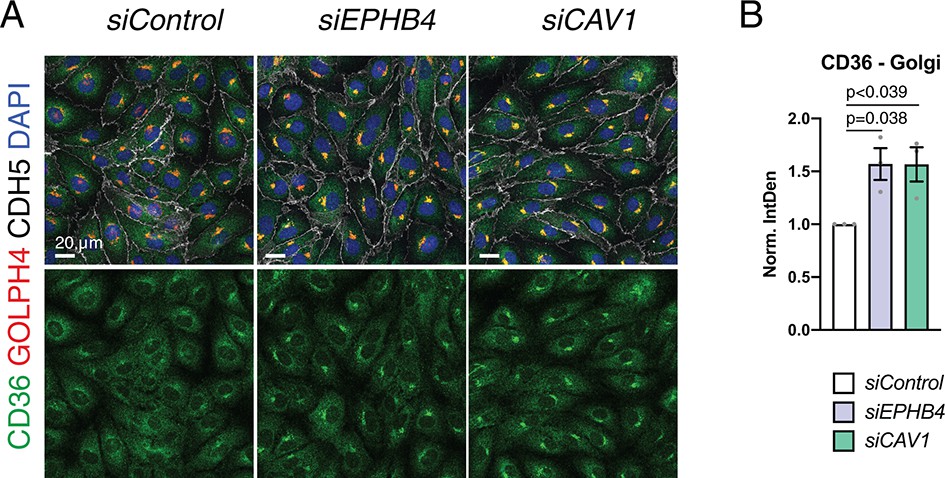
CD36 localization in EPHB4 and CAV1 knockdown HUVECs.
(A) Confocal images of siRNA-transfected HUVECs stained with CD36 (green), Golgi (GOLPH4, red), VE-Cadherin (CDH5, white) and nuclei (DAPI; blue). (B) Quantitation of CD36 signals localized to Golgi area of immunostained HUVECs, as shown in (A). N = 3 experiments, in each of them 30 cells were quantified from three images (10 cells/ image) for all knockdown conditions. Data represented as mean ± s.e.m. P values calculated by ordinary one-way ANOVA with Sidak’s multiple comparisons test. Norm. IntDen, normalized integrated density.
-
Figure 7—figure supplement 1—source data 1
Source data for Figure 7—figure supplement 1B.
- https://cdn.elifesciences.org/articles/45863/elife-45863-fig7-figsupp1-data1-v1.xlsx
Figure 8 with 1 supplement
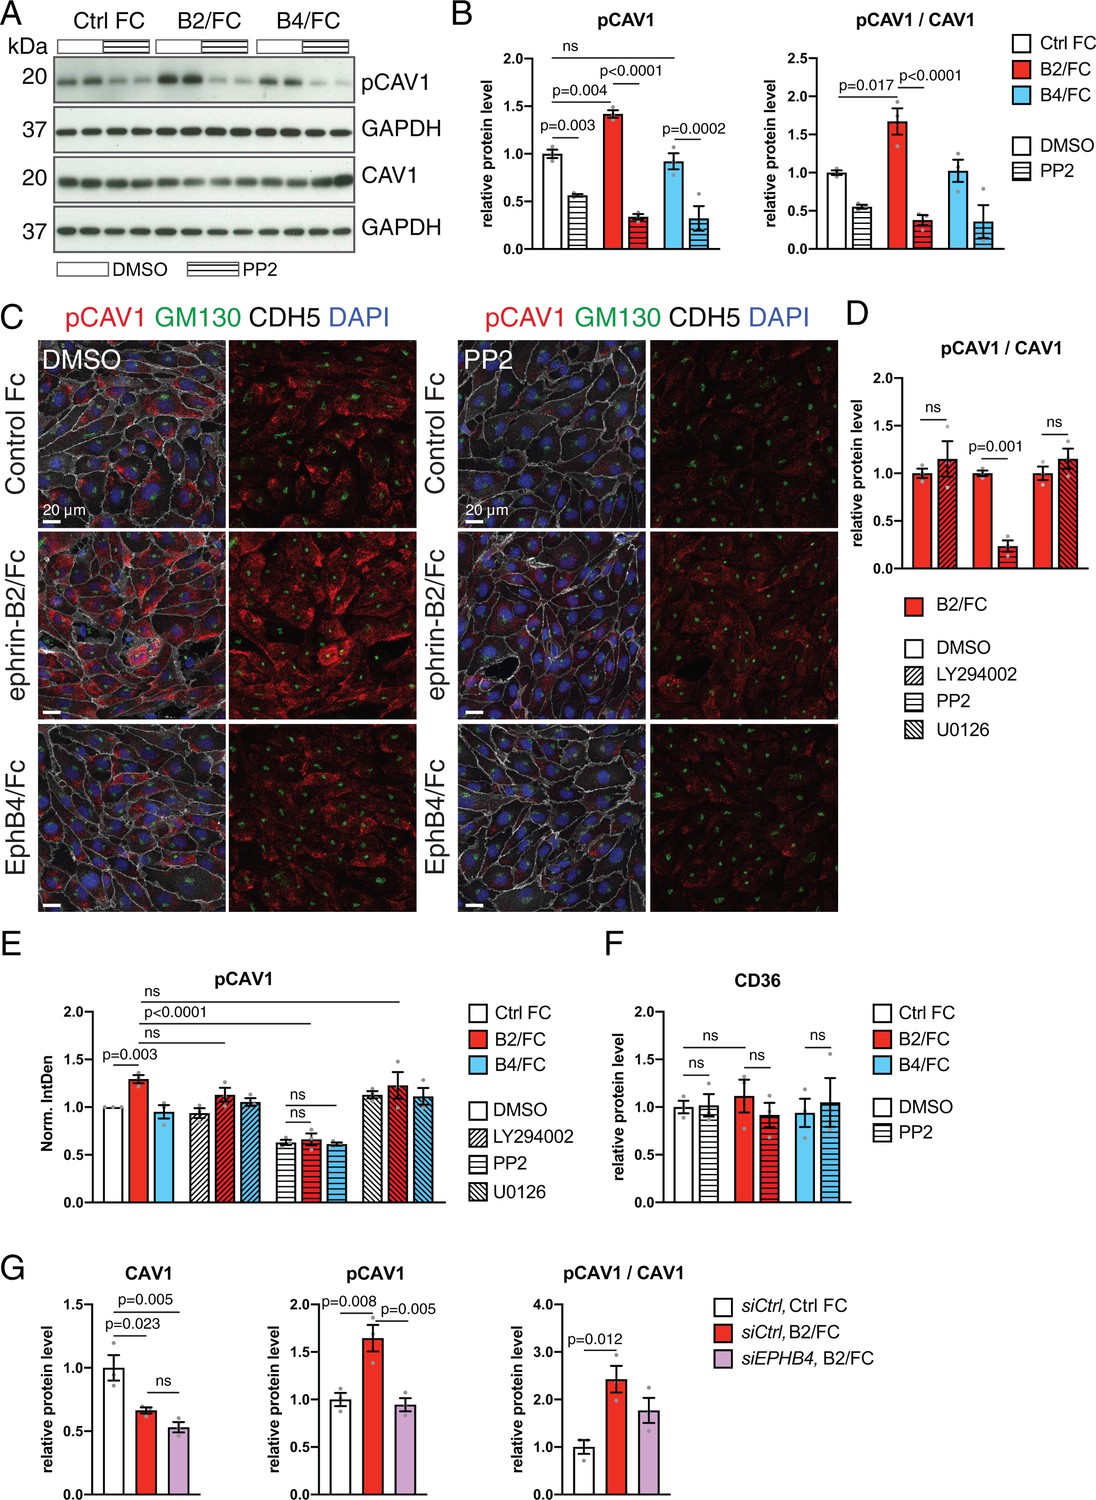
EphB4 activation induces Src-dependent phosphorylation via Src.
(A) Western blot analysis of CAV1 and pCAV1 levels in HUVECs stimulated with control human IgG/Fc (Ctrl Fc), ephrin-B2/Fc (B2/Fc) or EphB4/Fc (B4/Fc) (4 µg/ml, preclustered with 10µg/ml goat anti-human IgG) in combination with DMSO (vehicle control) or the Src inhibitor PP2. GAPDH is shown as loading control. (B, F) Quantitation of Western blots results (see A) for pCAV1 together with the ratio pCAV1/CAV1 (B) and levels of CD36 (F). N = 3 for all treatments. Data represented as mean ± s.e.m. P values calculated by ordinary one-way ANOVA with Sidak’s multiple comparisons test. (C) Confocal images of HUVECs after stimulation with Fc proteins in combination with DMSO or PP2. Stainings show pCAV1 (red), GM130 (green), CDH5 (white) and DAPI (blue). (D) Ratio of pCAV1/CAV1 in lysates from HUVECs treated with ephrin-B2/Fc in combination with DMSO (vehicle control) or the indicated inhibitors (LY294002, PP2 and U0126). N = 3 for all treatments. Data represented as mean ± s.e.m. P values calculated by unpaired two-tailed t test with Welch’s correction. (E) Quantitation of pCAV1 immunosignal per cell (as shown in C) of HUVECs stimulated with Fc proteins along with inhibitor treatment. N = 3 experiments, in each of them 30 cells were quantified from three images (10 cells/ image) for all treatments. Data represented as mean ± s.e.m. P values calculated by ordinary one-way ANOVA test. (G) Quantitation of normalized CAV1, pCAV1 and pCAV1/CAV1 in immunoblotted lysates from HUVECs treated with control siCtrl or siEPHB4 in combination with Ctrl Fc or ephrin-B2/Fc (B2/Fc). N = 3 for all conditions. Data represented as mean ± s.e.m. P values calculated by ordinary one-way ANOVA. Norm. IntDen, normalized integrated density; ns, not significant.
-
Figure 8—source data 1
Source data for Figure 8B,F.
- https://cdn.elifesciences.org/articles/45863/elife-45863-fig8-data1-v1.xlsx
-
Figure 8—source data 2
Source data for Figure 8D.
- https://cdn.elifesciences.org/articles/45863/elife-45863-fig8-data2-v1.xlsx
-
Figure 8—source data 3
Source data for Figure 8E.
- https://cdn.elifesciences.org/articles/45863/elife-45863-fig8-data3-v1.xlsx
-
Figure 8—source data 4
Source data for Figure 8G.
- https://cdn.elifesciences.org/articles/45863/elife-45863-fig8-data4-v1.xlsx
Figure 8—figure supplement 1
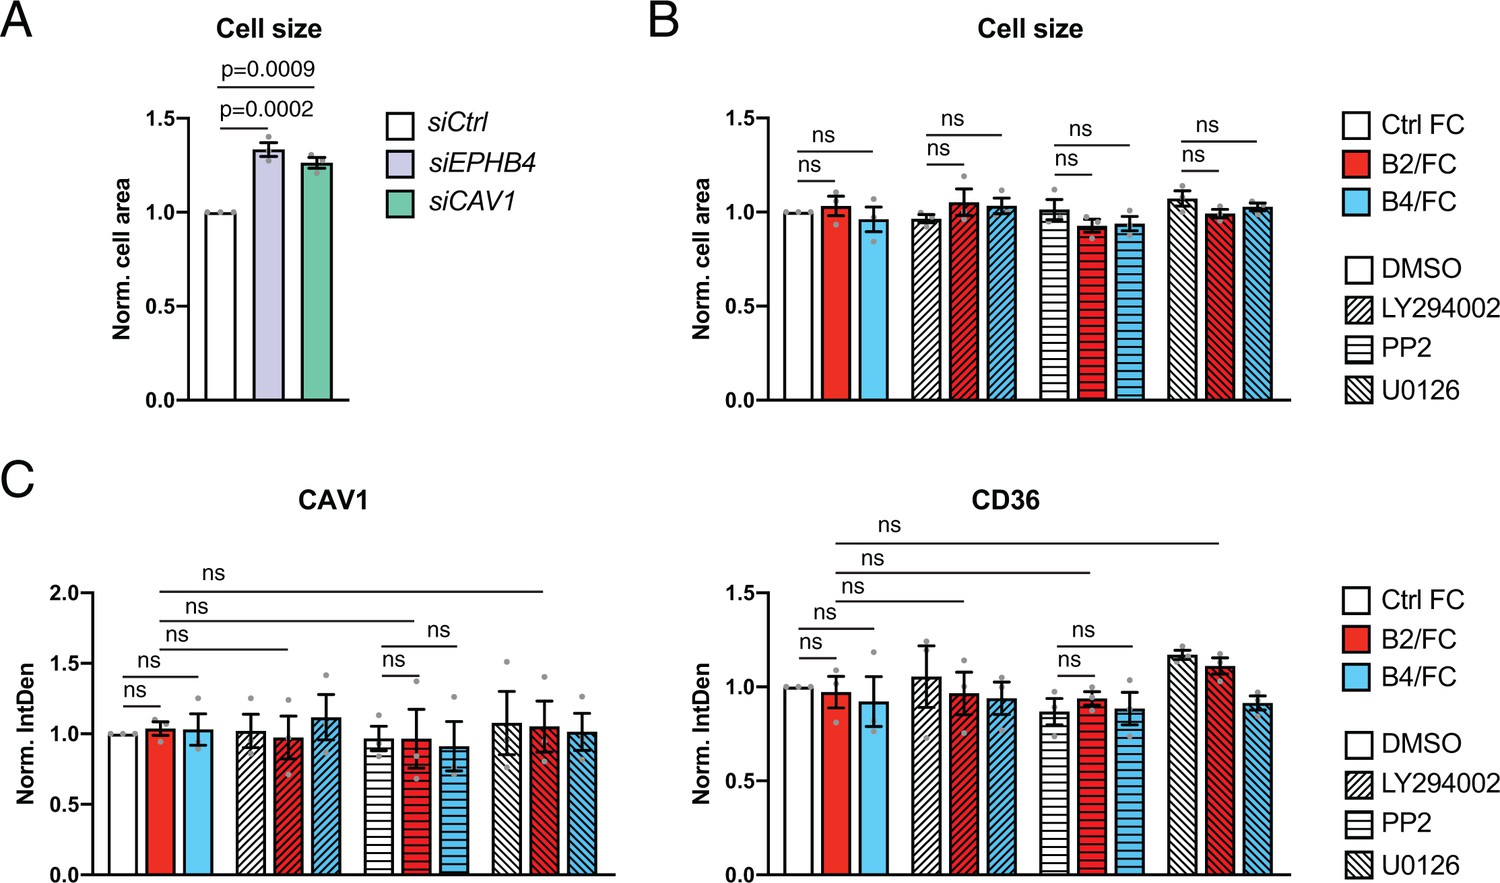
Effect of Akt, ERK and Src inhibition on CAV1 and CD36 localization in stimulated HUVECs.
(A, B) Cell area quantitation of HUVECs transfected with siControl, siEPHB4 or siCAV1 (A) and HUVECs stimulated with control human IgG/Fc (Ctrl Fc), human ephrin-B2/Fc (B2/Fc) or mouse EphB4/Fc (B4/Fc) in combination with DMSO or inhibitors (LY294002, U0126 and PP2) (B). N = 3 experiments, in each of them 30 cells were quantified from three images (10 cells/ image) for all treatments. (C) Quantitation of CAV1 and CD36 immunosignal per whole cell stimulated with Ctrl Fc, B2/Fc or B4/Fc (4 µg/ml, preclustered with 10 µg/ml human IgG) in combination with DMSO or inhibitors (LY294002, U0126 and PP2) for 30 min. N = 3 experiments, in each of them 30 cells were quantified from three images (10 cells/ image) for all treatments. Data represented as mean ± s.e.m. P values calculated by ordinary one-way ANOVA with Sidak’s multiple comparisons test. Norm. IntDen, normalized integrated density; ns, not significant.
-
Figure 8—figure supplement 1—source data 1
Source data for Figure 8—figure supplement 1A,B.
- https://cdn.elifesciences.org/articles/45863/elife-45863-fig8-figsupp1-data1-v1.xlsx
-
Figure 8—figure supplement 1—source data 2
Source data for Figure 8—figure supplement 1C.
- https://cdn.elifesciences.org/articles/45863/elife-45863-fig8-figsupp1-data2-v1.xlsx
Figure 9 with 2 supplements
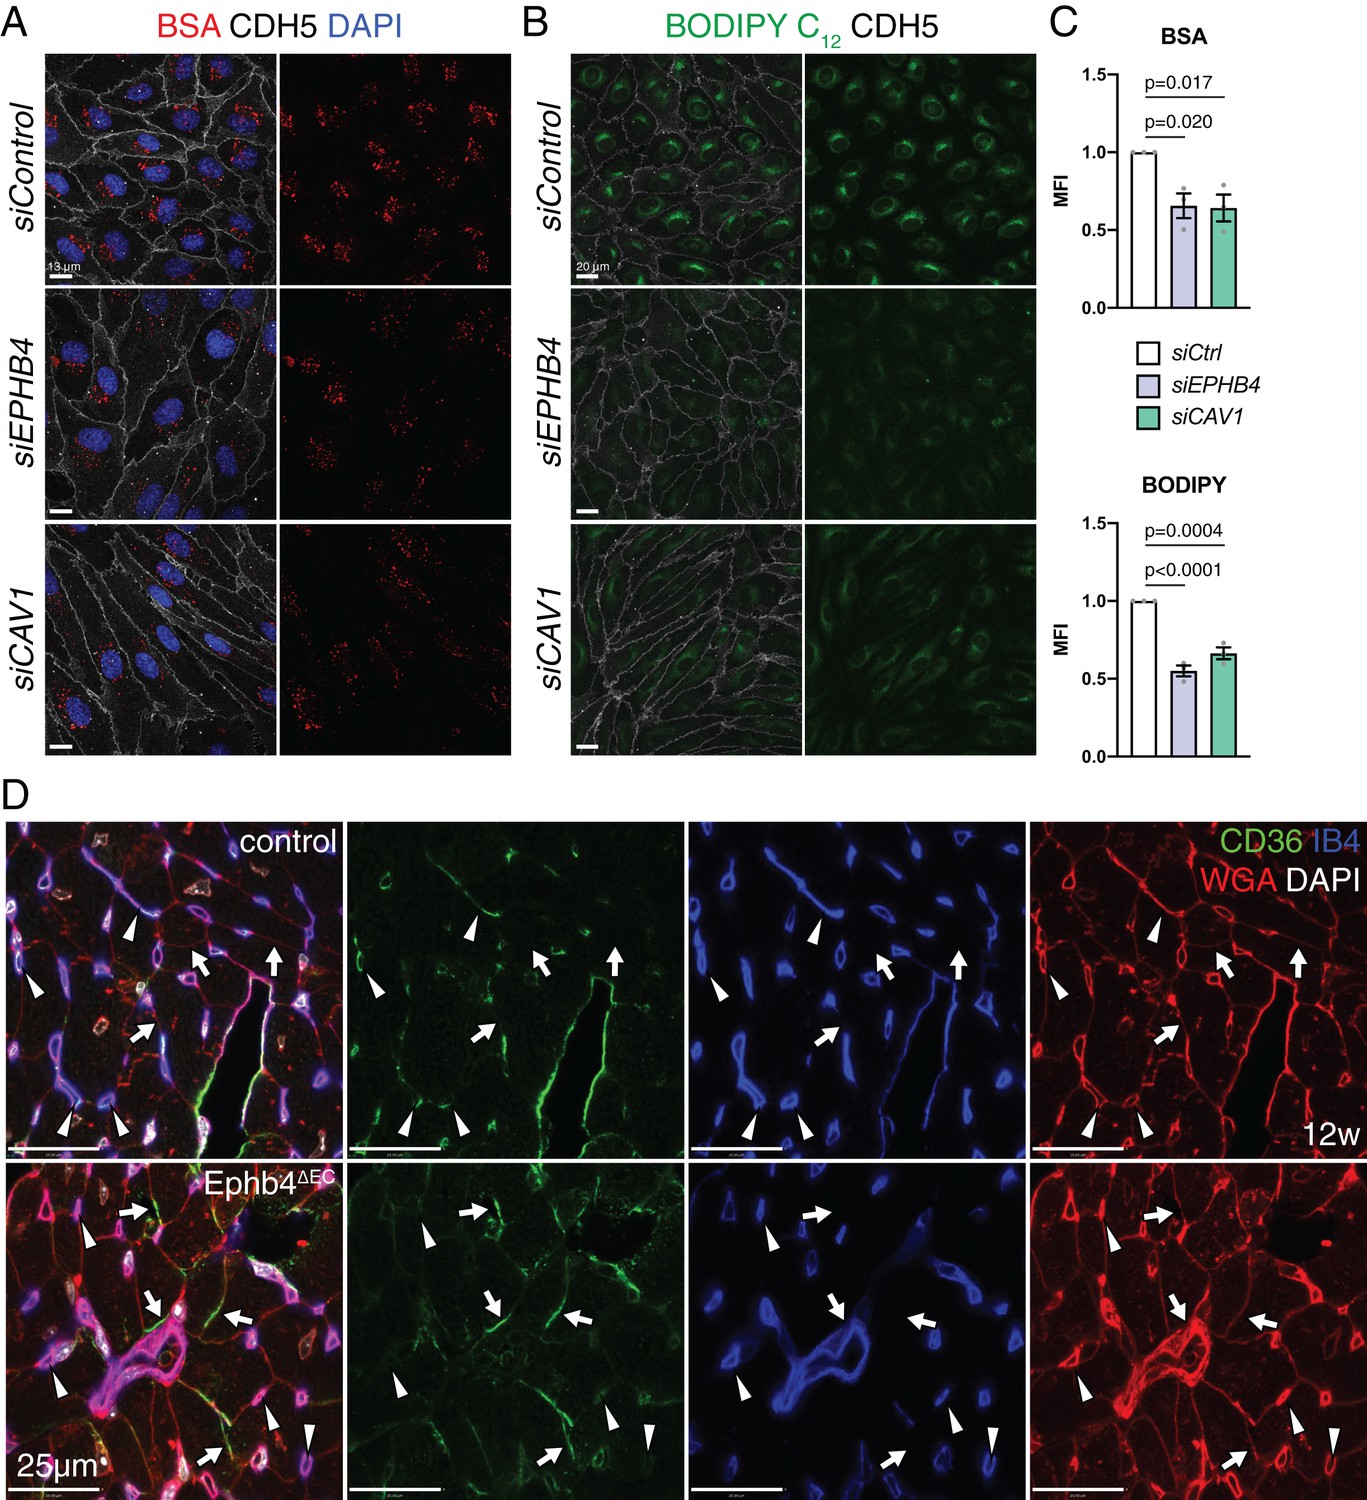
EphB4 is required for caveolar transport.
(A) Confocal images of HUVECs transfected siControl, siEPHB4 and siCAV1. Cells were fixed 30 min after exposure to BSA-555 (red) and immunostained with anti-CDH5 (white) antibody and DAPI (nuclei, blue). (B) Confocal images of siControl, siEPHB4 and siCAV1 HUVEC cells fixed after 30 min of treatment with BODIPY C12-500/510 (green) and immunostained for CDH5 (white). (C) Quantitation of BSA-555 (top) and BODIPY C12-500/510 (bottom) MFI per cell in siControl, siEPHB4 and siCAV1 HUVECs. Note reduced uptake of BSA and BODIPY in siEPHB4 and siCAV1 cells. N = 3 experiments, in each of them 30 cells were quantified from three images (10 cells/ image) for all knockdown conditions. Data represented as mean ± s.e.m. P values calculated by ordinary one-way ANOVA test. (D) CD36 expression in 12 week-old control and Ephb4∆EC sectioned heart. Panels show details of the inner part of the left ventricle. CD36 immunosignal is reduced in mutant capillaries (arrowheads) but increased in the membrane of cardiomyocytes (arrows). MFI, mean fluorescence intensity.
-
Figure 9—source data 1
Source data for Figure 9C.
- https://cdn.elifesciences.org/articles/45863/elife-45863-fig9-data1-v1.xlsx
Figure 9—figure supplement 1
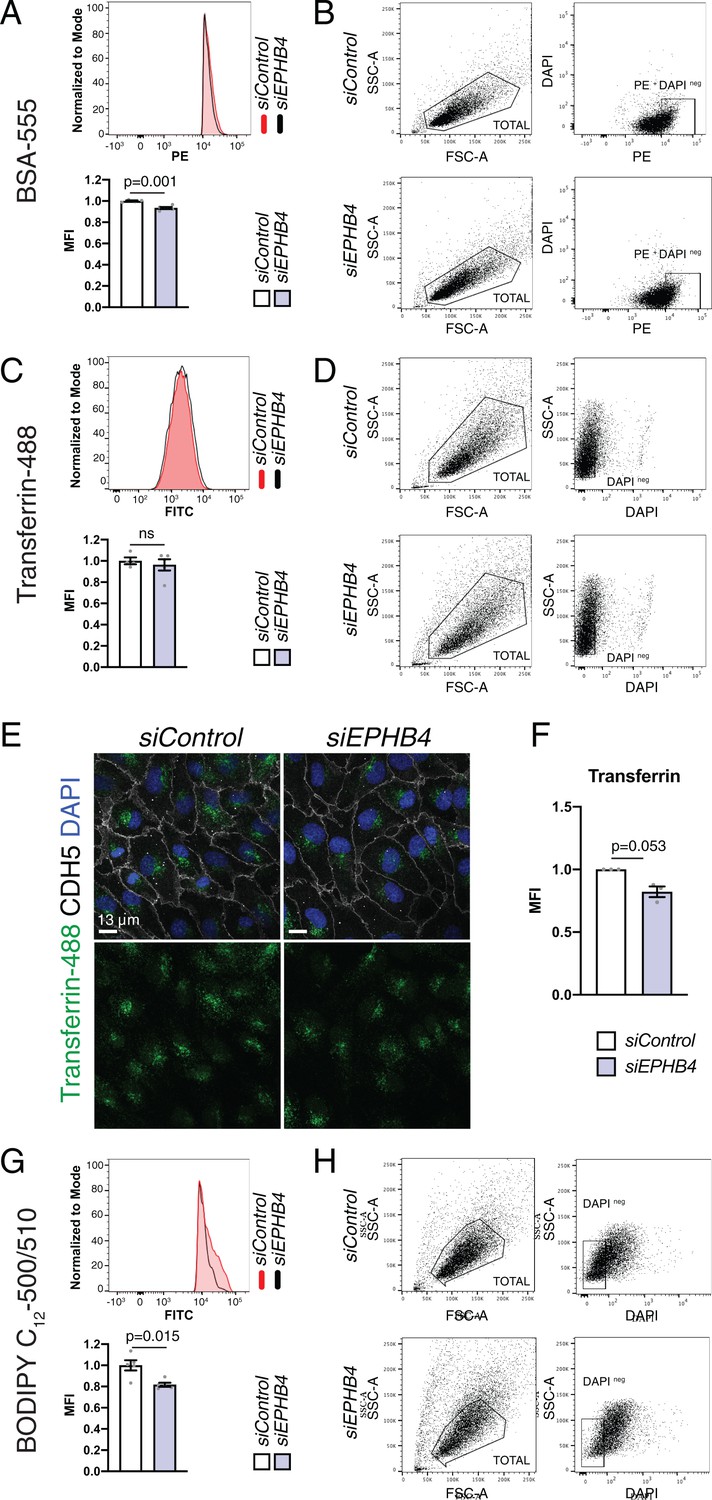
BSA, transferrin and BODIPY uptake in HUVECs.
(A, B) Flow cytometric analysis of Alexa Fluor 555 dye-conjugated bovine serum albumin (BSA-555) uptake by HUVECs transfected with siControl and siEPHB4 (A). N = 5 for both conditions. Data represented as mean ± s.e.m. P values calculated by unpaired two-tailed t test with Welch’s correction. (B) FACS gating strategy for data shown in (A). DAPI negative (intact), Phycoerythrin (PE)-positive cells were used for analysis. (C, D) Caveolae-independent uptake of Alexa Fluor 488 dye-conjugated Transferrin, measured by flow cytometry, is comparable in HUVECs transfected with siControl and siEPHB4 (C). N = 5 for both conditions. Data represented as mean ± s.e.m. P values calculated by unpaired two-tailed t test with Welch’s correction. (D) Gating strategy corresponding to (C). DAPI negative cells were used for analysis. (E) Confocal images of HUVEC cells transfected with siControl and siEPHB4. Cells were fixed after 30 min of exposure to Transferrin-488 (green) and stained for CDH5 (white) and with DAPI (nuclei, blue). (F) Quantitation of Transferrin-488 uptake per cell in siControl and siEPHB4 HUVECs. N = 3 experiments, in each of them 30 cells were quantified from three images (10 cells/ image) for both conditions. Data represented as mean ± s.e.m. P values calculated by unpaired two-tailed t test with Welch’s correction. (G, H) Uptake of BODIPY C12-500/510 by HUVECs transfected with siControl or siEPHB4. BODIPY uptake, measured by flow cytometry, is reduced in siEPHB4 cells (G). Data represented as mean ± s.e.m. P values calculated by unpaired two-tailed t test with Welch’s correction. (H) Gating strategy for BODIPY uptake corresponding to (G). DAPI negative cells were used for analysis. MFI, mean fluorescence intensity; ns, not significant.
-
Figure 9—figure supplement 1—source data 1
Source data for Figure 9—figure supplement 1A,C,F,G.
- https://cdn.elifesciences.org/articles/45863/elife-45863-fig9-figsupp1-data1-v1.xlsx
Figure 9—figure supplement 2
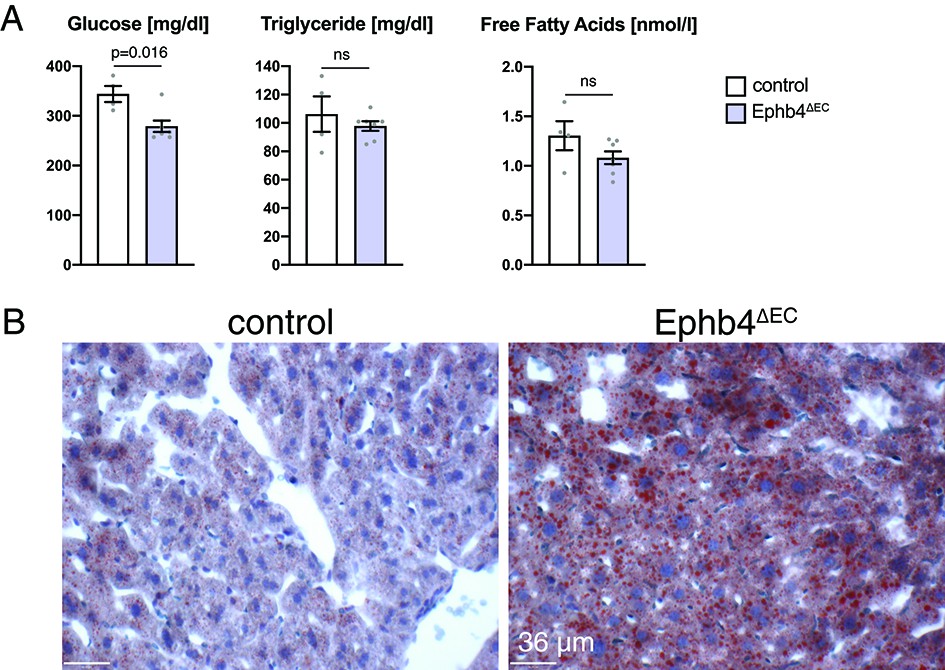
Metabolic features of Ephb4∆EC mice.
(A) Analysis of plasma from Ephb4∆EC mutants and control mice. Glucose concentration is reduced in mutants, whereas the concentrations of Triglycerides and Free fatty acids are unaltered. N = 4 for control and N = 7 for Ephb4∆EC. Each point represents a pool of two replicates. Data represented as mean ± s.e.m. P values calculated by unpaired two-tailed t test with Welch’s correction. (B) Oil Red O staining of histological sections of Ephb4∆EC and control livers. Mutant mice show accumulation of fat (red signal) in liver. Sections were counterstained with hematoxylin. ns, not significant.
-
Figure 9—figure supplement 2—source data 1
Source data for Figure 9—figure supplement 2A.
- https://cdn.elifesciences.org/articles/45863/elife-45863-fig9-figsupp2-data1-v1.xlsx
Figure 10
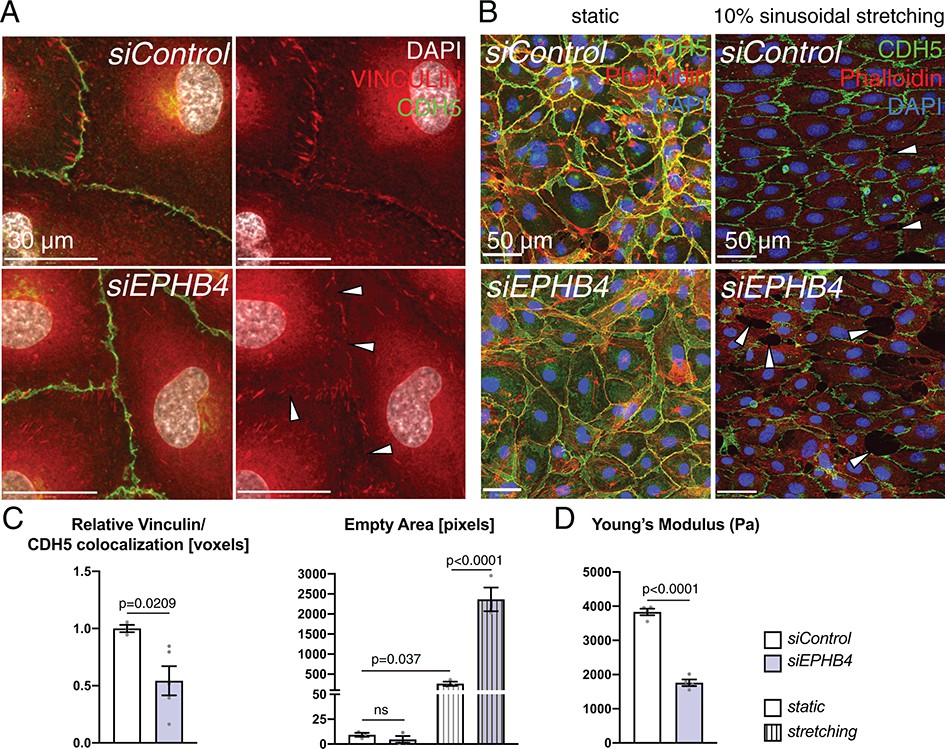
EphB4 is required for endothelial integrity.
(A) Immunohistochemistry of cultured HUVECs. Relative colocalization of Vinculin and CDH5 is reduced in the cell contact area (arrowheads) of siEPHB4 cells. (B) Mechanical stress assay on cultured HUVECs transfected with siEPHB4. Cells are able to form a monolayer on a membrane under static conditions. Sinusoidal stretch of the membrane disrupts the monolayer, as measured by the increase of empty area in siEPHB4 HUVEC cells (arrowheads) (C). (C) Quantitation of relative colocalization of Vinculin and CDH5 (left). N = 3 for siControl and N = 5 for siEPHB4. Quantitation of the empty area between siControl and siEPHB4 HUVECs in static conditions or with stretching (right). N = 3. Data represented as mean ± s.e.m. P value calculated by unpaired two-tailed t test with Welch’s correction (left) or ordinary one-way ANOVA with Sidak’s multiple comparisons test (right). (D) Atomic force microscopy analysis of cell stiffness. Young’s modulus is reduced in siEPHB4 cells. Each dish contains three force maps that equal 768 force-distance curves. Studied areas (150 × 150 µm) contain 10–16 cells. In between 16 and 25 force-distance curves were measured per cell. N = 4 areas. Data represented as mean ± s.e.m. P values calculated by unpaired two-tailed t test with Welch’s correction. ns, not significant.
-
Figure 10—source data 1
Source data for Figure 10C,D.
- https://cdn.elifesciences.org/articles/45863/elife-45863-fig10-data1-v1.xlsx
Additional files
-
Supplementary file 1
Key Resources Table.
List of all the materials and resources used.
- https://cdn.elifesciences.org/articles/45863/elife-45863-supp1-v1.docx
-
Transparent reporting form
- https://cdn.elifesciences.org/articles/45863/elife-45863-transrepform-v1.docx
Download links
A two-part list of links to download the article, or parts of the article, in various formats.
Downloads (link to download the article as PDF)
Open citations (links to open the citations from this article in various online reference manager services)
Cite this article (links to download the citations from this article in formats compatible with various reference manager tools)
Endothelial EphB4 maintains vascular integrity and transport function in adult heart
eLife 8:e45863.
https://doi.org/10.7554/eLife.45863


