Silicone oil-induced ocular hypertension and glaucomatous neurodegeneration in mouse
- Stanford University School of Medicine, United States
- Union Hospital, Huazhong University of Science & Technology, China
- The Second Xiangya Hospital, Central South University, China
- Veterans Affairs Palo Alto Health Care, United States
Figures
Figure 1 with 1 supplement
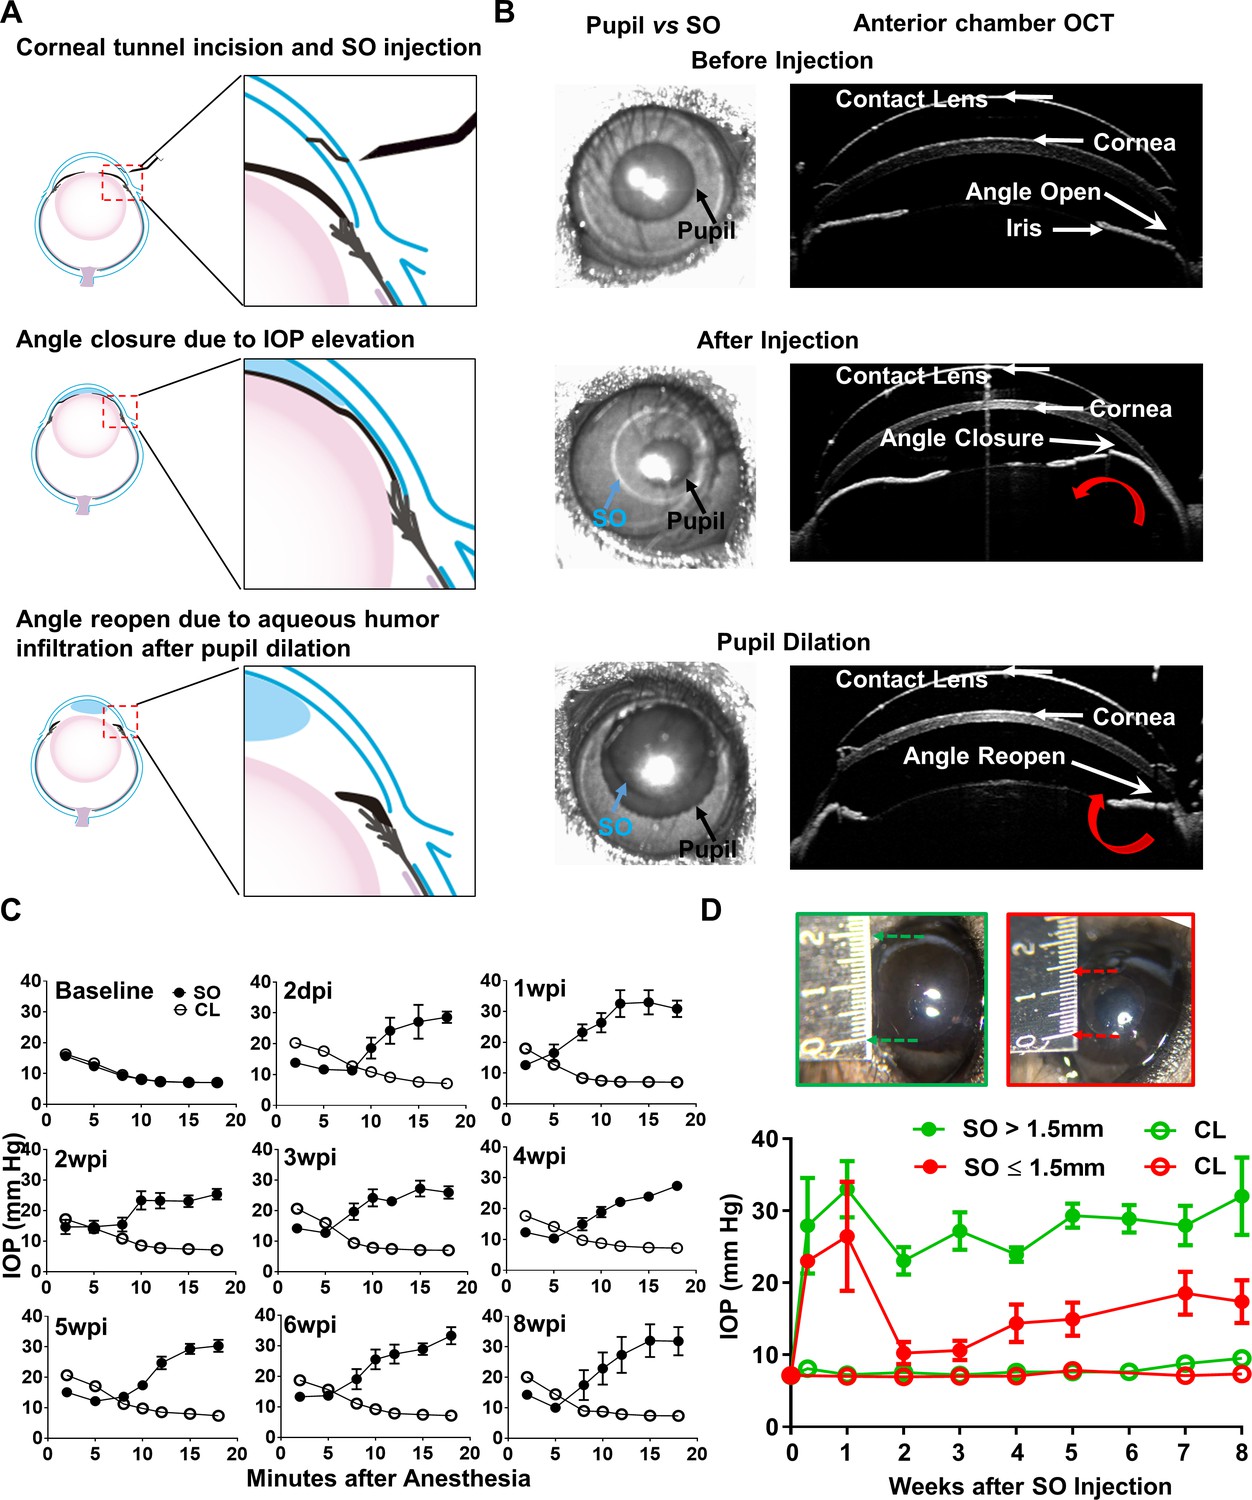
Silicone oil-induced ocular hypertension under-detected (SOHU) mouse model.
(A) Cartoon illustration of SO intracameral injection, pupillary block, closure of the anterior chamber angle, and reopening of the angle of anterior chamber after pupil dilation. (B) Representative anterior chamber OCT images of SOHU eyes in living animals showing the relative size of SO droplet (blue arrow) to pupil (black arrow) and the corresponding closure or opening of the anterior chamber angle before and after pupil dilation. Red curved arrow indicates the direction of aqueous humor flow. (C) Longitudinal IOP measurements at different time points before and after SO injection, and continuous measurements for 18 min after anesthesia with isoflurane at each time point. (D) The sizes of SO droplet and corresponding IOP measurements at different time points after SO injection; IOP measured 12–15 min after anesthesia. SO: SO injected eyes; CL: contralateral control eyes. Data are presented as means ± s.e.m, SO > 1.5 mm, n = 17; SO ≤ 1.5 mm, n = 6.
Figure 1—figure supplement 1
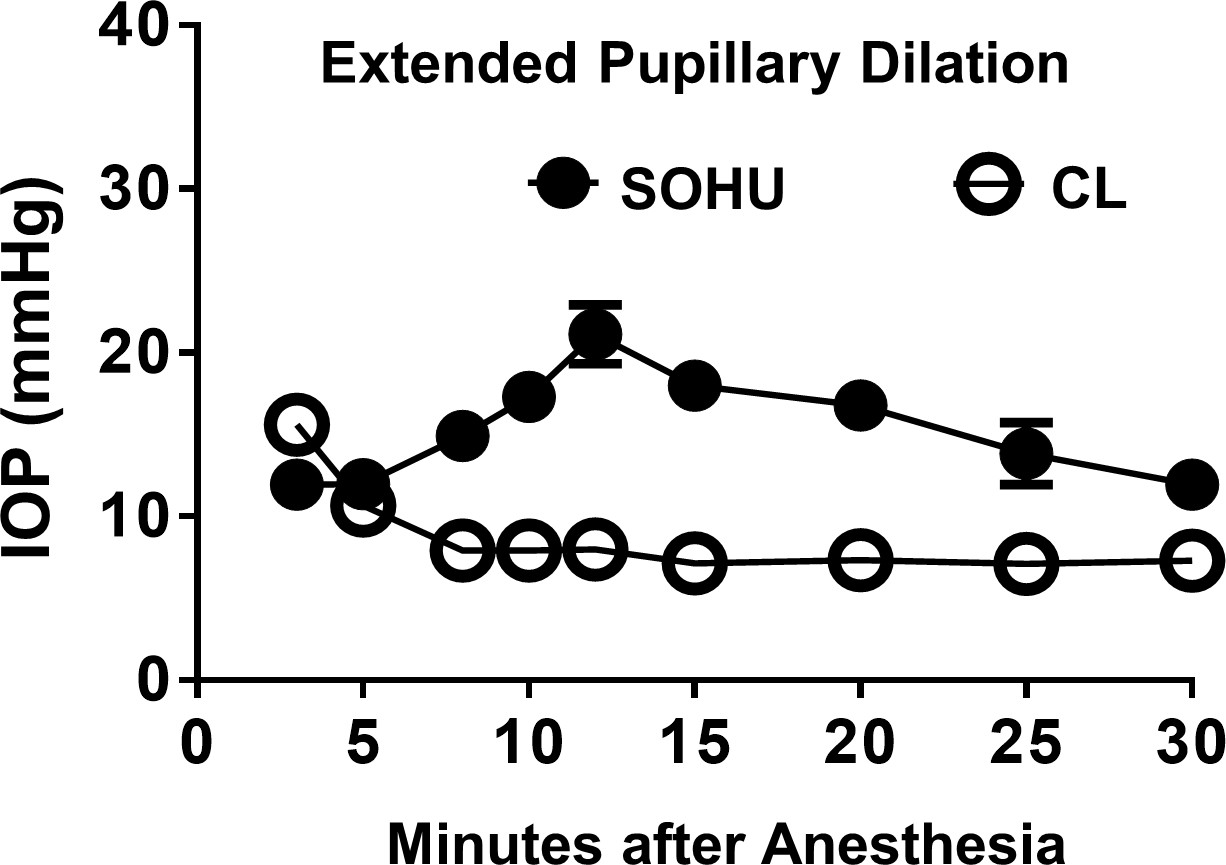
Extended pupillary dilation lowers down IOP in the SOHU eyes.
Longitudinal IOP measurements at different time points after induction of anesthesia, and continuous measurements for 30 min. Data are presented as means ± s.e.m, n = 7.
Figure 2
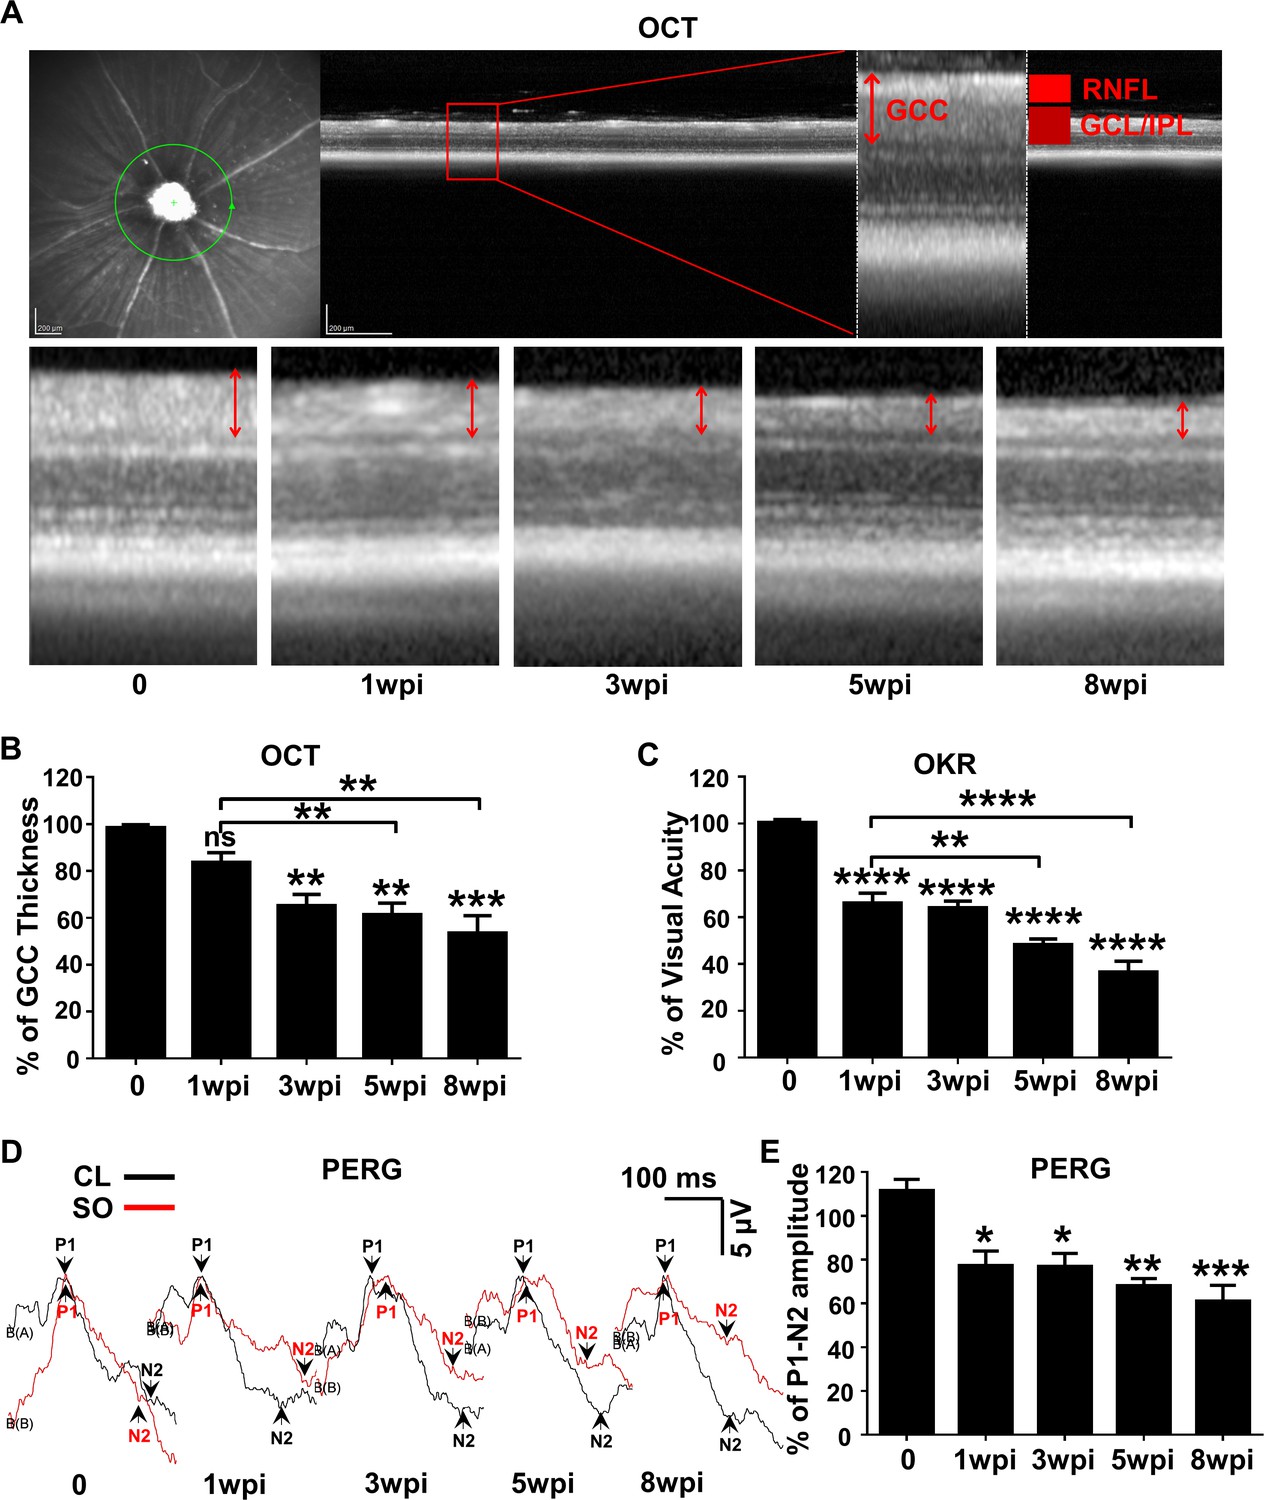
Dynamic changes in RGC morphology and visual function in living SOHU animals.
(A) Representative OCT images of mouse retina. Green circle indicates the OCT scan area surrounding ON head. GCC: ganglion cell complex, including RNFL, GCL and IPL layers; indicated by double end arrows. (B) Quantification of GCC thickness, represented as percentage of GCC thickness in the SO eyes, compared to the CL eyes. n = 10–20. (C) Visual acuity measured by OKR, represented as percentage of visual acuity in the SO eyes, compared to the CL eyes. n = 10–20. (D) Representative waveforms of PERG in the contralateral control (CL, black lines) and the SO injected (SO, red lines) eyes at different time points after SO injection. P1: the first positive peak after the pattern stimulus; N2: the second negative peak after the pattern stimulus. (E) Quantification of P1-N2 amplitude, represented as percentage of P1-N2 amplitude in the SO eyes, compared to the CL eyes. n = 13–15. Data are presented as means ± s.e.m, *: p<0.05, **: p<0.01, ***: p<0.001, ****: p<0.0001, one-way ANOVA with Tukey’s multiple comparison test.
Figure 3
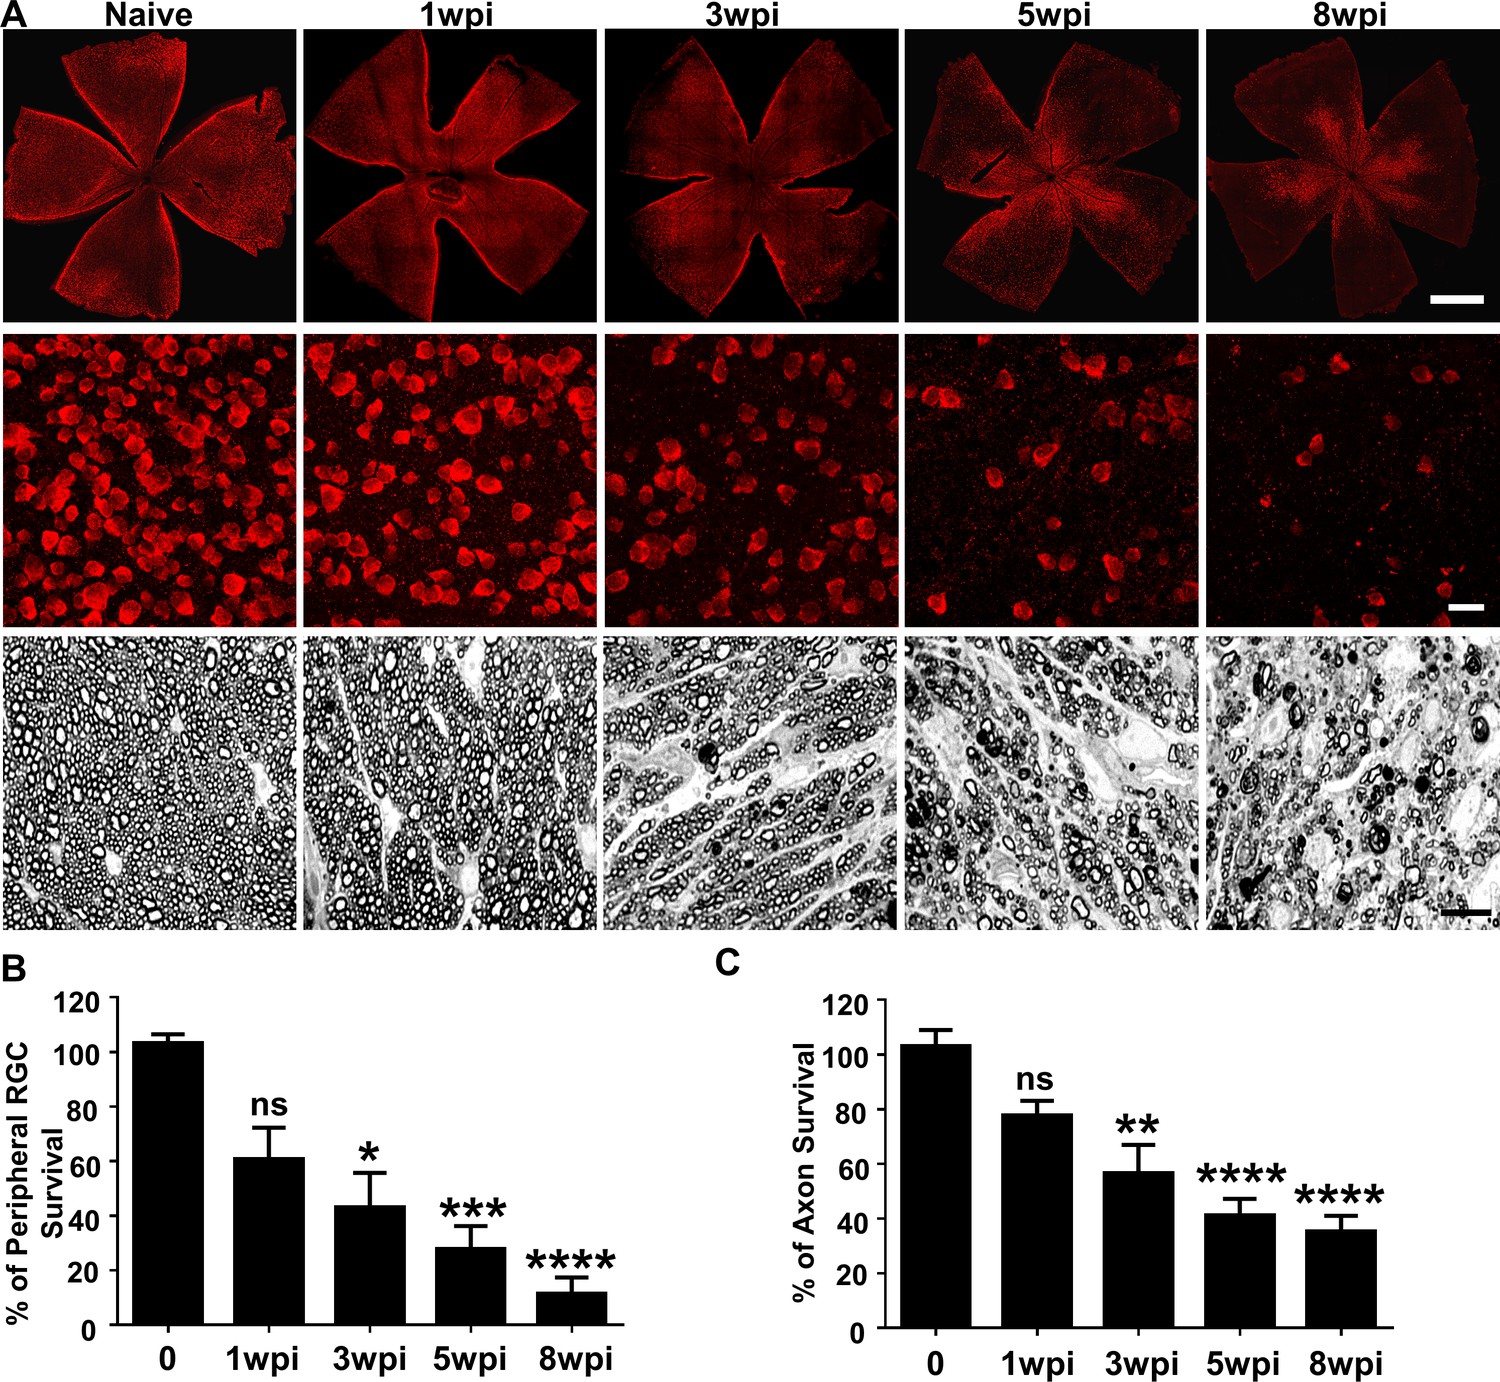
Glaucomatous RGC soma and axon degeneration in SOHU eyes.
(A) Upper panel, confocal images of whole flat-mounted retinas showing surviving RBPMS-positive (red) RGCs at different time points after SO injection. Scale bar, 100 µm. Middle panel, confocal images of a portion of flat-mounted retinas showing surviving RBPMS-positive (red) RGCs at different time points after SO injection. Scale bar, 20 µm. Lower panel, light microscope images of semi-thin transverse sections of ON stained with PPD at different time points after SO injection. Scale bar, 10 µm. (B,C) Quantification of surviving RGCs in the peripheral retina (n = 11–13) and surviving axons in ON (n = 10–16) at different time points after SO injection, represented as percentage of SO eyes compared to CL eyes. Data are presented as means ± s.e.m. *p<0.05, **p<0.01, ***: p<0.001, ****: p<0.0001; one-way ANOVA with Tukey’s multiple comparison test.
Figure 4
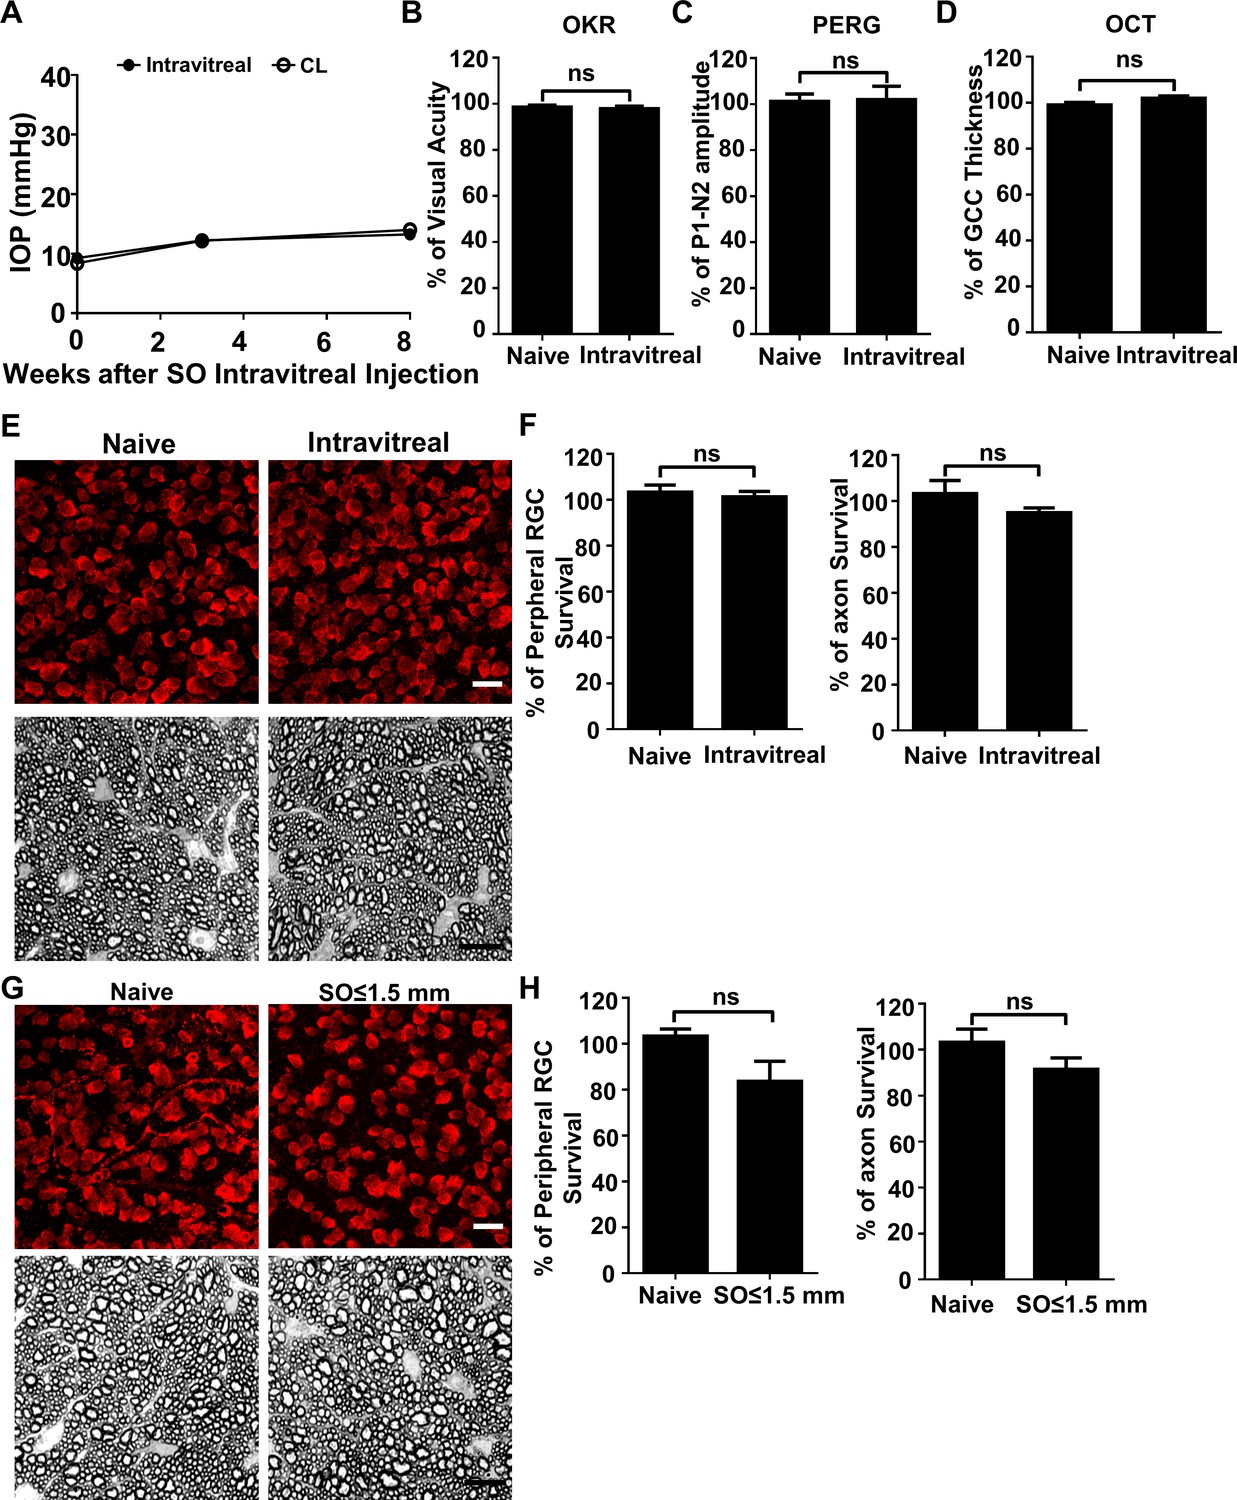
SO itself does not cause glaucomatous degeneration.
(A) IOP measurements at different time points after intravitreal SO injection. n = 15. (B) Visual acuity measured by OKR, represented as percentage of visual acuity in the SO eyes, compared to the CL eyes. n = 13–15. (C) Quantification of P1-N2 amplitude of PERG, represented as percentage of P1-N2 amplitude in the SO eyes, compared to the CL eyes. n = 12–15. (D) Quantification of GCC thickness measured by OCT, represented as percentage of GCC thickness in the SO eyes, compared to the CL eyes. n = 11–13. (E) Upper panel, confocal images of portions of flat-mounted retinas showing surviving RBPMS-positive (red) RGCs at 8wpi after intravitreal SO injection and contralateral naive eye. Scale bar, 20 µm. Lower panel, light microscope images of semi-thin transverse sections of ON stained with PPD at 8wpi after intravitreal SO injection and contralateral naive eye. Scale bar, 10 µm. (F) Quantification of surviving RGCs (n = 10) and surviving axons in ON (n = 10) at 8wpi after intravitreal SO injection, represented as percentage of SO eyes compared to the CL eyes. Data are presented as means ± s.e.m, Student t-test. (G) Upper panel, confocal images of portion of flat-mounted retinas showing surviving RBPMS positive (red) RGCs at 8wpi after intracameral SO injection (small size of SO droplet,≤1.5 mm) and contralateral naive eye. Scale bar, 20 µm. Lower panel, light microscope images of semi-thin transverse sections of ON stained with PPD at 8wpi after intracameral SO injection and contralateral naive eye. Scale bar, 10 µm. (H) Quantification of surviving RGCs (n = 12) and surviving axons in ON (n = 13) at 8wpi, represented as percentage of SO eyes compared to the CL eyes. Data are presented as means ± s.e.m, Student t-test.
Figure 5
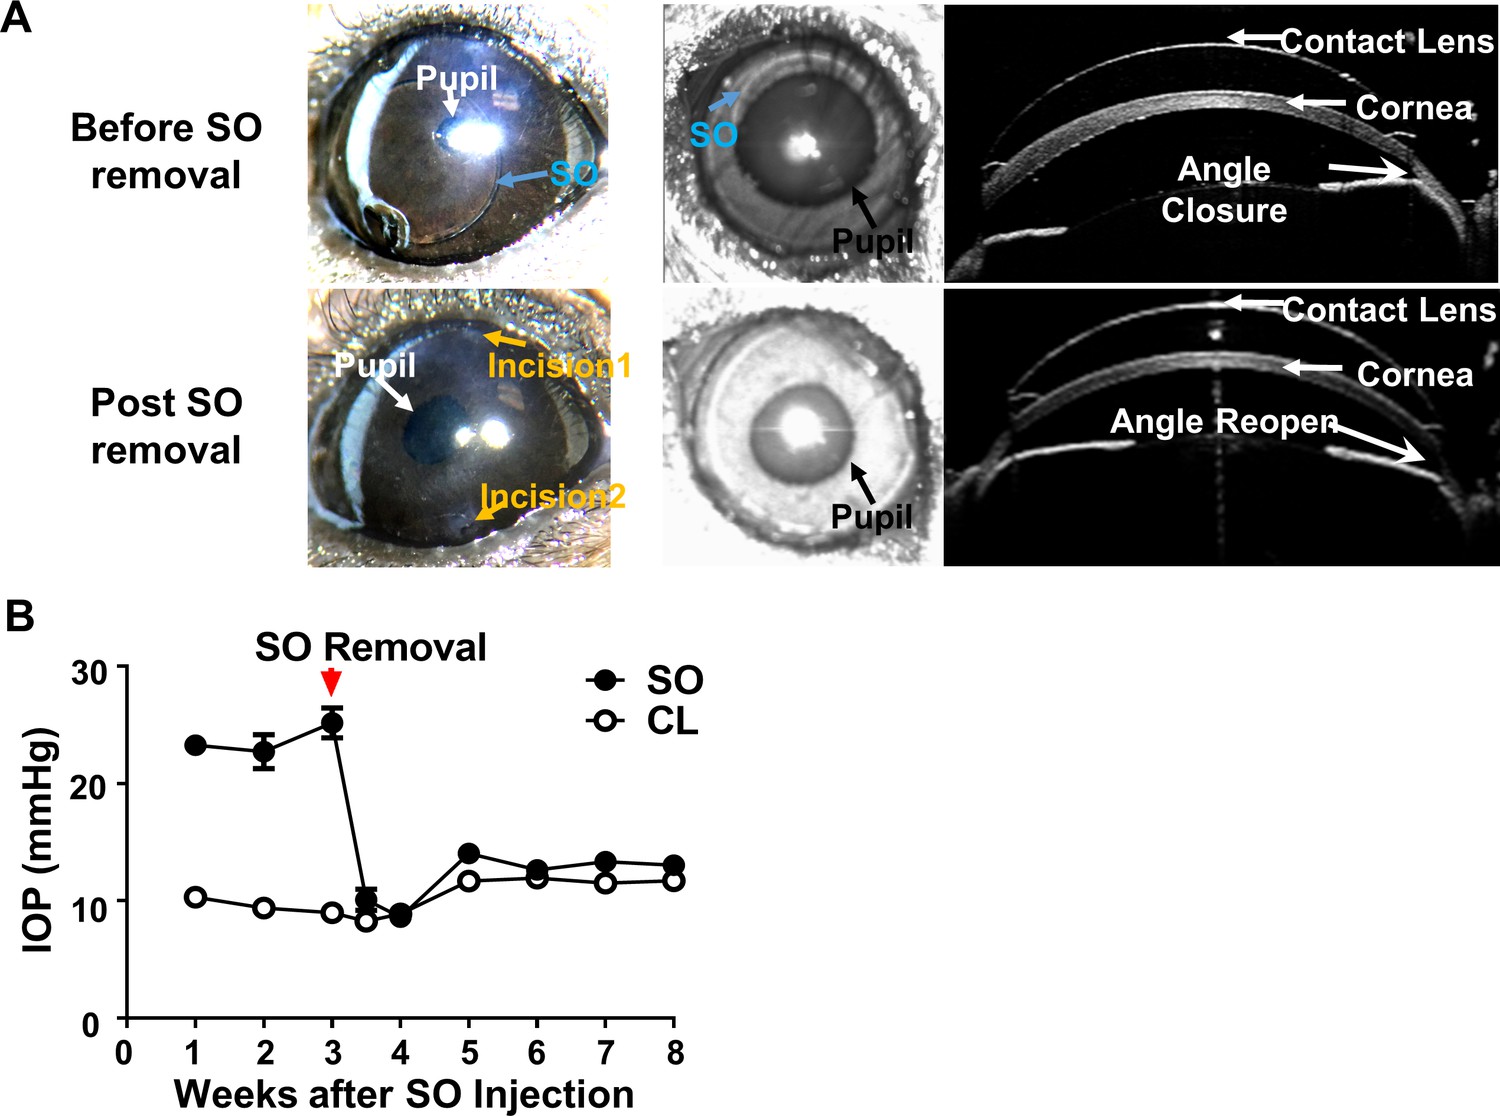
SOHU is reversible by SO removal.
(A) Representative images of SOHU eyes before and after SO removal, and anterior chamber OCT images in living animals showing the relative size of SO droplet to pupil and the corresponding closure or opening of the anterior chamber angle before and after SO removal. (B) IOP measurements before and after SO removal at different time points. n = 16.
Author response image 1
Author response image 2
Videos
Video 1
Intracameral SO injection.
Demonstration of the anterior chamber SO injection with a glass pippet and the SO droplet formation on top of iris to block pupil.
Video 2
Dye migration from vitreous chamber to anterior chamber in naïve eyes.
DiI injected into the posterior chamber of the naïve eye and migrated into the anterior chamber.
Video 3
Dye migration blocked in SOHU eyes.
DiI injected into the posterior chamber of the SOHU eye and there was no DiI detected in the anterior chamber.
Video 4
SO droplet flows away from pupil after dilation.
After pupil dilation, the SO droplet was pushed away from the pupil and iris by aqueous humor flooded into the anterior chamber.
Video 5
SO removal from SOHU eyes.
To remove SO from the anterior chamber, one needle is used to flush normal saline into the anterior chamber from one side of the cornea and another glass pippet was used to suck away the SO from the anterior chamber.
Tables
Key resources table
| Reagent type (species) or resource | Designation | Source or reference | Identifiers | Additional information |
|---|---|---|---|---|
| Strain, strain background (Mus musculus) | C57BL/6J | Jackson Laboratories | 000664 | |
| Antibody | anti-RBPMS (guinea pig polyclonal) | Custom-made by ProSci | 1:4000 | |
| Antibody | Cy3 Goat anti-Guinea Pig IgG | Jackson ImmunoResearch | 106-165-003 | 1:200 |
| Chemical compound, drug | Silicone oil | Alcon Laboratories | 1,000 mPa.s, Silikon | |
| Software, algorithm | Graphpad prism6 | GraphPad Software | ||
| Software, algorithm | Volocity software | Quorum Technologies |
Download links
A two-part list of links to download the article, or parts of the article, in various formats.
Downloads (link to download the article as PDF)
Open citations (links to open the citations from this article in various online reference manager services)
Cite this article (links to download the citations from this article in formats compatible with various reference manager tools)
Silicone oil-induced ocular hypertension and glaucomatous neurodegeneration in mouse
eLife 8:e45881.
https://doi.org/10.7554/eLife.45881


