PIE-scope, integrated cryo-correlative light and FIB/SEM microscopy
- Monash University, Australia
- University of Warwick, United Kingdom
- EMBL Australia, Australia
Figures
Figure 1
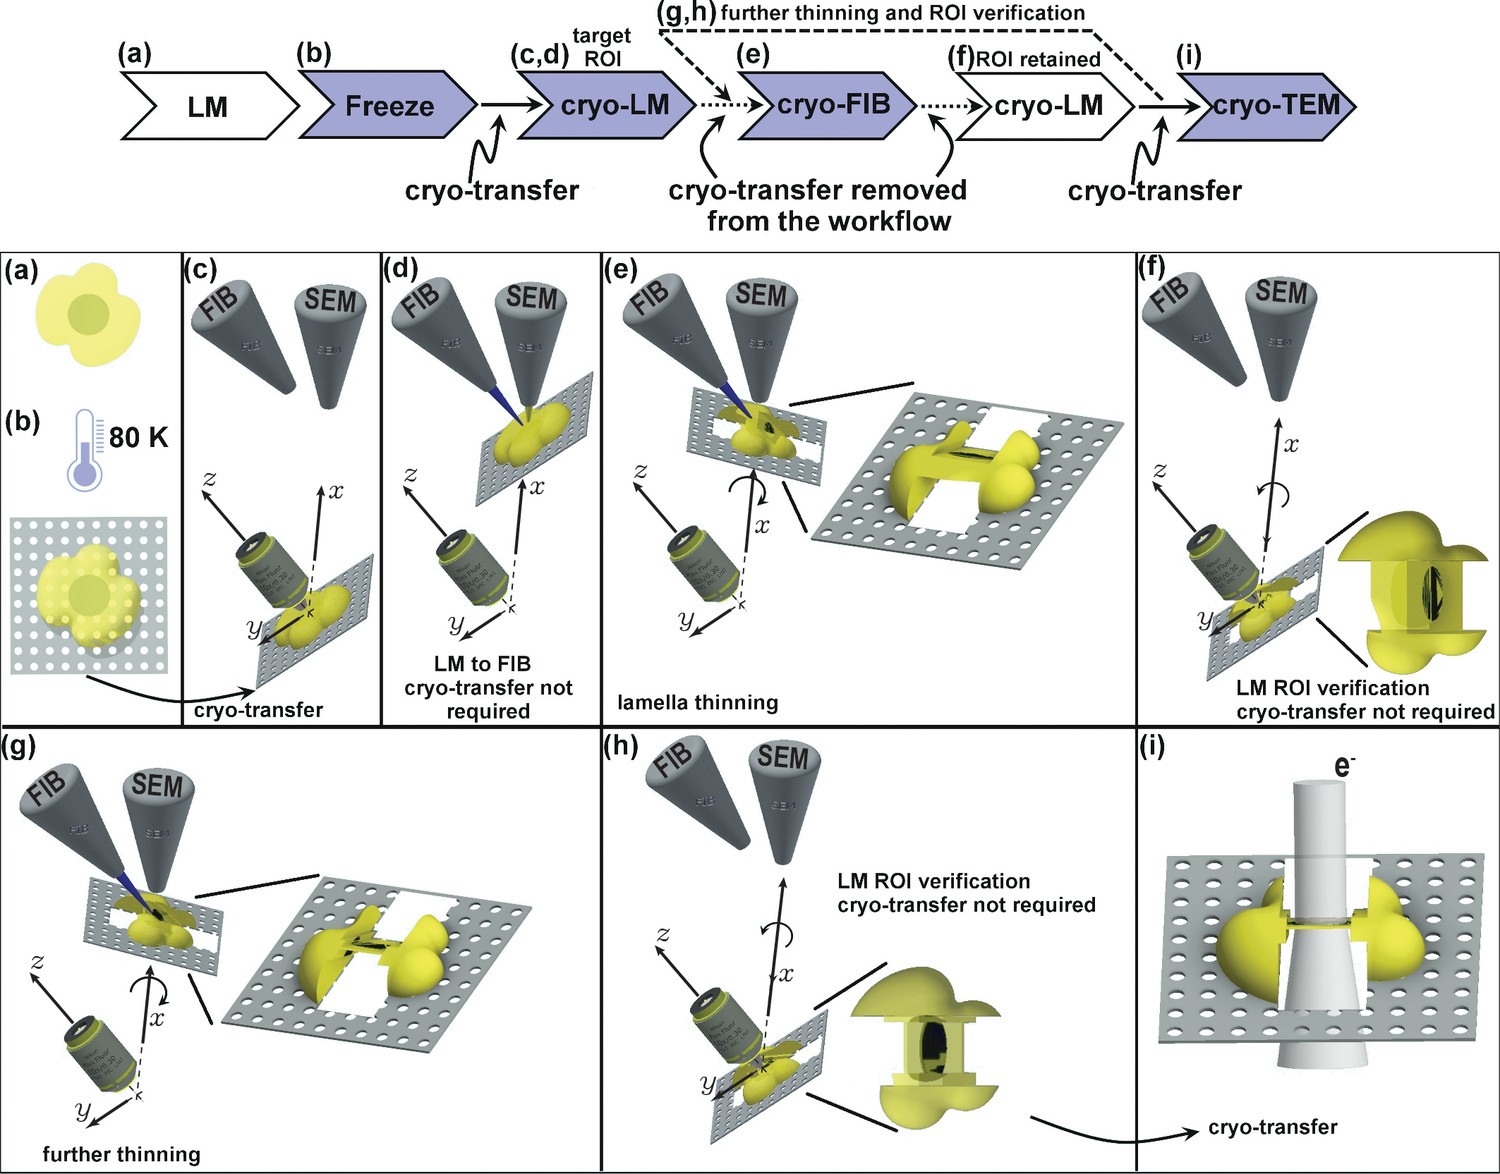
Schematic presentation of the workflow.
(a) Live cell imaging. (b) Plunge or high-pressure freezing of the sample for cryo-preservation (note, cells can be either cultured on the grid in (a) or in case of suspension be added onto the grid at this stage). (c) Cryo-light fluorescence microscopy in the PIE-scope to identify regions of interest. (d) Simple lateral translation of the sample brings the selected region of interest under the FIB/SEM columns. (e) Once the region of interest is under the FIB, a lamella can be thinned down. The angle between the prepared lamella to the grid plane can be controlled by the stage tilt. (f) Simple translation and tilt of the prepared lamella inside the system allow verification of successful targeting of the region of interest with light microscopy. (g,h) An optional repeat of (e) and (f) for further thinning of the lamella. Since two cryo-transfers are required, the system allows rapid and multiple intermediate verifications of targeting with optical and scanning electron microscopes. The x,y,z-axes shown in c-h correspond to the stage axes of the FIB/SEM. (i) Once the region of interest is successfully targeted and optically verified, the lamella is cryo-transferred into a TEM for high-resolution sample analysis. Distances and dimensions throughout the figure have been adapted for illustrative purposes and are not representative.
Figure 2
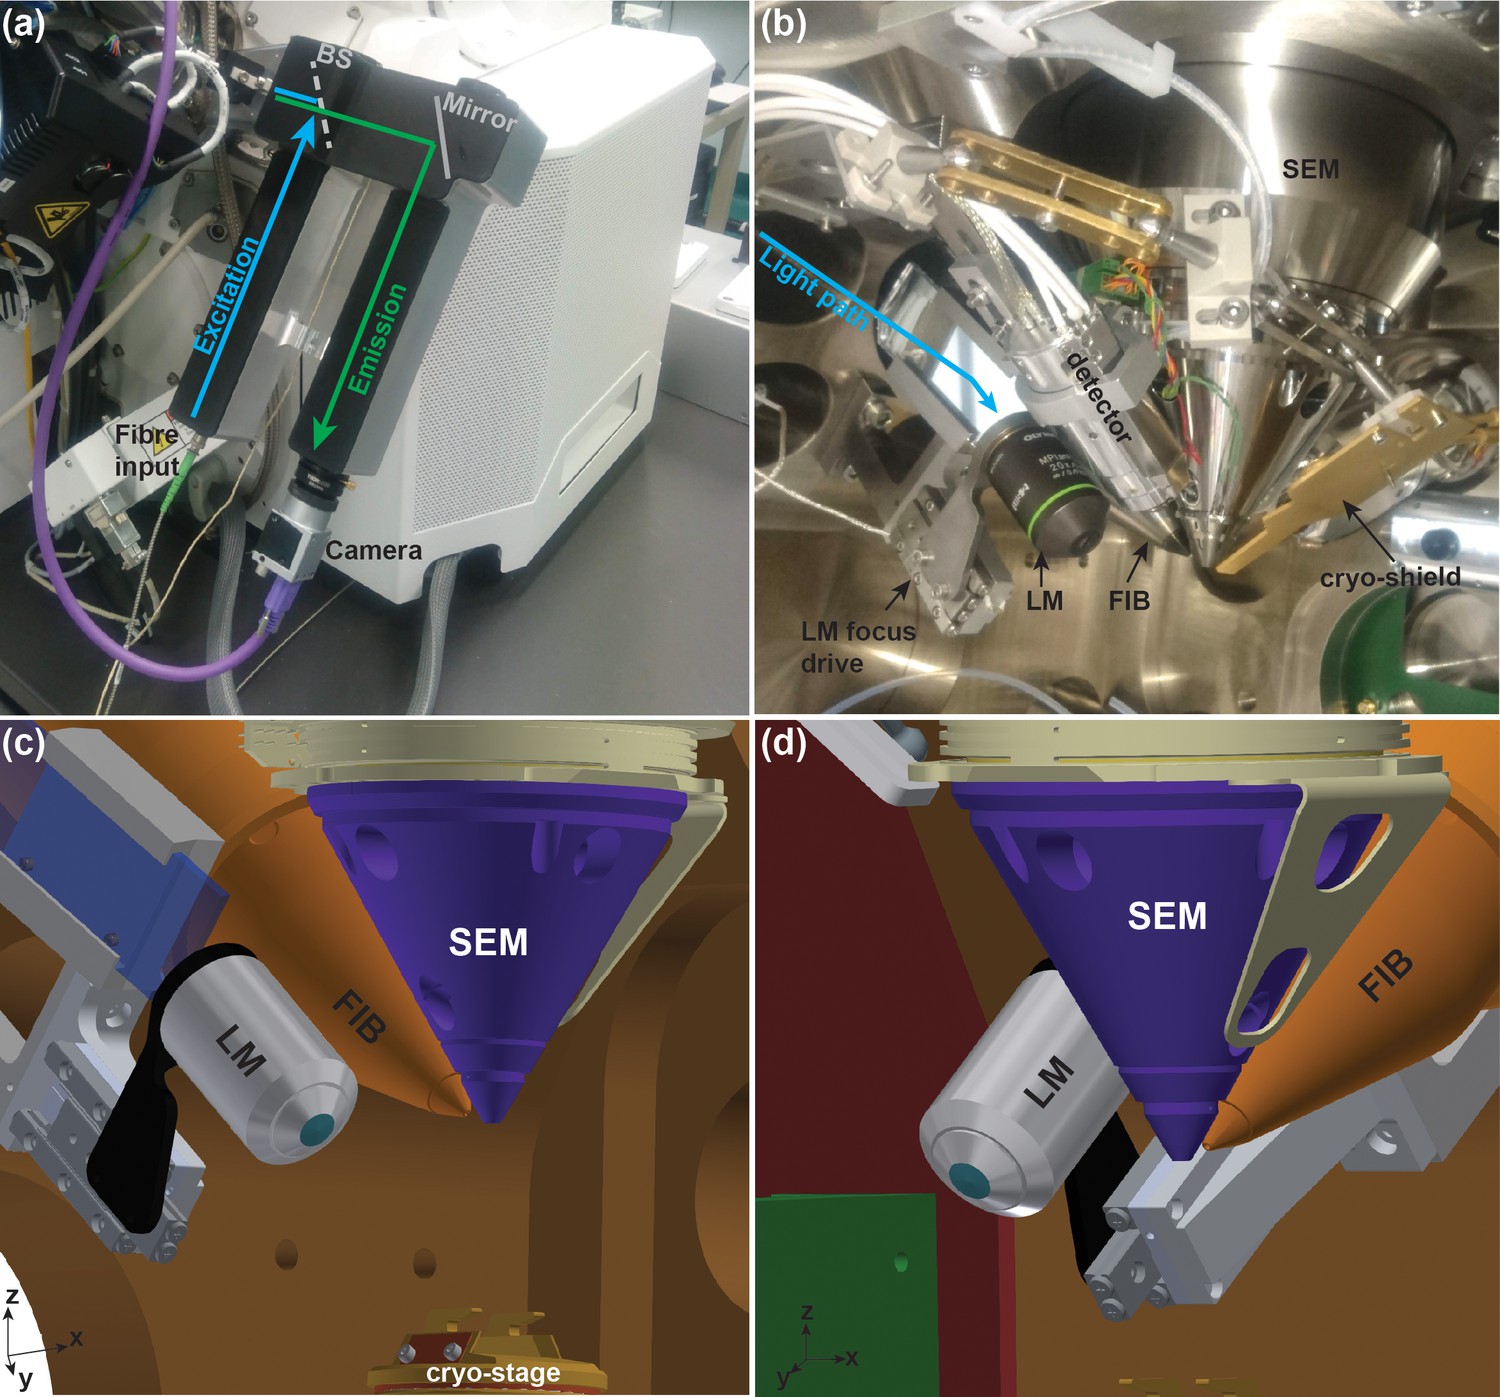
Integrated cryo-FIB and light microscope setup (PIE-scope).
(a) Outside view of the PIE-scope. The atmospheric (external) retrofitted component consisting of one excitation and one emission arms. The camera at the end of the emission arm can be replaced. The excitation arm has been designed to fit an FC/APC fibre-end with a 6 µm core and a NA = 0.06. BS represents the position of the dichroic beam-splitter. (b) A view of the FIB/SEM chamber containing showing the in-vacuum section of the PIE-scope. An objective is mounted on a high-precision motorized stage for sample focusing (LM focus drive). The light from the external arm (cyan arrow) is delivered through a glass flange and directed into the objective by a mirror. (c,d) CAD renderings of the in-vacuum section of the PIE-scope. These renderings are a simplified representation of the chamber and do not include all components visible in (b), but the renderings clarify the geometry of the critical components of PIE-scope. The XYZ axes at the bottom left of panels c and d are aligned with the stage axes.
Figure 3
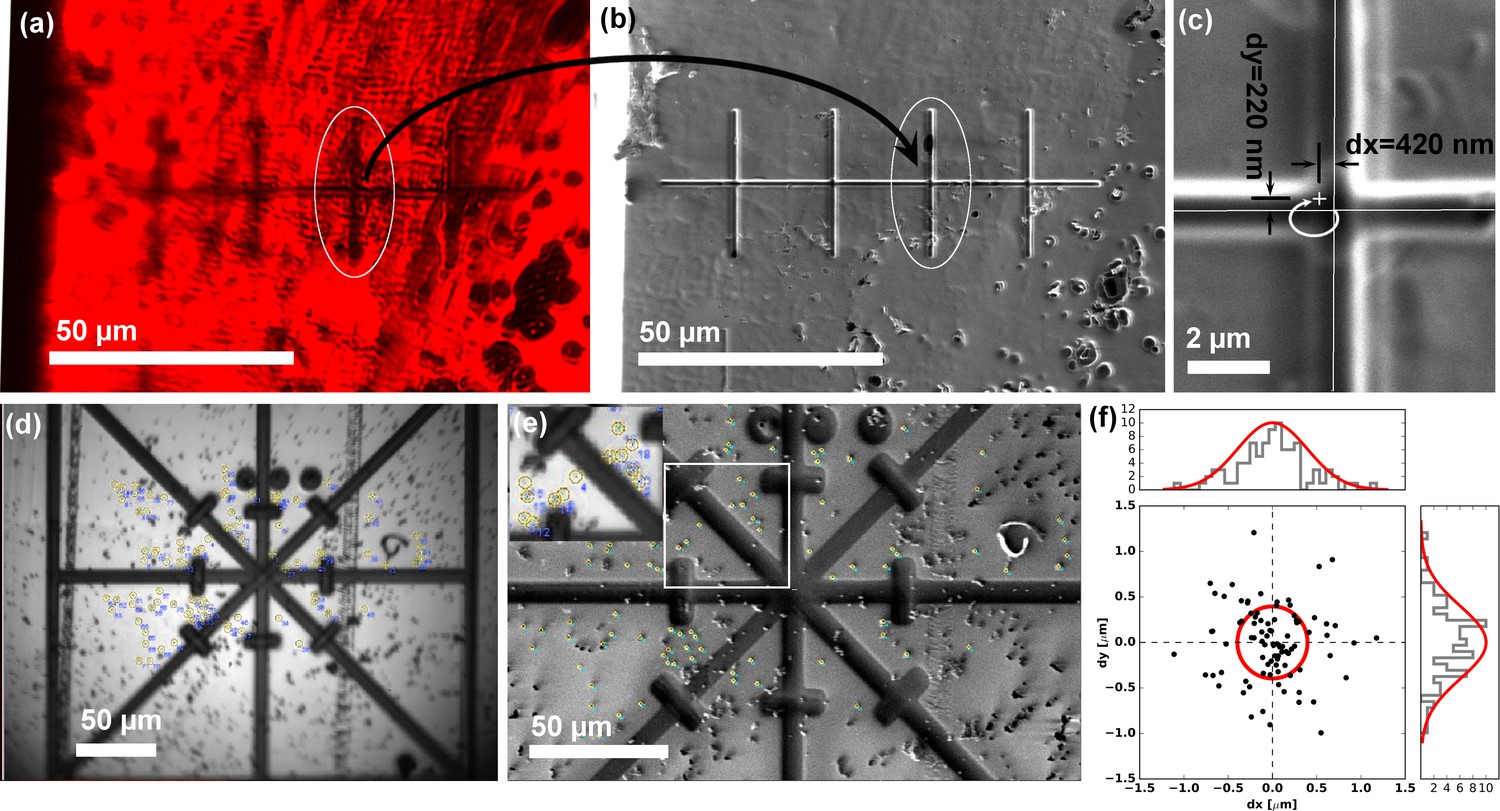
Translation and correlation precision of the integrated PIE-scope.
(a,b) Optical (a) and FIB (b) image of the same sample region, containing a series of pre-milled test patterns (crosses). After the stage translation calibration and targeting steps one can select the target feature using the optical microscope (a), and simply translate the same field of view under the FIB and the (b). (c) The precision of direct, unsupervised ROI targeting by simple sample translation is <420 nm for the X-axis (major axis of translation) and <300 nm for the orthogonal Y-axis. (d, e, f) The procedure used to quantify the mechanical correlation precision when moving between an optical (a) and FIB (b) images. Fiducial markers were identified in all modalities and the transformation to perform the correlation was calculated. In (f) a scatter plot describing the mean residual for all the measurements (n = 86), showing the precision is ~500 nm (±σ). For every measurement, we selected beads > 100 beads to eliminate/average out eventual fiducial selection errors.
Figure 4
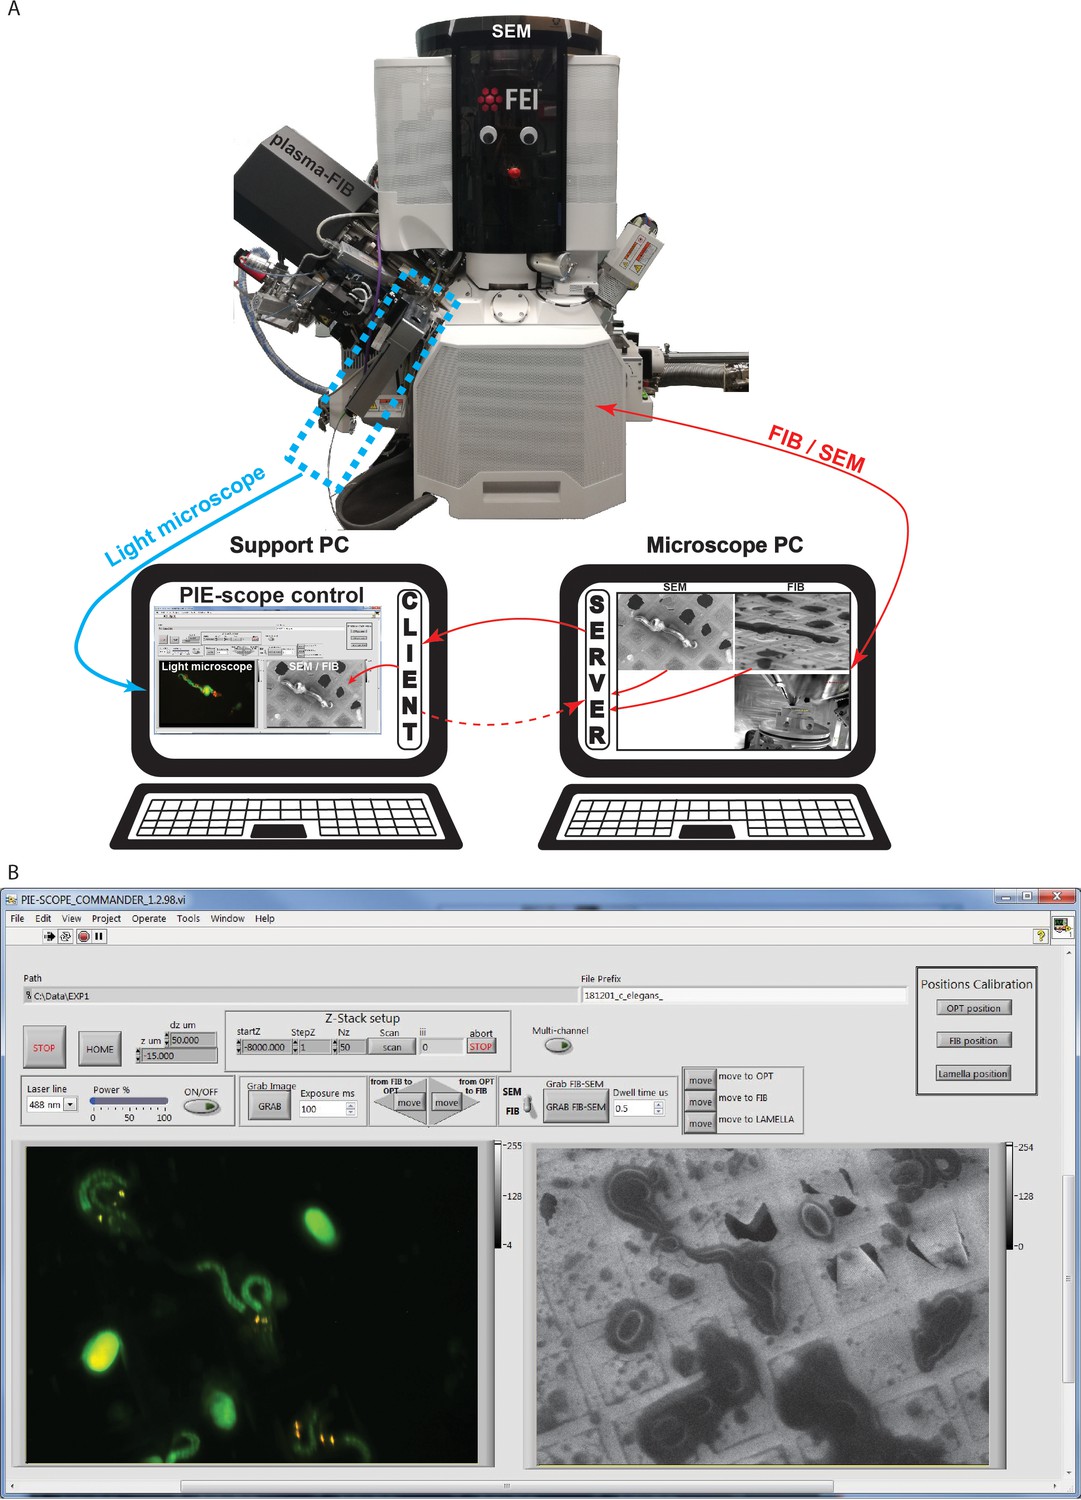
PIE-Scope commander, a CLEM-friendly interface.
(a) A scheme of the communication setup. Here the microscope computer controls the FIB/SEM and runs the python control server. On the support computer, we run a python client (ThermoFisher Autoscript) and the custom built PIE-scope commander to control both the FIB/SEM and the LM. (b) The PIE-scope commander interface, all the required imaging positions can be calibrated from the main window, basic imaging parameters can be set, both FIB and LM images are visible side-by-side and data location can be defined for each experiment. File naming will have a user-defined root and appendix describing the imaging parameters (e.g. FIB, SEM, LM, laser line, dwell-time, exposure time).
Figure 5
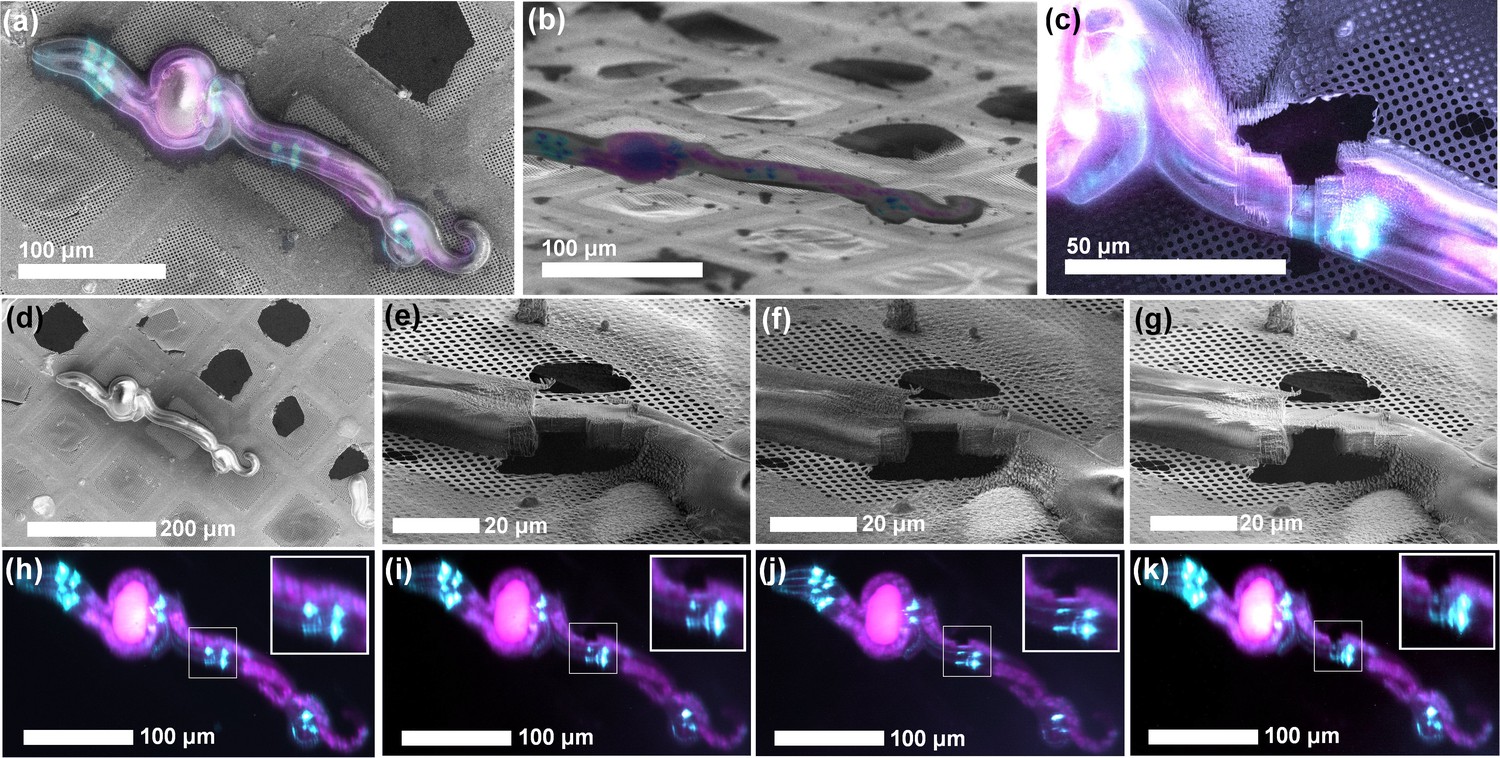
ROI identification, targeting and cryo-lamella preparation in C. elegans larvae.
(a) Correlation between the SEM (top view) and fluorescence microscopy images. (b) Correlation between the FIB and fluorescence microscopy images. The sample is tilted into the lamella preparation position (22° with respect to the grid plane). (c) SEM image of the thinned down lamella overlayed with the fluorescence image from the same region. (d,h) SEM and optical images, respectively, of the initial state of the sample, while the pairs (e, i), (f, j) and (g, k) show SEM and optical images, respectively, of the intermediate steps in the lamella, thinning. Since the optical microscope is integrated within the system, multiple ROI-verifications are possible throughout the workflow without the need for cryo-transfers.
Figure 6

Targeted lamella preparation in a bulk cryo-sample (larval D. melanogaster brain expressing EGFP in interneurons).
(a, b, c) Initial FIB (a), SEM (b) and LM (c) images. (d) Milling of straight edges in the sample allows improved precision of correlation between images acquired in different modalities. Here, the overlay between LM and FIB images of the pre-milled sample is shown. (d, e, f, g) Pairs of SEM and optical microscopy images of the initial sample state (d), two intermediate verification steps (e and f), and the final result (g). Based on the fluorescence signal, 1.5 µm thick lamellae were isolated around the neuronal body (g). Inset in (g) shows a magnified image of a lamella ready for a cryo-lift-out.
Figure 7
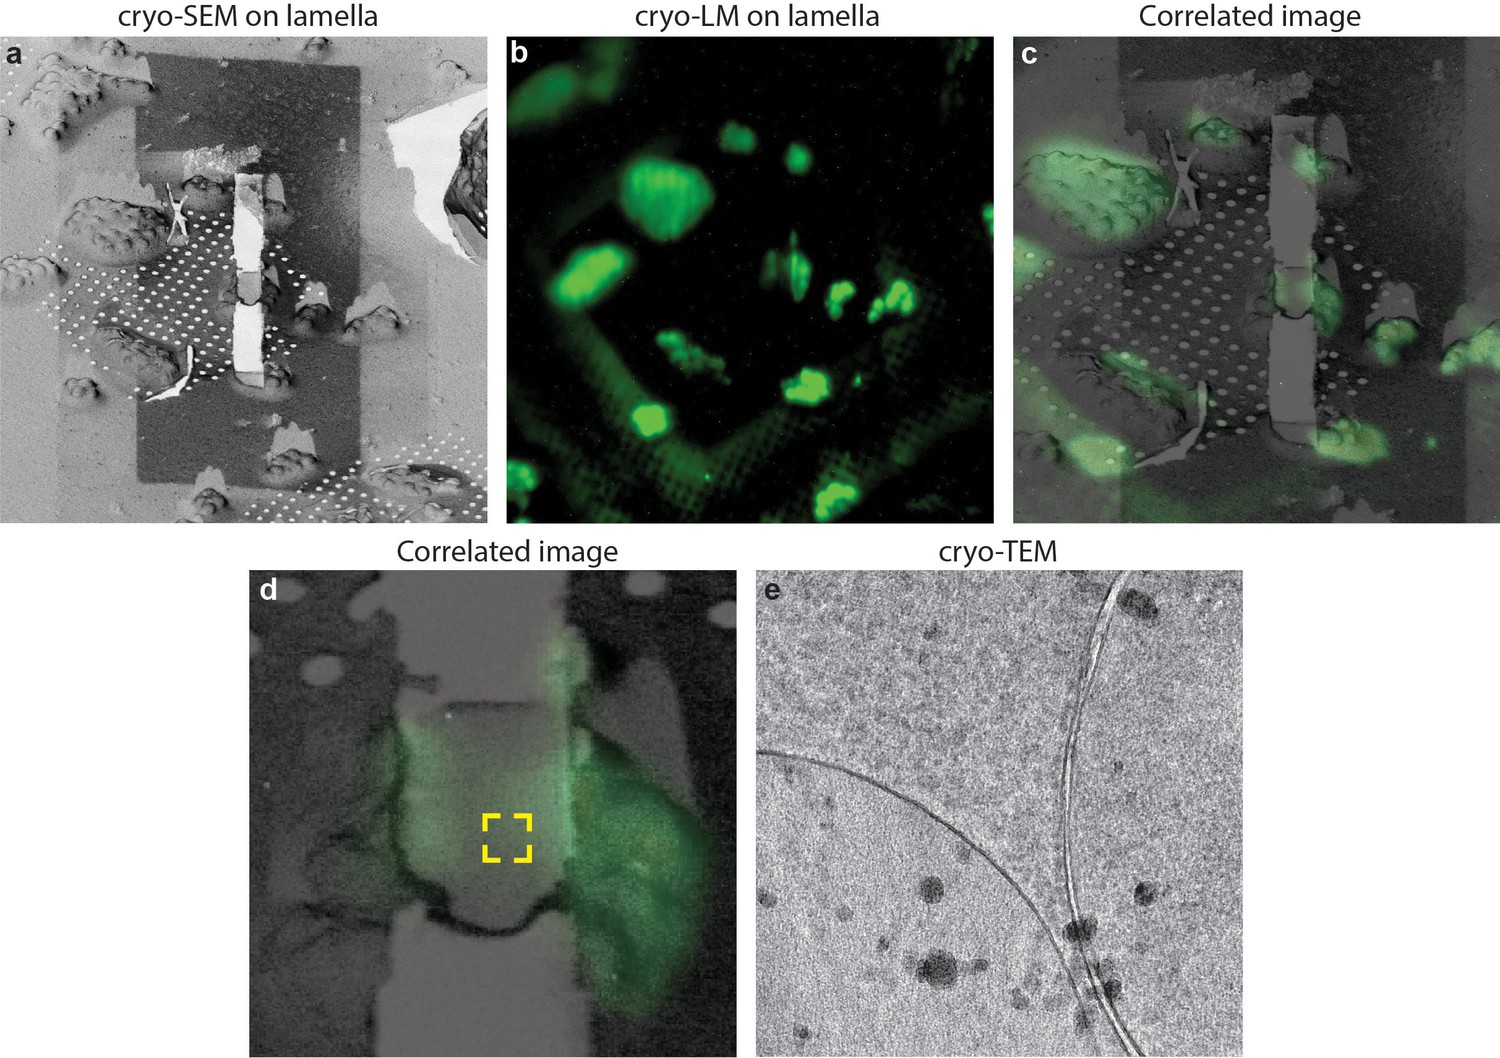
Cryo-correlative microscopy on fluorescent yeast cells.
(a–b) S. cerevisiae cells were labelled with nucleolar staining, lamellas were prepared and then imaged using cryo-fluorescence microscopy. (c) Correlated image between the SEM and LM images, the region imaged through cryo-ET is labelled in the yellow square. (d) Cryo-TEM image of the lamella showing that the sample is still vitreous.
Videos
Video 1
PIE-scope operation.
This video provides an overview of the capabilities provided by PIE-scope and provides an overview of its capabilities.
Video 2
Cryo-electron tomogram on a lamella after fluorescence imaging.
The region imaged on this tomogram correspond to the one visible in Figure 7d. no de-vitrification is visible as a result of LM imaging.
Additional files
-
Transparent reporting form
- https://doi.org/10.7554/eLife.45919.011
Download links
A two-part list of links to download the article, or parts of the article, in various formats.
Downloads (link to download the article as PDF)
Open citations (links to open the citations from this article in various online reference manager services)
Cite this article (links to download the citations from this article in formats compatible with various reference manager tools)
PIE-scope, integrated cryo-correlative light and FIB/SEM microscopy
eLife 8:e45919.
https://doi.org/10.7554/eLife.45919


