Exercise-induced enhancement of synaptic function triggered by the inverse BAR protein, Mtss1L
- Oregon Health & Science University, United States
- Portland VA Health Care System, United States
Figures
Figure 1 with 1 supplement
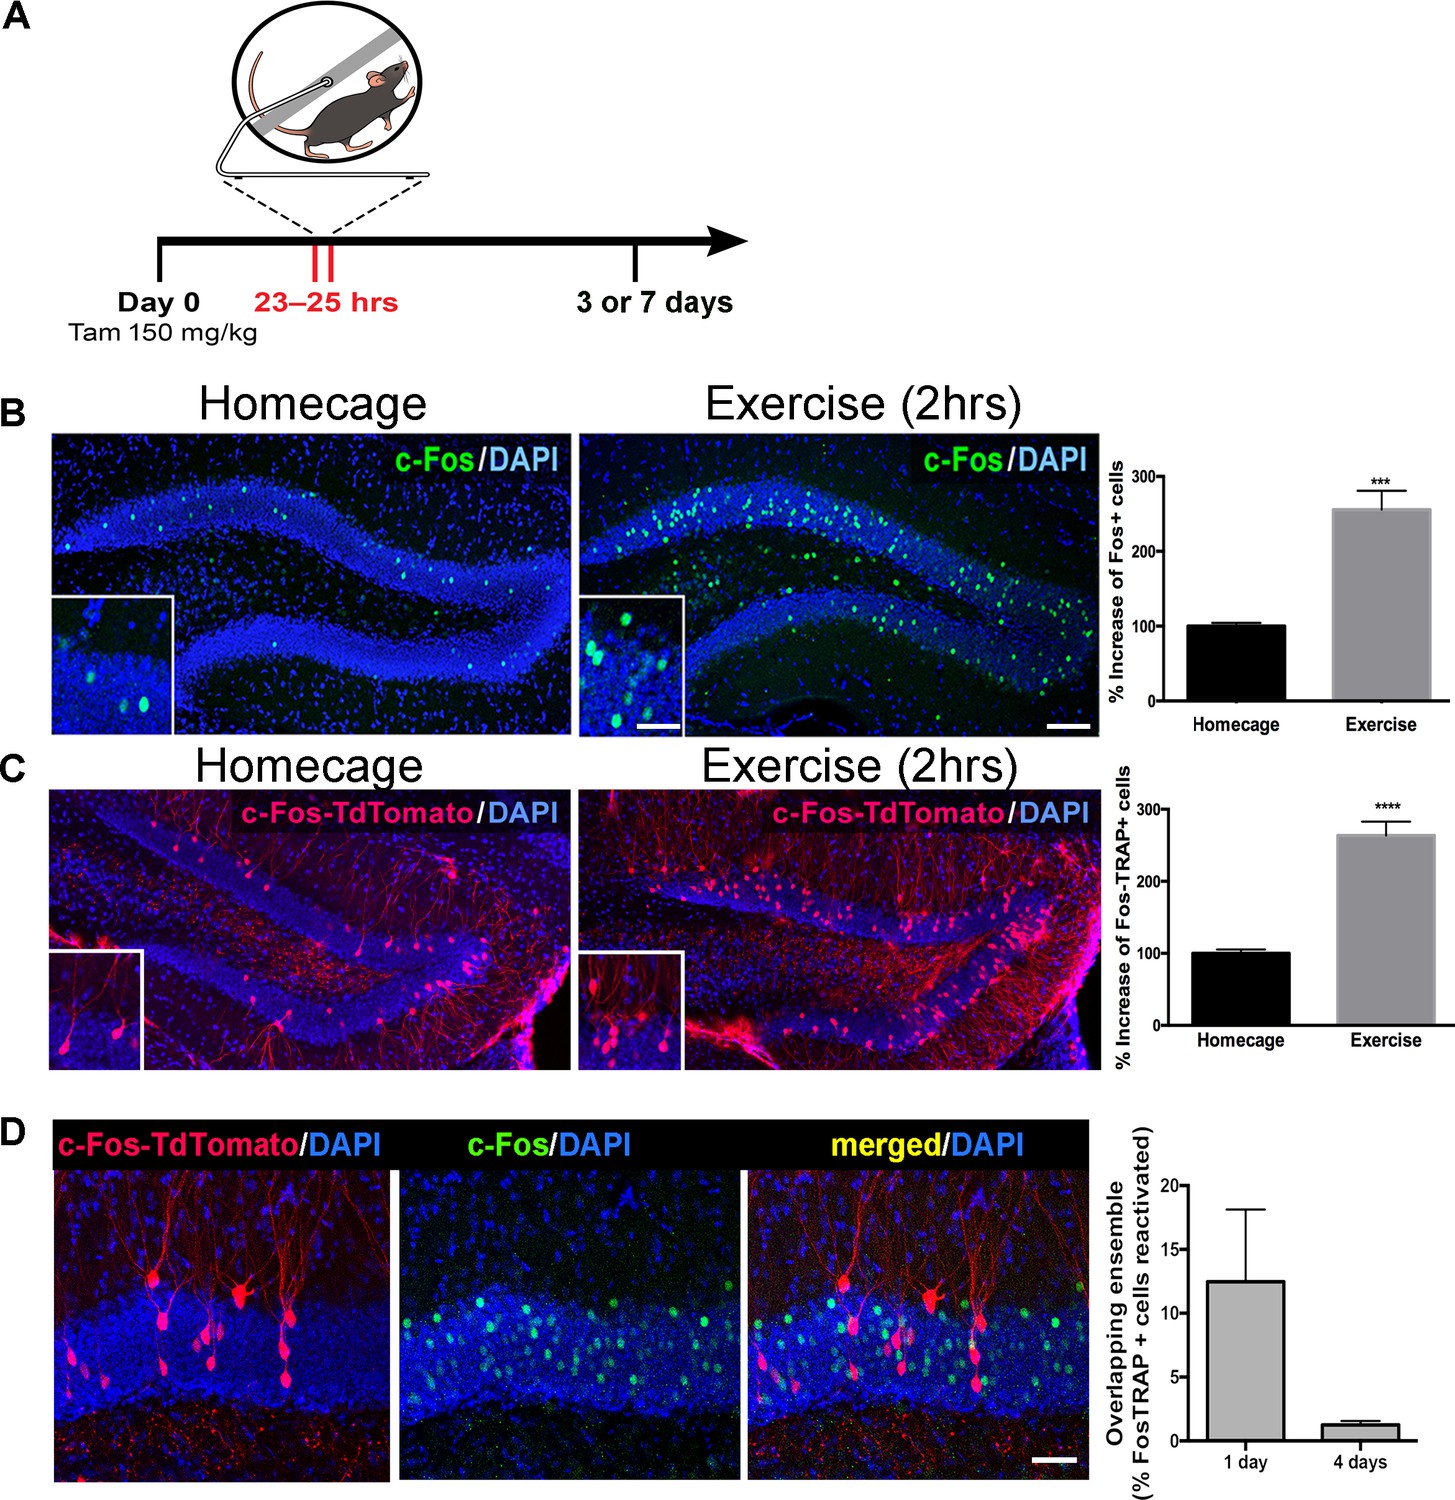
Single exposure to running wheel induces transient synaptic plasticity in exercise-TRAPed dentate granule cells.
(A) Schematic showing exercise paradigm. Fos-TRAP:TdTomato (Guenthner et al., 2013) mice were injected with tamoxifen (150 mg/kg) 24 hr before exposure to 2 hr of voluntary exercise, while littermate controls remained in their homecage. Mice were sacrificed 3 or 7 days after exposure to the running wheel. (B) Voluntary exercise (2 hr) increased neuronal activity in the dentate gyrus. Representative images of endogenous c-Fos expression in the dentate gyrus of WT mice housed in their homecage (left) or 2 hr after exposure to voluntary exercise (middle). A single bout of exposure to exercise increased c-Fos+ cells in the dentate gyrus (right). (% increase, Homecage: 100 ± 4 n = 6, Exercise: 255 ± 25, n = 4, unpaired t-test p=0.001). Scale bars: insert 50 µm, right 100 µm. (C) Representative images of the dentate gyrus from Fos-TRAP:TdTomato mice housed in their homecage (left) or 3 days after 2 hr of voluntary exercise (middle). Voluntary exercise increased exercise-TRAPed dentate granule cells (% increase from baseline in exercise-TRAPed cells, homecage 100 ± 5 n = 5, Exercise 264 ± 19, n = 5, unpaired t-test, p<0.0001). (D) A single exposure to exercise tags distinct populations of activated DG granule cells. (A) We used the Fos-TRAP: Tdtomato mice to tag a neuronal ensemble activated by a single exposure to exercise (2 hr) (Tdtomato+). We compared these exercise-TRAPed cells to granule cells activated by a second exposure to exercise (C) and tagged at 2 hr post-exercise using c-Fos immunohistochemistry 1 or 4 days later. Fos-TRAP:Tdtomato mice were injected with Tamoxifen (150 mg/kg) 24 hr prior to exercise. Animals were exposed to a second bout of exercise either 1 or 4 days later. (B) When the two exercise periods were separated by 24 hr, 12.5 ± 5.6%, (n = 3) of the exercise-TRAPed cells were re-activated, whereas with a 4-day separation only 1.3 ± 0.3% (n = 4, unpaired t-test, p=0.07) overlapped, indicating that labeling with exercise was stochastic.
Figure 1—figure supplement 1

In vitro validation of Fos-TRAP method.
To validate the sensitivity of the Fos-TRAP method, primary hippocampal cultures were derived from 2-day-old Fos-TRAP pups (Guenthner et al., 2013), transduced with an AAV-flex-H2B-mRFP virus, and then 5 days later treated with 4-OH tamoxifen (4-OH Tam, 1µM) for 48 hr. As expected, H2B- mRFP labeling was sparse in these low-density cultures (left panel), whereas KCl-induced depolarization (20 mM, 30 min) resulted in a robust increase in Fos:H2B-mRFP expression (red, middle panel). Inhibition of neuronal activity in the cultures for 48 hr with TTX (500 nM), NBQX (2.5 µM) and CPP (5 µM) completely abolished Fos-TRAP: H2B-mRFP expression (right panel). Scale bar: 40 µm.
Figure 2 with 2 supplements
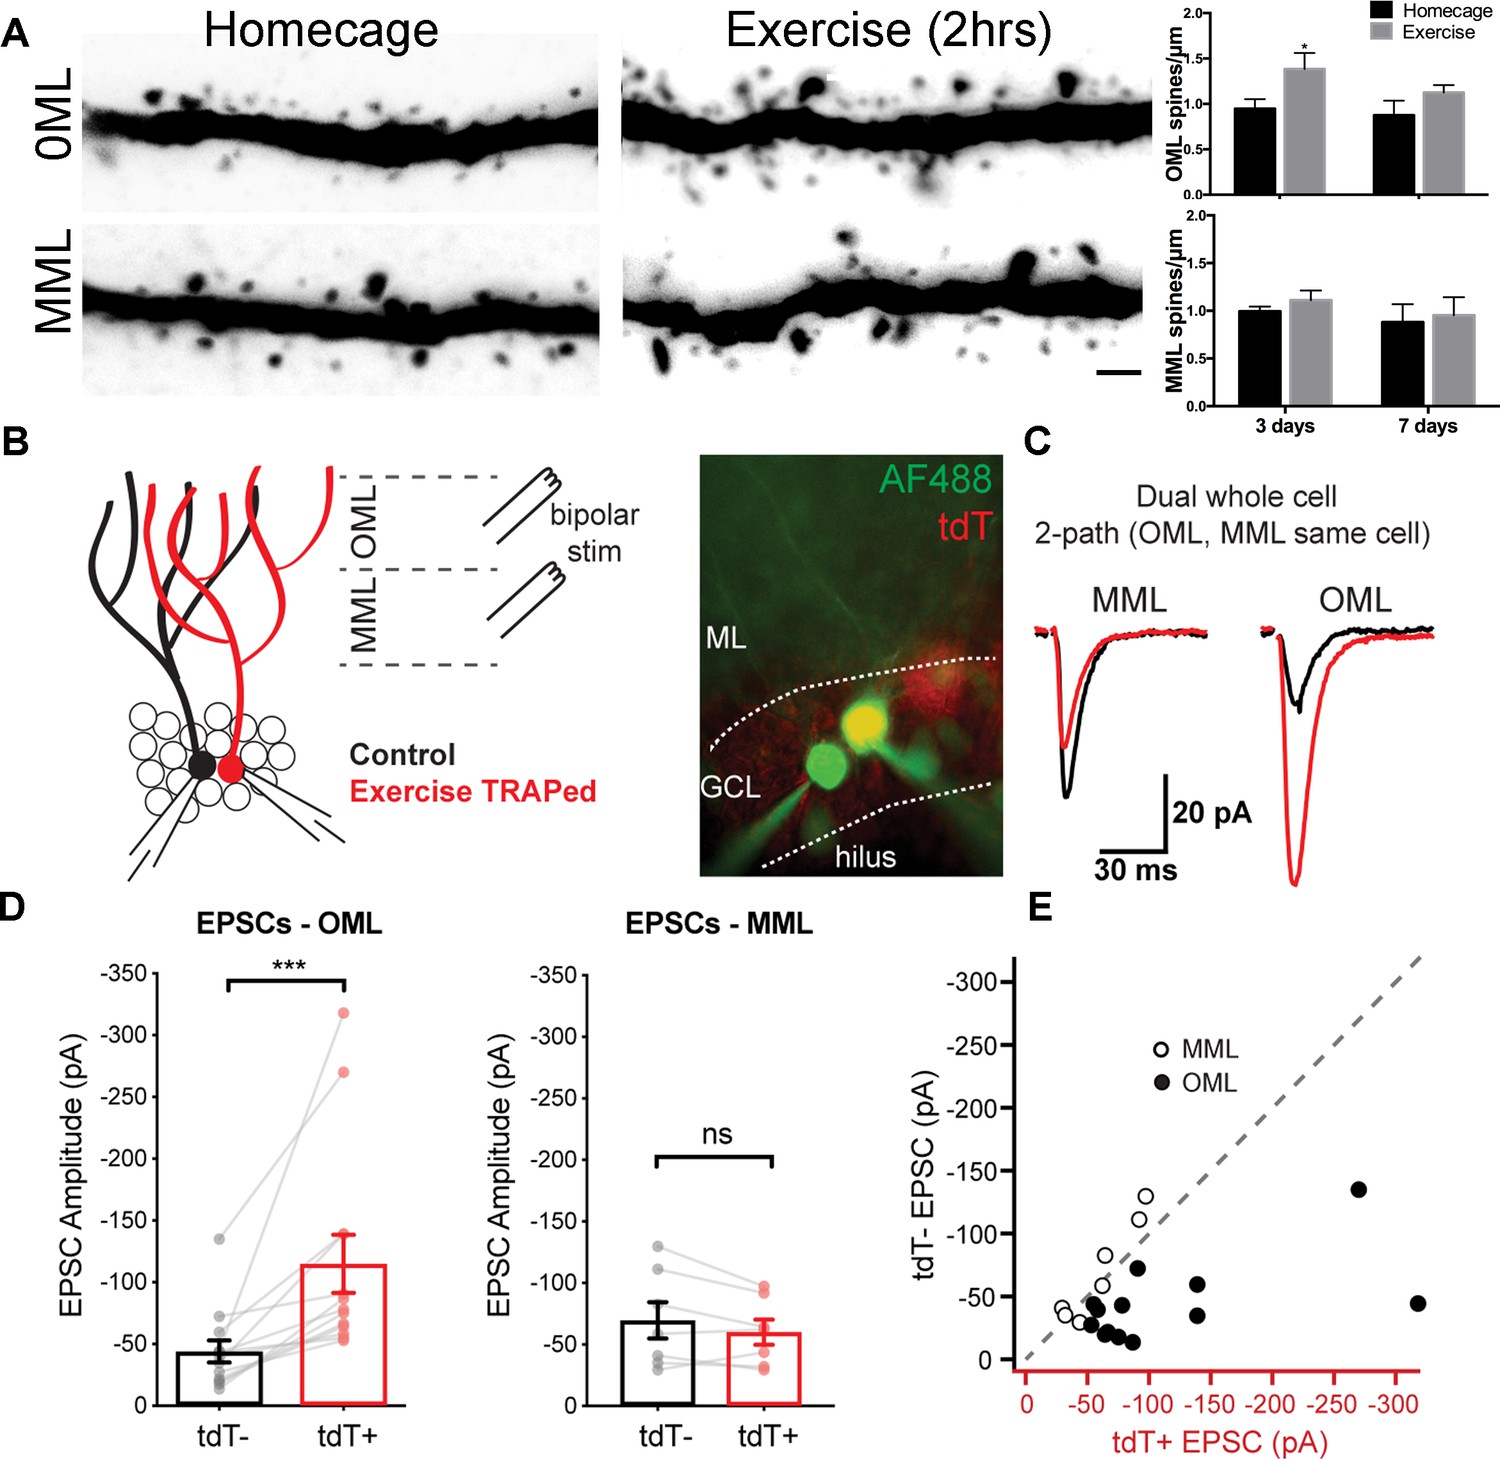
A single bout of exercise induces a laminar-specific increase in excitatory synaptic innervation.
(A) Representative images of TRAPed granule cell dendrites in the OML and MML from mice at baseline (i.e. homecage) or 3 days post-exercise. Scale bar: 5 µm. Spine densities were significantly increased in the OML of activated cells at 3 days post exercise (two-way ANOVA, OML 3 days homecage: 0.94 ± 0.1, exercise: 1.39 ± 0.2, p=0.02, n = 5), whereas there was no difference in the OML at 7 days post-exercise (OML 7 days homecage: 0.87 ± 0.2, exercise: 1.10 ± 0.1, p=0.18, n = 5). Spine density in the MML was unaffected (two-way ANOVA, no interaction between homecage and exercise groups, MML 3 days homecage: 0.99 ± 0.1, exercise: 1.10 ± 0.1; MML 7 days homecage: 0.88 ± 0.2, exercise 0.95 ± 0.2, n = 5, p=0.79). (B) Configuration for simultaneous whole-cell voltage clamp recordings of control and exercise-TRAPed dentate granule cells (left). Bipolar stimulating electrodes were placed in the OML and/or MML to activate lateral and medial perforant path axons, respectively. Cells were filled with AlexaFluor 488 dye (right) to confirm that the adjacent cell bodies had dendritic arbors that overlapped (control:green, exercise TRAPed: yellow). (C) Representative EPSCs from the cell pair shown at left in response to alternating MML and OML stimulation in the control (black traces) and exercise-TRAPed cell (red traces). (D) OML stimulation produced EPSCs that were significantly greater in exercise-TRAPed cells (EPSCs - OML amplitude: TdT-, −44.1 ± 8.9 pA; TdT+, −114.9 ± 23.5 pA; n = 13 cell pairs (eight mice); p=0.0002, Wilcoxon matched-pairs signed rank test), whereas MML stimulation did not differ from controls (EPSCs - MML amplitude: TdT-−69.7 ± 14.9 pA; TdT+, −60.1 ± 10.3 pA; n = 7 cell pairs (four mice); p=0.15, paired t-test). There was no difference in EPSC amplitudes during OML stimulation while recording from two control (both TdT-) granule cells (EPSC amplitudes: TdT-, −55.8 ± 16.3 pA; TdT-, −57.5 ± 13.8 pA, n = 5 cell pairs, p=0.80, paired t-test). (E) EPSC amplitudes from control (y-axis) and exercise TRAPed (x-axis) from each cell pair were plotted with each point representing a cell pair. MML stimulated cell pairs (open circles) were present along the unity line (dashed line), whereas OML stimulated pairs (black circles) were shifted below unity, indicating that the larger EPSC amplitudes for exercise-TRAPed cells was specific to the OML.
Figure 2—figure supplement 1
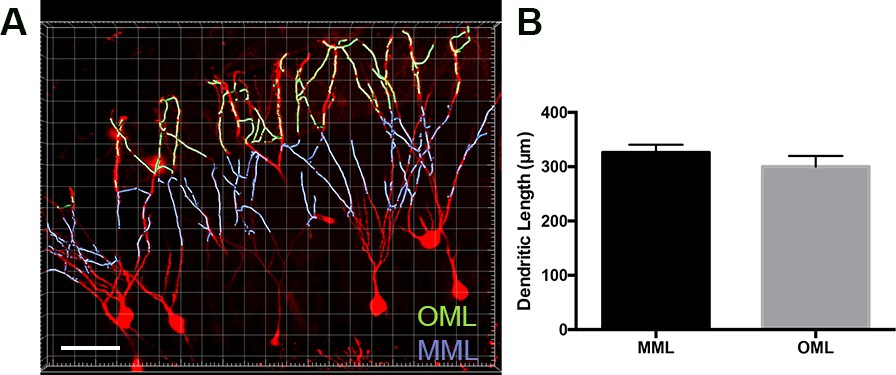
Dendritic lengths were equal in outer and middle molecular layers of exercise TRAPed cells.
(A) Representative image of dendrites of the outer molecular layer (light green) and middle molecular layer (light purple) of exercise-TRAPed cells (red) 3 days post-exercise. The band of VGluT2 immunofluorescence labeled only the OML and MML, with the outer half representing OML and the inner half representing MML for quantification. Scale bar: 40 µm. (B) There was no difference in dendritic lengths per cell between MML and OML cells (MML: 326 ± 14 µm, n = 3, OML: 300 ± 20, n = 3, unpaired t-test, p=0.14, 49 µm stack). Masking was used to better visualize the OML and MML in the image.
Figure 2—figure supplement 2
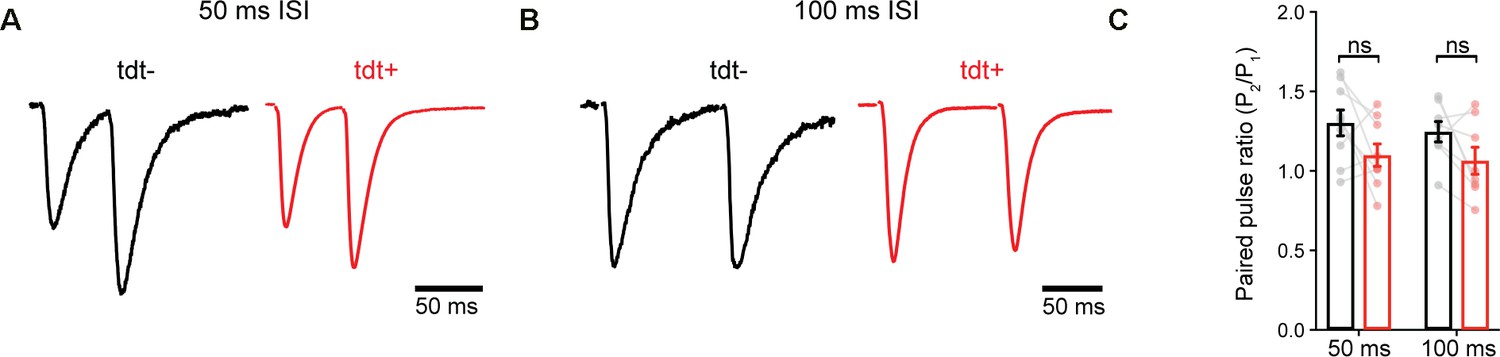
Paired-pulse ratio (PPR) in control and exercise-TRAPed granule cell paired recordings.
(A) Representative EPSCs from paired-pulse experiments during 50 ms interstimulus interval (ISI) OML stimulation. Responses are scaled on the y-axis relative to the first peak (PPR, 50 ms ISI: tdT-, 1.30 ± 0.08, tdT+, 1.10 ± 0.07, n = 9 cells, p=0.0770, paired t-test). Stimulus artifacts were blanked for presentation. (B) Same as in A, but with 100 ms ISI PPR, 100 ms ISI: tdT-, 1.25 ± 0.06, tdT+, 1.06 ± 0.08, n = 8 cells, p=0.09, paired t-test) (C) Quantification and summary of paired-pulse experiments. There was no change in PPR at 50 ms ISI (p=0.08, paired t-test) or 100 ms ISI (p=0.09, paired t-test). ns, not significant.
Figure 3 with 3 supplements
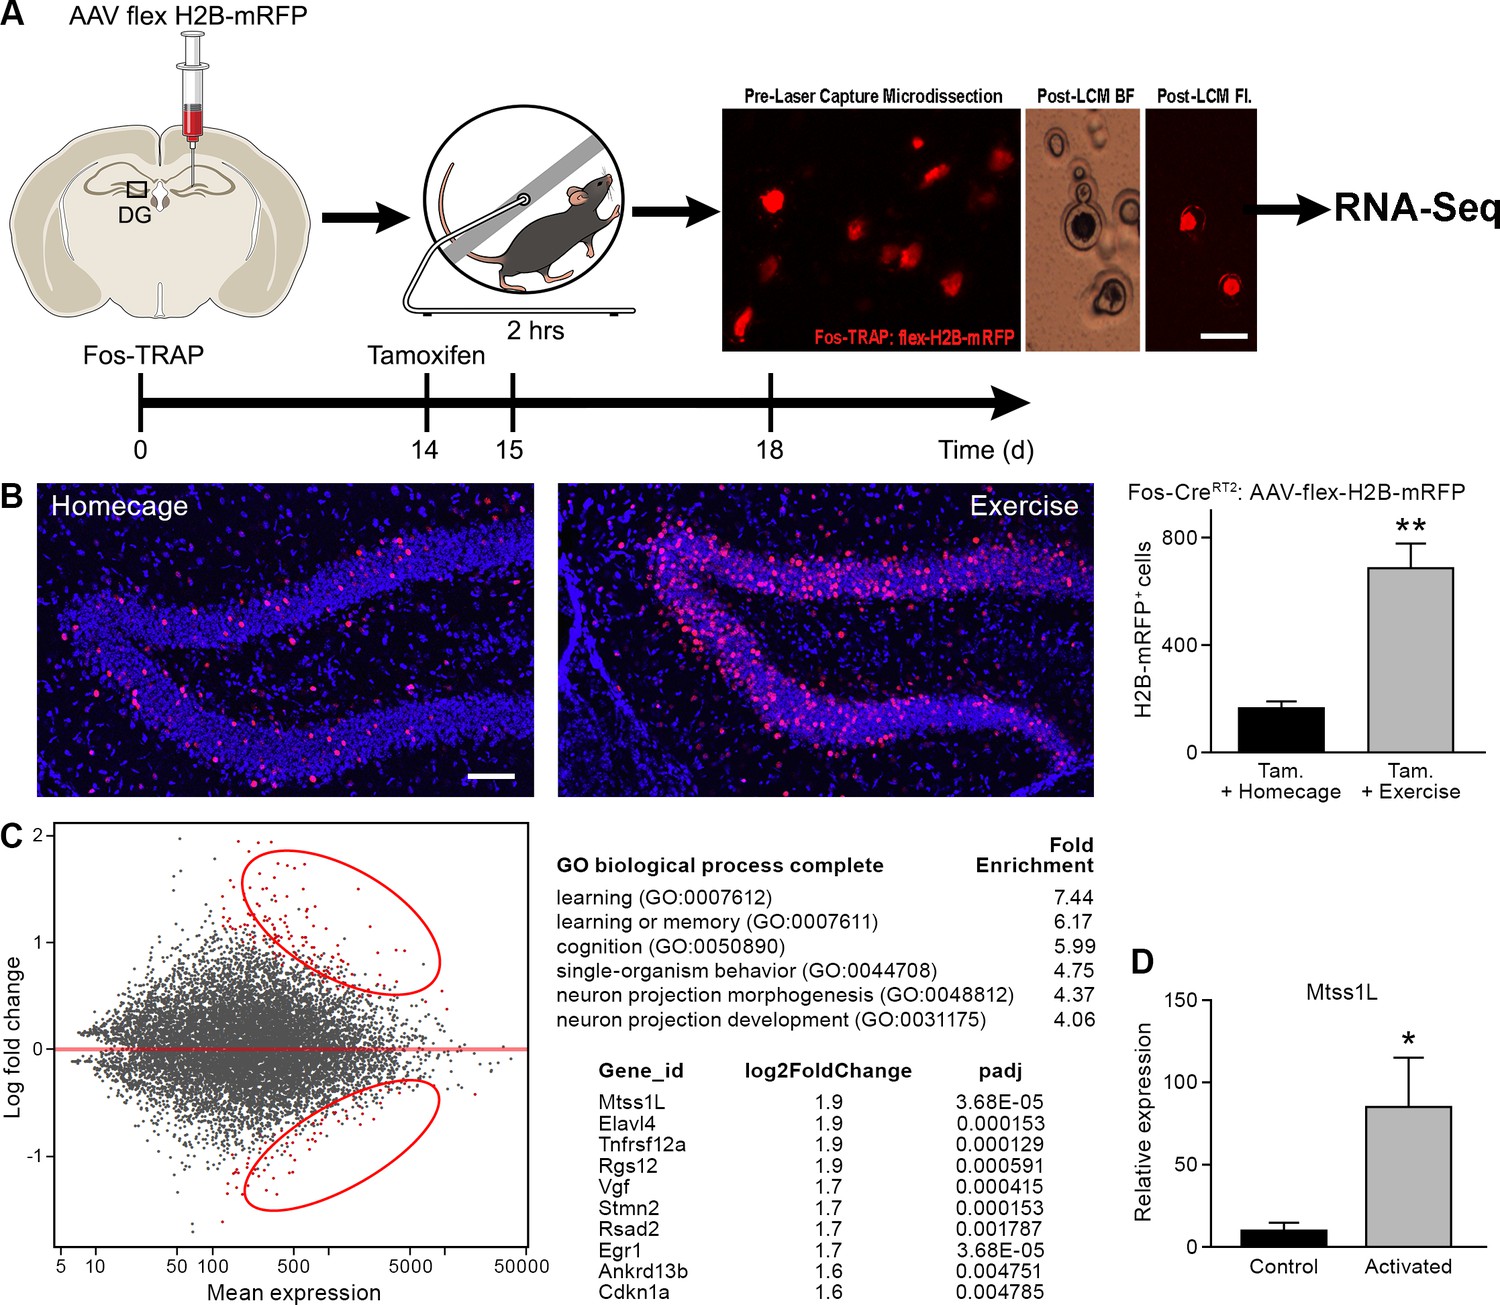
Transcriptome analysis of laser captured dentate granule cells activated by a single bout of voluntary exercise.
(A) A virus expressing a CAG promoter followed by a loxP-flanked (‘floxed’) stop cassette-controlled Histone2B Monomeric Red Fluorescent Protein (flex H2B-mRFP), was injected stereotaxically into the dentate gyrus of Fos-TRAP mice. The nuclear tag allowed preservation of the fluorophore during laser capture microdissection. Two weeks post-viral injections, mice were injected with tamoxifen, followed 24 hr later by 2 hr of voluntary exercise. Mice were sacrificed 3 and 7 days following exercise. mRFP+ (exercise TRAPed) and non-activated granule cells were subsequently excised from unfixed intact tissue cryosections using laser capture microdissection, and pooled in batches of 100–150 cells per mouse. cDNA libraries were prepared and samples were processed for RNASeq library construction. Scale bar: 20 µm. (B) Voluntary exercise increased activated mRFP+ cells compared to littermate controls in homecage. Scale bars: 100 µm. Fos TRAPed:H2B-mRFP+ cells/50 µm section was 164 ± 26 for homecage (n = 3) and 686 ± 92 for exercise (n = 4, unpaired t-test, p=0.007). (C) Differential expression of genes between RFP+ and RFP- cell ensembles from four mice are displayed in a MA-plot (M value vs A value plot, which are Log2fold vs normalized mean expression in DEseq2), with and significantly changed (FDR < 0.1, fold enrichment 2.) Upregulated and downregulated transcripts are shown as red dots (upper and lower circles, respectively). For analysis at 3 days post-exercise in exercise-TRAPed cells, the top enriched ontological clusters are listed as well as the top 10 upregulated genes. (D) Real-time qPCR confirmation of the Mtss1L expression in in exercise-TRAPed cells at 3 days (see also Figure 3—figure supplement 2).
Figure 3—figure supplement 1
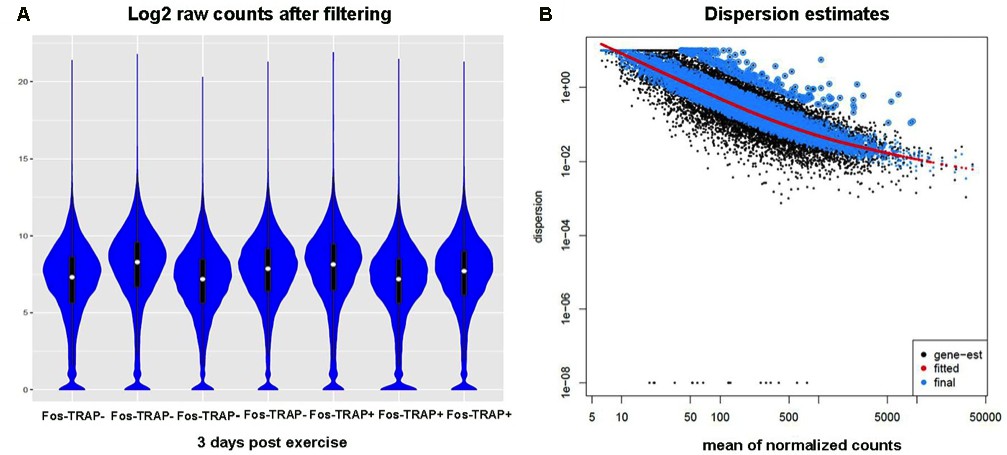
Filtering, and dispersion estimation of sequencing data used for transcriptomics.
(A) Log2 raw counts dataframe after filtering transcripts with rowmax < 64 counts are displayed with violin plots in blue, median counts of each sample are shown as white dots with black bars representing standard deviation. Data from four samples from Fos-TRAP- cells and three samples from Fos-TRAP+ cells showed similar count distributions. Each sample contained cDNA from 150 neurons from each mouse. (B) Dispersion estimation of the normalized counts of samples at 3 days post-exercise was analyzed using the DEseq2 package. Local fit was used for the estimation, which showed that data dispersion estimated from raw counts (gene-est shown in black dots) fit well with the statistical model calculated from the DEseq2 package (red line). Normalized data (blue dots) were used for differential expression comparison.
Figure 3—figure supplement 2
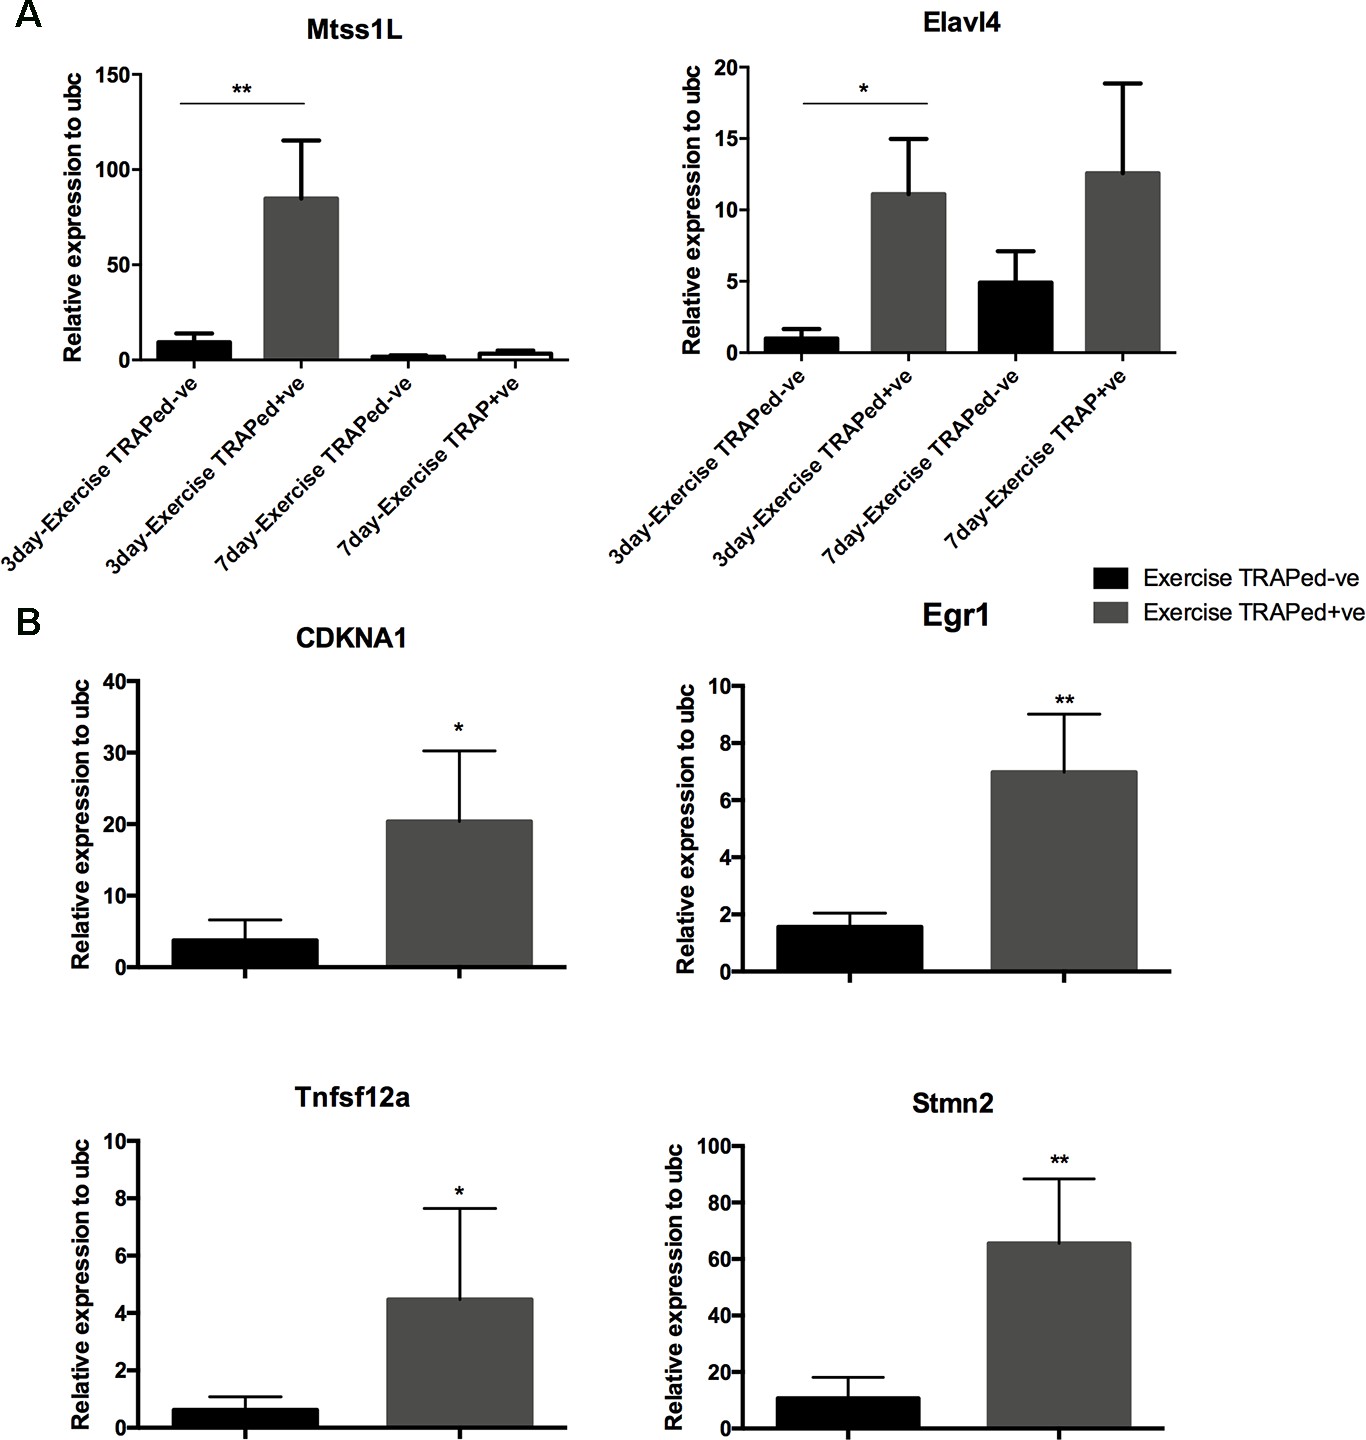
Real-time qPCR confirmation of upregulated genes in exercise-TRAPed cells.
Six of the top 10 enriched genes (see Figure 3C) were selected for validation including the top five based on padj values, and one from the lower five padj (CDKN1A). (A) Summary real-time qPCR confirmation of Mtss1L and Elavl4 exercise-induced transcripts in 3 and 7 day post-exercise samples using Smartseq2 amplified cDNA (exercise-TRAPed- (control) n = 4 mice; exercise-TRAPed+ n = 3 mice). mRNA expression was normalized to neuronal internal control gene Ubc. Statistical analysis was performed using one-way ANOVA with multiple comparisons and t-test *p<0.05. (B) mRNA expression of p21(CDKN1A), Egr1, Tnfsf12a, Stmn2 in the 3-day post-exercise samples (exercise TRAPed- (control) n = 4 exercise TRAPed+ n = 3). mRNA expression was normalized to neuronal internal control gene Ubc. Statistical analysis was performed using t-test assuming equal variation *p<0.05.
Figure 3—figure supplement 3
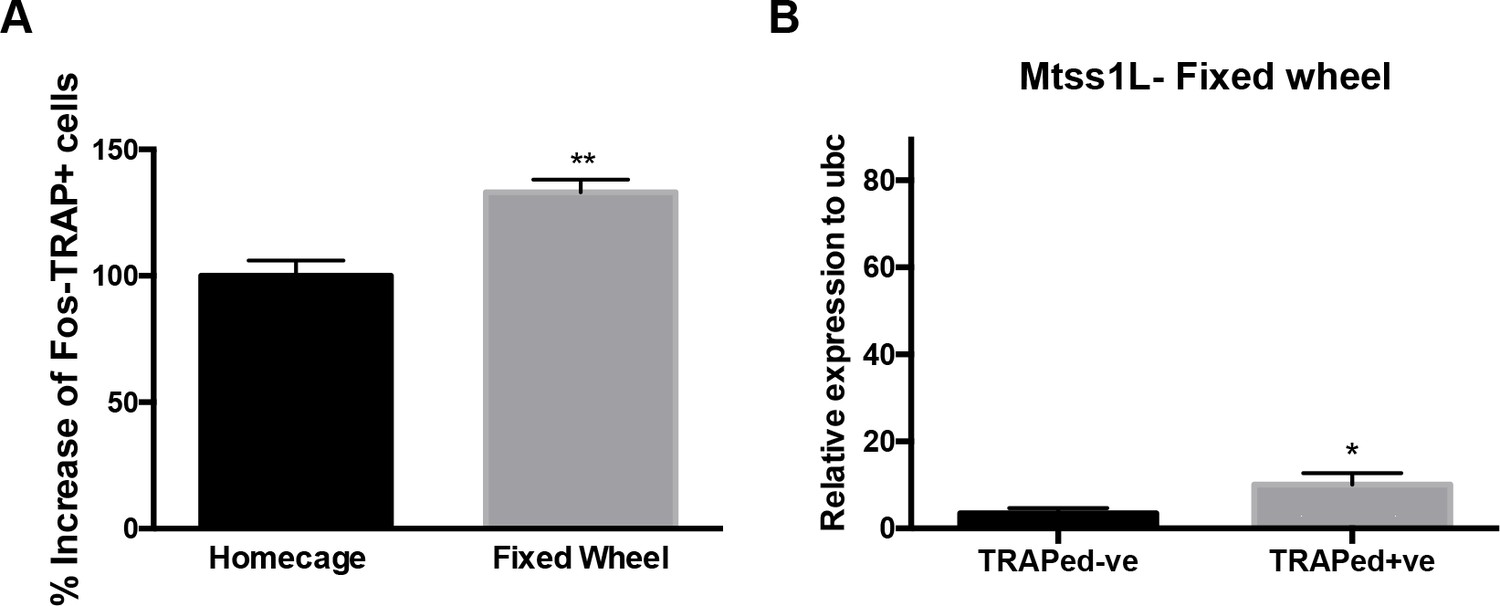
Effect of exposure to a fixed wheel on neuronal activity and Mtss1L expression.
(A) Exposure to a fixed wheel for 2 hr increased exercise-TRAPed dentate granule cells (% increase from baseline in TRAPed cells, homecage 100 ± 6 n = 5, Fixed wheel 133 ± 5, n = 5, unpaired t-test, p<0.01). (B) mRNA expression of Mtss1L was upregulated at 3 days after exposure to a fixed wheel in TRAPed cells (TRAPed- (control, n = 3), TRAPed+ (fixed wheel, n = 3). mRNA expression was normalized to neuronal internal control gene Ubc. Statistical analysis was performed using unpaired t-test *p<0.05.
Figure 4
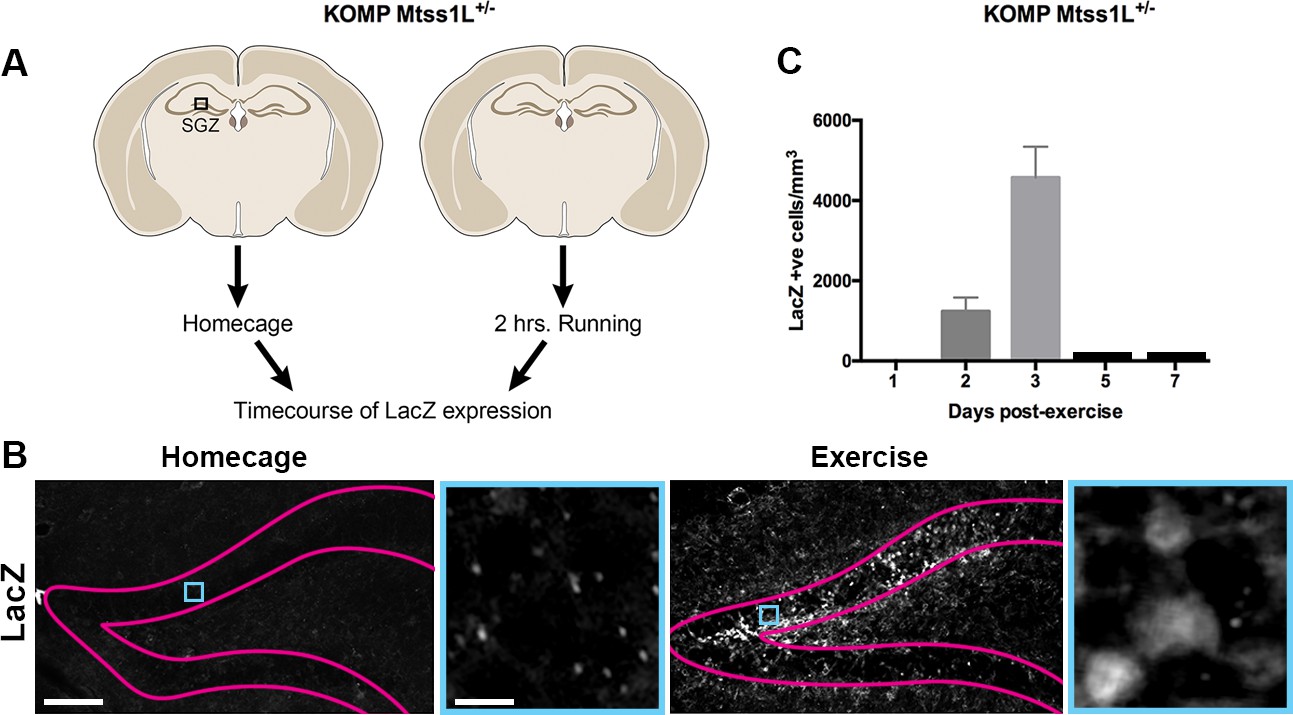
Timecourse of LacZ expression in Mtss1L reporter mice.
(A) Schematic representation of the experimental paradigm used for the Mtss1L reporter mice. KOMP Mtss1l +/- were either housed in their homecage or exposed to 2 hr of voluntary exercise. Brain sections were processed for LacZ immunohistochemistry at several time points. (B) Pink lines outline the granular cell layer of the dentate gyrus based on DAPI staining and blue square identifies the area magnified at right. LacZ was detected only in dentate granule cells of mice at 3 days post-exercise (bottom, right), whereas no expression was observed in homecage littermates (bottom, left). Scale bars: 250 µm, 12 µm. (C) LacZ expression in granule cells peaked at 3 days post-exercise and was not detectable at 5 or 7 days post-exercise (LacZ+ cells/mm3 2 days post-exercise: 1235 ± 345, n = 3; 3 days post-exercise: 4573 ± 767,n = 3, one-way ANOVA p<0.0001).
Figure 5 with 1 supplement
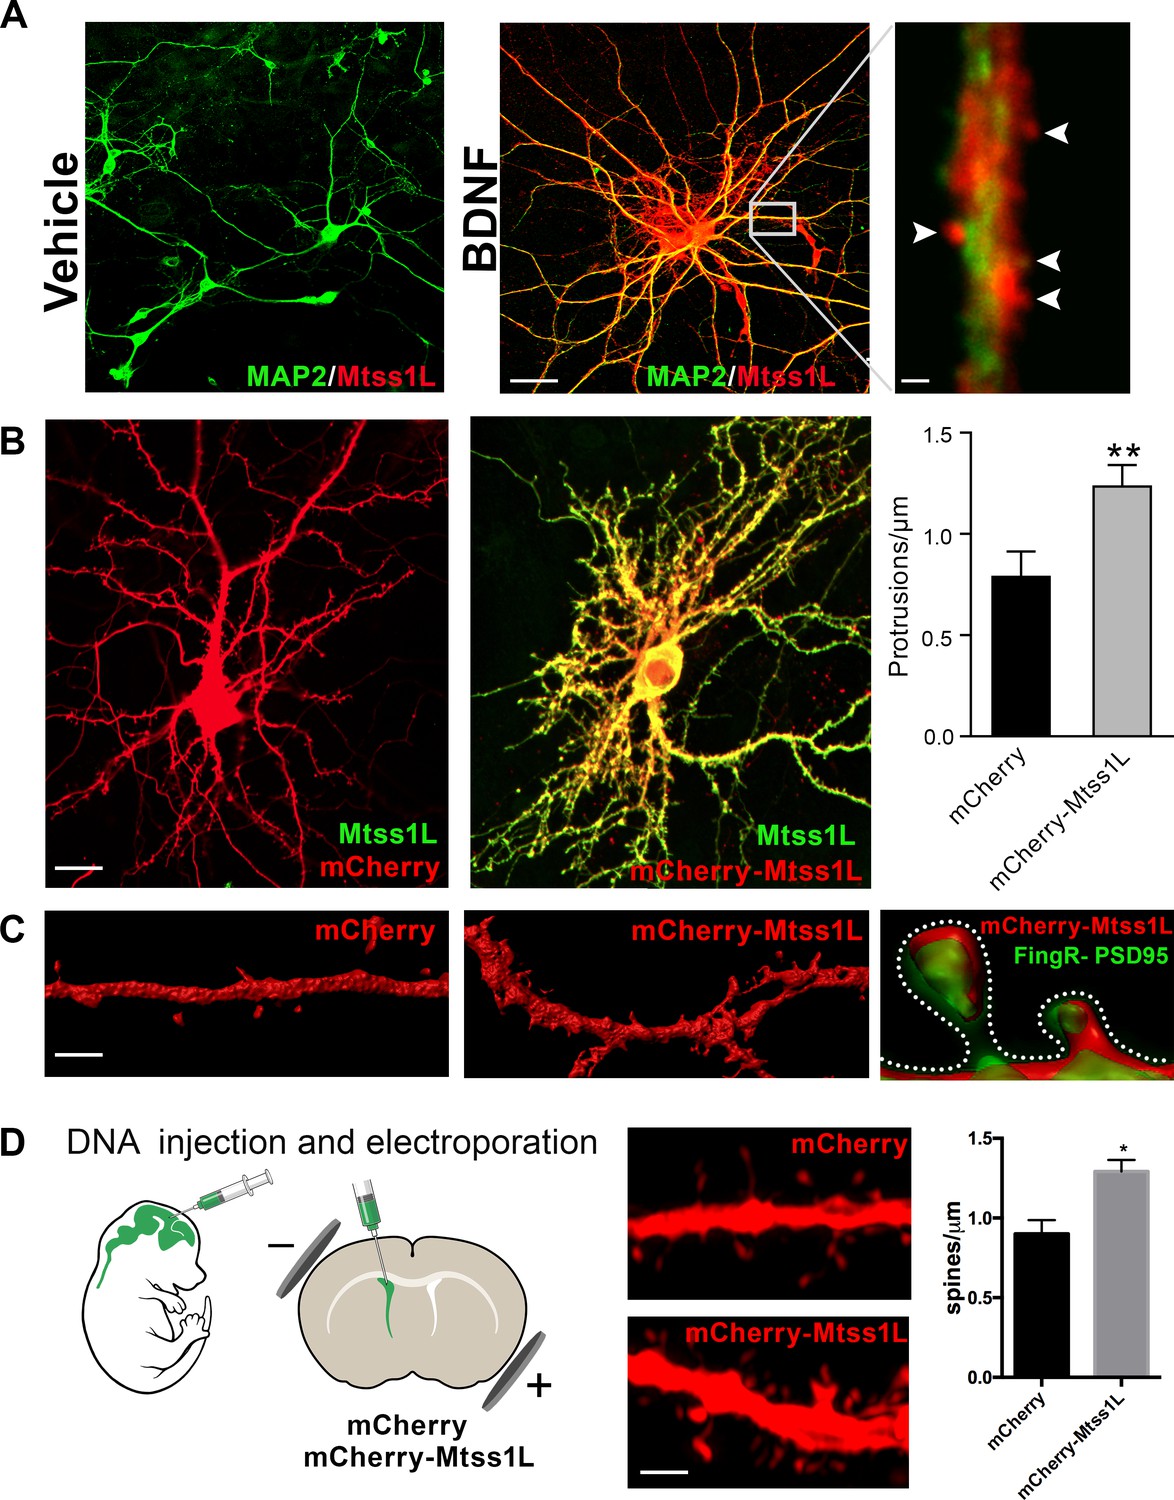
Induced Mtss1L expression in vitro and in vivo.
(A) Primary hippocampal neurons were cultured with or without BDNF from DIV 7–14 to examine activity-dependence of Mtss1L expression. Representative images of hippocampal neurons co-stained with anti-Mtss1L (red) and the somatodendritic marker anti-MAP2 (green) showed robust Mtss1L immunoreactivity in BDNF-treated cells (middle), but not in the vehicle-treated controls (left). Scale bar: 20 µm. High magnification image of a single dendrite in a BDNF-treated neuron showed localization of Mtss1L (red) in dendritic shaft and spines (right, arrowheads, scale bar: 1.5 µm). (B) Representative images of cultured hippocampal neurons transfected with mCherry or Mtss1L-mCherry and stained with anti-Mtss1L (green). Scale bar: 12 µm. Ectopic expression of Mtss1L markedly increased the number of dendritic protrusions (mCherry: 0.9 ± 0.09, Mtss1L-mCherry: 1.3 ± 0.07, unpaired t-test, p=0.004, n = 3). (C) Higher magnification images of dendritic segments from hippocampal neurons transfected with mCherry (left) or Mtss1L-mCherry (middle) shows the increased number of protrusions. Scale bar: 3 µm. Merged image at right of PSD-95.FingR-GFP and Mtss1L-mCherry in co-transfected neurons demonstrates that the protrusions contained postsynaptic proteins. Scale bar: 0.5 µm. (D) DNA solution was injected into the lateral ventricle of P0 pups followed by gene delivery by electroporation. Representative dendritic segments of dentate granule cells expressing control plasmid mCherry (top) or mCherry-Mtss1L (bottom) 21 days post-electroporation. Scale bar: 3 µm. Mtss1L-mCherry expressing cells show increased dendritic protrusions in vivo (mCherry, 0.9 ± 0.03, n = 3, Mtss1L-mCherry, 1.3 ± 0.07, n = 3, unpaired t-test, p=0.004).
Figure 5—figure supplement 1
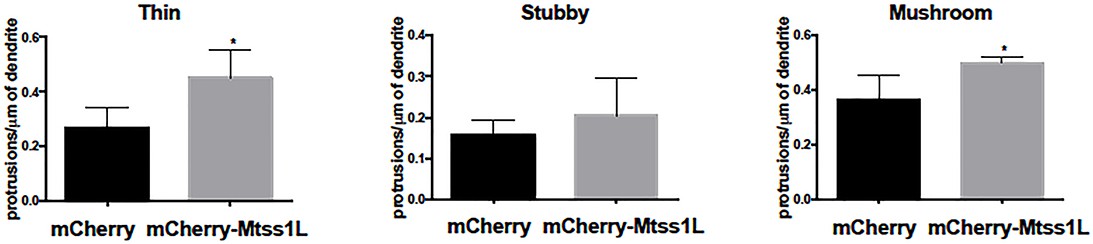
Effect of Mtss1L overexpression on dendritic spine subtypes of primary hippocampal neurons in vitro.
Mtss1L overexpression significantly increased the density of both thin and mushroom dendritic spines, whereas there was no difference in the density of stubby spines (n = 3, unpaired t-test, p<0.05).
Figure 6 with 2 supplements
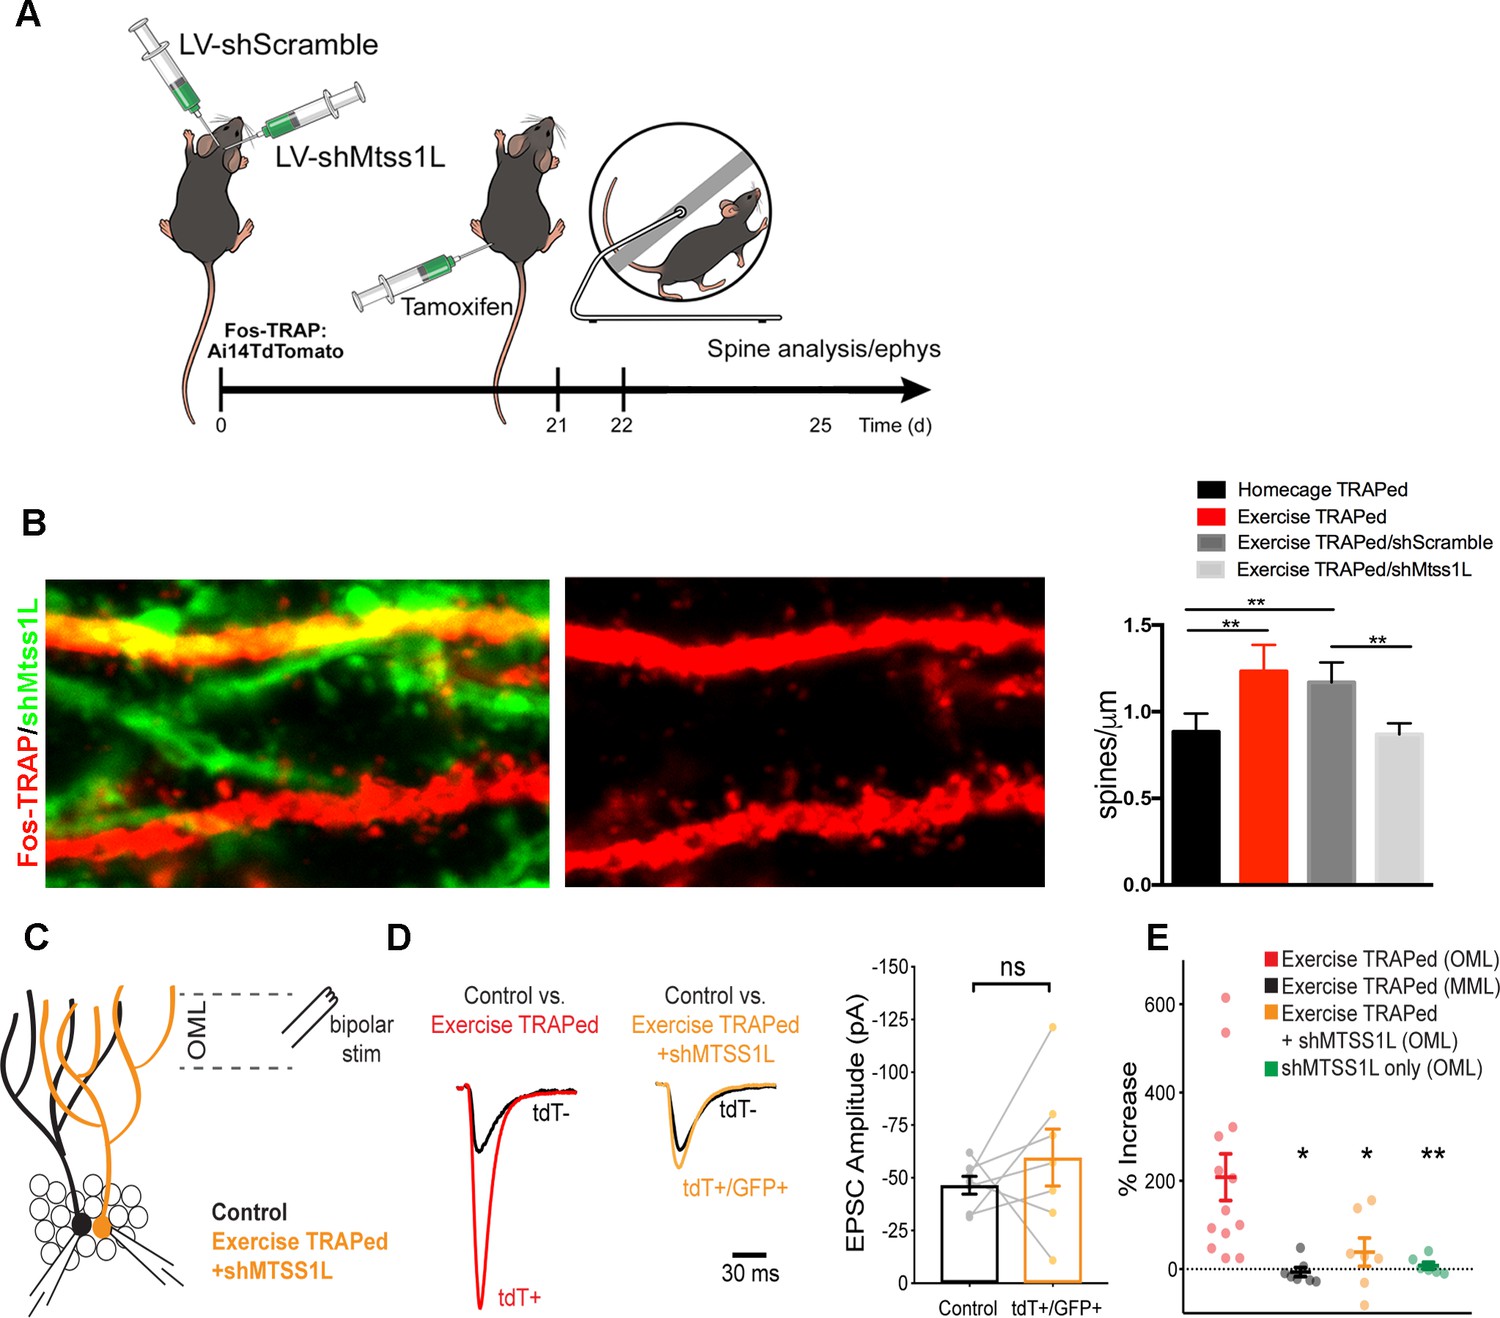
Mtss1L knockdown in exercise-TRAPed cells blocked the exercise-induced increase in dendritic spines and synaptic activity at 3 days post-exercise.
(A) Effects of Mtss1L knockdown on the spine density of exercise-TRAPed cells were assessed by stereotaxically injecting a control shScramble-GFP lentivirus into the left hemisphere and a shMtss1L-GFP lentivirus in the right hemisphere of Fos-TRAP mice. After 21 days, dentate granule cells were exercise-TRAPed and analyzed 3 days later as shown in the schematic. (B) The left panel shows representative OML dendritic segments of exercise-TRAPed cells (red), exercise-TRAPed cells co-expressing shRNA (orange) next to several dendrites expressing only shRNA (green). The middle panel shows the dendritic field isolated in the red channel to allow comparison of dendritic spines in exercise-TRAPed cells at 3 days post exercise with (top, middle panel) and without (bottom, middle panel) co-expression of the Mtss1L shRNA. Mtss1L shRNA, but not shScramble, blocked the exercise–induced increase in dendritic spines in exercise-TRAPed cells. Summary graph at right shows dendritic spine density in the dentate OML for each condition (Homecage TRAPed: 0.8 ± 0.1, n = 4, Exercise TRAPed: 1.2 ± 0.2, n = 5, Exercise TRAPed/shScramble: 1.17 ± 0.1, n = 4, Exercise-TRAPed/shMtss1L: 0.87 ± 0.06, n = 5, one-way ANOVA, multiple comparisons Dunnett’s test, p<0.01). (C) Schematic of simultaneous whole-cell recordings from control (black) and exercise-TRAPed cells co-expressing shRNA-Mtss1L (orange) to assess functional synaptic activity. Lateral perforant path axons were stimulated in the OML. (D) Superimposed EPSCs from a representative control cell (black) and a simultaneously recorded exercise-TRAPed cell (red) showed a large increase in amplitude in the exercise-TRAPed cells, as quantified in Figure 1E. In contrast, superimposed EPSCs from a control cell (black, 46.5 ± 4.2 pA) and an exercise-TRAPed cell co-expressing shMtss1L (orange, −59.6 ± 13.5 pA) showed no increase in amplitude (p=0.42, paired t-test, seven-cell pairs from five mice). Traces are normalized and scaled relative to control cells (black) for presentation. (E) Summary plot across experimental conditions. The exercise-TRAPed increase in EPSC amplitude in the OML was blocked by Mtss1L shRNA expression in exercise-TRAPed cells. (Percent increase in EPSC amplitudes: exercise-TRAPed - OML stimulation, 208.2 ± 52.8%, n = 13 cells, eight mice; exercise-TRAPed - MML stimulation, - 6.7 ± 10.1%, n = 7 cells, four mice; exercise TRAPed +shMtss1L - OML stimulation, 38.4 ± 32.1%, n = 7 cells, five mice; shMtss1L only - OML stimulation, 7.8 ± 8.0%, n = 6 cells, three mice, p=0.002, one-way ANOVA; exercise-TRAPed shMtss1L, p=0.025; shMtss1L only, p=0.011; exercise-TRAPed MML, p=0.004; Dunnett’s test).
Figure 6—figure supplement 1
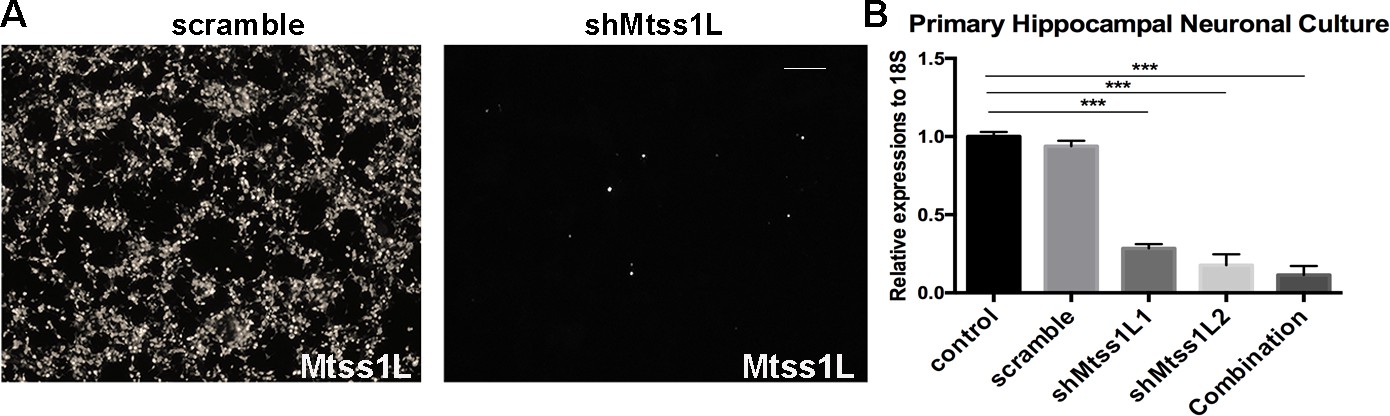
Mtss1L shRNA knockdown efficiency.
(A) shRNA knockdown efficiency was first screened using HEK293T cells overexpressing Mtss1L after transduction with lentiviral construct FUGW-mcherry-T2A-Mtss1L. Knockdown efficiency of the overexpression construct was confirmed by fluorescence microscopy Scale bar: 200 μm. (B) Primary hippocampal cultures were transduced with 10^5 particles of one or both short hairpin shRNAs against Mtss1L (designated L1 and L2) or shMtss1Lscramble lentivirus, and then treated for 7 d.i.v. with media supplemented by BDNF (25 ng/ml). The shScramble virus was ineffective, whereas the combination of the two short hairpins was the most effective. Mtss1L shRNA knockdown efficiency was analyzed by RT-qPCR for Mtss1L expression, using 18S as the housekeeping/control gene (n = 3 biological replicates, one way ANOVA with Dunnett’s multiple comparison, p<0.001).
Figure 6—figure supplement 2
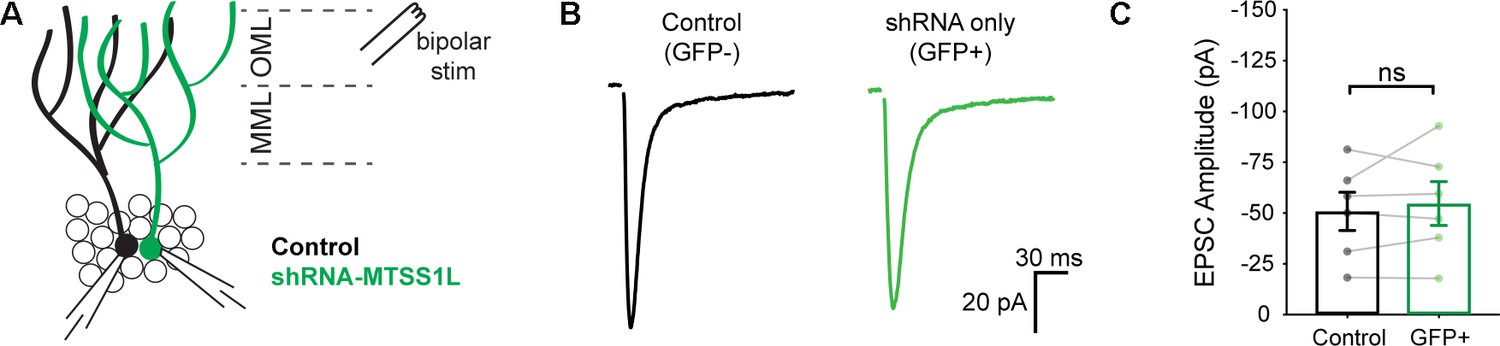
shRNA-Mtss1L did not alter evoked EPSCs in granule cells that were not exercise- TRAPed.
(A) Schematic of paired dentate granule cell recordings. EPSCs were evoked with a bipolar stimulation electrode in the OML. (B) Representative EPSCs from a paired control granule cell (GFP-, black trace) and an adjacent Mtss1L shRNA only (GFP+/tdT-) granule cell show similar amplitudes. Stimulation artifacts were blanked. (C) EPSC amplitudes in paired recordings were unaffected by shRNA-Mtss1L expression in granule cells that were not exercise-TRAPed, indicating that knockdown of Mtss1L had no effect unless the granule cell was exercise-activated (paired t-test, p=0.4805).
Author response image 1
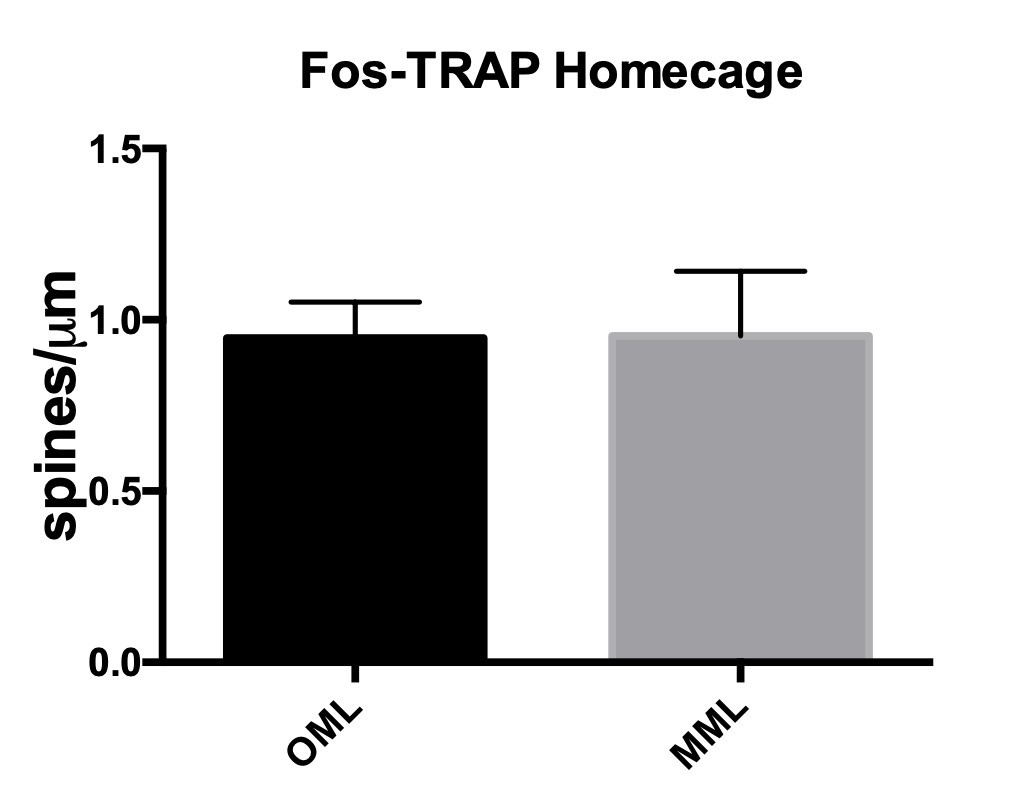
Spine densities were similar in OML and MML of Fos-TRAPed homecage cells.
(OML 3 days: 0.94 ± 0.1, MML: 0.99 ± 0.1, n=5).
Author response image 2

Validation of Mtss1L-/- KO KOMP mice.
(A) RT-qPCR data confirmed Mtss1L deletion in Mtss1L-/- KO KOMP mice in the cerebellum. Notably Mtss1L mRNA levels in the dentate gyrus were undetectable in wildtype (WT) and Mtss1L-/- KO KOMP mice. mRNA was isolated from cerebellum and dentate gyrus tissue from 6 weeks old (WT) and Mtss1L-/- KO KOMP mice. RT-qPCR data are from three animals per genotype, with each sample run in duplicate (p < 0.05, t-test). (B) Mtss1L immunohistochemistry was performed on WT and Mtss1L-/- KO KOMP cerebellum. Purkinje cells were labeled with anti-Calbindin. Although quality of anti-Mtss1L is very low as seen in top panels, Mtss1L expression pattern in the cerebellum of WT mice overlapped with Calbindin+ Purkinje cells. Mtss1L expression was absent in the cerebellum of Mtss1L KO KOMP mice validating both the mouse line and the antibody.
Additional files
-
Supplementary file 1
Intrinsic properties of granule cells during paired recordings.
- https://doi.org/10.7554/eLife.45920.017
-
Supplementary file 2
Three-days complete gene list DESeq.
- https://doi.org/10.7554/eLife.45920.018
-
Supplementary file 3
Seven-days complete gene list DESeq.
- https://doi.org/10.7554/eLife.45920.019
-
Supplementary file 4
List of primers used for RT-qPCR analysis.
- https://doi.org/10.7554/eLife.45920.020
-
Transparent reporting form
- https://doi.org/10.7554/eLife.45920.021
Download links
A two-part list of links to download the article, or parts of the article, in various formats.
Downloads (link to download the article as PDF)
Open citations (links to open the citations from this article in various online reference manager services)
Cite this article (links to download the citations from this article in formats compatible with various reference manager tools)
Exercise-induced enhancement of synaptic function triggered by the inverse BAR protein, Mtss1L
eLife 8:e45920.
https://doi.org/10.7554/eLife.45920


