Ca2+ sensor synaptotagmin-1 mediates exocytosis in mammalian photoreceptors
- University of Nebraska Medical Center, United States
Figures
Figure 1
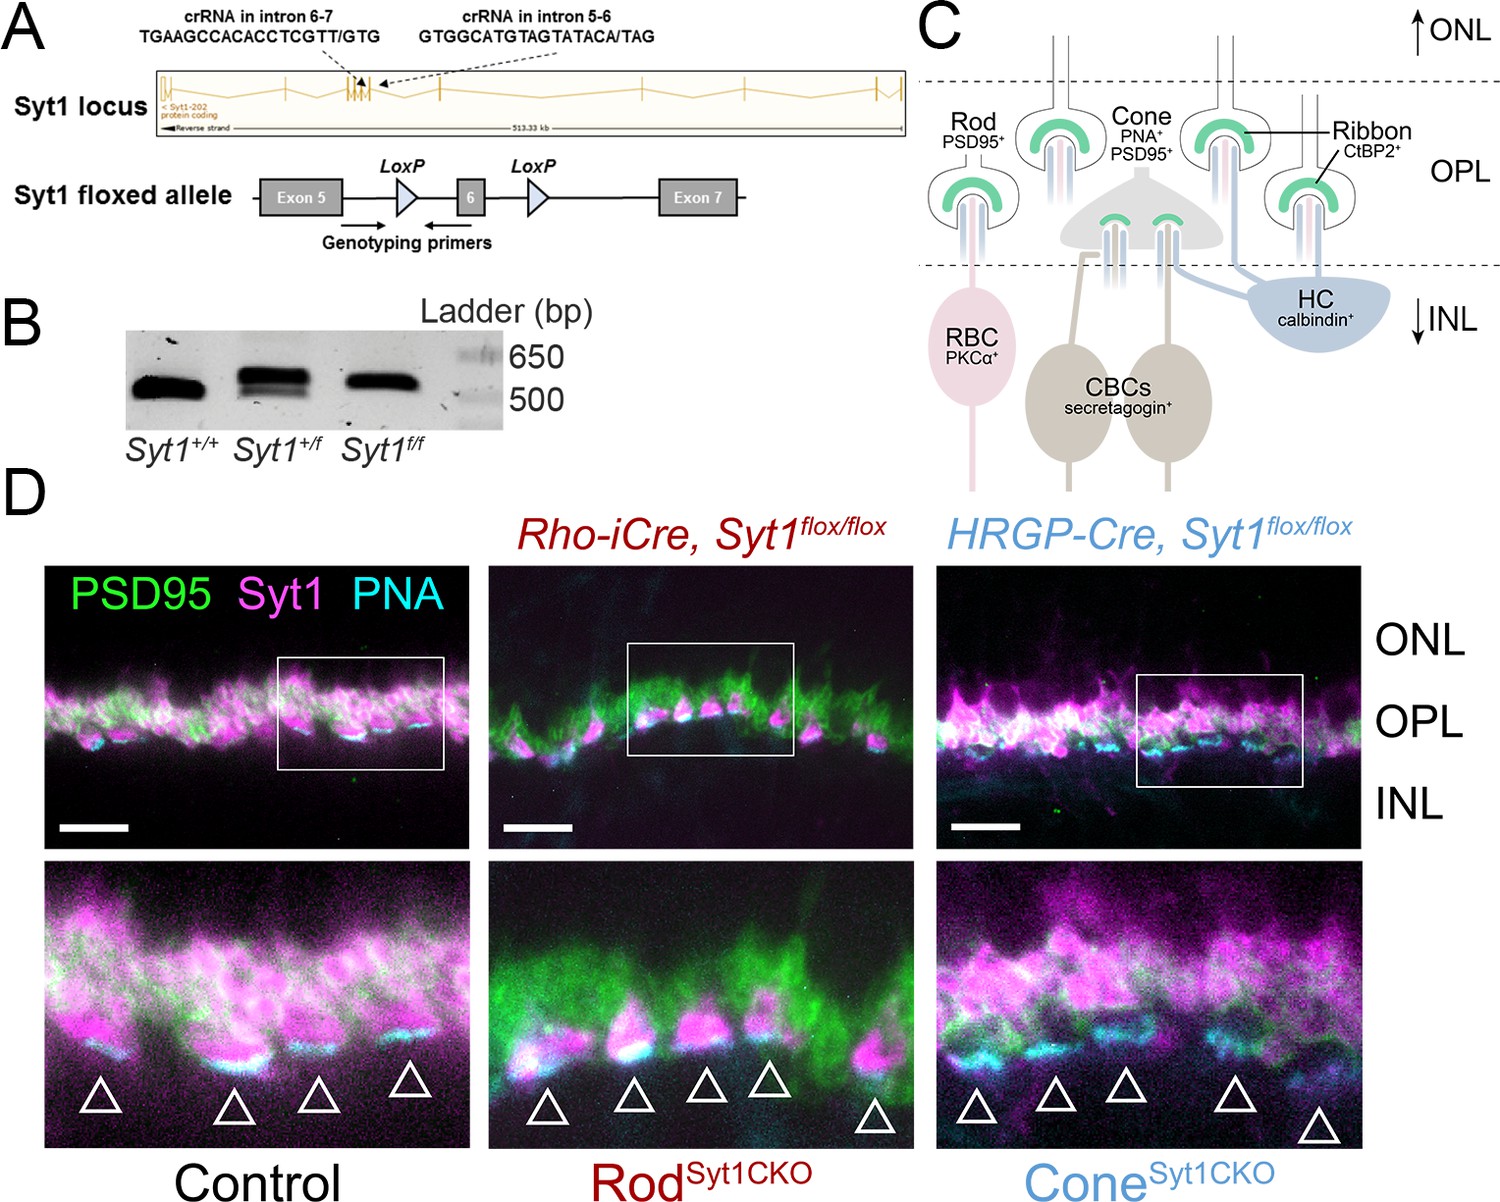
Syt1 was conditionally deleted from rods and cones in RodSyt1CKO and ConeSyt1CKO retinas, respectively.
(A) Top: Syt1 locus showing crRNA sequences used for inserting LoxP sites flanking exon 6; ‘/” in the amino acid sequence indicates the nucleotide positions where LoxP sites were inserted. Bottom: schematic of the Syt1flox allele showing location of genotyping primers and LoxP sites. (B) 5’ LoxP PCR of the Syt1 allele from WT (Syt1+/+) and Syt1 floxed mice (Syt1+/f: heterozygous, Syt1f/f: homozygous). Expected band sizes are 484 bp for the WT allele and 524 bp for the floxed allele. (C) Diagram illustrating fluorescent labels used for different cell types. Rod and cone terminals can be labeled with antibodies to PSD95. The base of cone terminals can be labeled with fluorescently-conjugated peanut agglutinin (PNA). Rod and cone ribbons were labeled with antibodies to CtBP2. Horizontal cells (HCs), rod bipolar cells (RBCs), and cone bipolar cells (CBCs) were labeled with antibodies to calbindin, PKCα, and secretagogin, respectively. (D) Images of control, RodSyt1CKO, and ConeSyt1CKO retinas labeled with PNA (cyan) to mark cone terminals as well as antibodies to PSD95 (green) and Syt1 (magenta). Bottom images show magnified regions outlined in the top images. Arrowheads indicate cone terminals. Scale bars = 10 µm. ONL: outer nuclear layer, INL: inner nuclear layer.
Figure 2
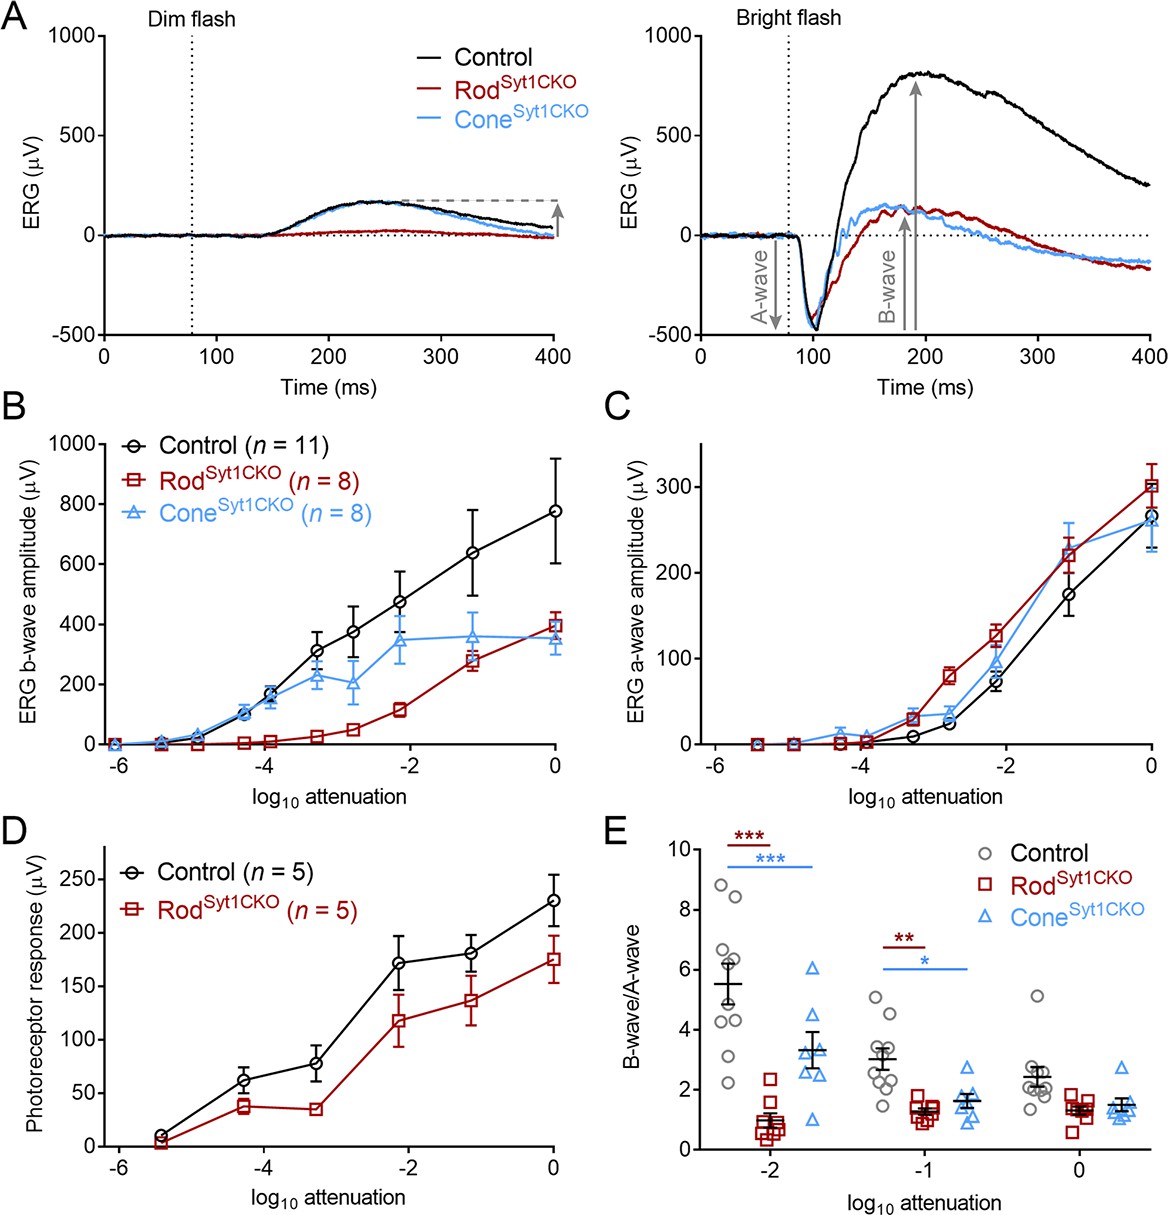
Flash ERG responses suggest a significant role for Syt1 in photoreceptor neurotransmission.
(A) Example ERG recordings from control, RodSyt1CKO, and ConeSyt1CKO retinas in response to 20 ms dim (left, 10−4 of maximum) and bright (right, 10−1 of maximum) flashes. Downward gray arrows indicate a-waves and upward arrows indicate b-waves (a-waves are obscured by b-waves at low intensities). (B) Average b-wave flash intensity-response functions for the three genotypes. Maximum intensity b-waves: control: 777.7 ± 174.4 μV, RodSyt1CKO: 396.1 ± 44.3 μV, ConeSyt1CKO: 354.0 ± 55.5 μV; RodSyt1CKO vs. control: p=0.10, ConeSyt1CKO vs. control: p=0.06 (one-way ANOVA). (C) A-wave flash intensity-response curves for the three genotypes. Same legend as B). Maximum intensity a-waves: control: 266.7 ± 37.1 μV, RodSyt1CKO: 301.4 ± 25.4 μV, ConeSyt1CKO: 261.6 ± 37.0 μV; RodSyt1CKO vs. control: p=0.72, ConeSyt1CKO vs. control: p=0.99 (one-way ANOVA). (D) Isolated photoreceptor responses in control and RodSyt1CKO retinas. No means were significantly different (t-tests corrected for multiple comparisons). (E) B-wave/a-wave ratios for control (n = 10), RodSyt1CKO (n = 8), and ConeSyt1CKO (n = 7) retinas. 10−2 attenuation: control: 5.5 ± 0.68, RodSyt1CKO: 0.99 ± 0.24, ConeSyt1CKO: 3.3 ± 0.61; RodSyt1CKO vs. control: p=0.0001, ConeSyt1CKO vs. control: p=0.0005. 10−1 attenuation: control: 3.0 ± 0.36, RodSyt1CKO: 1.3 ± 0.11, ConeSyt1CKO: 1.6 ± 0.23; RodSyt1CKO vs. control: p=0.004, ConeSyt1CKO vs. control: p=0.03. Maximum intensity: control: 2.4 ± 0.33, RodSyt1CKO: 1.3 ± 0.13, ConeSyt1CKO: 1.5 ± 0.22; RodSyt1CKO vs. control: p=0.08, ConeSyt1CKO vs. control: p=0.19 (repeated measures 2-way ANOVA). ***p≤0.0005, **p=0.004, *p=0.03.
Figure 3

Double-flash and flicker ERG responses indicate severely impaired neurotransmission in photoreceptors that lack Syt1.
(A) Schematic of the double-flash ERG protocol used for data in B-D. (B) Examples of superimposed ERG responses to the first and second flashes elicited by the protocol in A (10−1 of maximum intensity) from control, RodSyt1CKO, and ConeSyt1CKO retinas. (C) B-wave2/B-wave1 ratios for the three genotypes across flash intensities. 10−4 attenuation: control: 0.75 ± 0.02, n = 12; RodSyt1CKO: 1.27 ± 0.06, n = 2; ConeSyt1CKO: 0.46 ± 0.06, n = 7; RodSyt1CKO vs. control not analyzed because n = 2, ConeSyt1CKO vs. control: p=0.0005. 10−3 attenuation: control: 0.60 ± 0.04, n = 13; RodSyt1CKO: 1.11 ± 0.08, n = 4; ConeSyt1CKO: 0.31 ± 0.05, n = 8; RodSyt1CKO vs. control: p=0.0005, ConeSyt1CKO vs. control: p=0.0008. 10−2 attenuation: control: 0.25 ± 0.02, n = 13; RodSyt1CKO: 0.59 ± 0.04, n = 6; ConeSyt1CKO: 0.064 ± 0.02, n = 7; RodSyt1CKO vs. control: p=0.0005, ConeSyt1CKO vs. control: p=0.0008. 10−1 attenuation: control: 0.24 ± 0.02, n = 12; RodSyt1CKO: 0.53 ± 0.04, n = 6; ConeSyt1CKO: 0.042 ± 0.02, n = 6; RodSyt1CKO vs. control: p=0.0005, ConeSyt1CKO vs. control: p=0.0008. Maximum intensity: control: 0.15 ± 0.03, n = 12; RodSyt1CKO: 0.27 ± 0.05, n = 5; ConeSyt1CKO: 0.014 ± 0.01, n = 7; RodSyt1CKO vs. control: p=0.02, ConeSyt1CKO vs. control: p=0.005 (one-way ANOVAs corrected for multiple comparisons). (D) A-wave2/A-wave1 ratios for the three genotypes. No comparisons with control were significant at any intensity. 10−2 attenuation: control: 0.22 ± 0.03, n = 13; RodSyt1CKO: 0.24 ± 0.02, n = 6; ConeSyt1CKO: 0.22 ± 0.04, n = 7; RodSyt1CKO vs. control: p=0.93, ConeSyt1CKO vs. control: p=0.99. 10−1 attenuation: control: 0.18 ± 0.02, n = 12; RodSyt1CKO: 0.21 ± 0.02, n = 6; ConeSyt1CKO: 0.27 ± 0.04, n = 6; RodSyt1CKO vs. control: p=0.93, ConeSyt1CKO vs. control: p=0.17. Maximum intensity: control: 0.14 ± 0.02, n = 12; RodSyt1CKO: 0.18 ± 0.02, n = 6; ConeSyt1CKO: 0.18 ± 0.04, n = 7; RodSyt1CKO vs. control: p=0.93, ConeSyt1CKO vs. control: p=0.76 (one-way ANOVAs corrected for multiple comparisons). (E) Average (± SEM) normalized ERG responses of control and ConeSyt1CKO retinas to a bright 25 Hz flicker stimulus. ***p<0.001, **p=0.005, *p=0.02.
Figure 4
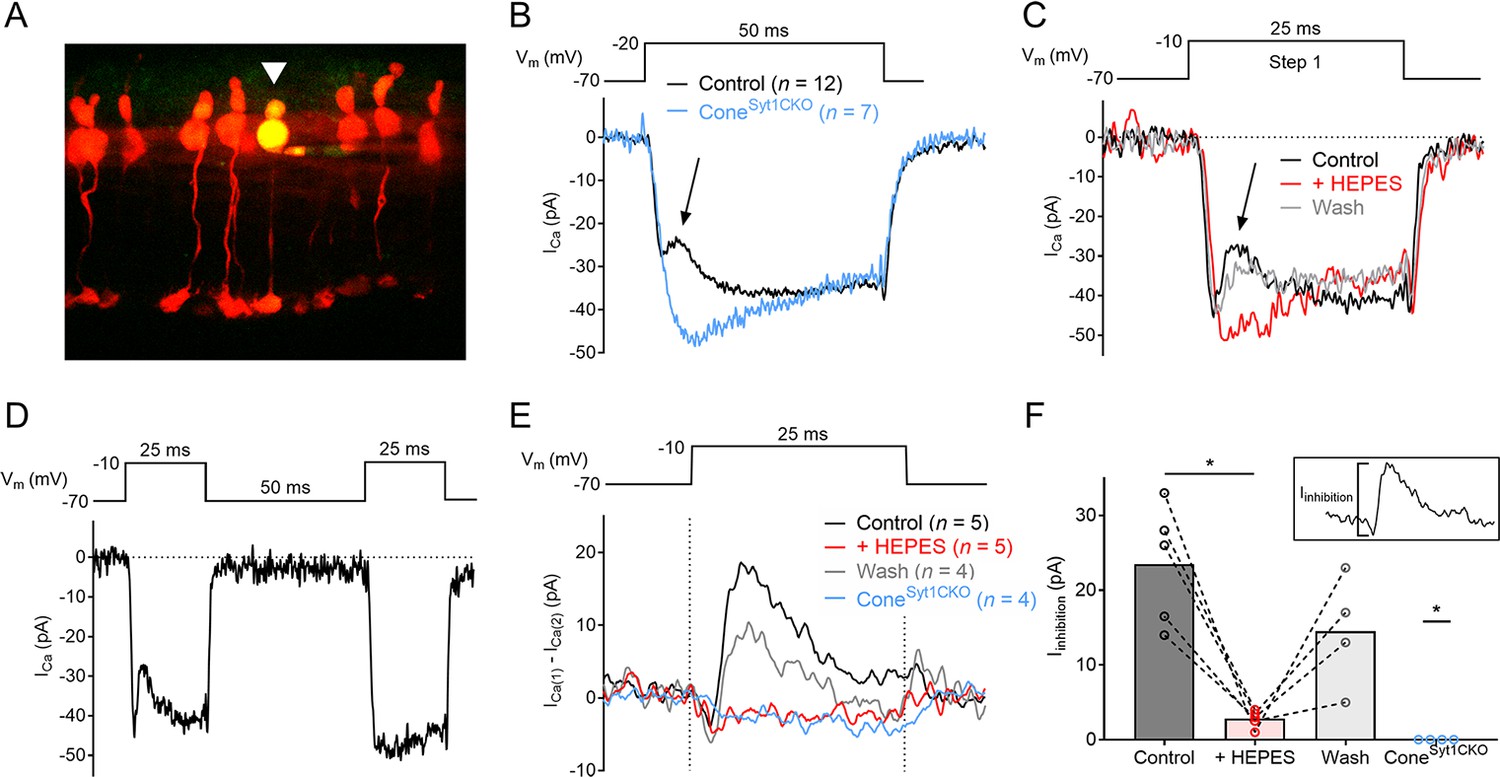
Cones lacking Syt1 do not experience inhibition of ICa by vesicular H+.
(A) Image of tdTomato+ cones in an ex vivo retinal slice. One cone was filled with a patch pipette solution supplemented with Lucifer yellow (arrowhead). (B) Average ICa recorded from 12 control and 7 Syt1-deficient cones evoked by a depolarizing step. The arrow points to transient ICa inhibition in control cones. (C) ICa traces from a control cone in response to a depolarizing step in control conditions, in the presence of 20 mM HEPES, and after washout of HEPES. (D) The paired-pulse protocol used to isolate Iinhibition in E–F) and an example of ICa recorded from a control cone (same cell as shown in C). (E) Average Iinhibition obtained by subtracting ICa during the second step (ICa(2)) from the first step (ICa(1)) of the paired-pulse protocol (subtraction traces were smoothed for clarity). Dashed lines indicate the duration of the depolarizing step. (F) Peak amplitude of Iinhibition from control cones in control conditions, control cones with 20 mM HEPES, control cones after washout, and ConeSyt1CKO cones in control conditions. Inset image shows Iinhibition amplitude measurement for the control condition. Control: 23.5 ± 3.6, n = 5; HEPES: 2.8 ± 0.5, n = 5; washout: 14.5 ± 3.8, n = 4; ConeSyt1CKO: 0, n = 4. Control vs. HEPES: p=0.04, control vs. wash: p=0.07 (repeated measures one-way ANOVA); control vs. ConeSyt1CKO: p=0.02 (Mann-Whitney test). One cone was lost before washout so it could not be included in ANOVA analysis. *p≤0.04.
Figure 5

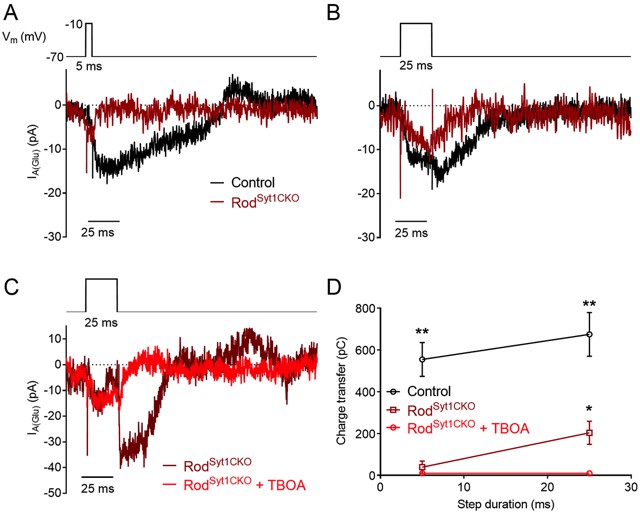
Glutamate release is eliminated in cones lacking Syt1.
Example IA(Glu) recordings from control and Syt1-deficient cones in response to 2 (A), 5 (B), and 25 (C) ms depolarizing steps (−70 to −10 mV). (D) Example IA(Glu) recordings from a control cone evoked by 25 ms steps in control conditions and following bath application of the glutamate transport inhibitor, TBOA (100 μM). (E) IA(Glu) charge transfer as a function of step duration in control cones, ConeSyt1CKO cones, and control cones in the presence of 100 μM TBOA. Charge transfer was measured from the end of the test step. 2 ms: control: 1415 ± 463 pC, n = 7 cones; ConeSyt1CKO: 20.7 ± 7.6 pC, n = 9 cones; control vs. ConeSyt1CKO, p=0.0039. 5 ms: control: 3675 ± 646 pC, n = 19 cones; ConeSyt1CKO: 49.8 ± 11.3 pC, n = 8 cones; control +TBOA: 160.3 ± 51.3 pC, n = 7 cones; ConeSyt1CKO vs. control: p=0.0014, TBOA vs. control: p=0.0033. 25 ms: control: 4507 ± 734 pC, n = 17 cones; ConeSyt1CKO: 64.9 ± 29.9 pC, n = 10 cones; control +TBOA: 455 ± 139 pC, n = 9 cones; ConeSyt1CKO vs. control: p=0.0003, TBOA vs. control: p=0.0012 (t-tests corrected for multiple comparisons).
Figure 6
Glutamate release is diminished in rods lacking Syt1.
Example IA(Glu) recordings from control and Syt1-deficient rods in response to 5 (A) and 25 (B) ms depolarizing steps (−70 to −10 mV). (C) Example IA(Glu) recordings from a Syt1-deficient rod evoked by 25 ms steps in control conditions and following bath application of the glutamate transport inhibitor, TBOA (300 μM). (D) IA(Glu) charge transfer as a function of step duration in control rods, RodSyt1CKO rods, and in RodSyt1CKO rods in the presence of 300 μM TBOA. 5 ms: control: 555 ± 81 pC, n = 39 rods; RodSyt1CKO: 39.1 ± 29,3 pC, n = 31 rods; RodSyt1CKO + TBOA: 10.0 ± 2.9 pC, n = 6 rods; RodSyt1CKO vs. control: p<0.0001. 25 ms: control: 674 ± 105 pC, n = 37 rods; RodSyt1CKO: 203.7 ± 55.7 pC, n = 44 rods; RodSyt1CKO + TBOA: 9.6 ± 7.5 pC, n = 8 rods; RodSyt1CKO vs. control: p<0.0001 (t-tests corrected for multiple comparisons), RodSyt1CKO vs. RodSyt1CKO + TBOA: p=0.0012 (Welch’s t-test). **p<0.0001, *p=0.0012.
Figure 7
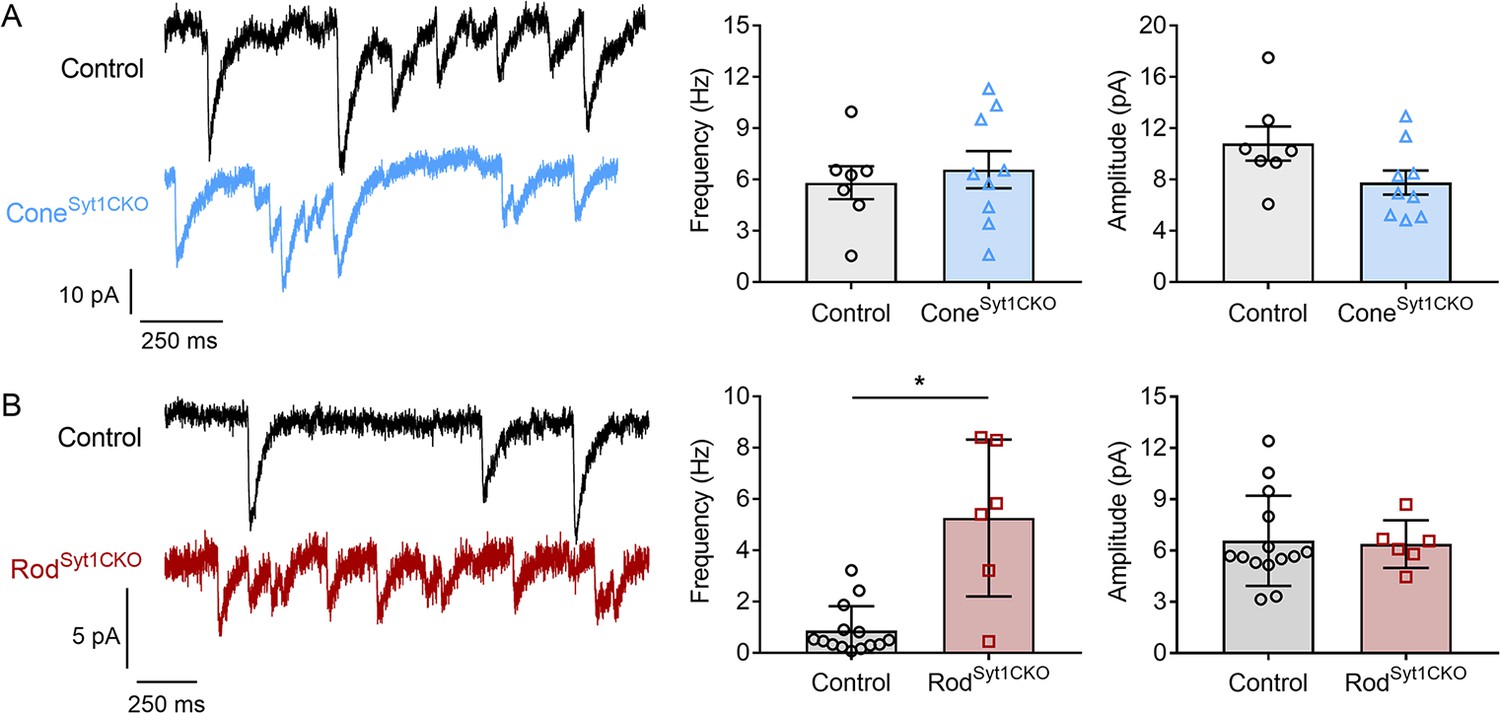
Spontaneous release persists in photoreceptors lacking Syt1.
(A) Traces showing spontaneous IA(Glu) events from control and ConeSyt1CKO cones held at −70 mV. Frequency: control: 5.8 ± 0.96 Hz, n = 7 cones; ConeSyt1CKO: 6.6 ± 1.09 Hz, n = 9 cones; p=0.62 (t-test). Amplitude: control: 10.8 ± 1.34 pA, n = 7 cones; ConeSyt1CKO: 7.8 ± 0.95 pA, n = 9 cones; p=0.08 (t-test). (B) Traces showing spontaneous IA(Glu) events from control and RodSyt1CKO rods held at −70 mV. Frequency: control: 0.9 ± 0.25 Hz, n = 14 rods; RodSyt1CKO: 5.3 ± 1.25 Hz, n = 6 rods; p=0.004 (Mann-Whitney test). Amplitude: control: 6.6 ± 0.70 pA, n = 14 rods; RodSyt1CKO: 6.4 ± 0.57 pA, n = 6 rods; p=0.87 (t-test). *p=0.004.
Figure 8

ICa is not reduced in photoreceptors lacking Syt1.
(A) Example current-voltage relationship of ramp-evoked ICa and step-evoked QCa (a Boltzmann function adjusted for Ca2+ driving force was fit to QCa) in a control cone. (B) Average QCa as a function of step voltage for control and ConeSyt1CKO cones. No means differed significantly (t-tests corrected for multiple comparisons). (C) Example ramp-evoked ICa traces from a control and ConeSyt1CKO cone. (D) Ramp-evoked ICa peak amplitude (left) and V0.5 values (middle), and step-evoked QCa V0.5 values (right) from control and ConeSyt1CKO cones. ICa amplitude: Control: 33.1 ± 2.63 pA, n = 12; ConeSyt1CKO: 42.5 ± 3.43 pA, n = 12; p=0.04 (t-test). ICa V0.5: Control: −36.6 ± 0.83 mV, n = 12; ConeSyt1CKO: −38.8 ± 0.84 mV, n = 11; p=0.07 (t-test). QCa V0.5: Control: −33.2 ± 0.98 mV, n = 12; ConeSyt1CKO: −34.1 ± 2.01 mV, n = 7; p=0.67 (t-test). (E) Average ICa traces from control and RodSyt1CKO rods. (F) Ramp-evoked ICa peak amplitude from control and RodSyt1CKO rods. Control: 4.6 ± 0.87 pA, n = 7; RodSyt1CKO: 4.2 ± 0.88 pA, n = 11; p=0.76 (t-test).
Figure 9
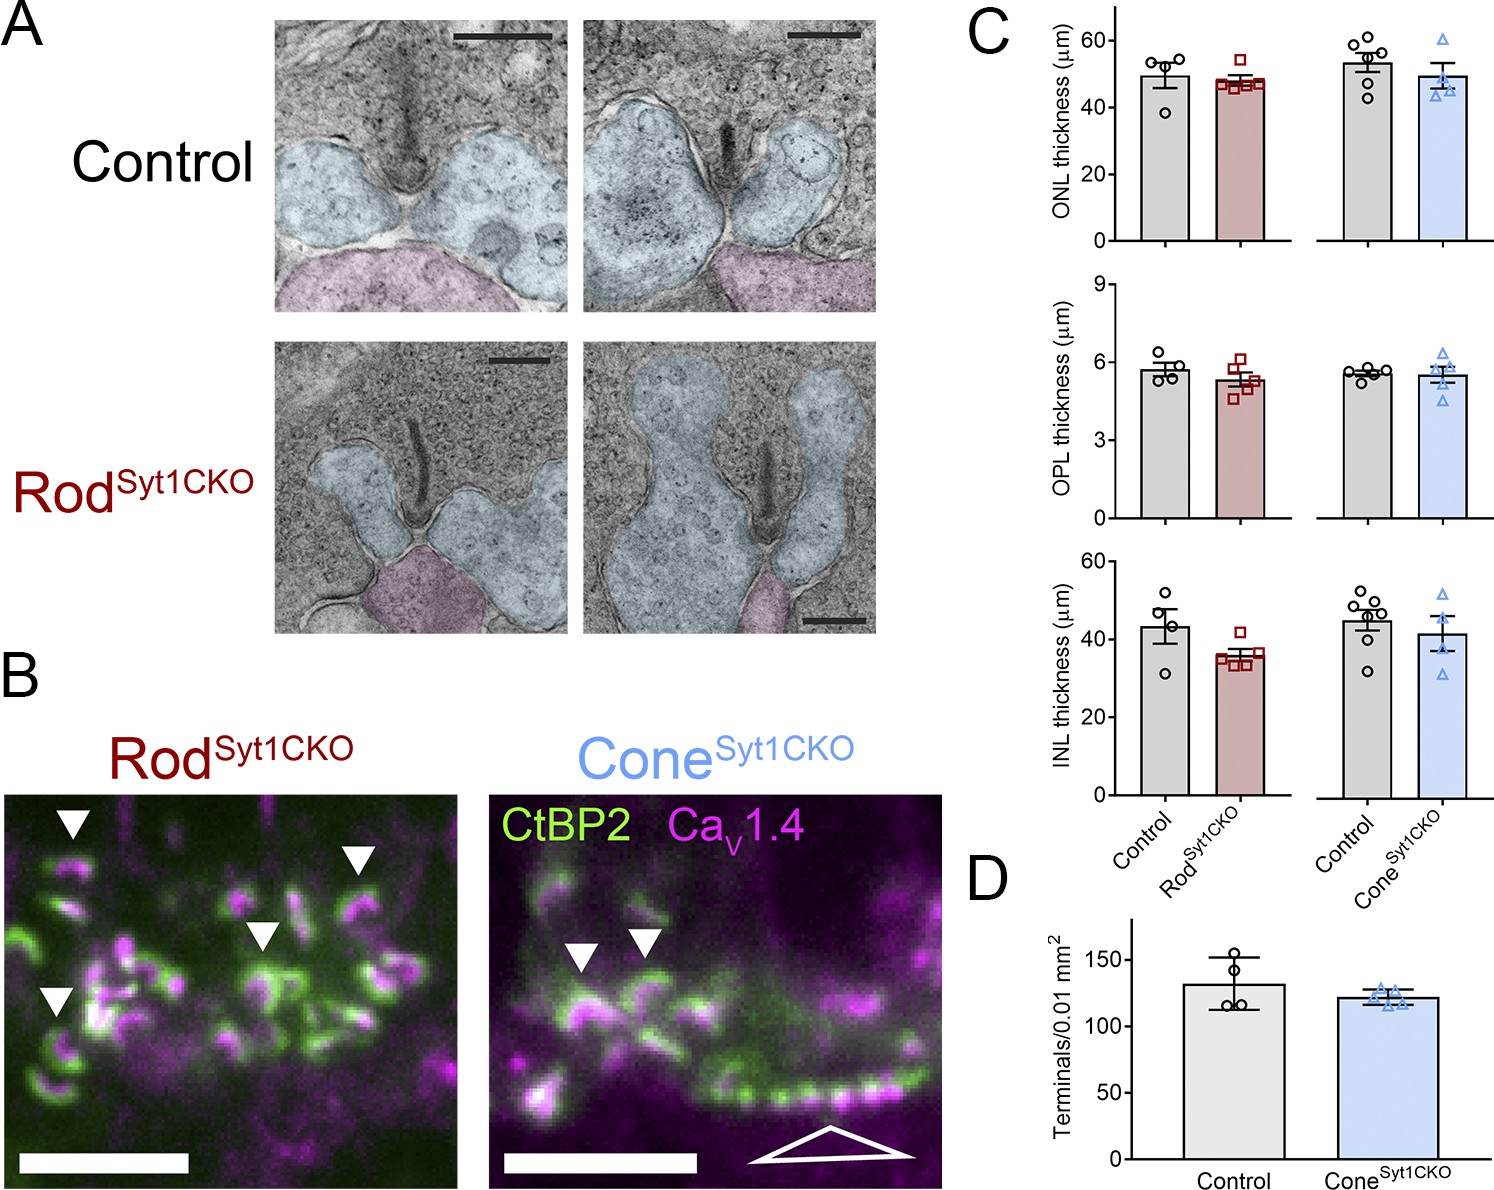
Photoreceptor synapses and retinal lamination appear unchanged in Syt1-mutant retinas.
(A) TEM images of two rod synapses each from a control and RodSyt1CKO retina with pseudocoloring of presumed horizontal cell (blue) and rod bipolar cell (magenta) dendrites. Scale bars = 200 nm. (B) Images centered on the OPL of RodSyt1CKO and ConeSyt1CKO retinas co-labeled with antibodies to CaV1.4 (magenta) and CtBP2 (ribbons, green). Solid arrowheads indicate exemplar rod ribbon complexes and the open triangle points to numerous ribbon complexes within a cone terminal. Scale bars = 5 µm. (C) Measurements of ONL, OPL, and INL thickness from RodSyt1CKO, ConeSyt1CKO, and their respective control retinas. ONL: rod control: 49.6 ± 3.79 μm, n = 4; RodSyt1CKO: 48.1 ± 1.56 μm, n = 5; p=0.69; cone control: 53.5 ± 2.88 μm, n = 6; ConeSyt1CKO: 49.5 ± 3.84 μm, n = 4; p=0.42. OPL: rod control: 5.7 ± 0.26 μm, n = 4; RodSyt1CKO: 5.3 ± 0.27 μm, n = 5; p=0.34; cone control: 5.6 ± 0.10 μm, n = 5; ConeSyt1CKO: 5.5 ± 0.31 μm, n = 5; p=0.88. INL: rod control: 43.4 ± 4.42 μm, n = 4; RodSyt1CKO: 36.0 ± 1.58 μm, n = 5; p=0.13; cone control: 45.8 ± 2.64 μm, n = 7; ConeSyt1CKO: 42.4 ± 4.49 μm, n = 4; p=0.50 (t-tests). (D) Density of cone terminals per 0.01 mm2 in control and ConeSyt1CKO retinas. Control: 132.2 ± 9.81, n = 4 retinas; ConeSyt1CKO: 122.1 ± 2.59, n = 5 retinas; p=0.30 (t-test).
-
Figure 9—source data 1
Data for Figure 9C: Measurements of outer nuclear layer (ONL), outer plexiform layer (OPL, and inner nuclear layer (INL) thickness from RodSyt1CKO, ConeSyt1CKO, and their respective control retinas.
Data for Figure 9D. Density of cone terminals per 0.01 mm2 in control and ConeSyt1CKO retinas.
- https://doi.org/10.7554/eLife.45946.011
Figure 10
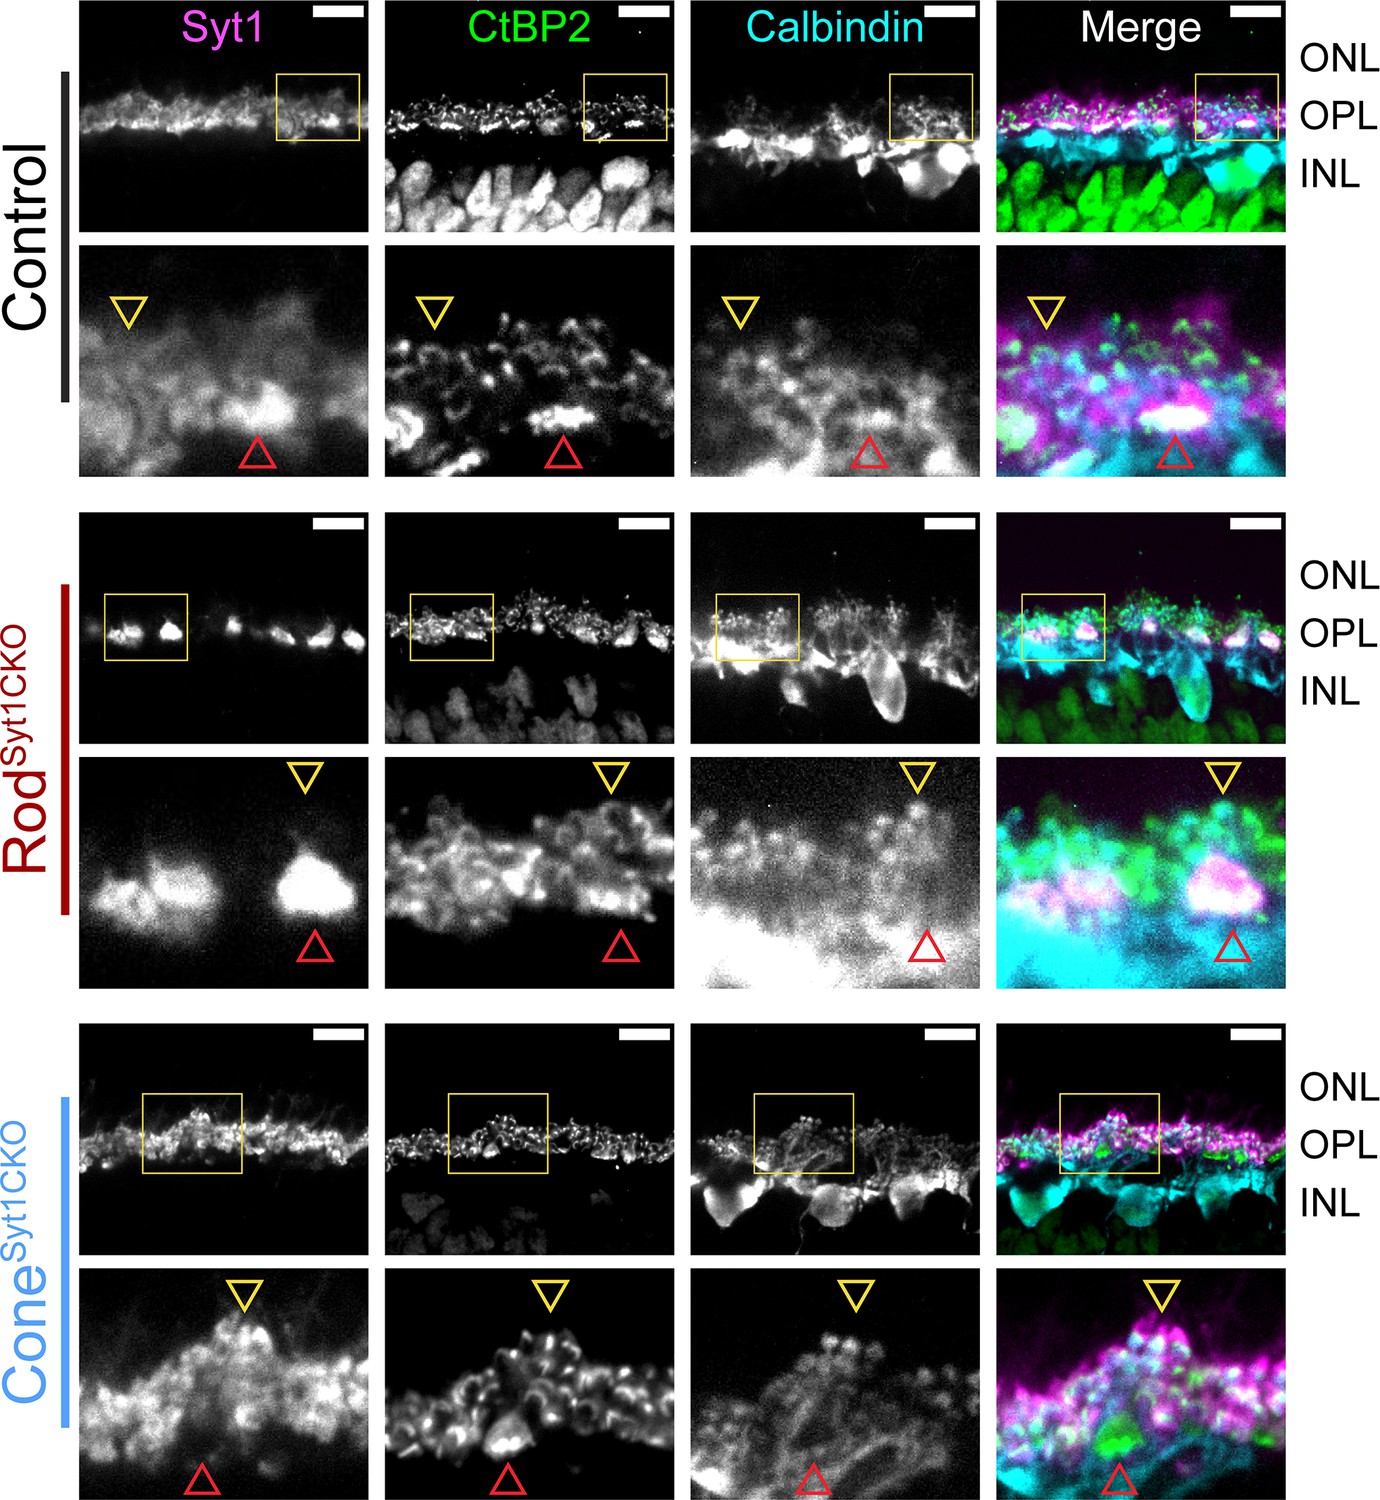
Horizontal cell dendrites maintain contact with Syt1-deficient rod and cone terminals in the OPL.
Images of control, RodSyt1CKO, and ConeSyt1CKO retinas labeled with antibodies to Syt1 (magenta), CtBP2 (ribbons, green), and calbindin (horizontal cells, cyan). The top row of images for each genotype contain yellow boxes that indicate the boundaries of the high magnification images below. Red arrowheads point to representative cone terminals, yellow arrowheads point to representative rod terminals. Scale bars = 10 µm.
Figure 11
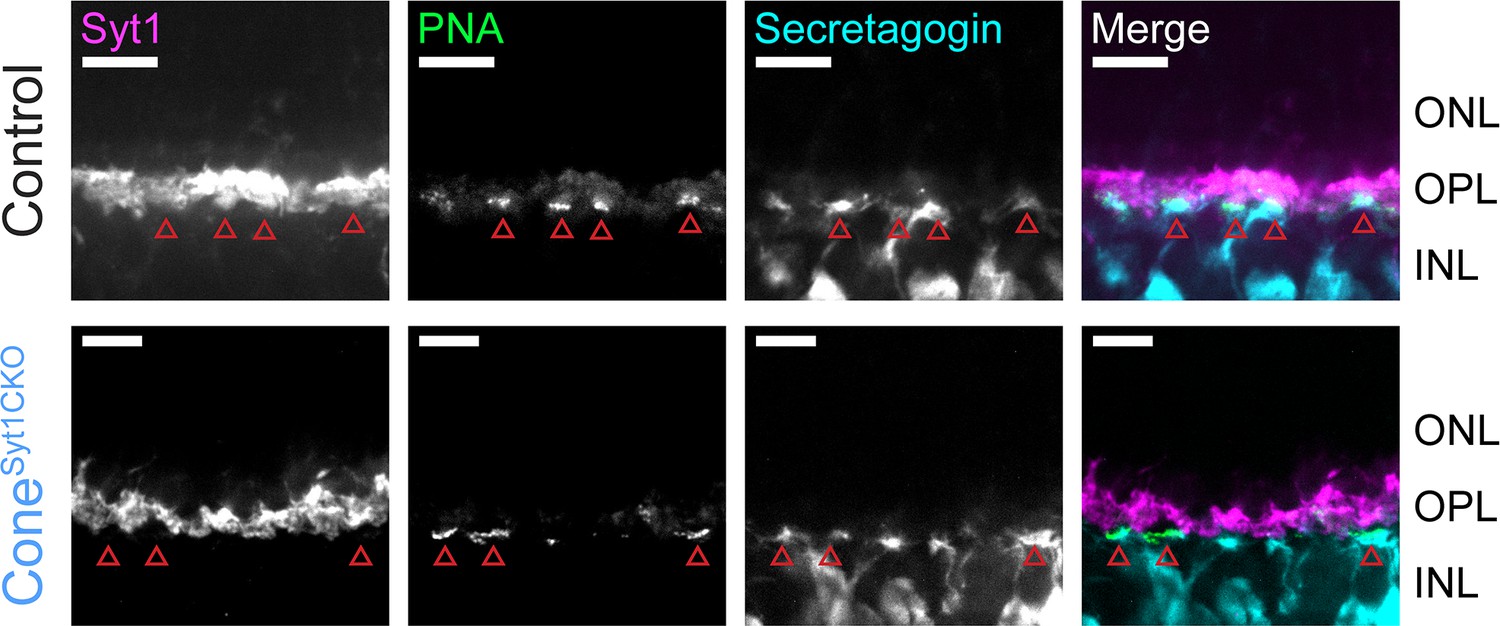
ON cone bipolar cell dendrites maintain contact with Syt1-deficient cone terminals in the OPL.
Images of control and ConeSyt1CKO retinas labeled with PNA (green) to mark cone terminals and antibodies to Syt1 (magenta) and secretagogin (cone bipolar cells, cyan). Red arrowheads indicate cone terminals. Scale bars = 10 µm.
Figure 12

Rod bipolar cell dendrites maintain contact with rod ribbon synapses in the OPL of RodSyt1CKO retinas.
Images of control and RodSyt1CKO retinas labeled with antibodies to CtBP2 (ribbons, green) and PKCα (rod bipolar cells, magenta). Boxes within images on the top indicate the boundaries of high magnification images shown below. Exemplar rod ribbon-rod bipolar cell dendrite contacts are indicated with arrowheads. Scale bars = 10 µm.
Tables
Key resources table
| Reagent type (species) or resource | Designation | Source or reference | Identifiers | Additional information |
|---|---|---|---|---|
| Genetic reagent (mouse) | HRGP-Cre | PMID: 15635292 | NA | |
| Genetic reagent (mouse) | Syt1flox | PMID: 28511701 | NA | Syt1: MGI:99667 |
| Genetic reagent (mouse) | Ai14 | Jackson Laboratories | RRID:IMSR_JAX:007914 | PMID: 20023653 |
| Genetic reagent (mouse) | Rho-iCre | Jackson Laboratories | RRID:IMSR_JAX:015850 | PMID: 15682388 |
| Antibody | Rabbit anti-calbindin | Swant | CB38; RRID:AB_2721225 | 1:10,000 |
| Antibody | Mouse anti-CtBP2 | BD | 612044; RRID:AB_399431 | 1:1000 |
| Antibody | Goat anti-CtBP2 | Santa Cruz | sc-5966; RRID:AB_2086774 | 1:250 |
| Antibody | Rabbit anti-CaV1.4 | Dr. Amy Lee, U. of Iowa | RRID:AB_2650487 | 1:1000 |
| Antibody | Peanut agglutinin (PNA, FITC conjugated) | Bionexus | BN-F44 | 1:100 |
| Antibody | Peanut agglutinin (PNA, Cy-5 conjugated) | Vector Laboratories | CL-1075 | 1:100 |
| Antibody | Rabbit anti-PKC | Santa Cruz | sc-10800; RRID:AB_2168560 | 1:200 |
| Antibody | Rabbit anti-PSD95 | Abcam | ab18258; RRID:AB_444362 | 1:500 |
| Antibody | Rabbit anti-secretagogin | Biovendor | RD181120100; RRID:AB_2034060 | 1:1000 |
| Antibody | Mouse anti-Syt1*Oyster550 | Synaptic Systems | 105 011C3; RRID:AB_887827 | 1:1000 |
| Antibody | Donkey anti-goat secondary (Alexa Fluor 488 conjugated) | Thermo Fisher Scientific | A11055; RRID:AB_142672 | 1:200 |
| Antibody | Goat anti-mouse-FITC | BD | 554001; RRID:AB_395197 | 1:200 |
| Antibody | Goat anti-rabbit secondaries (Alexa Fluor 488 and 568 conjugated) | Thermo Fisher Scientific | A11008, A11011; RRID:AB_143165, AB_143157 | 1:200 |
| Antibody | Donkey anti-rabbit secondary (Alexa Fluor 568 conjugated) | Thermo Fisher Scientific | A10042; RRID:AB_2534017 | 1:200 |
| Antibody | Donkey anti-rabbit secondary (Alexa Fluor 647 conjugated) | Abcam | Ab150075; RRID:AB_2752244 | 1:200 |
Additional files
-
Transparent reporting form
- https://doi.org/10.7554/eLife.45946.015
Download links
A two-part list of links to download the article, or parts of the article, in various formats.
Downloads (link to download the article as PDF)
Open citations (links to open the citations from this article in various online reference manager services)
Cite this article (links to download the citations from this article in formats compatible with various reference manager tools)
Ca2+ sensor synaptotagmin-1 mediates exocytosis in mammalian photoreceptors
eLife 8:e45946.
https://doi.org/10.7554/eLife.45946


