Stable Pom1 clusters form a glucose-modulated concentration gradient that regulates mitotic entry
- The Geisel School of Medicine at Dartmouth, United States
Figures
Figure 1 with 2 supplements
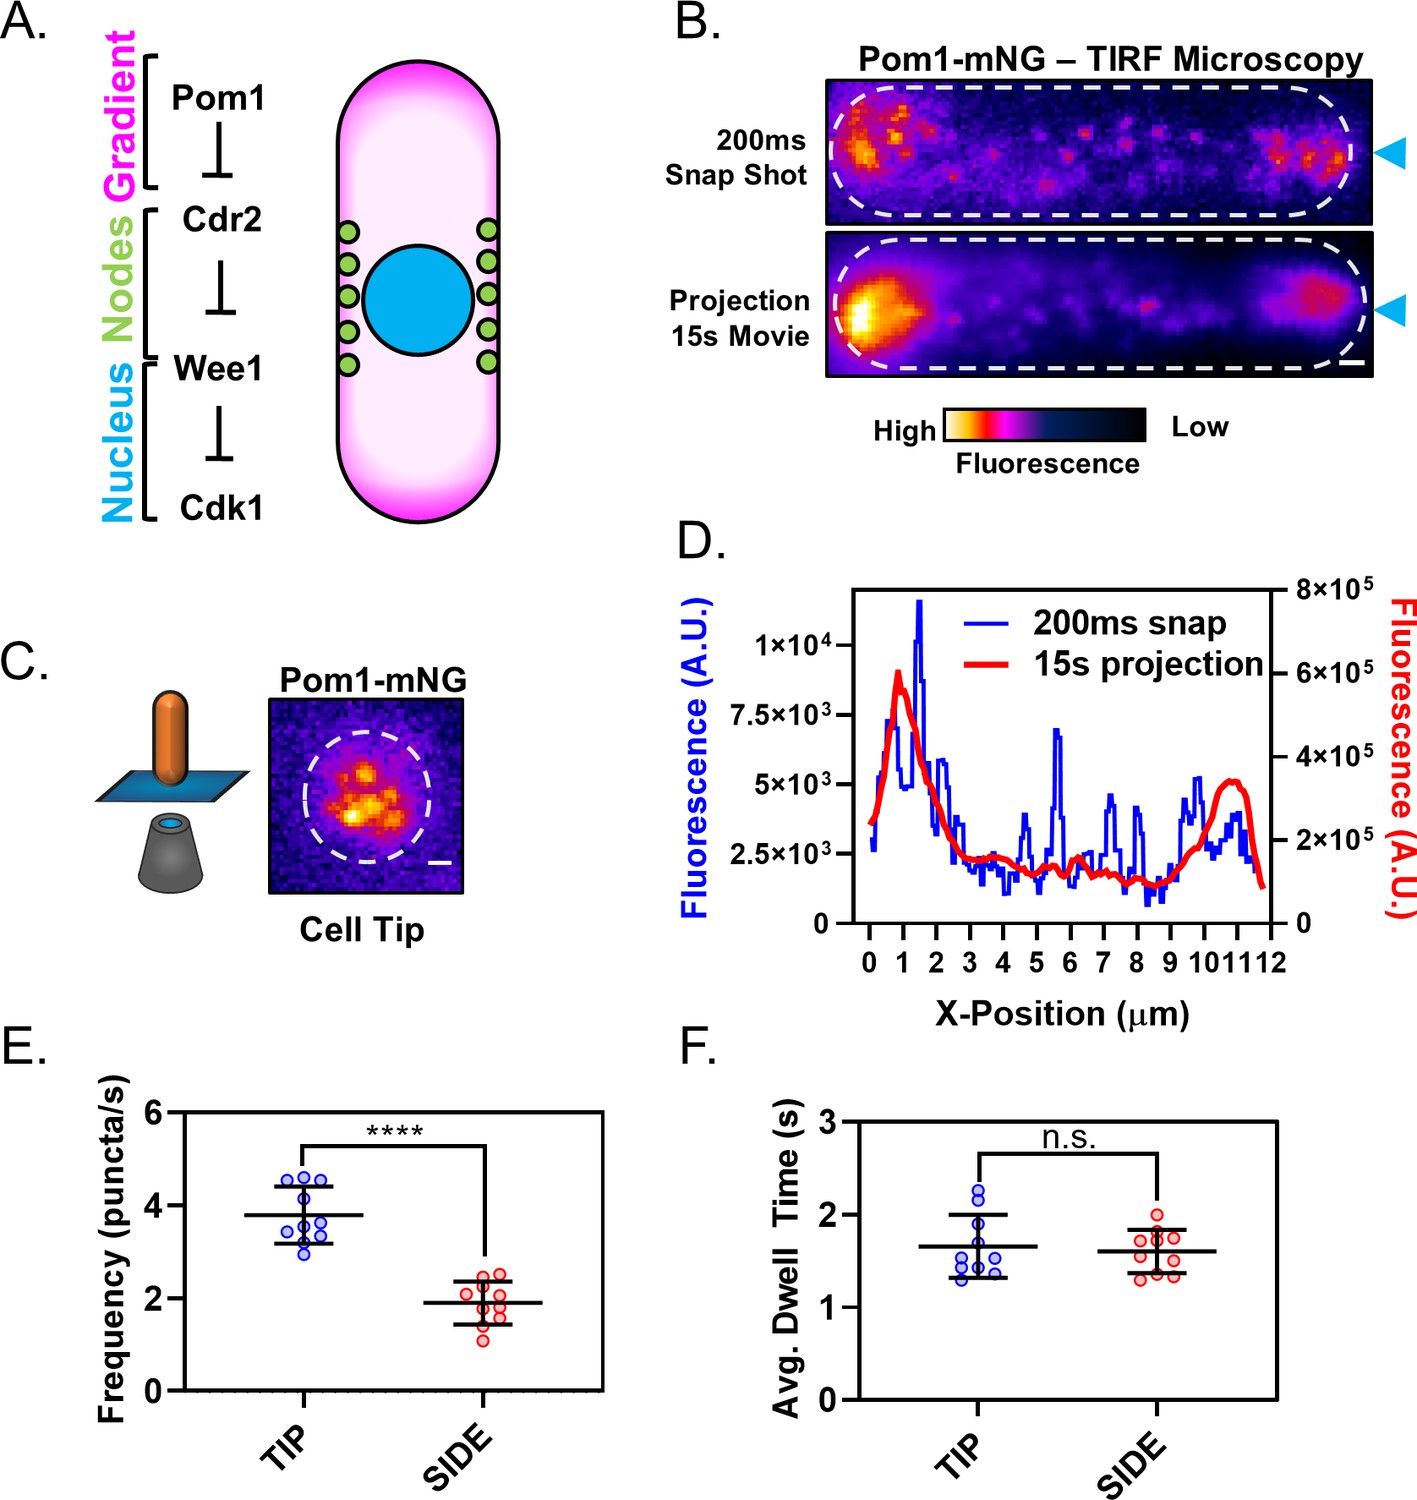
The Pom1 gradient is formed by time-averaging of clusters that transiently bind the cortex.
(A) Schematic of the Cdr2-Pom1-Wee1 signal transduction pathway and its coarse cellular localization. (B) Individual frame (top panel) and sum projection (bottom panel) of a high-speed TIRF microscopy movie. Movie was continuous 15 s time-lapse acquisition of 200 ms exposures. Scale bar 1 µm. Blue arrows mark position of line scans performed for data in panel (D). (C) Pom1-mNG also forms clusters at the cell tip. Image is a sum projection of three consecutive 200 ms exposures from continuous time-lapse TIRF movie of the cell tip as depicted in the cartoon diagram. Scale bar 1 µm. (D) Line scans of fluorescence intensity along the long axis of the snap shot (blue line, left Y axis) and projection images (red line, right Y axis) in panel (B). Note that time-averaging of Pom1 clusters smoothens the concentration gradient. (E) Comparison of Pom1 cluster binding frequency at the cell tip or side (****p=<0.0001, n = 10 cells, 42–170 traces/cell). (F) Comparison of cortical dwell time of individual Pom1-mNG clusters (n.s., p=0.6747, n = 10 cells, 42–170 traces/cell) at the cell tip or side. For (E–F), each data point represents a single cell mean, and line and error bars represent mean and standard deviation of all cells. Statistical significance was tested using a Student’s T-test.
Figure 1—figure supplement 1

Analysis of the Pom1 gradient by confocal microscopy.
(A) Pom1-mNG clusters are apparent at the lateral cell cortex of cells in individual frames (200 ms) of spinning-disc microscopy movies (top panel) but become averaged out in a projection of the entire movie (bottom panel). Sum projection is of a continuous 15 s time-lapse acquisition of 200 ms exposures at the top cell focal plane. Scale bar 1 µm. (B) Line scans of fluorescence intensity along the long axis of the cell in the snap shot (blue line, left Y axis) and projection image (red line, right Y axis) at positions marked by blue arrow heads in panel (A). Note that time-averaging of Pom1 clusters smoothens the concentration gradient. (C) Representative images of Airyscan super-resolution micrographs of Pom1-mNG at cell tip or side. Scale bar, 1 µm. (D) Fluorescence intensities of all single clusters resolved in Airyscan images as in panel (C). Data points represent individual cluster values, error bars are the mean and standard deviation (n = 87 tip, 158 side). (E) Histogram of the fluorescence intensity of individual Pom1 clusters at the cell tip and cell side. Clusters were binned by fluorescence intensity and displayed as a population frequency (n = 48 tip, 158 side).
Figure 1—figure supplement 2
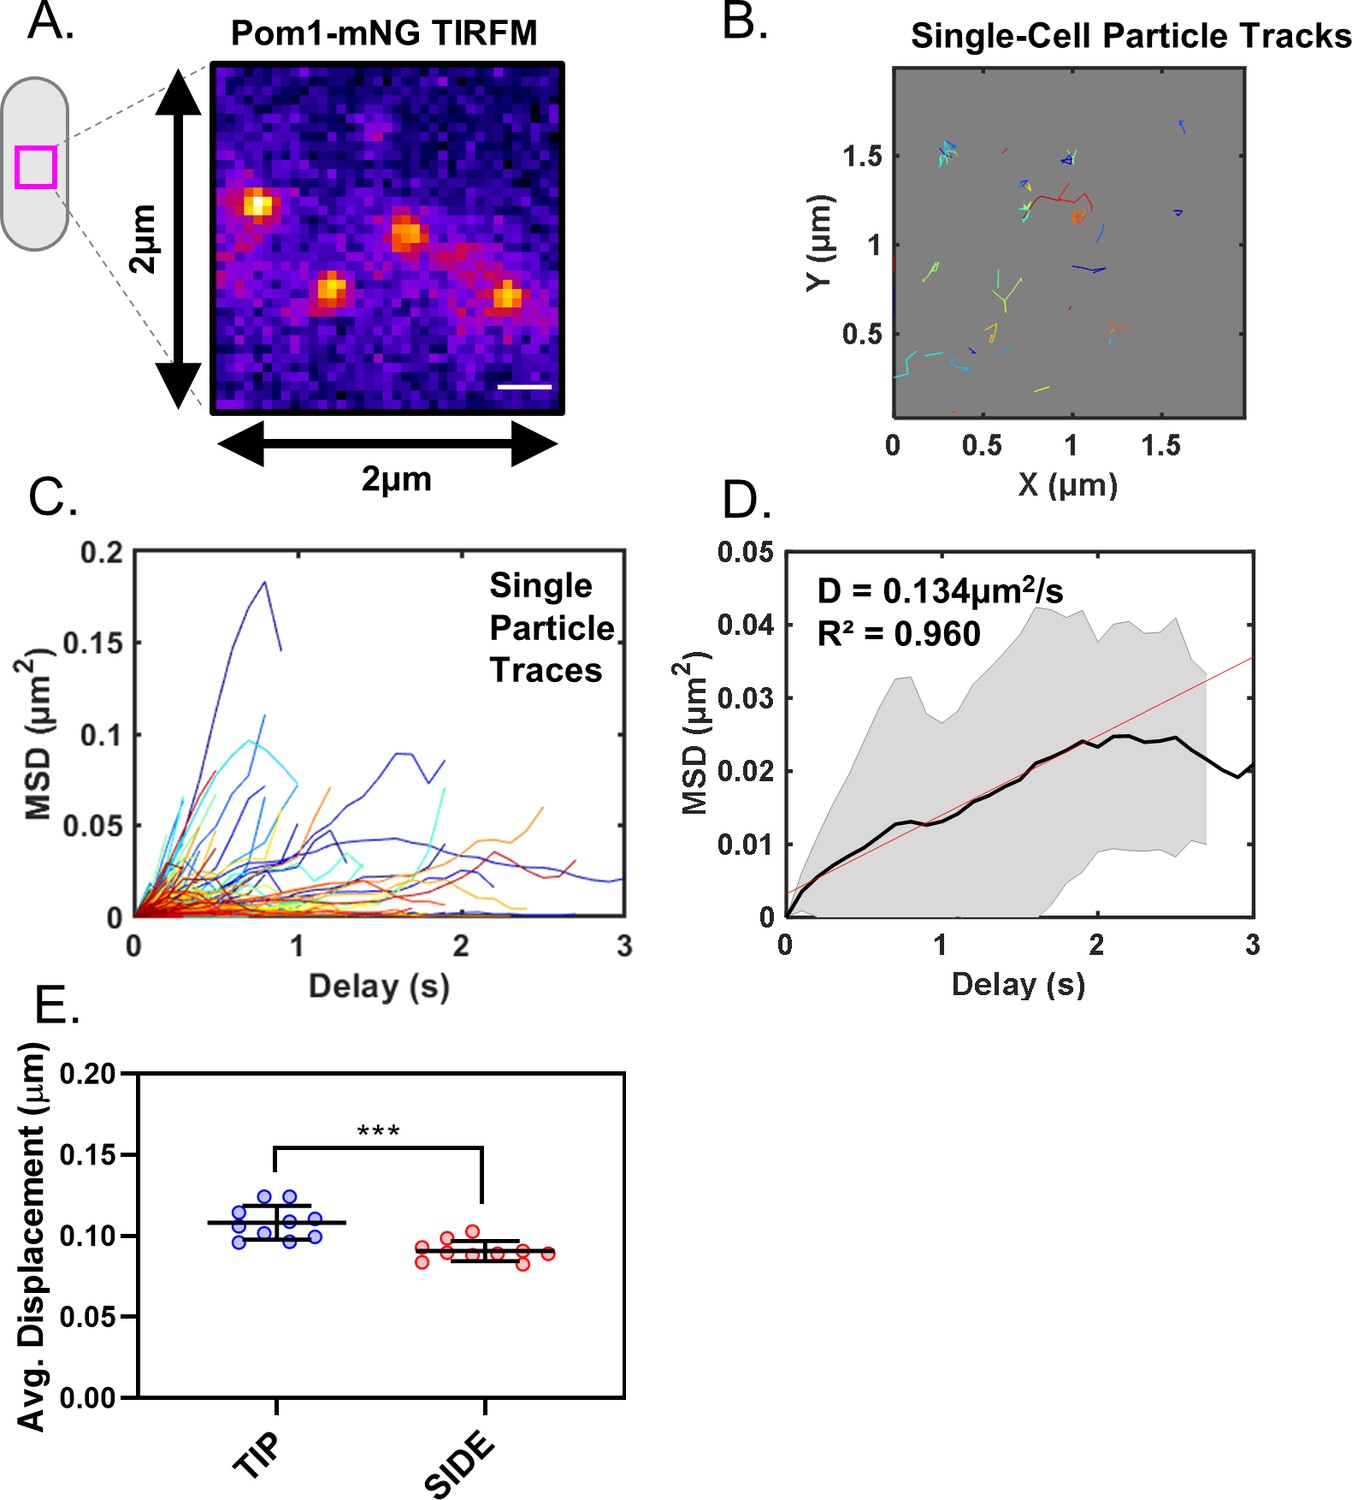
Analysis of Pom1 cluster diffusion.
(A) Pom1-mNG clusters positioned at the cell middle, in a 2 × 2 µm ROI as used for particle tracking. (B) Single-particle diffusion traces of Pom1-mNG clusters show limited lateral diffusion in cells. (C) Mean squared displacement (MSD) curves calculated from traces of individual Pom1-mNG cluster diffusion as in panel (B). (D) Mean MSD curves generated from averaging of 439 single-particle traces, coming from six different cells. Linear regression of the initial linear segment (red line) of the curve provides the diffusion coefficient D = 0.134 ± 0.017 µm2/s. Black line represents the weighted mean of all traces, and gray lines indicate standard deviation. (E) Average life-time displacement of individual clusters (***p=0.0002, n = 10 cells, 42–170 traces/cell). Line and error represent mean and standard deviation. Statistical significance was tested using a Student’s T-test.
Figure 2 with 3 supplements
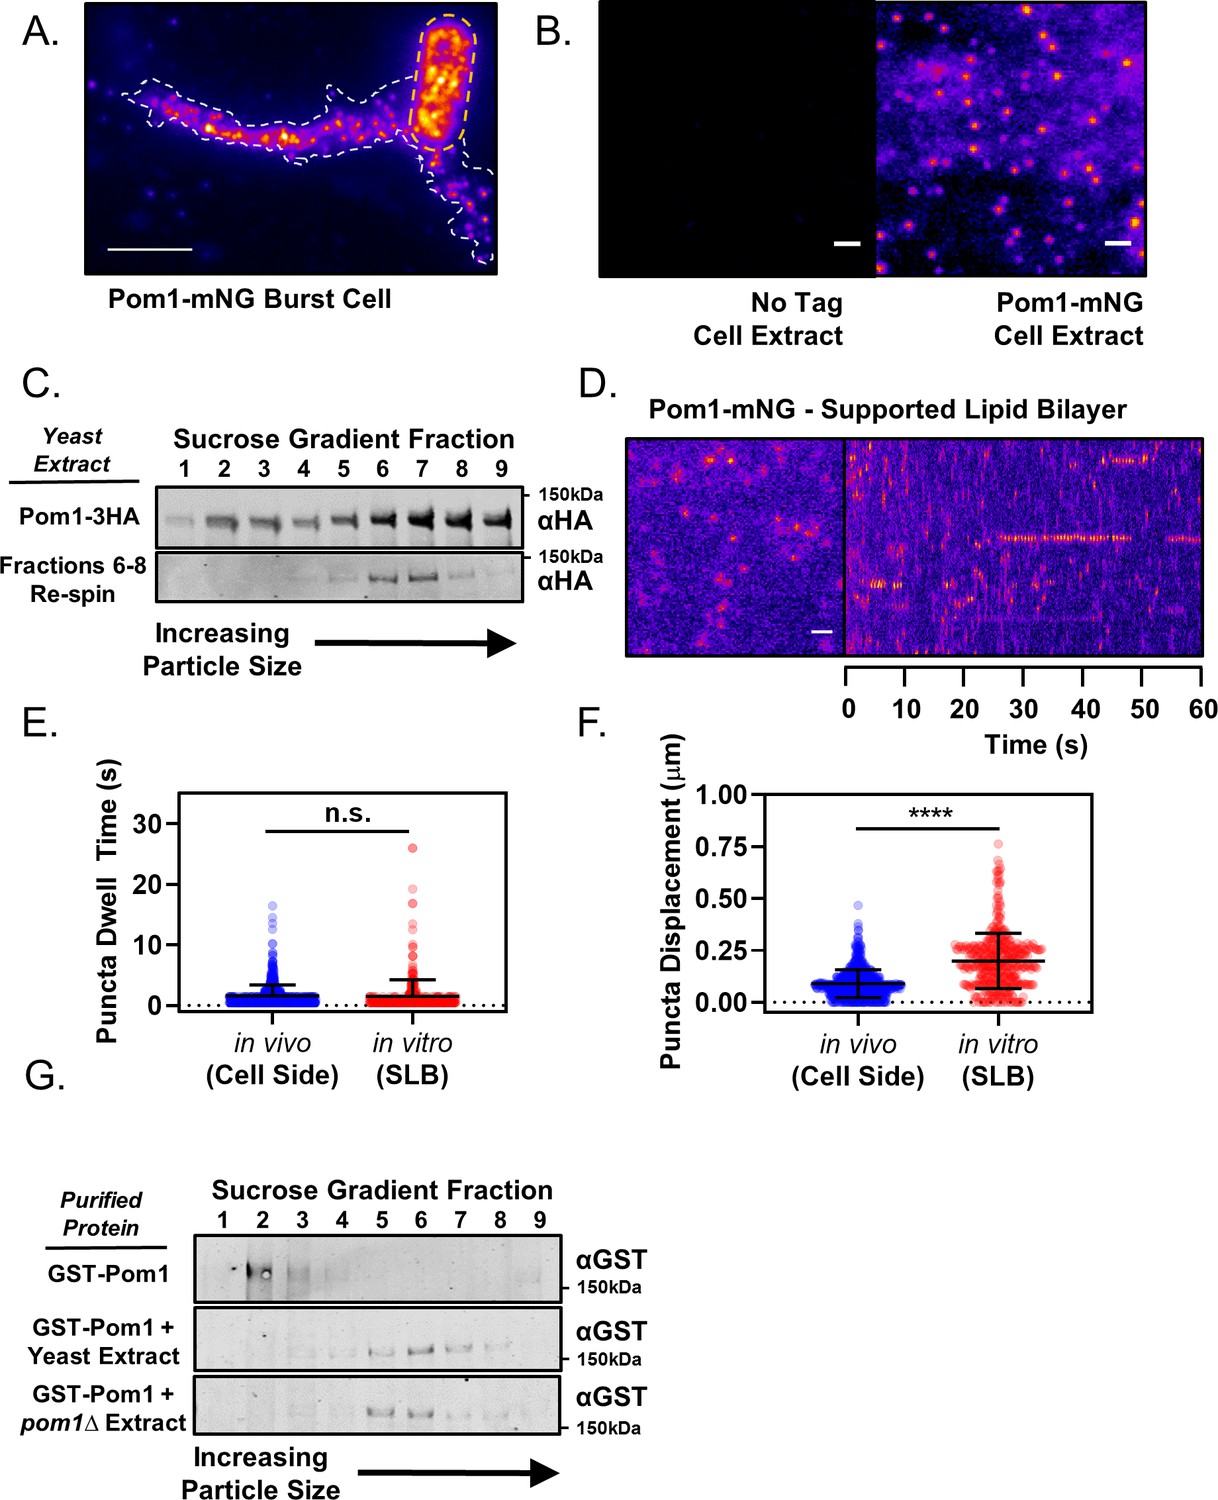
Pom1 clusters are stable structures that can be isolated in vitro.
(A) TIRF microscopy image of Pom1-mNG clusters in the extruded cytoplasm (white dotted line) of a lysed cell (yellow dotted line). Scale bar 5 µm. (B) TIRF microscopy images of cell extracts prepared from wild-type (no tag) or Pom1-mNG cells. Images are 50 frame sum projections of continuous 200 ms time-lapse exposures. The two images were contrasted equally. Scale bars 1 µm. (C) Cytoplasmic extracts of pom1-3HA cells were subjected to velocity sucrose gradient sedimentation, and fractions were probed against the HA tag (upper blot). Fraction one corresponds to the top of the gradient and contains smaller structures; fraction nine corresponds to bottom of the gradient and contains larger structures. Fractions 6–8 were pooled, sucrose was removed by dialysis, and then the sample was subjected to a second identical round of sucrose gradient sedimentation and western blotting of the resulting fractions (lower blot). (D) TIRF microscopy of Pom1-mNG clusters from cytoplasmic extracts on supported lipid bilayers. Scale bar 1 µm. Left panel is single time point image. Right panel is kymograph taken from a line scan of time-lapse TIRF experiment. (E) Quantification of binding duration of Pom1-mNG clusters on supported lipid bilayers imaged by TIRF microscopy as in panel (D). Values are compared to cellular measurements of Pom1 clusters on cell sides (n.s., p=0.05954, n = 713 in vivo, 421 in vitro). (F) Quantification of life-time displacement of Pom1-mNG clusters diffusing on supported lipid bilayers imaged by TIRF microscopy as in panel (D). Values are compared to cellular measurements of Pom1 clusters on cell sides (****p<0.0001, n = 713 in vivo, 421 in vitro). For (E) and (F), statistical significance was tested using a Student’s T-test. (G) Purified GST-Pom1 was subjected to sucrose gradient sedimentation and the fractions were probed against the GST tag (upper blot). Purified GST-Pom1 was also added to wild-type or pom1∆ cell extracts and incubated for 1 hr at 4 ˚C in the presence of ATP before velocity sucrose sedimentation and western blotting (bottom blots).
Figure 2—figure supplement 1
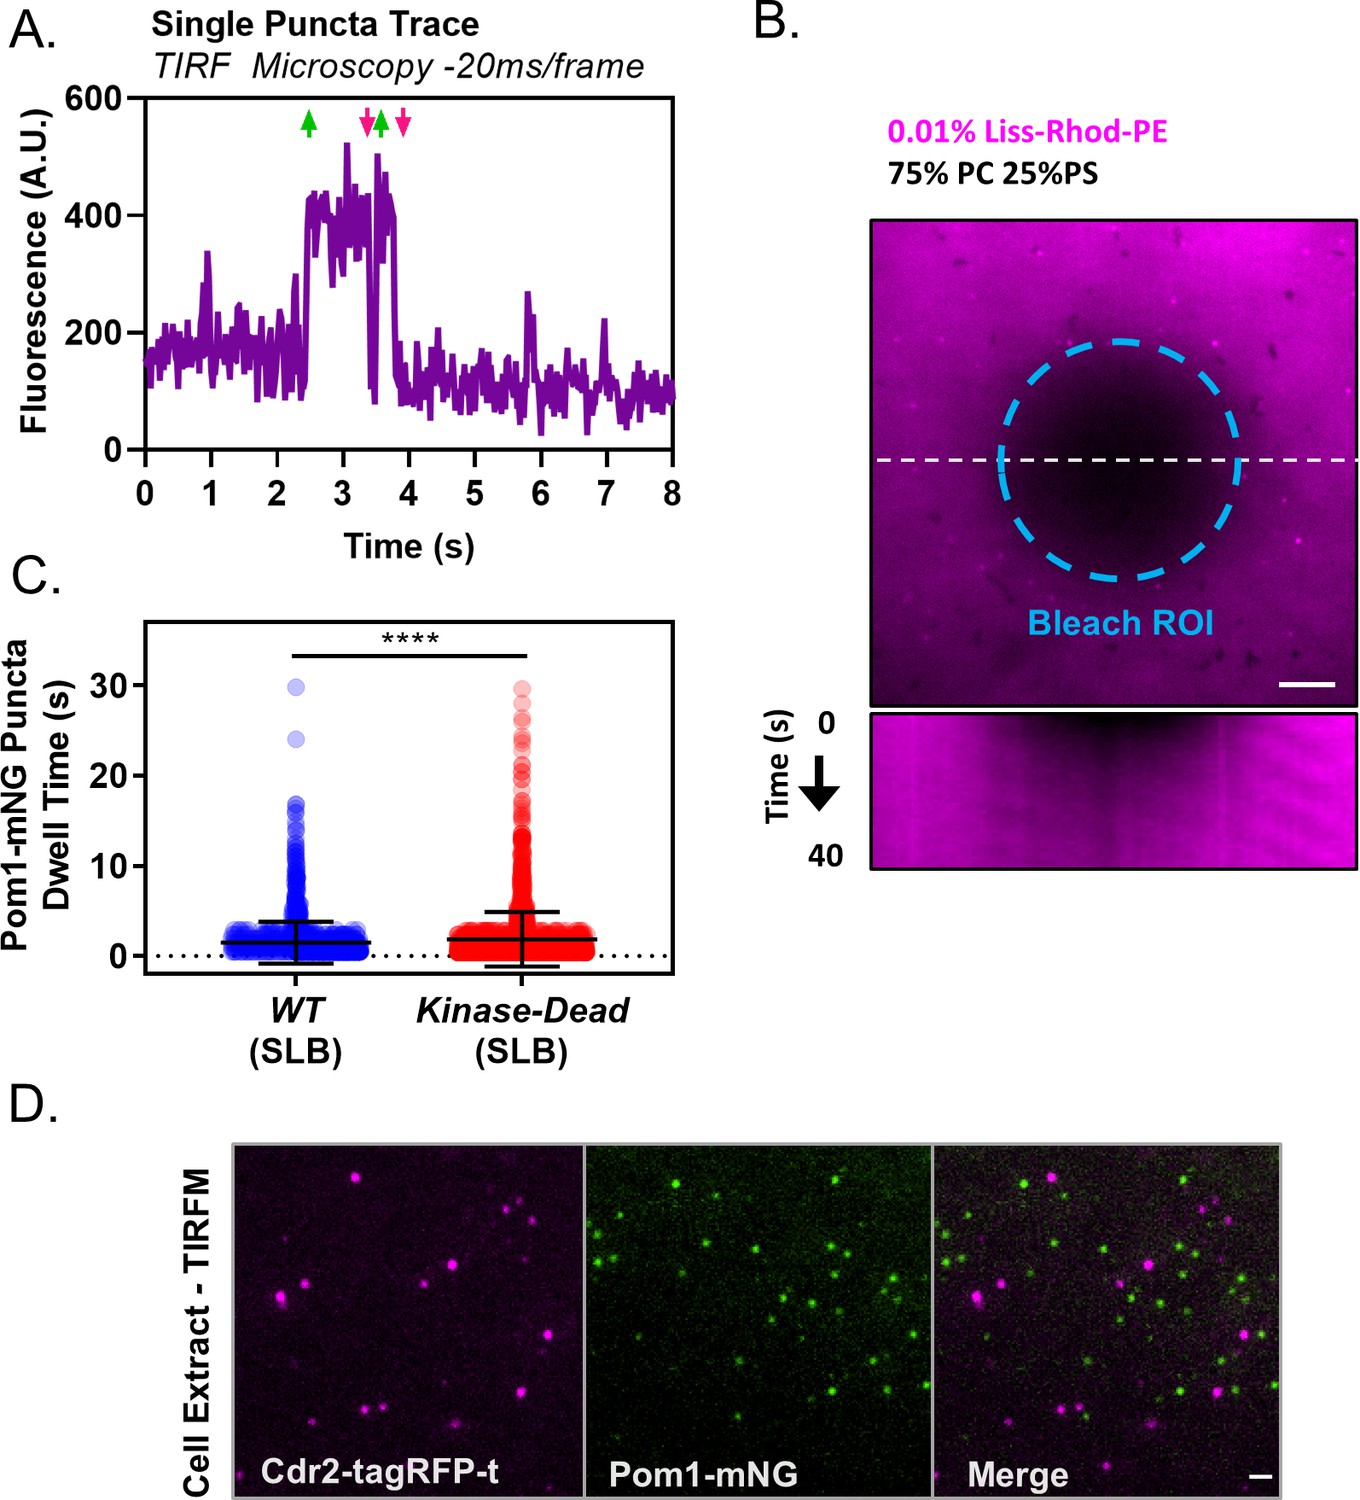
Controls and supporting in vitro analysis of Pom1 clusters.
(A) Fluorescence intensity trace of a single Pom1-mNG cluster binding to the cell cortex, measured by high speed TIRF microscopy (~50 frames per second with continuous acquisition). Rapid intensity changes indicating binding and unbinding are marked by green upward and magenta downward pointing arrows respectively. (B) FRAP analysis of supported lipid bilayers. Upper panel: A circular ROI (teal dashed line) was used to bleach fluorescent PE in the bilayers. Lower panel: Kymograph at white dashed line in upper panel of fluorescence recovery as monitored by TIRF microscopy, indicating fluidity. (C) Quantification and comparison of binding duration of either wild-type or kinase-dead Pom1-mNG clusters to supported lipid bilayers in TIRF microscopy movies (***p=<0.0001, n = 1526 wild-type, 1993 kinase-dead). Statistical significance was tested with a Student’s T-test. (D) TIRF microscopy images of cell extracts prepared from cells co-expressing Pom1-mNG and Cdr2-tagRFP-t. Pom1 clusters are shown in green and Cdr2 nodes are shown in magenta. Images are three frame sum projections of continuous 200 ms time-lapse exposures. Scale bar 1 µm.
Figure 2—figure supplement 2
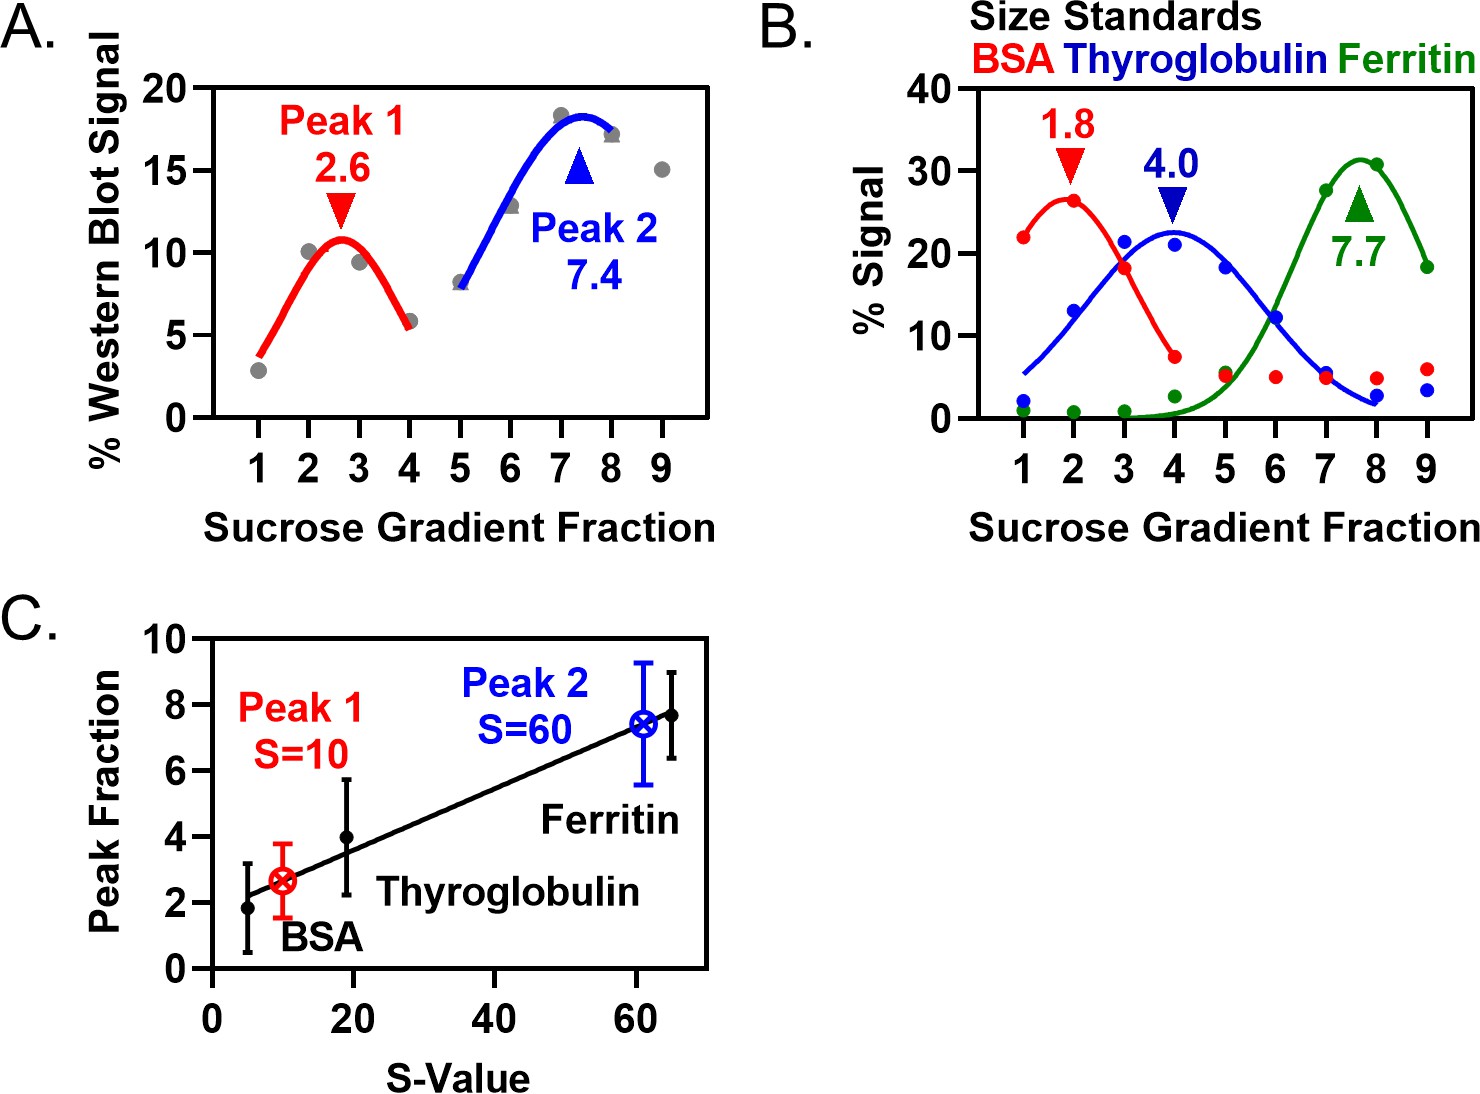
Quantification of Pom1 sedimentation in velocity sucrose gradients and size standards.
(A) Quantification of Pom1-3HA band intensities from western blot of yeast extracts in main (Figure 2C). (B) Size standards for velocity sucrose gradients, as in main (Figure 2C,G). Data are quantified from single Coomassie-stained gels or using spectrophotometry data. (C) Plot of S-value versus sedimentation peak. Line is the linear regression of the three size standards, with the S-value for Pom1 peaks interpolated.
Figure 2—figure supplement 3
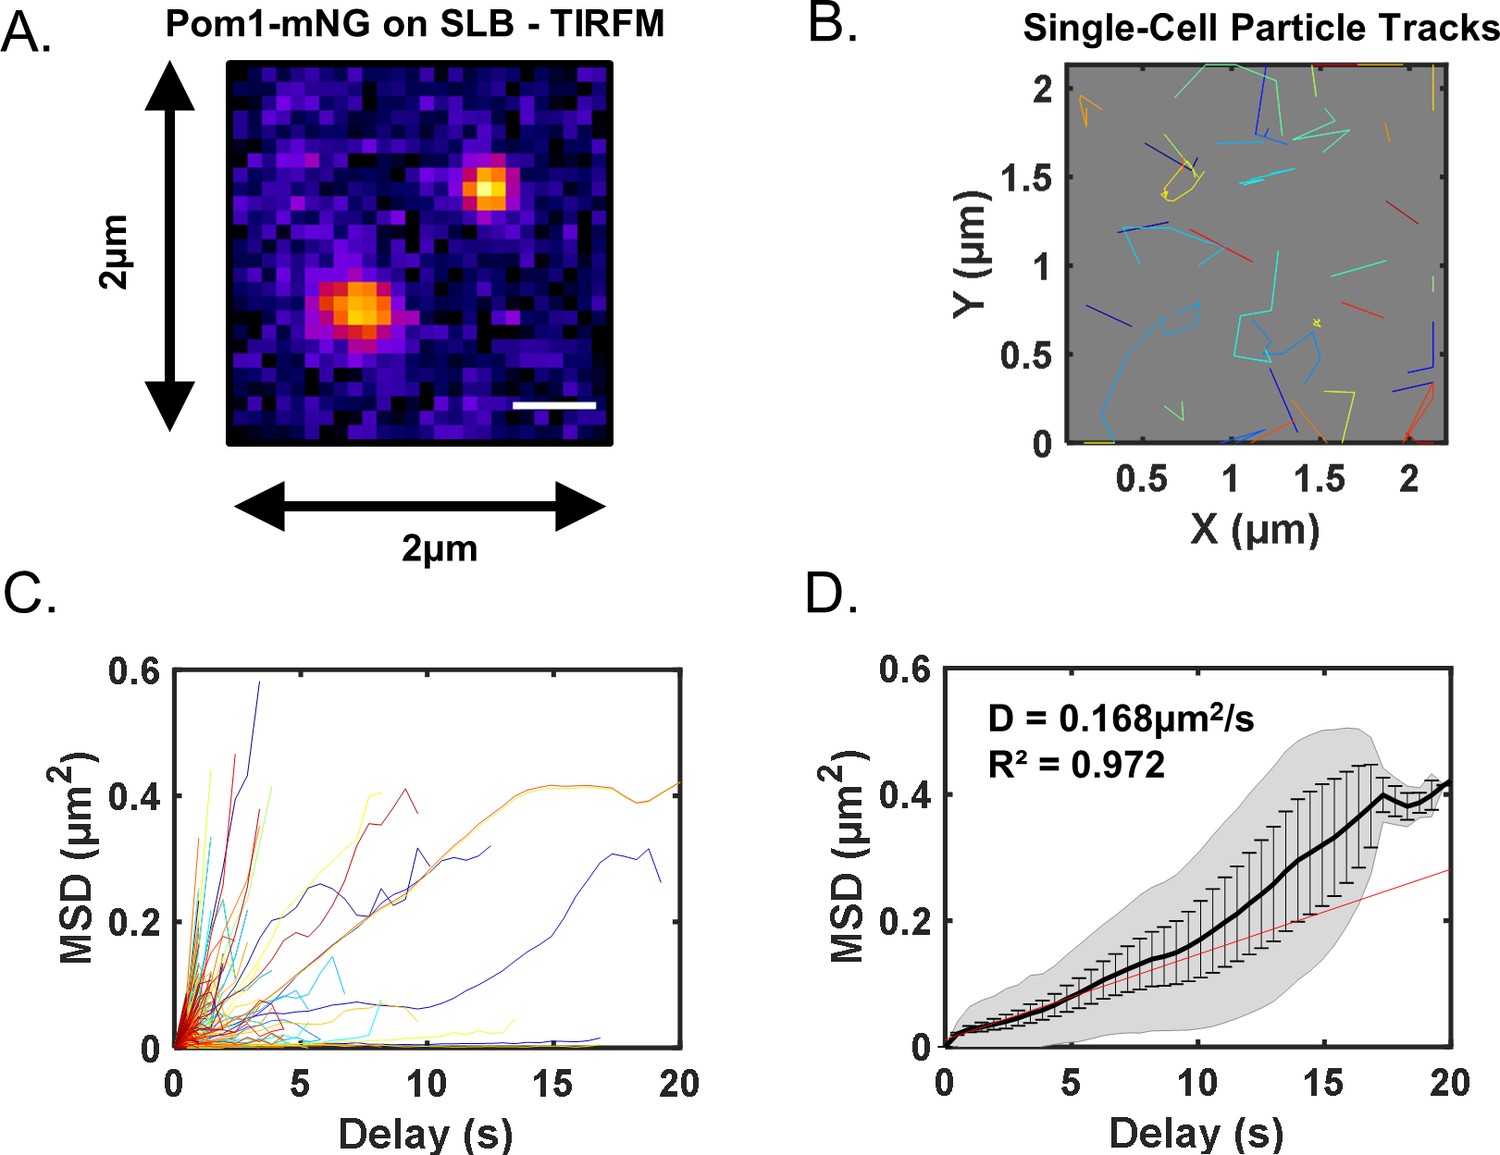
Analysis of Pom1 cluster diffusion on supported lipid bilayers.
(A) Pom1-mNG clusters diffusing on supported lipid bilayers imaged by high-speed (100 ms acquisition) TIRF microscopy. (B) Single-particle diffusion traces of Pom1-mNG clusters on supported lipid bilayers. (C) Mean squared displacement (MSD) curves calculated from traces of individual Pom1-mNG cluster diffusion as in panel (B). (D) Mean MSD curves generated from averaging of 421 single-particle traces. Weighted linear regression of the curve (red line) provides the diffusion coefficient D = 0.168 ± 0.018 µm2/s. Note that the weighted regression best fits the initial region of the curve because few clusters bind longer than 10 s. Black line represents weighted mean of all traces, gray lines indicate standard deviation, and error bars represent weighted standard deviation.
Figure 3 with 1 supplement
Polarity landmarks pattern cortical dynamics of Pom1 clusters to shape the gradient.
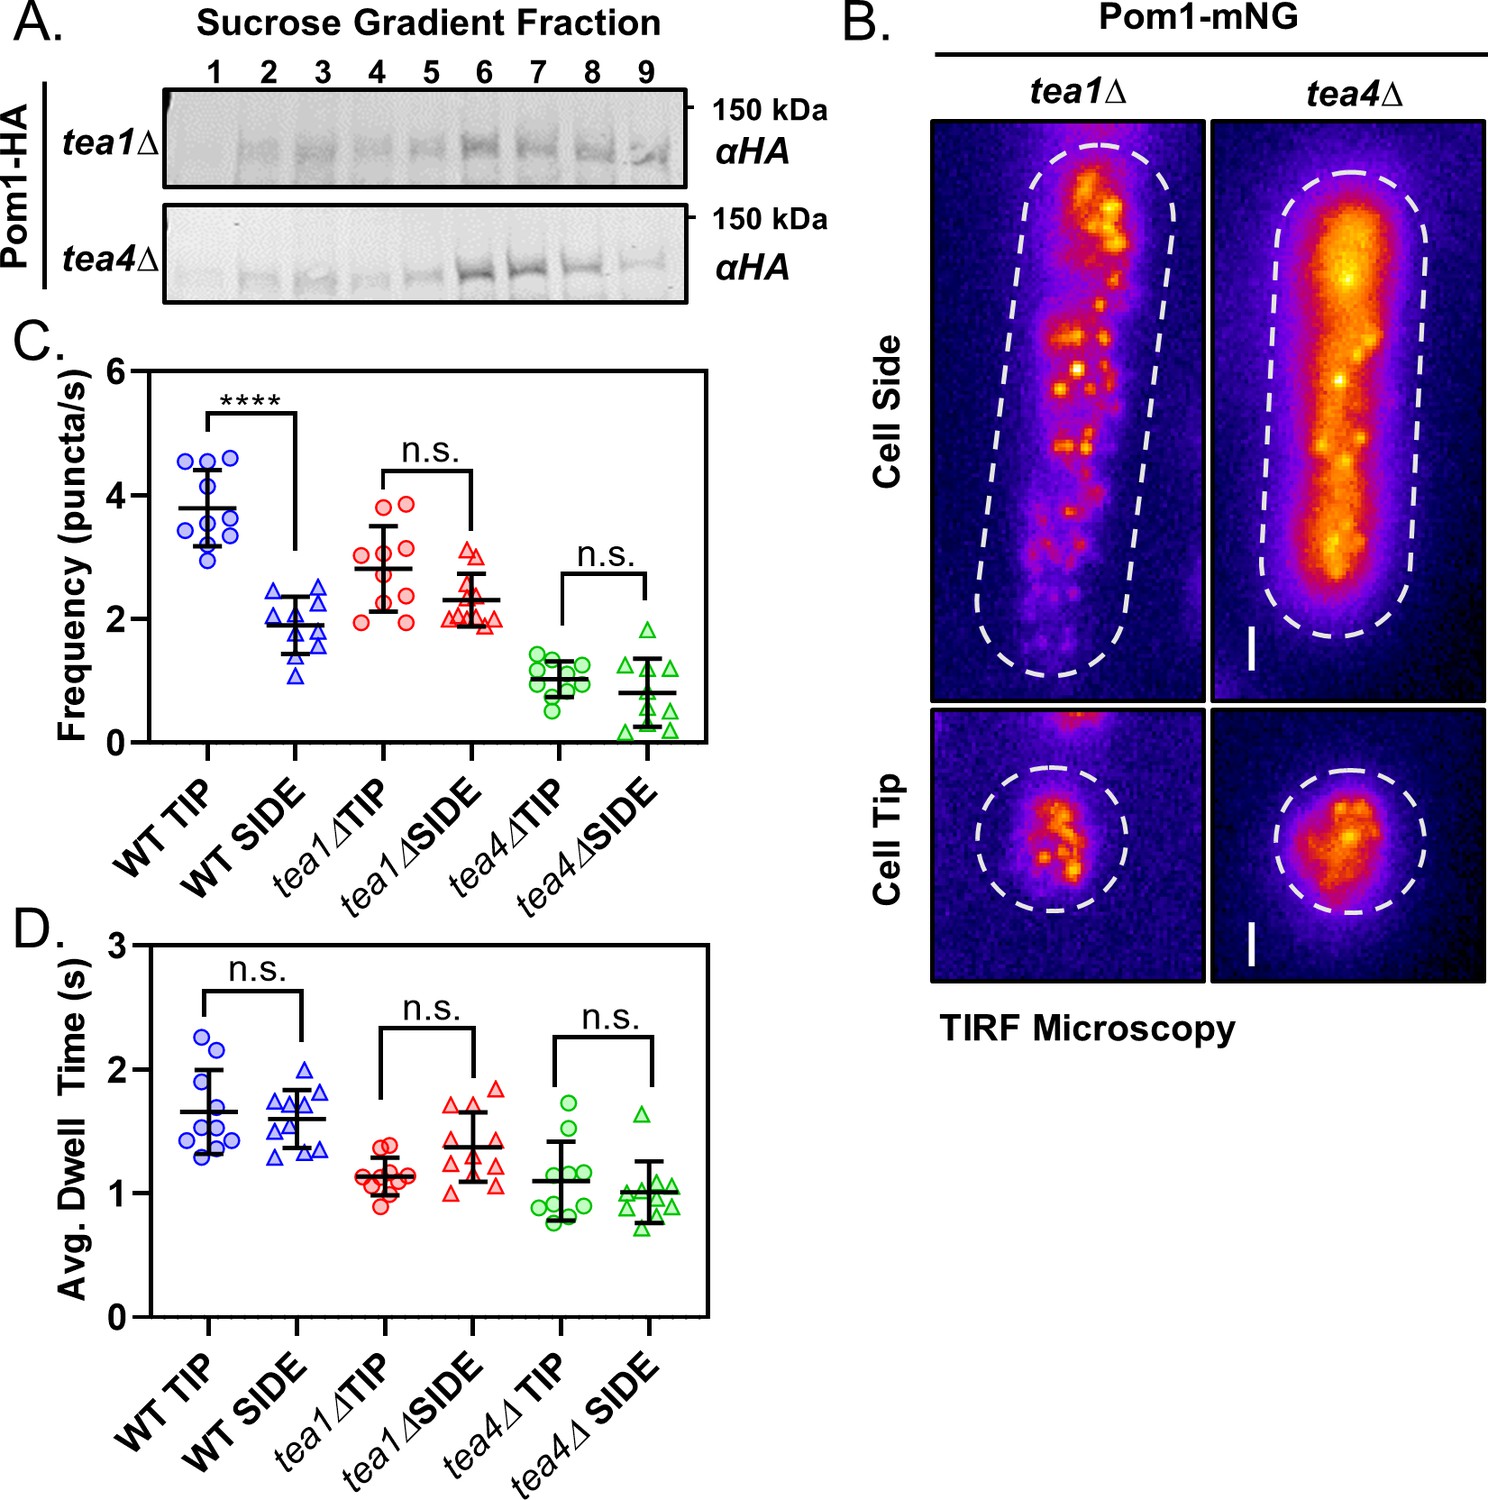
(A) Western blots of sucrose gradient fractions after sedimentation analysis as in Figure 2C of extracts prepared from tea1∆ or tea4∆ cells expressing Pom1-3HA. (B) TIRF micrographs of Pom1-mNG localization at the tip or side cortex in tea1∆ or tea4∆ cells. Scale bar 1 µm. (C) The mean binding frequency of Pom1-mNG clusters at the tips and sides of wild-type, tea1∆ or tea4∆ cells (n = 10 cells, 7–170 traces/cell). (D) The mean dwell time of Pom1-mNG clusters at the tips and sides of wild-type, tea1∆ or tea4∆ cells. For panels C-D, wild-type data are replotted from main (Figure 1). Each data point represents a single cell mean, and line and error bars represent mean and standard deviation of all cells (n = 10 cells, 7–170 traces/cell). Comparisons are 1-way ANOVA with Tukey’s multiple comparisons tests. (****) indicates p<0.0001, (n.s.) indicates p>0.05. See Figure 3—figure supplement 1D for all results of statistical analysis.
Figure 3—figure supplement 1
Supporting analysis of Pom1 clusters in polarity mutants.
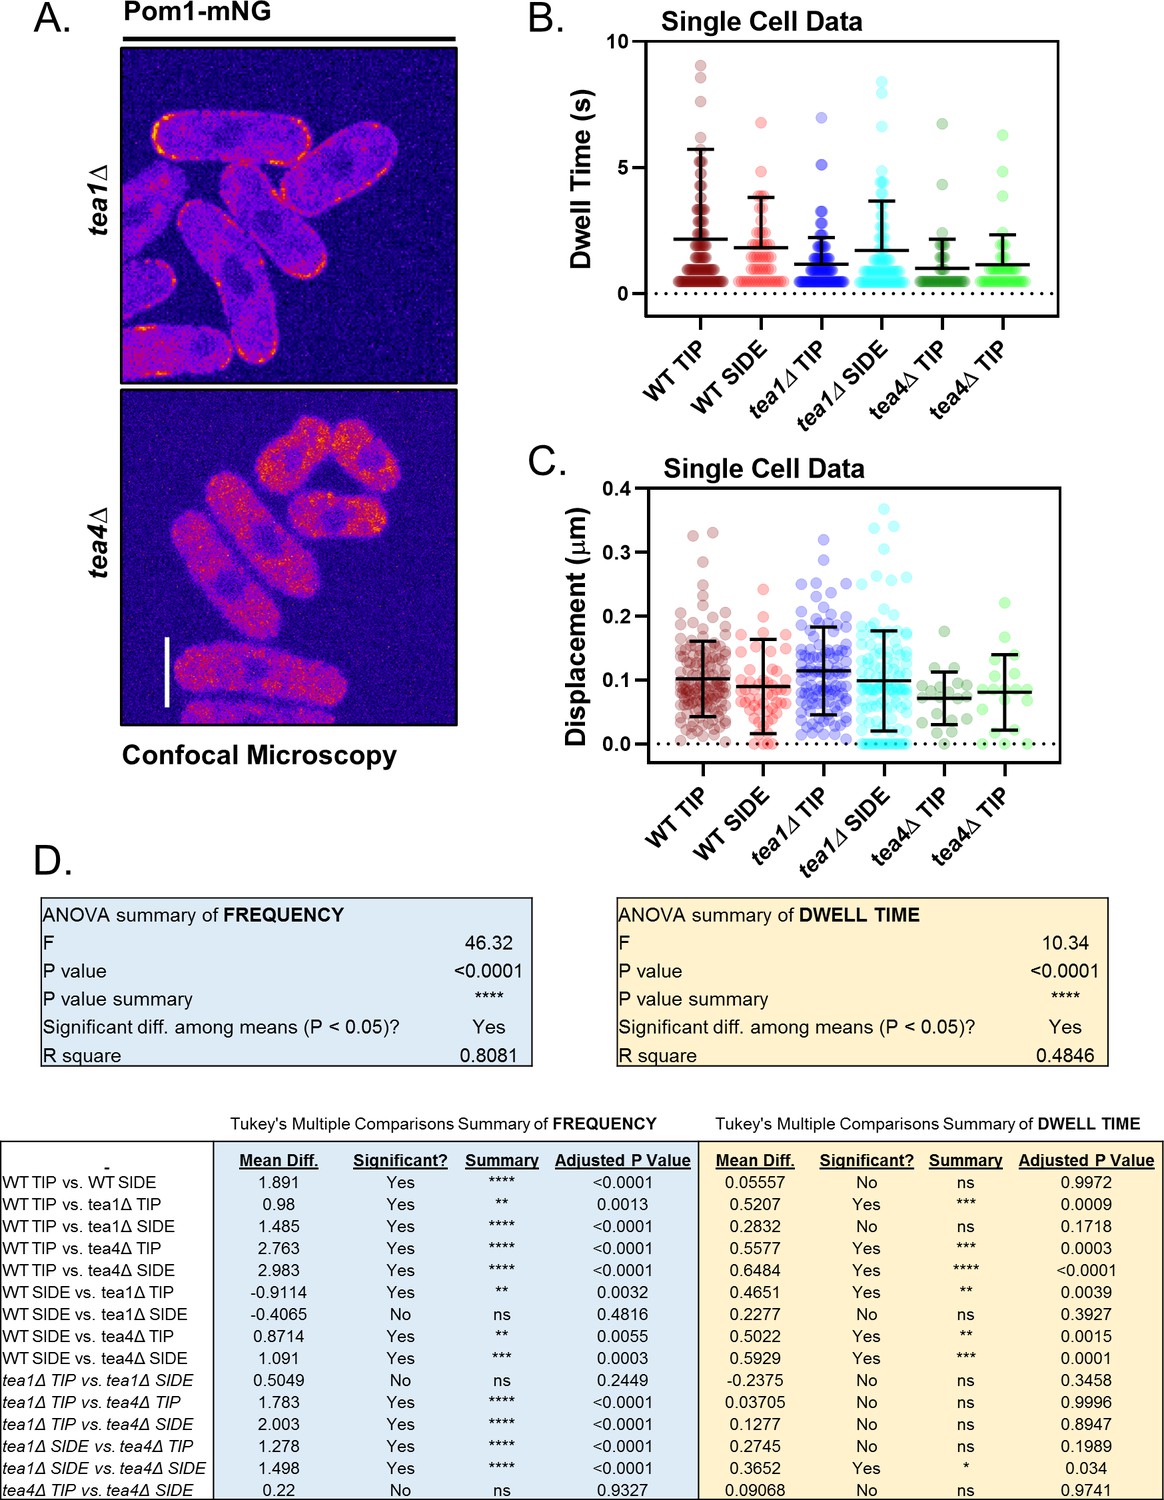
(A) Confocal micrographs of Pom1-mNG in tea1∆ or tea4∆ cells. Images are from the middle focal plane; scale bar 5 µm. (B) Quantification of cortical binding dwell time of individual Pom1-mNG clusters at the tips or sides of representative wild-type, tea1∆ or tea4∆ cells (n = 44–129 traces). (C) Quantification of total lifetime displacement of individual Pom1-mNG clusters at the tips or sides of representative wild-type, tea1∆ or tea4∆ cells. For B-C, line and error represent single cell mean and standard deviation (n = 44–129 traces). (D) Results of ANOVA and Tukey’s multiple comparison tests performed in main (Figure 3C,D).
Figure 4 with 3 supplements
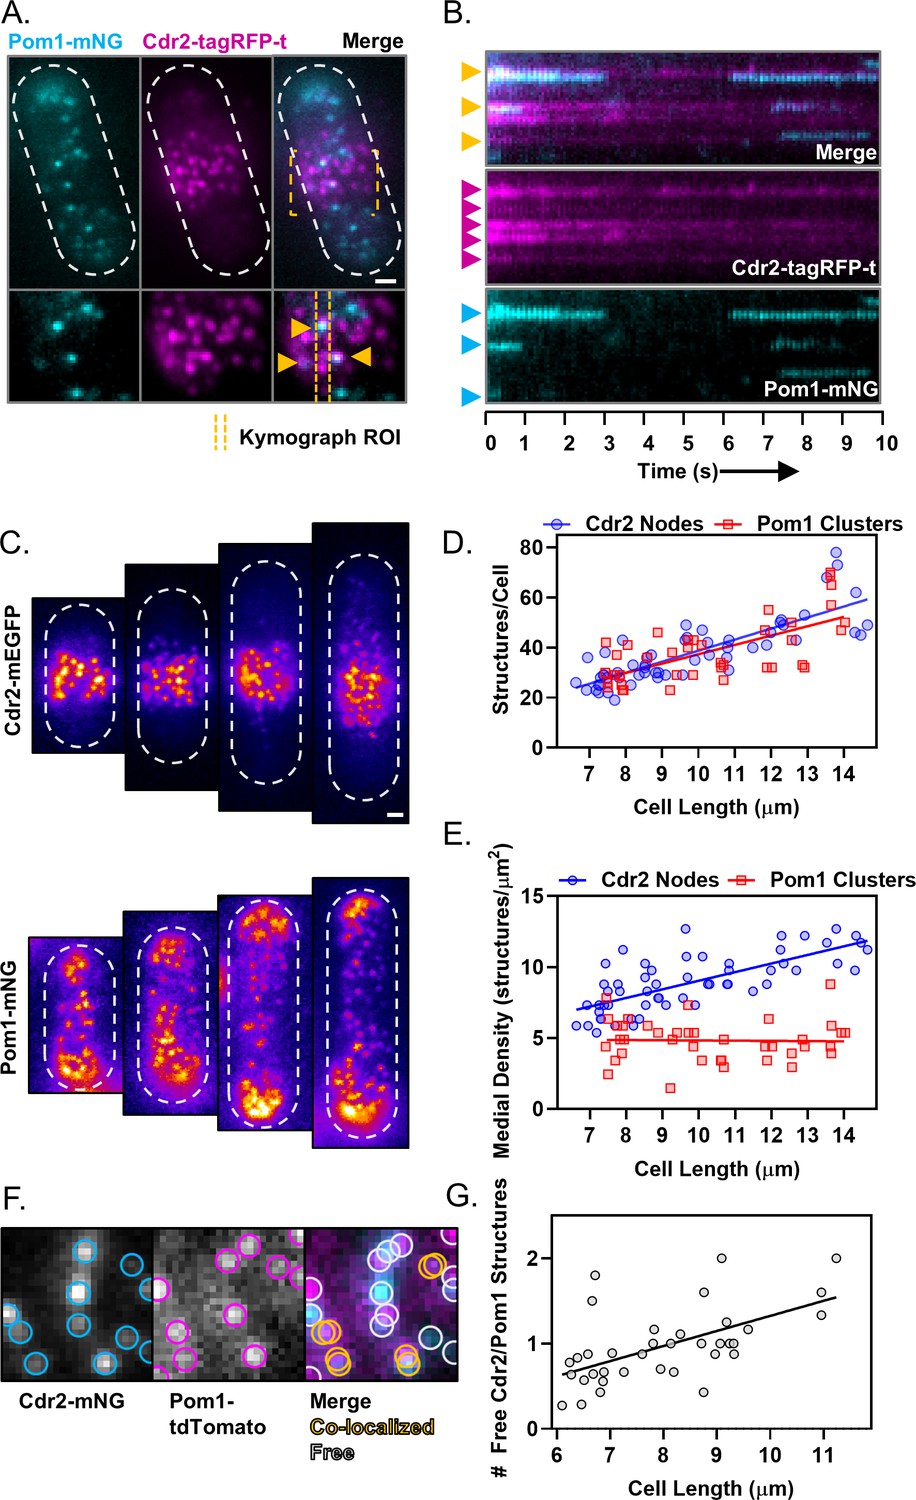
Size-scaling of Pom1 clusters and Cdr2 nodes at the lateral cell cortex.
(A) A subset of Pom1 clusters colocalize with Cdr2 nodes. Panels are TIRF microscopy images of cells expressing Pom1-mNG and Cdr2-tagRFP-t. Yellow dashed brackets outline the ROI of the lower zoomed panels. Orange arrows point to Pom1 clusters colocalized with Cdr2 nodes. Scale bar is 1 µm. (B) Kymographs generated using the ROI indicated in panel A. Cyan arrows indicate prominent Pom1 clusters, magenta arrows indicate prominent Cdr2 nodes, and orange arrows indicate colocalization. (C) Localization of Cdr2-mEGFP (upper panels) or Pom1-mNG (lower panels) in representative cells of increasing size, imaged by TIRF microscopy. Scale bar is 1 µm. (D) Total number of Cdr2-mEGFP nodes (blue circles) or Pom1-mNG clusters (red squares) measured per cell. Quantification is limited to clusters detected and resolvable in the TIRF illumination field. The slopes of the corresponding linear regressions are not significantly different (p=0.3757, n > 40 cells). (E) Density of Cdr2-mEGFP nodes (blue circles) or Pom1-mNG clusters (red squares) in 2 × 2 µm square ROIs at the cell middle, counted using TIRF microscopy. The slopes of the corresponding linear regressions are significantly different (p<0.0001, n > 40 cells). (F) Example of colocalization analysis for Pom1 clusters (magenta ROI) and Cdr2 nodes (cyan ROI) (left panels). Colocalized structures are marked with overlapping yellow ROIs, whereas non-colocalizing structures are marked with gray ROIs (right panel, gray circles). (G) Ratio of free Cdr2 nodes to free Pom1 clusters, plotted as a function of cell size. The slope of the linear regression is positive and significantly non-zero (p=0.0002, R2 = 0.33, n = 36 cells).
Figure 4—figure supplement 1
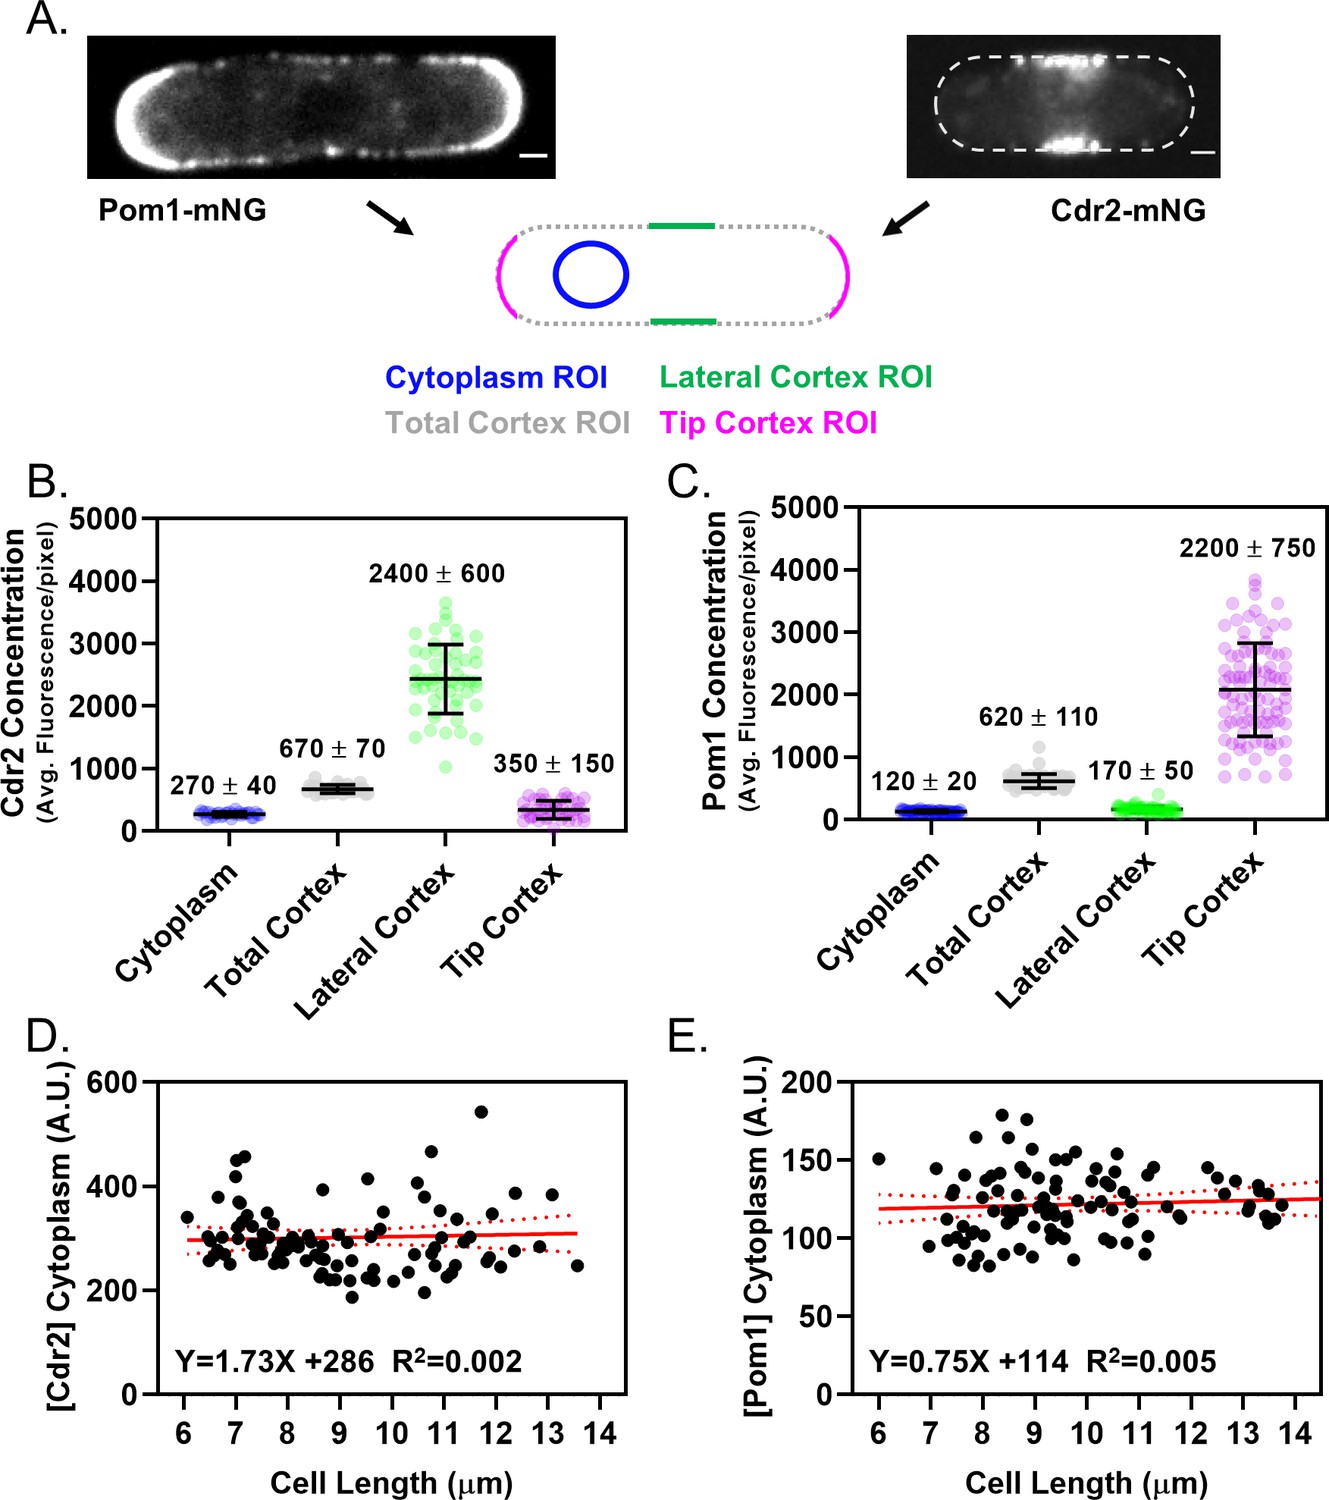
Quantification of Pom1 and Cdr2 concentration in different cellular regions.
(A) Schematic showing the ROI locations used to measure the concentration of Pom1-mNG or Cdr2-mNG in the cytoplasm, cortex, tip cortex, or side cortex. Images are spinning disc confocal micrographs of middle cell focal planes. Scale bars 1 µm. (B) Quantification of Cdr2 concentration (average fluorescence per pixel) at different cellular ROIs as in panel (A). Each dot represents a measurement from a different cell, numbers and the line and error represent the mean and standard deviation. (C) Quantification of Pom1 concentration (average fluorescence per pixel) at different cellular ROIs as in panel A. Each dot represents a measurement from a different cell, numbers and the line and error represent the mean and standard deviation. (D) Quantification of the cytoplasmic concentration (average fluorescence per pixel) of Cdr2-mNG as a function of cell length, using a cytoplasmic ROI as in panel (A). The slope of the linear regression does not significantly deviate from zero (b1≠0, (n.s.) p=0.6449). Each point indicates a measurement from a single cell. (E) Quantification of the cytoplasmic concentration (average fluorescence) of Pom1-mNG as a function of cell length, using a cytoplasmic ROI as in panel (A). The slope of the linear regression does not significantly deviate from zero (b1≠0, (n.s.) p=0.4926). Each point indicates a measurement from a single cell.
Figure 4—figure supplement 2
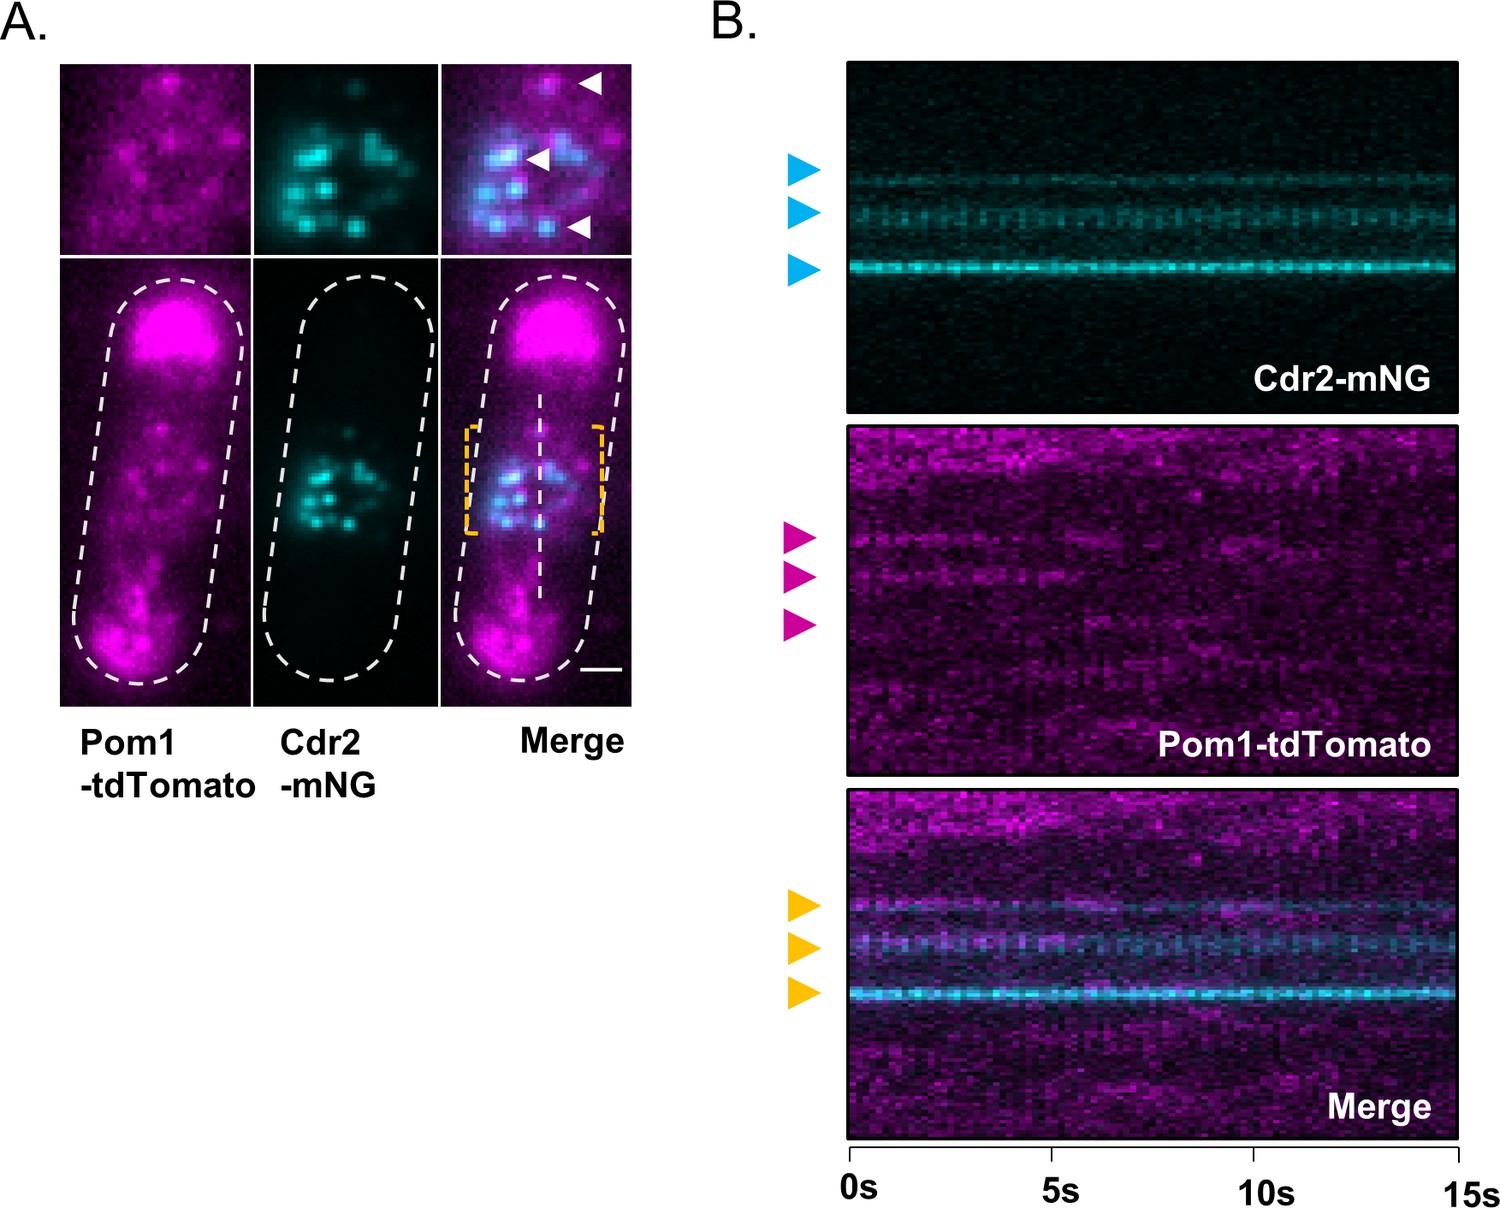
Colocalization of Cdr2 nodes and Pom1 clusters using alternative fluorophore pair.
(A) A subset of Pom1 clusters colocalize with Cdr2 nodes. Images are dual-channel simultaneously-acquired TIRF microscopy images of cells expressing Pom1-tdTomato and Cdr2-mNeonGreen. Yellow dashed brackets outline the ROI of the lower zoomed panels. White arrows point to Pom1 clusters colocalized with Cdr2 nodes. Scale bar is 1 µm. (B) Kymographs generated using the ROI drawn on the merged image in panel A. Cyan arrows indicate prominent Cdr2 nodes, magenta arrows indicate prominent Pom1 clusters, and orange arrows adjacent to the merged kymograph indicate colocalization.
Figure 4—figure supplement 3
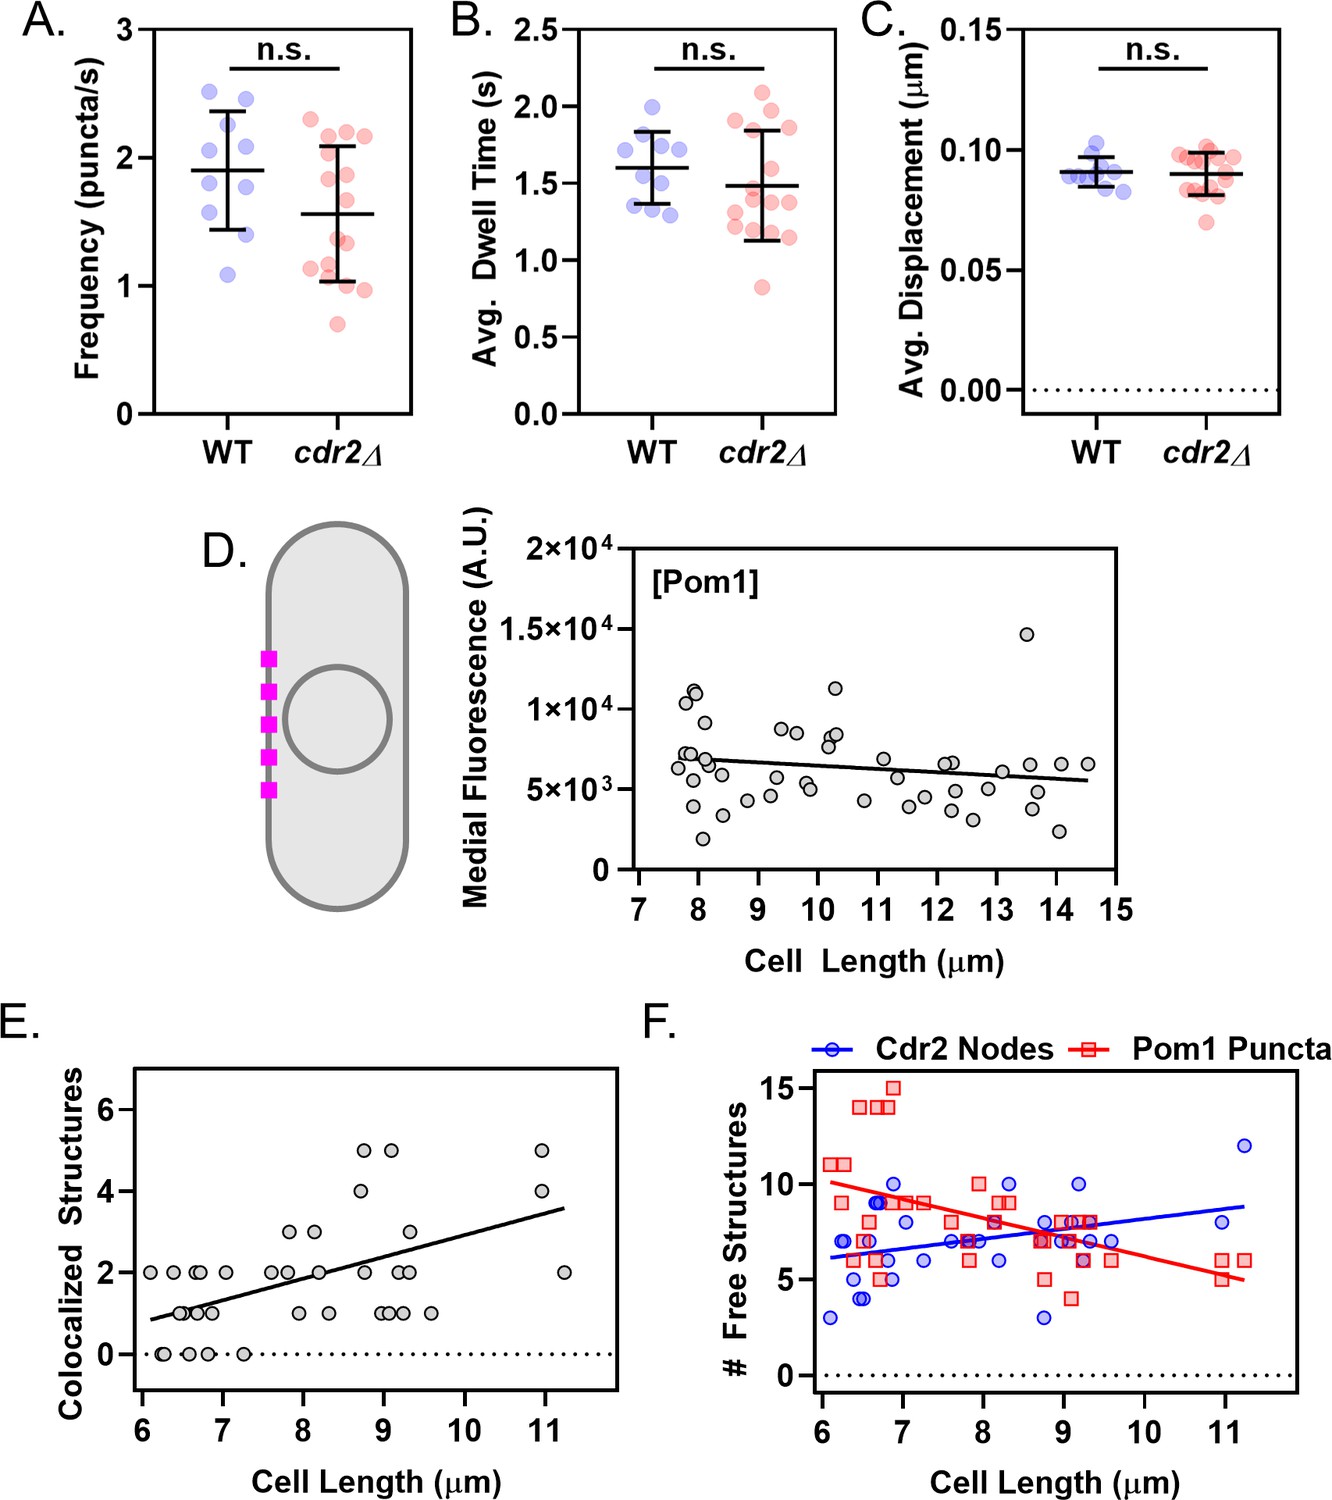
Supporting analysis of Cdr2 nodes and Pom1 clusters at the medial cell cortex.
(A) Comparison of Pom1 cluster binding frequency on the cell sides of wild-type and cdr2∆ cells (n.s., p=0.1076, n > 10 cells, 25–42 traces/cell). (B) Comparison of Pom1 cluster binding duration on the cell sides of wild-type and cdr2∆ cells (n.s., p=0.371, n > 10 cells, 25–42 traces/cell). (C) Comparison of Pom1 cluster displacement on the cell sides of wild-type and cdr2∆ cells (n.s., p=0.8191, n > 10 cells, 25–42 traces/cell). In A-C, significance was tested using a Student’s T-test. (D) Schematic and quantification of Pom1 concentration at the lateral cell cortex measured by confocal microscopy, using 2 µm line scans at the cell middle from images such as Figure 4—figure supplement 1A. The slope of the linear regression is negative, but not significantly non-zero (p=0.2603, R2 = 0.03, n = 45 cells). (E) Plot of the number of colocalized structures as a function of cell size. The slope of the linear regression is significantly non-zero (p=0.0006, R2 = 0.3, n = 36 cells). (F) Plot of free, non-colocalized Cdr2 nodes (blue circles) and free Pom1 clusters (red squares). The slope of the linear regression of #Pom1 clusters versus cell length is negative, and significantly non-zero (p=0.001, R2 = 0.27, n = 36 cells). The slope of the linear regression of #Cdr2 nodes versus cell length is positive, and significantly non-zero (p=0.021, R2 = 0.15, n = 36 cells).
Figure 5 with 1 supplement
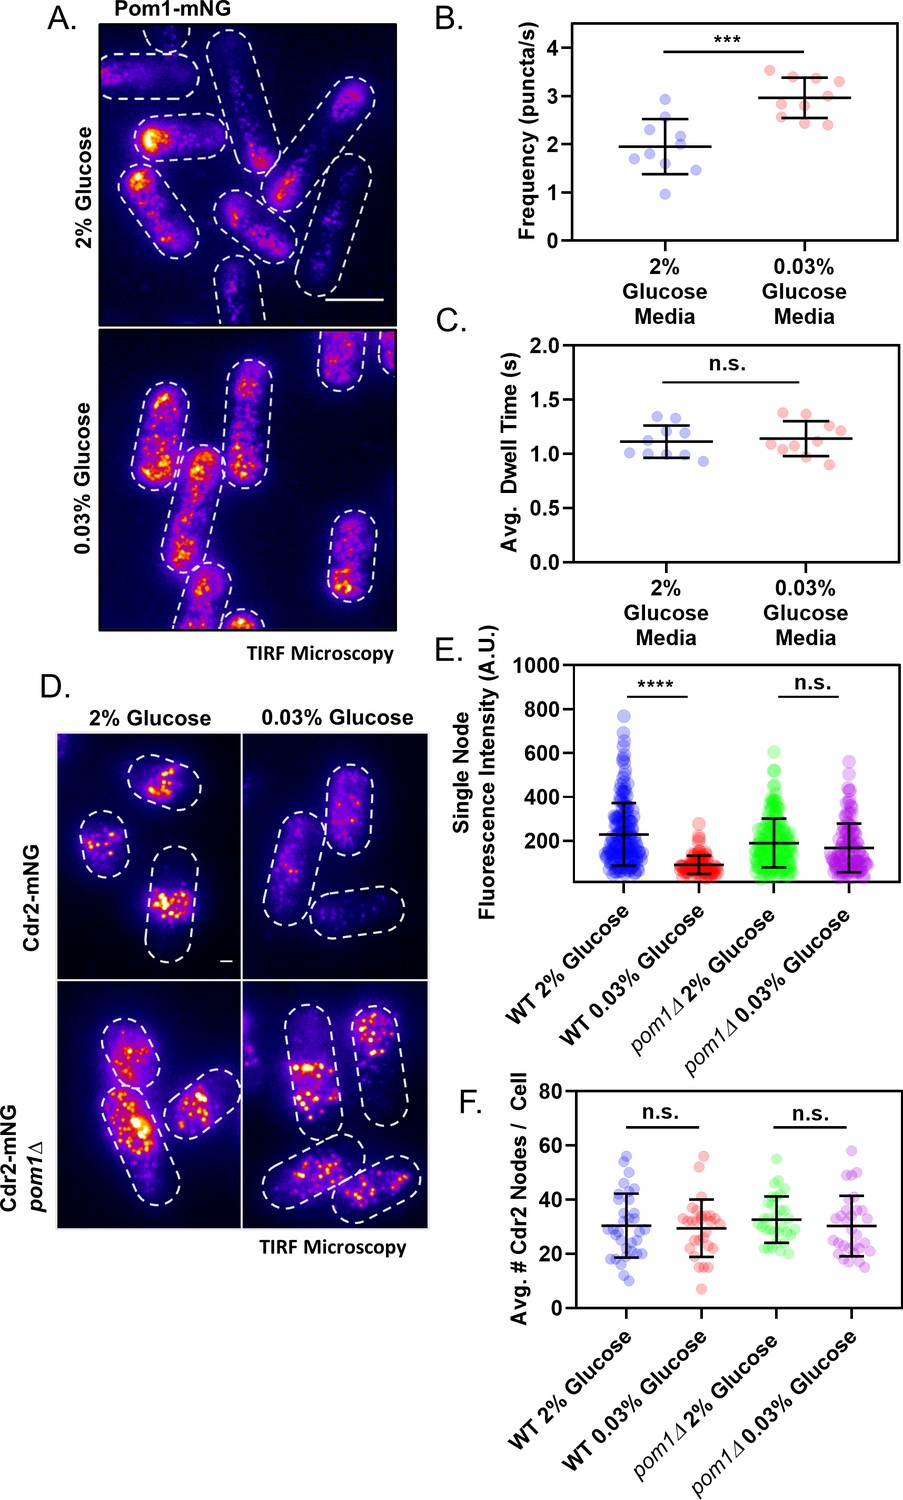
Redistribution of Pom1 clusters to the lateral cortex disrupts Cdr2 nodes during glucose restriction.
(A) Localization of Pom1-mNG in cells grown in either high (2%) or low (0.03%) glucose media. Images were collected using TIRF microscopy. Scale bar, 5 µm. (B) Comparison of the binding frequency of Pom1 clusters at the lateral cell cortex in cells grown under high and low glucose (***p=0.0003, n = 10 cells, 32–113 traces/cell). Statistical significance was tested using a Student’s T-test. (C) Comparison of the binding dwell time of Pom1 clusters at the lateral cell cortex in cells grown under high and low glucose (n.s., p=0.6833, n = 10 cells, 32–113 traces/cell). Statistical significance was tested using a Student’s T-test. (D) Localization of Cdr2-mNG in wild-type or pom1∆ cells grown in either normal (2%) or low (0.03%) glucose media. Images were collected using TIRF microscopy. Scale bar, 1 µm. (E) Comparison of the fluorescence intensity of individual Cdr2-mNG nodes in wild-type or pom1∆ cells grown in either normal (2%) or low (0.03%) glucose media. Low glucose induces partial node disassembly in wild-type cells (****p<0.0001, n = 92–169 nodes from >5 cells) but not in pom1∆ cells (n.s., p=0.4015, n = 113–156 nodes from >5 cells). Measurements were taken from Airyscan Super-Resolution confocal micrographs. (F) Quantification and comparison of the total number of Cdr2-mNG nodes visible in TIRF micrographs of wild-type or pom1∆ cells grown in either normal (2%) or low (0.03%) glucose media. There is no significant difference in any condition (p>0.05, n = 28–33 cells). Statistical significance was tested using a one-way ANOVA.
Figure 5—figure supplement 1
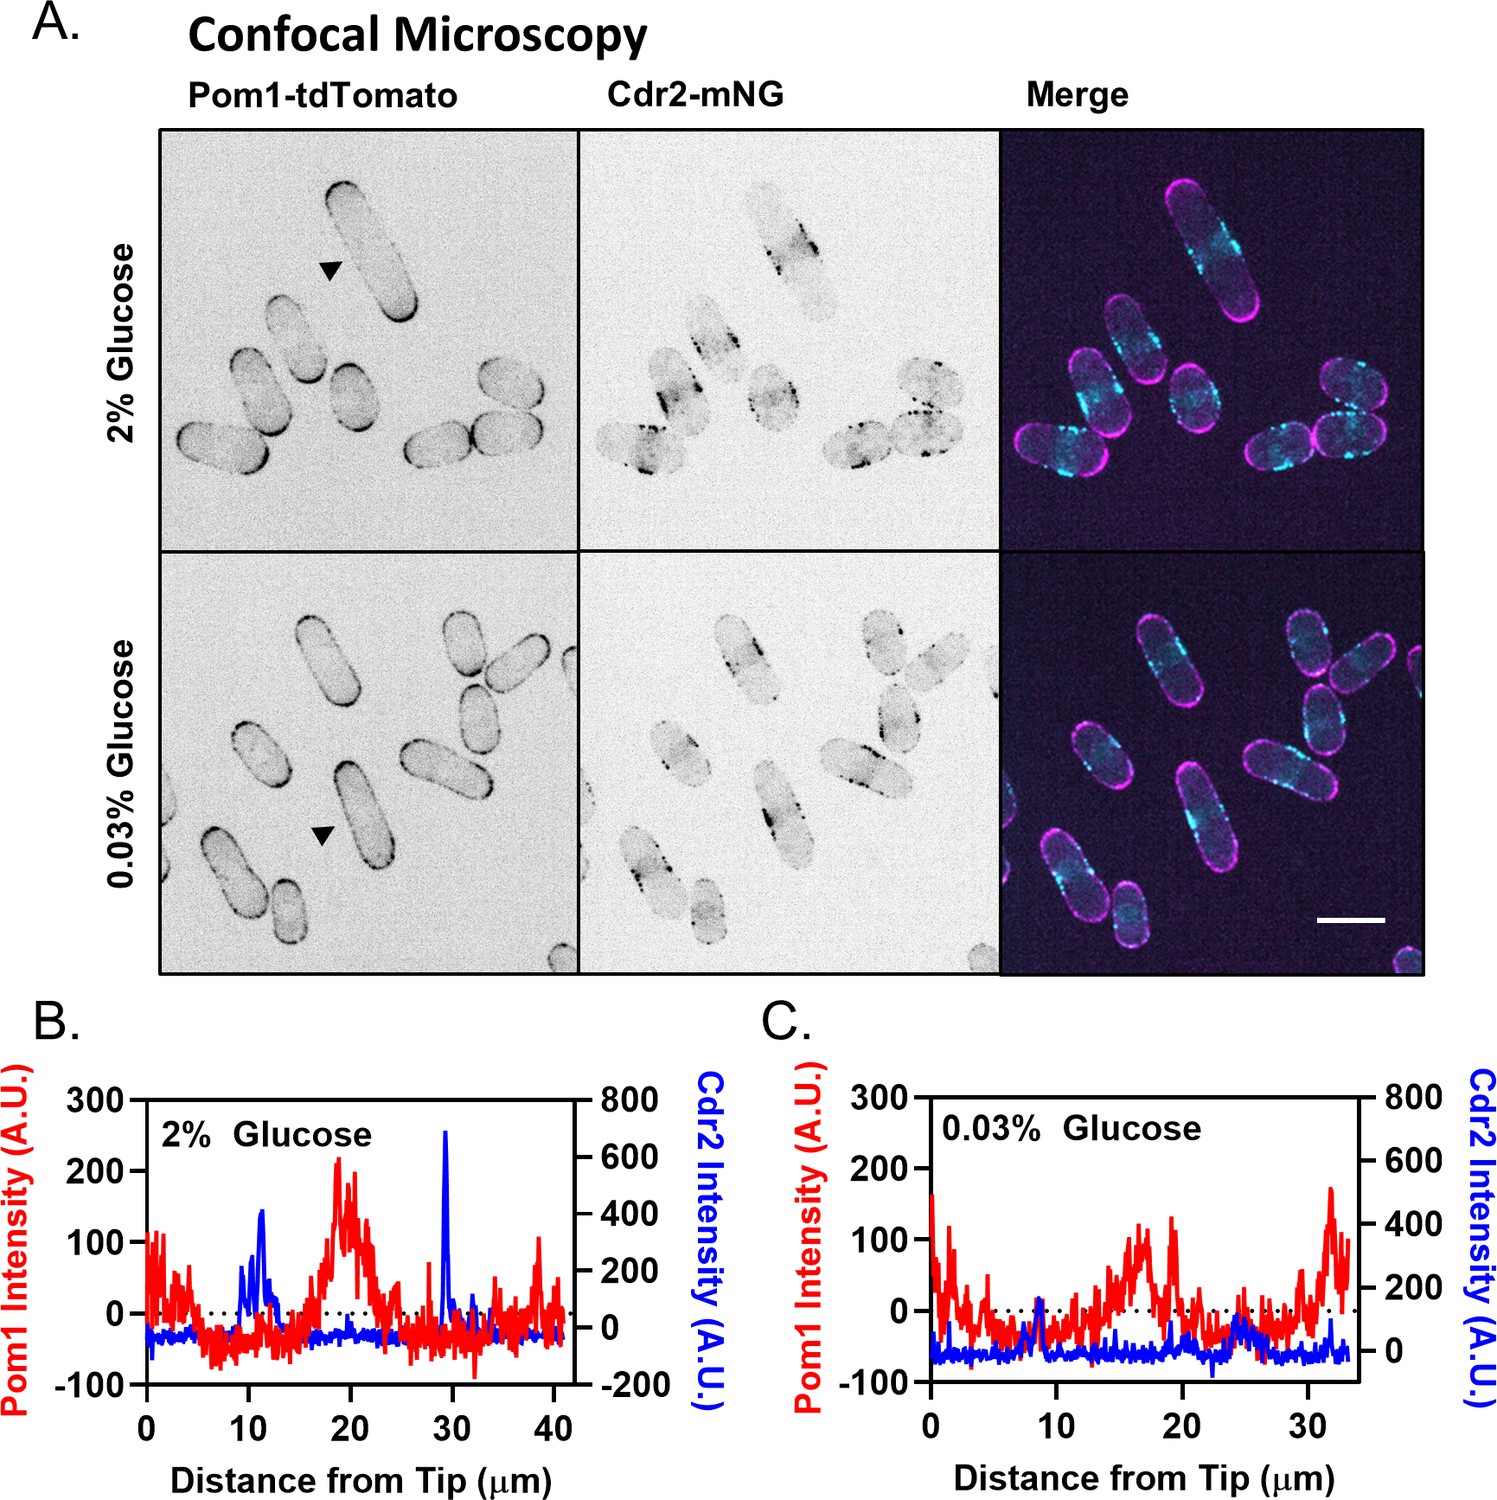
Redistribution of Pom1 clusters to the lateral cortex disrupts Cdr2 nodes during glucose restriction, supporting data.
(A) Analysis of Pom1 and Cdr2 redistribution by spinning-disc confocal microscopy, as in Kelkar and Martin (2015). Images are confocal micrographs of cells co-expressing Pom1-tdTomato and Cdr2-mNG in high (2%) or low (0.03%) glucose media. Scale bar, 5 µm. (B) Cortical fluorescence intensity of Cdr2 and Pom1 was measured using line scans drawn around the circumference of the representative cell marked with an arrowhead in the 2% glucose portion of panel A. (C) Cortical fluorescence intensity of Cdr2 and Pom1 was measured using line scans drawn around the circumference of the representative cell marked with an arrowhead in the 0.03% glucose portion of panel A.
Figure 6
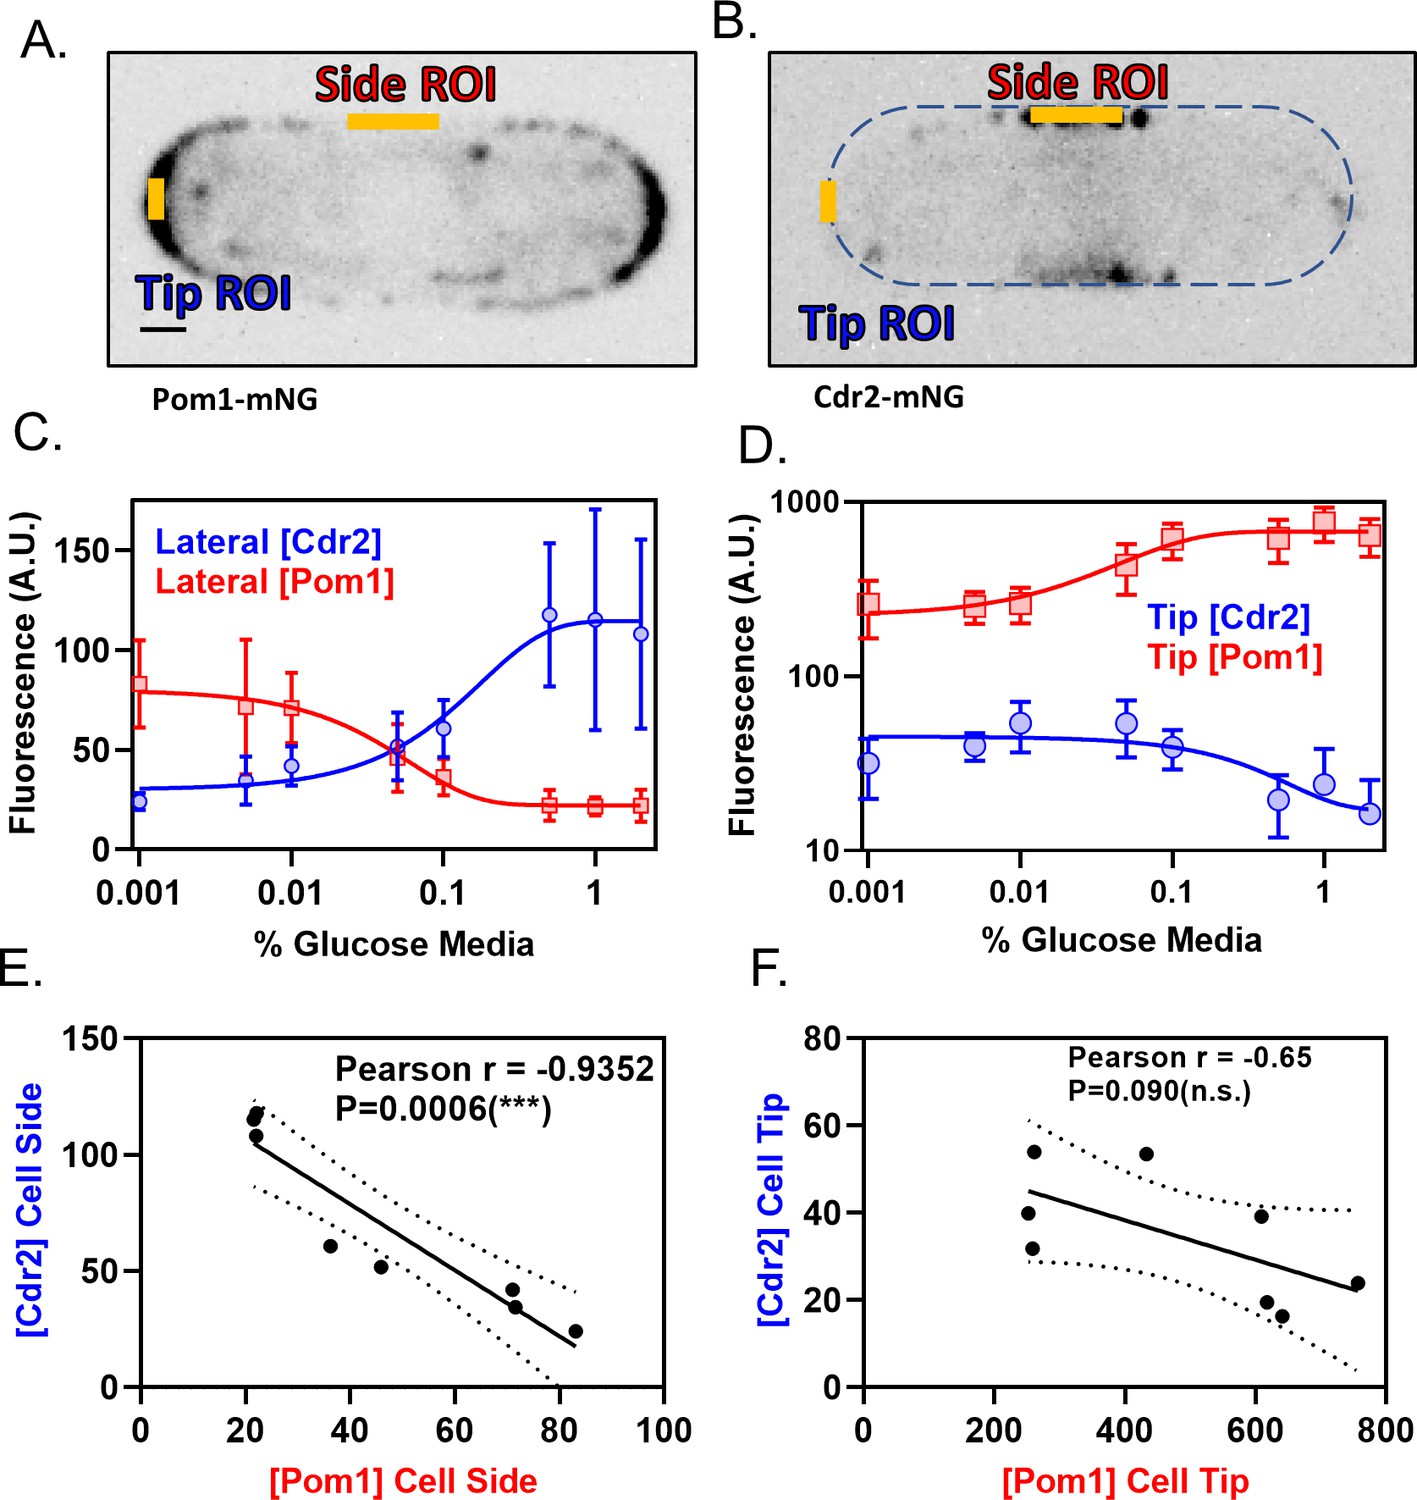
Pom1 and Cdr2 concentrations at the lateral cell cortex depend on glucose availability and are anti-correlated.
(A–B) Localization of Pom1-mNG (panel A) and Cdr2-mNG (panel B) in confocal micrographs at middle cell focal planes. Regions where line-scans were used to measure fluorescence intensity are marked at the tip and side (orange lines). Scale bar, 1 µm. (C) Concentration of Pom1 (red squares) or Cdr2 (blue circles) at cell sides in a range of glucose concentrations, measured using ‘Side ROI’ as in panels A and B (n > 10 cells/concentration). (D) Concentration of Pom1 (red squares) or Cdr2 (blue circles) at cell tips in a range of glucose concentrations, measured using ‘Tip ROI’ as in panels A and B (n > 10 cells/concentration). (E) Correlation of Cdr2 vs Pom1 concentrations at cell sides in each glucose concentration from panel C. Concentrations are anticorrelated across all tested media glucose concentrations (p=0.0006, Pearson r = −0.9352, n = 8 concentrations). (F) Correlation of Cdr2 vs Pom1 concentrations at cell tips in each glucose concentration from panel D. Concentrations show weak anticorrelation across the tested media glucose concentrations, but the correlation is not statistically significant (p=0.09, Pearson r = −0.65, n = 8 concentrations).
Figure 7 with 1 supplement
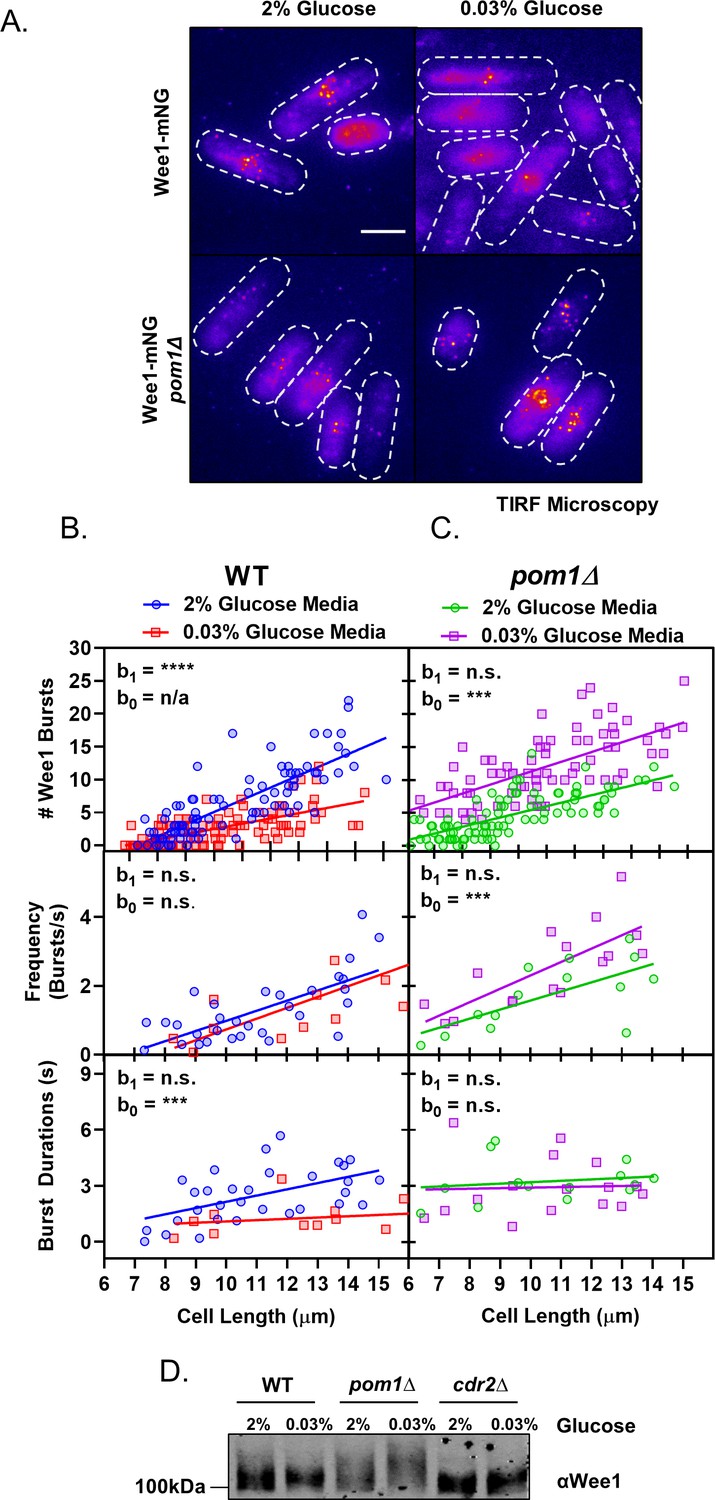
Pom1 redistribution under glucose restriction disrupts Wee1 regulation at cortical nodes.
(A) Localization of Wee1-mNG in wild-type or pom1∆ cells grown in either high (2%) or low (0.03%) glucose media. Images were collected using TIRF microscopy. Scale bar, 5 µm. (B) Quantification of Wee1 bursting kinetics in wild-type cells grown under high (2%, blue circles) and low (0.03%, red squares) glucose conditions. The top panel is a plot of the total number of Wee1 bursts as a function of cell length, counted in single time point TIRF micrographs. The middle panel is a plot of the frequency of Wee1 bursts as a function of cell length. The bottom panel is a plot of Wee1 burst duration as a function of cell length. (C) Quantification of Wee1 bursting kinetics in pom1∆ cells grown under normal (2%, green circles) and low (0.03%, magenta squares) glucose conditions, as in panel B. For (B–C), insets represent whether the best fit values of the slope (b1) and/or Y-intercept (b0) of the two linear regressions are different at the 95% confidence level. See Supplementary file 1 and Supplementary file 2 for parameters of linear regressions and full statistical comparisons. (D) Western blot of Wee1 in wild-type, pom1∆, and cdr2∆ cells grown in high (2%) or low (0.03%) glucose media showing phosphorylation dependent band-shifts.
Figure 7—figure supplement 1

Wee1 bursting in low glucose phenocopies a kinase-dead Cdr2 mutant.
(A) Plot of the frequency of Wee1 bursts as a function of cell length in wild-type cells grown in high glucose (blue circles) and low glucose (red squares), or kinase-dead cdr2(E177A) mutant cells grown in high glucose (green triangles). (B) Plot of Wee1 burst duration as a function of cell length in wild-type cells grown in low glucose (red squares) and kinase-dead cdr2(E177A) mutant cells grown in high glucose (green triangles). For (A–B), insets represent whether the best fit values of the slope (b1) and/or Y-intercept (b0) of the linear regressions are different at the 95% confidence level. See Supplementary file 1 and Supplementary file 2 for parameters of linear regressions and full statistical comparisons.
Figure 8
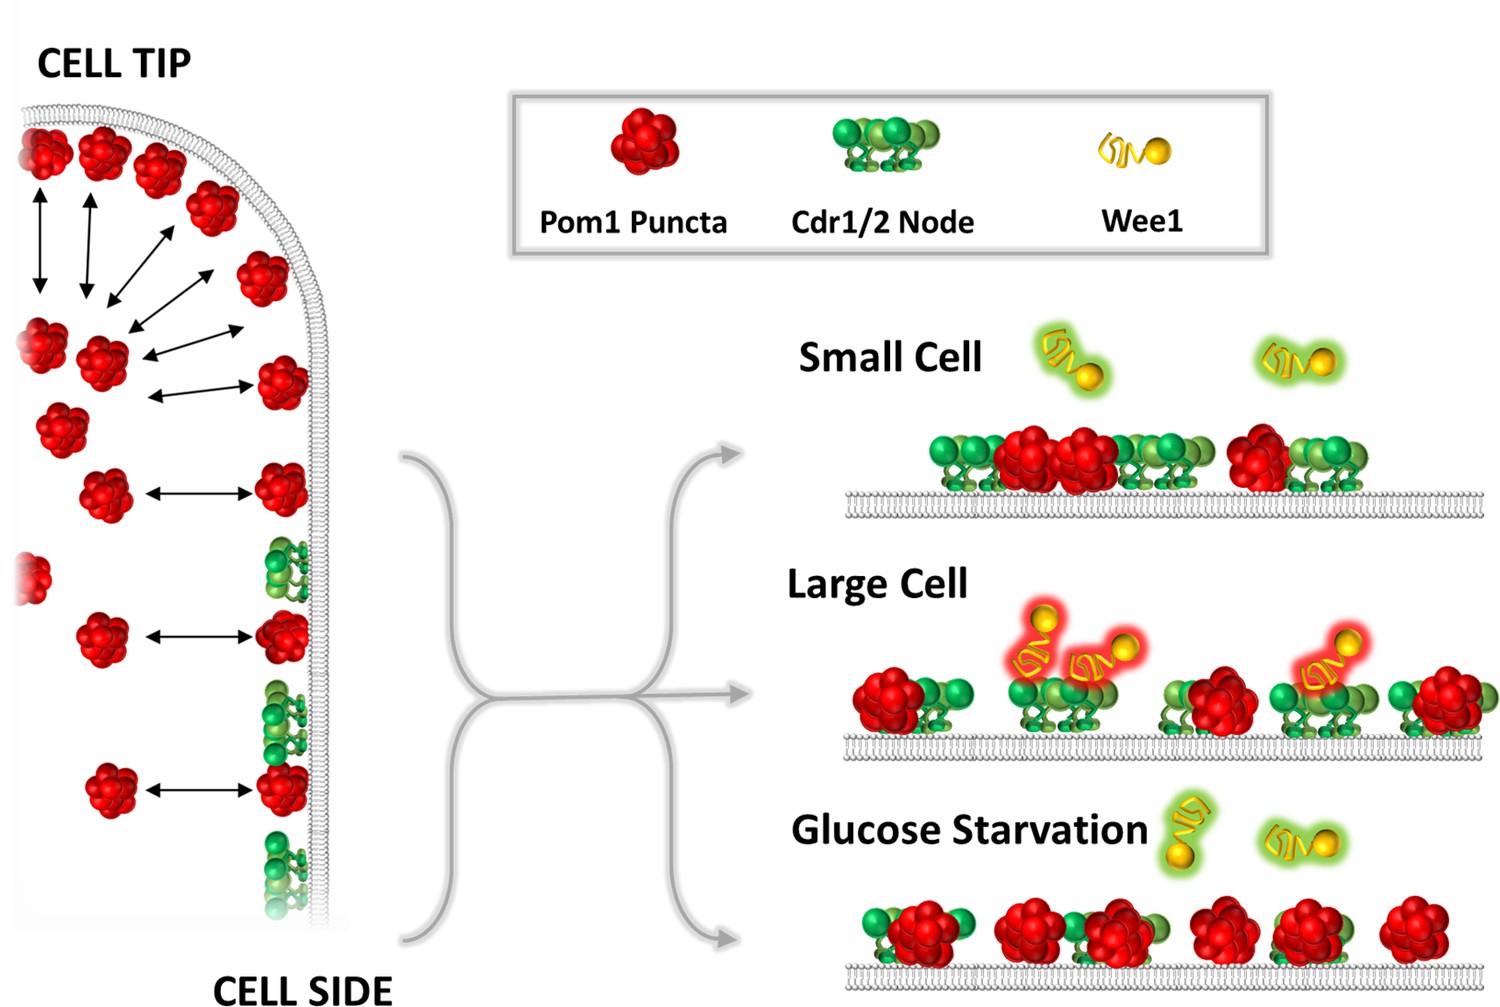
A model for the glucose-modulated control of Wee1 bursting by Pom1 and Cdr2.
See text for discussion.
Videos
Video 1
Pom1-mNG forms clusters that transiently bind the cell cortex.
TIRF microscopy of a cell expressing Pom1-mNG from the endogenous locus. Frames are 200 ms exposures from continuous acquisition. Scale bar is 1 µm.
Video 2
Pom1-mNG clusters on synthetic supported lipid bilayers.
TIRF microscopy of Pom1-mNG clusters in cytoplasmic extracts, binding and releasing artificial supported lipid bilayers composed of phosphatidylcholine and phosphatidylserine. Frames are 200 ms exposures with 200 ms interval between consecutive frames. Scale bar is 1 µm.
Tables
Key resources table
| Reagent type (species) or resource | Designation | Source or reference | Identifiers | Additional information |
|---|---|---|---|---|
| Strain, strain background (S. pombe) | pom1-yomNeon Green::hphR | This Paper | JM4496 | Integration through PCR product transformation |
| Strain, strain background (S. pombe) | pom1-3HA::hphR ura4-D18 leu1-32 h+ | PN948 | JM797 | Paul Nurse Lab |
| Strain, strain background (S. pombe) | pom1∆::natR h- | Lab Stock | JM966 | |
| Strain, strain background (S. pombe) | pom1-m2-yomNeon Green::hphR ura4-D18 leu1-32 h- | This Paper | JM5412 | Integration through PCR product transformation |
| Strain, strain background (S. pombe) | pom1-3HA::hphR tea1∆::ura4 + ura4-D18 | This Paper | JM5414 | Progeny from cross between JM797 and JM219 |
| Strain, strain background (S. pombe) | pom1-3HA::hphR tea4∆::kanMX6 | This Paper | JM5415 | Progeny from cross between JM797 and J M2256 |
| Strain, strain background (S. pombe) | pom1-yomNeonGreen::hphR tea1∆::kanMX6 | This Paper | JM4792 | Progeny from cross between JM4496 and JM838 |
| Strain, strain background (S. pombe) | pom1-yomNeonGreen::hphR tea4∆::kanMX6 | This Paper | JM4791 | Progeny from cross between JM4496 and JM218 |
| Strain, strain background (S. pombe) | pom1-yomNeonGreen::hphR cdr2-tagRFP-t::hphR | This Paper | JM5373 | Progeny from cross between JM4699 and JM4160 |
| Strain, strain background (S. pombe) | cdr2-yomNeonGreen::hphR h- | Lab Stock | JM4493 | |
| Strain, strain background (S. pombe) | wee1-yomNeon Green::hphR cdr2∆::natR | Lab Stock | JM4525 | |
| Strain, strain background (S. pombe) | cdr2-yomNeonGreen::hphR pom1-tdTomato::natR | This Paper | JM5135 | Progeny from cross between JM935 and JM4493 |
| Strain, strain background (S. pombe) | cdr2-mEGFP::kanMX6 ura4-D18 leu1-32 ade6-m210 h+ | Lab Stock | JM346 | |
| Strain, strain background (S. pombe) | cdr2-yomNeon Green::hphR pom1∆::natR | This Paper | JM5359 | Progeny from cross between JM5238 and JM966 |
| Strain, strain background (S. pombe) | wee1-yomNeon Green::hphR h- | Lab Stock | JM4495 | |
| Strain, strain background (S. pombe) | wee1-yomNeon Green::hphR pom1∆::kanMX6 | Lab Stock | JM4527 | |
| Strain, strain background (S. pombe) | 972 h- | PN1 | JM366 | Paul Nurse lab |
| Strain, strain background (S. pombe) | cdr2∆::natR ura4-D18 leu1-32 h+ | Lab Stock | JM600 | |
| Strain, strain background (S. pombe) | wee1-yomNeon Green::hphR cdr2(E177A) | Lab Stock | JM4578 | |
| Recombinant DNA reagent | pFA6a-yomNeon Green::hphR | Lab Stock | pJM1344 | |
| Recombinant DNA reagent | pFA6a-tdTomato::natR | Lab Stock | pJM248 | |
| Recombinant DNA reagent | pFA6a-yomTagRFP-T::hphR | Lab Stock | pJM1221 | Derived from Addgene Plasmid 44842 |
| Recombinant DNA reagent | pFA6a-mEGFP::kanMX6 | Lab Stock | pJM228 | |
| Recombinant DNA reagent | pFA6a-3HA::hphR | Lab Stock | pJM216 | |
| Antibody | anti-HA (mouse monoclonal) | Covance | MMS-101R | WB (1:3000) |
| Antibody | anti-GST (rabbit polycolonal) | Covance | custom | WB (1:3000) |
| Chemical compound, drug | 1,2-dioleoyl-sn-glycero-3- phospho-L-serine (sodium salt) | Avanti Polar Lipids | 840035C | 18:1 DOPS or ‘PS’ |
| Chemical compound, drug | 1,2-dioleoyl-sn-glycero-3- phosphoethanolamine-N -(lissamine rhodamine B sulfonyl) (ammonium salt) | Avanti Polar Lipids | 810150C | 18:1 Liss Rhod PE |
| Chemical compound, drug | 1,2-dioleoyl-sn- glycero-3-phosphocholine | Avanti Polar Lipids | 850375C | 18:1 (Δ9-Cis) PC (DOPC) or ‘PC’ |
Additional files
-
Supplementary file 1
Parameters of linear regressions in Figure 7B,C and Figure 7—figure supplement 1A,B.
For each data set, the table includes: The slope of the linear regression (b1) and its 95% confidence intervals; whether the slope of the linear regression significantly deviates from zero at the 95% confidence interval; the Y-intercept of the linear regression (b0) and its 95% confidence intervals; the coefficient of determination of the linear regression (R2); the n of the data set.
- https://doi.org/10.7554/eLife.46003.023
-
Supplementary file 2
Summary of the statistical comparisons of the linear regressions in Figure 7B,C and Figure 7—figure supplement 1A,B.
For each comparison, the table includes: Whether the slopes of the linear regressions (b1) are significantly different from each other at the 95% confidence level; whether the Y-intercepts of the linear regressions (b0) are significantly different from each other at the 95% confidence level. If the slopes of the linear regressions differed significantly, the difference in Y-intercepts was not tested.
- https://doi.org/10.7554/eLife.46003.024
-
Transparent reporting form
- https://doi.org/10.7554/eLife.46003.025
Download links
A two-part list of links to download the article, or parts of the article, in various formats.
Downloads (link to download the article as PDF)
Open citations (links to open the citations from this article in various online reference manager services)
Cite this article (links to download the citations from this article in formats compatible with various reference manager tools)
Stable Pom1 clusters form a glucose-modulated concentration gradient that regulates mitotic entry
eLife 8:e46003.
https://doi.org/10.7554/eLife.46003


