MicroRNA-mediated control of developmental lymphangiogenesis
- Eunice Kennedy Shriver National Institute of Child Health and Human Development, National Institutes of Health, United States
Figures
Figure 1 with 2 supplements
Identification of lymphatic microRNAs enriched in human and zebrafish lymphatic endothelial cells.
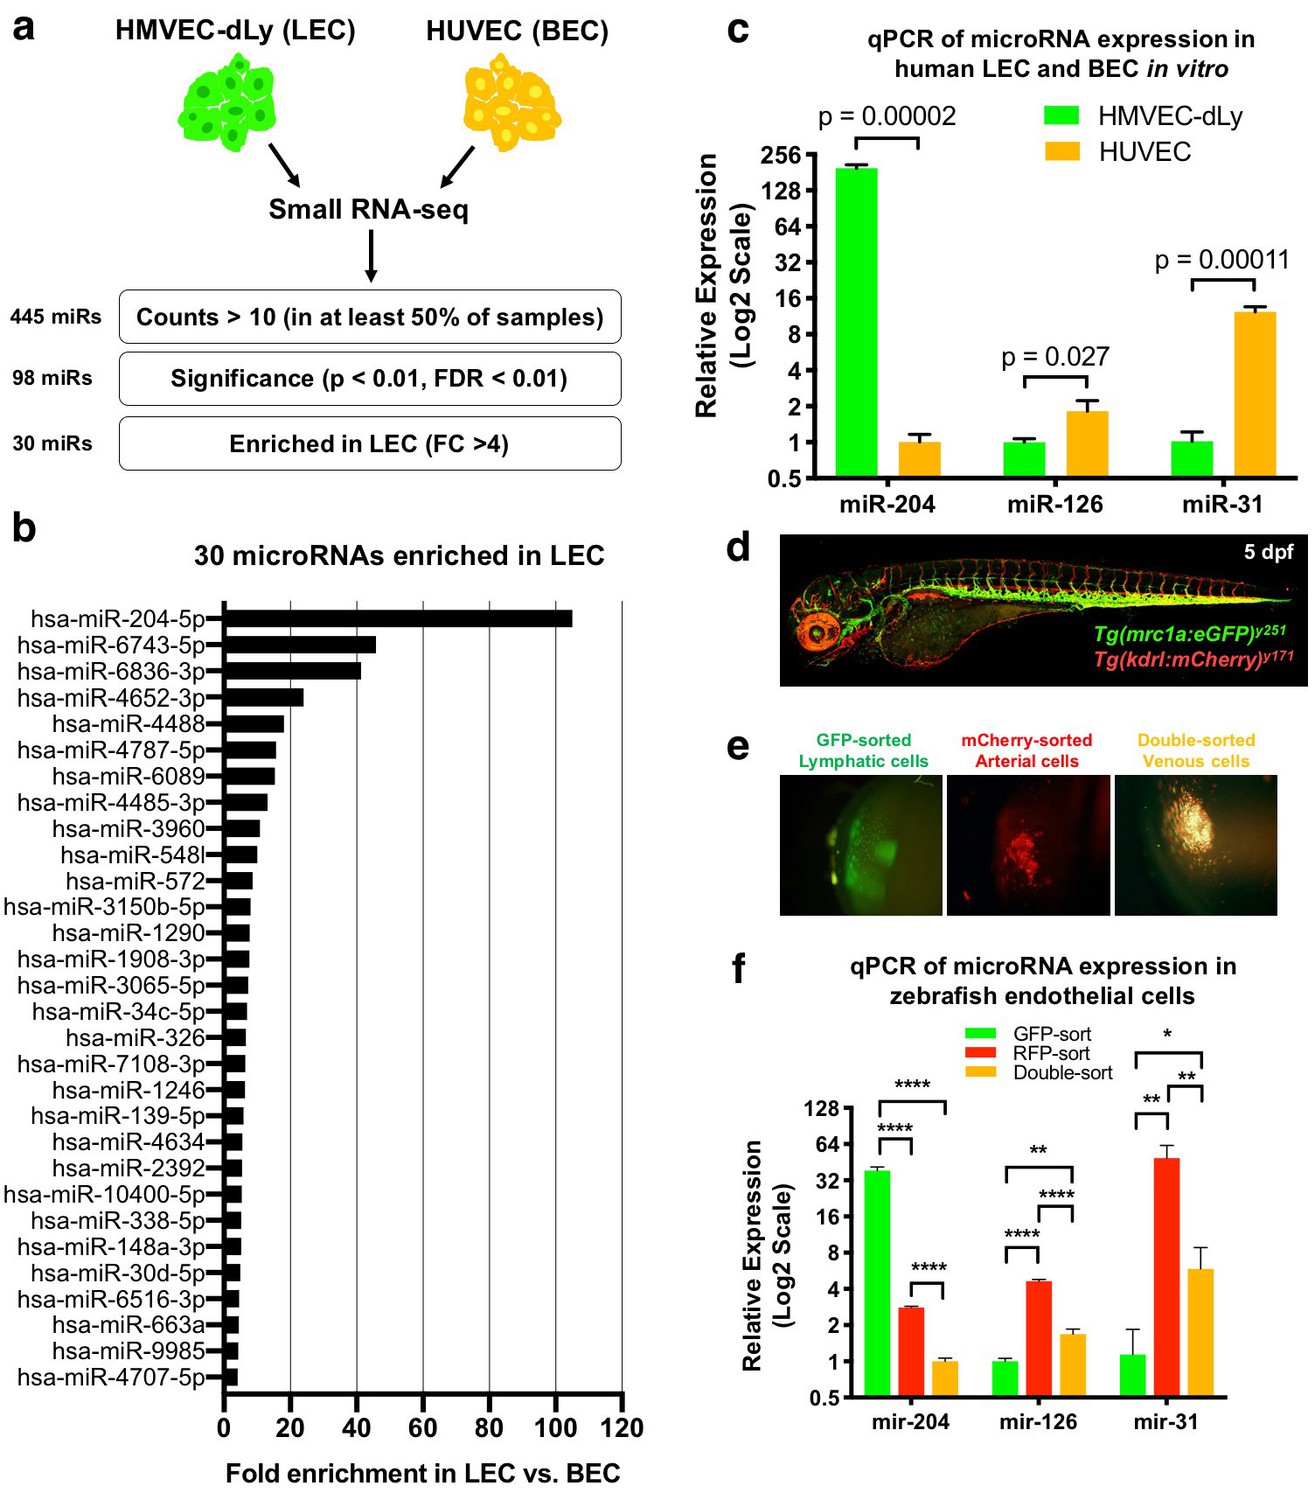
(a) Schematic diagram of the workflow for small RNA sequencing from lymphatic (HMVEC-dLy) and blood (HUVEC) endothelial cells and selection of microRNAs enriched in lymphatic endothelial cells. (b) Relative fold enrichment of the 22 most highly enriched microRNAs in LEC versus BEC small RNA sequence data (average of triplicate samples from each group). (c) Quantitative TaqMan RT-PCR measurement of the relative expression of three different microRNAs in HMVEC-dLy (LEC) and HUVEC (BEC). Levels of mir-204 are normalized to HUVEC (BEC) levels, while levels of mir-126 and mir-31 are normalized to HMVEC-dLy (LEC) levels. Three biological replicates were analyzed. (d) Confocal image of a five dpf Tg(mrc1a:eGFP)y251, Tg(kdrl:mCherry)y171 double-transgenic larva (lateral view, rostral to the left). (e) Confocal images of lymphatic (GFP-positive), arterial (mCherry-positive), and venous (GFP and mCherry double-positive) endothelial cell pellets isolated from dissociated five dpf transgenic animals such as that in panel d by Fluorescence Activated Cell Sorting (FACS). (f) Quantitative TaqMan RT-PCR measurement of the relative expression of mature mir-204, mir-126, and mir-31 in FACS-sorted zebrafish endothelial cells. FACS-sorted cells from ~1000 5 dpf larvae were used and three technical replicates were analyzed. Levels of mir-204 are normalized to venous (GFP and mCherry double-positive) levels, while levels of mir-126 and mir-31 are normalized to lymphatic (GFP-positive) levels. All graphs are analyzed by t-test and the mean ± standard deviation (SD) is shown. *, p<0.05; **, p<0.01; ****, p<0.0001.
-
Figure 1—source data 1
List of microRNAs from the small RNA sequencing data with numeric values comparing LEC vs. BEC.
- https://doi.org/10.7554/eLife.46007.005
-
Figure 1—source data 2
Numerical data for Figure 1 and Figure 1—figure supplement 1.
- https://doi.org/10.7554/eLife.46007.006
Figure 1—figure supplement 1
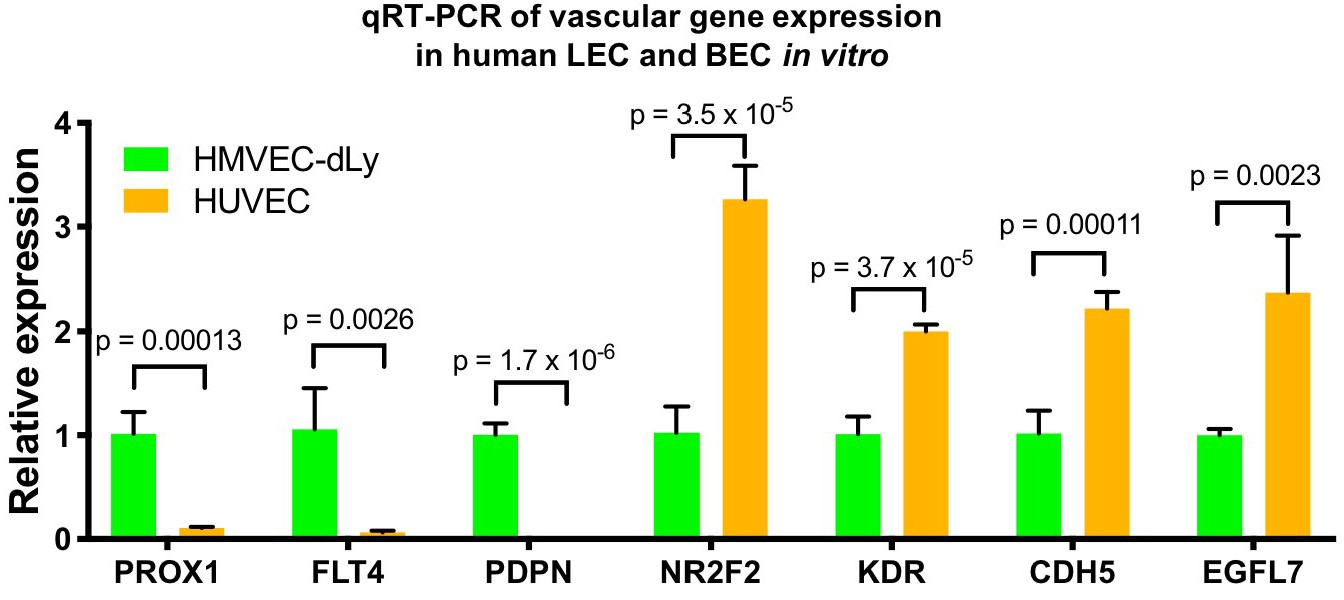
Differential expression of vascular genes in HMVEC-dLy and HUVEC.
Quantitative TaqMan RT-PCR measurement of the relative expression of known lymphatic and blood vessel markers in HMVEC-dLy (Lymphatic Endothelial Cells, LEC) and HUVEC (Blood Endothelial Cells, BEC), normalized to expression levels in HMVEC-dLy (LEC). Four biological replicates were analyzed. All graphs are analyzed by t-test and the mean ± SD is shown.
Figure 1—figure supplement 2
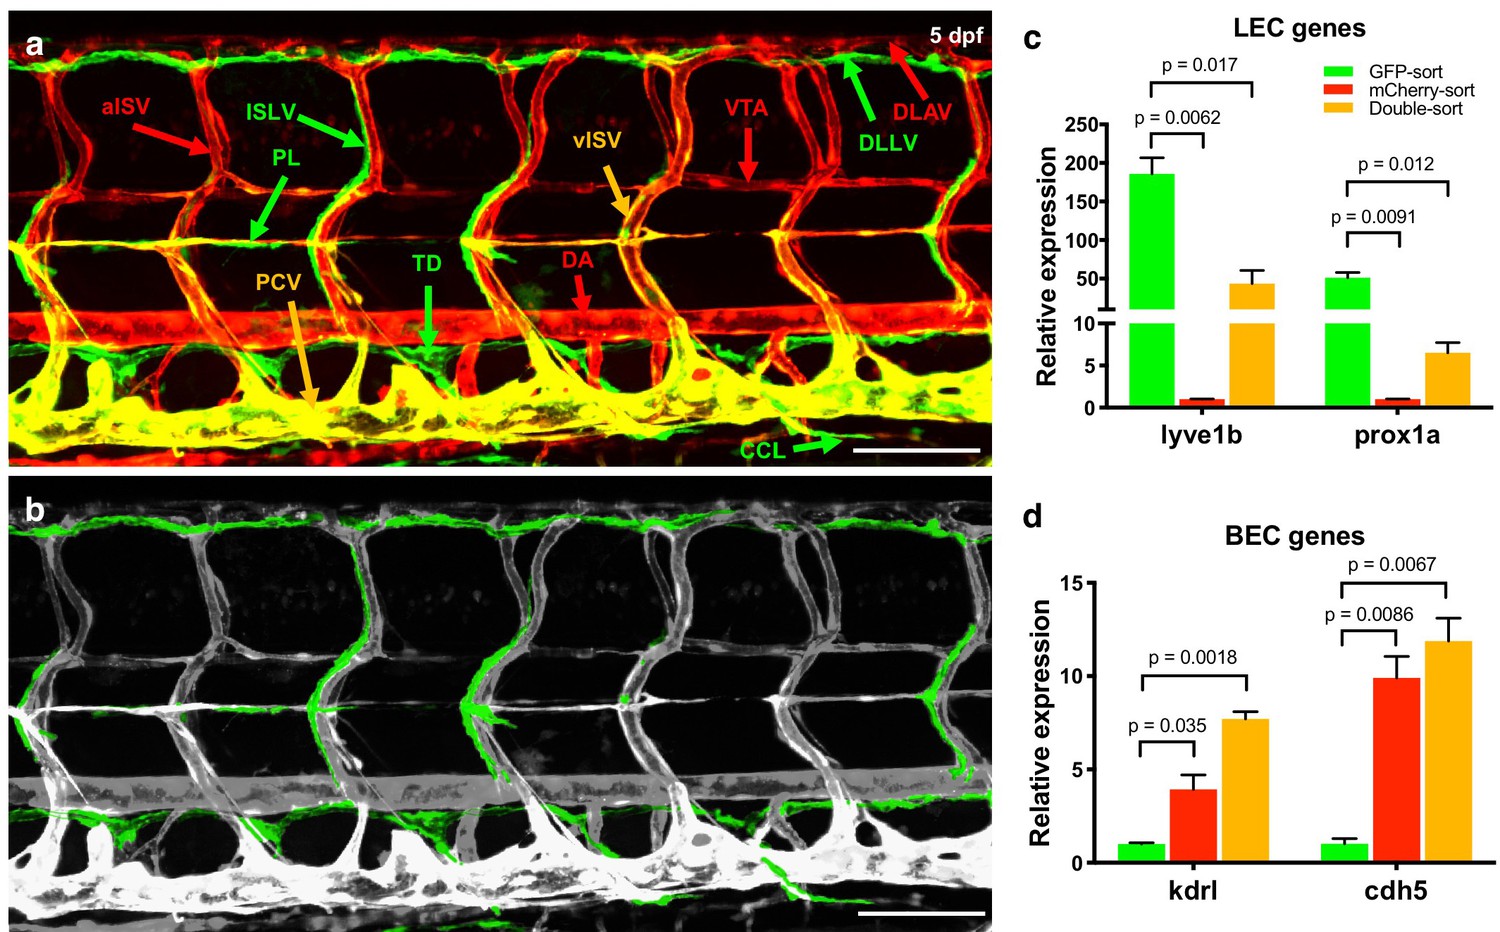
Trunk vascular patterning and vascular gene expression in FACS-sorted endothelial cells from transgenic zebrafish.
(a) Confocal images of the vasculature in the mid-trunk of a five dpf Tg(mrc1a:eGFP)y251, Tg(kdrl:mCherry)y171 double-transgenic animal with mCherry positive arterial blood vessels (red), EGFP positive lymphatic vessels (green), and mCherry and EGFP double positive venous blood vessels (yellow). The different vessels are labeled: DA, dorsal aorta; DLLV, dorsal longitudinal lymphatic vessel; DLAV, dorsal longitudinal anastomotic vessel; ISLV: intersegmental lymphatic vessel; aISV: arterial intersegmental vessel; vISV: venous intersegmental vessel; PCV, posterior cardinal vein; PL, parachordal line; TD, thoracic duct; CCL, collateral cardinal lymphatics; VTA, vertebral artery. (b) Confocal image from panel a with lymphatic vessels pseudocolored in green and other vessels in gray, for easier visualization of the lymphatic network. (c) Quantitative TaqMan RT-PCR measurement of the relative expression of lymphatic endothelial cell (LEC) genes lyve1b and prox1a in FACS-sorted zebrafish endothelial cell populations. Expression is normalized to the arterial (mCherry-positive) endothelial cell population. (d) Quantitative TaqMan RT-PCR measurement of the relative expression of blood endothelial cell (BEC) genes kdrl and cdh5 in FACS-sorted zebrafish endothelial cell populations. Expression is normalized to the lymphatic (EGFP-positive) endothelial cell population. Scale bars = 100 µm (a,b). Biological duplicates were analyzed. All graphs are analyzed by t-test and the mean ± SD is shown.
Figure 2 with 3 supplements

Defective lymphangiogenesis in mir-204 deficient zebrafish.
(a) Sequence alignment of the three zebrafish precursor mir-204 sequences (mir-204–1, mir-204–2, and mir-204–3) and a schematic diagram showing four morpholinos (pan-204 MO, MO1, MO2, and MO3) targeting them. The data shown in the rest of this figure (panels b-m) uses the pan-204 MO targeting the mature mir-204 sequence generated by all three zebrafish mir-204 loci. (b) Quantitative TaqMan RT-PCR measurement of the relative levels of mature miR-204 in one dpf control MO- or pan-204 MO-injected embryos, normalized to controls. Three biological replicates were analyzed. (c,d) Time series of confocal images of trunk vessels in 35–51 hpf Tg(mrc1a:eGFP)y251;Tg(kdrl:mCherry)y171 control (c) or pan-204 morphant (d) animals, with secondary sprouts highlighted in green. (e–h) Confocal images of the parachordal line in three dpf Tg(mrc1a:eGFP)y251;Tg(kdrl:mCherry)y171 animals injected with either control MO (e, f) or pan-204 MO (g, h). In panel f the parachordal line is highlighted in green and other vessels are in gray. The absence of the parachordal line is noted with asterisks in panels g and h. (i–l) Confocal images of the thoracic duct in five dpf Tg(mrc1a:eGFP)y251;Tg(kdrl:mCherry)y171 animals injected with either control MO (i, j) or pan-204 MO (k, l). In panel j the thoracic duct is highlighted in green and other vessels are in gray. The absence of the thoracic duct is noted with asterisks in panels k and l. (m) Quantification of parachordal line formation in three dpf animals injected with either control MO (n = 23) or pan-204 MO (n = 32). The same 10 somitic segments were scored in each animal for the presence or absence of an intact parachordal line. (n) Quantification of thoracic duct formation in five dpf animals injected with either control MO (n = 25) or pan-204 MO (n = 39). The same 10 somitic segments were scored in each animal for the presence or absence of an intact thoracic duct. All images are lateral views. Scale bar: 50 μm (c, g, k). All graphs are analyzed by t-test and the mean ± SD is shown.
-
Figure 2—source data 1
Numerical data for Figure 2 and Figure 2—figure supplement 2.
- https://doi.org/10.7554/eLife.46007.010
Figure 2—figure supplement 1

Evolutionarily conservation of miR-204.
(a) Schematic diagram showing the location of miR-204 in intronic region of TRPM3 gene and the 100% conservation of its mature microRNA sequence amongst various vertebrate species. (b) Schematic of two additional zebrafish mir-204 loci located in intron 5 and 4 of trpm1a and trpm1b, respectively. (c) Bright field microscopic images of 5 dpf zebrafish larve that were injected with 0.5 ng of control MO (top) 0.5 ng of pan-204 MO (middle), or 0.75 ng of pan-204 MO (bottom).
Figure 2—figure supplement 2
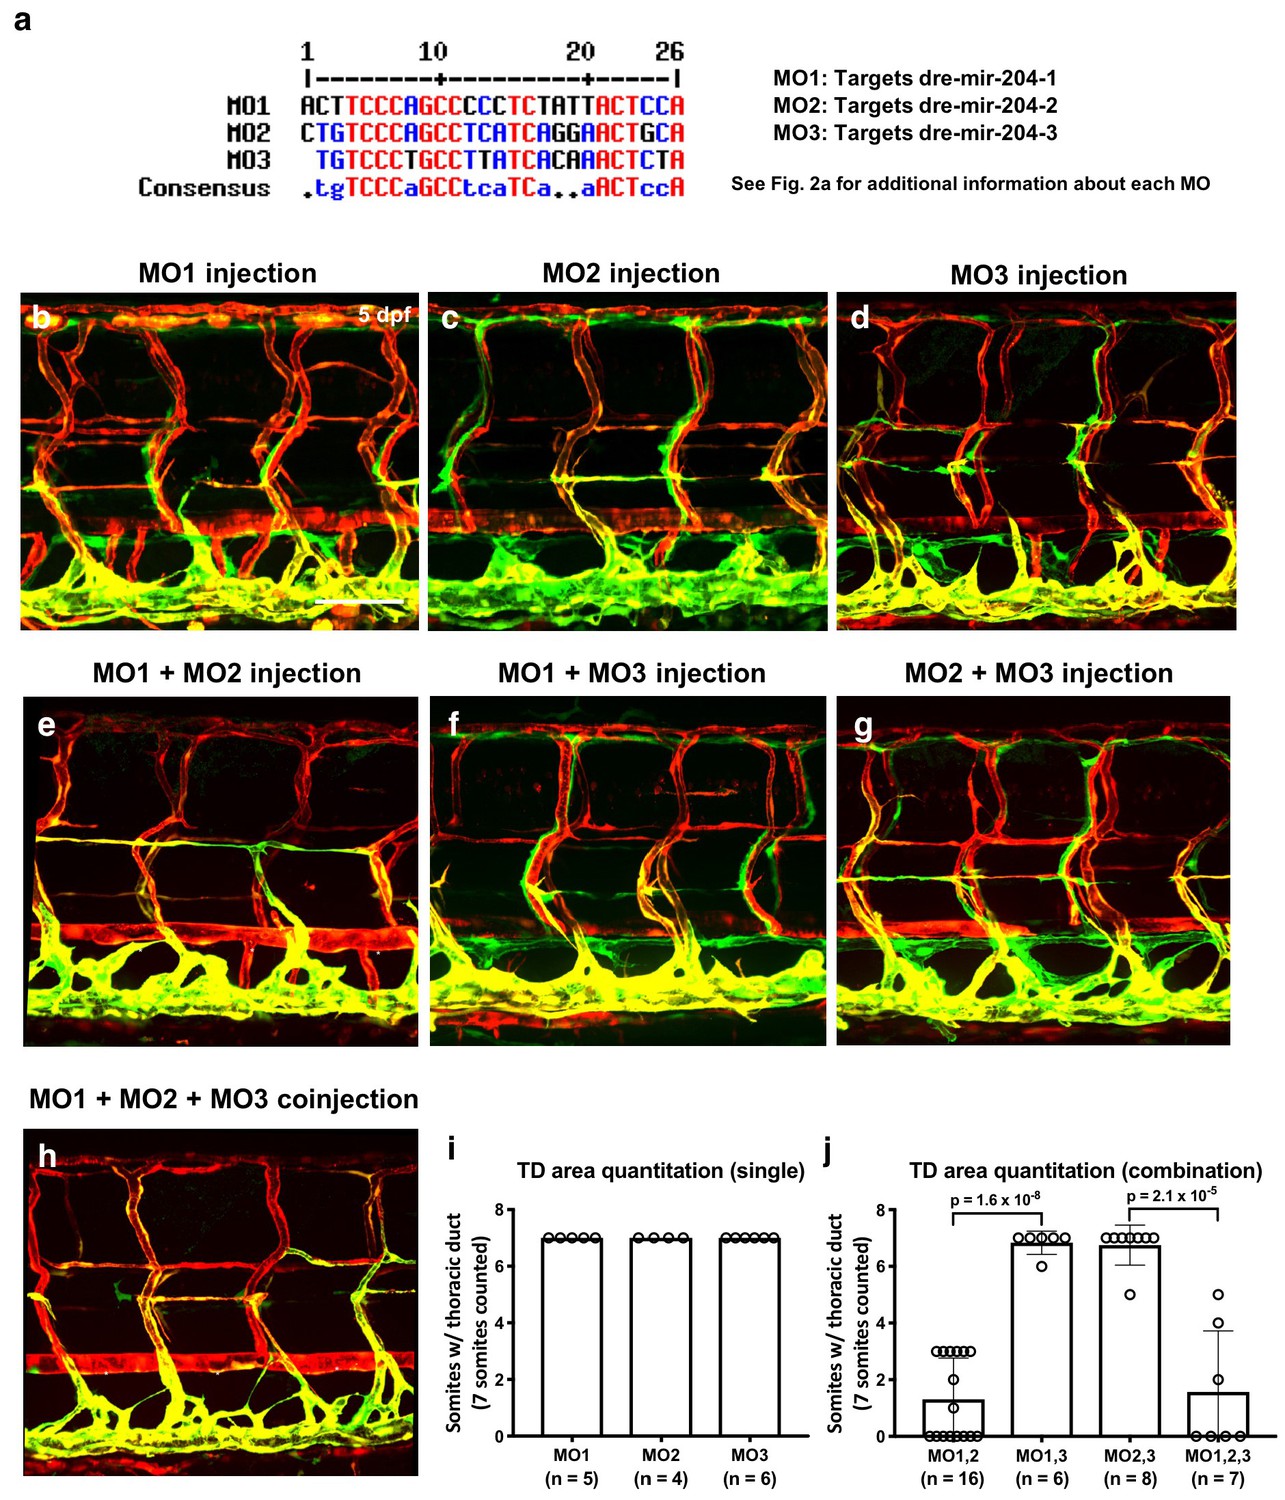
The effects of single or combined injections of mir-204 targeting MOs.
(a) Sequence alignment of MO1, 2, 3. (b-h) Representative confocal images of 5 dpf Tg(mrc1a:eGFP)y251, Tg(kdrl:mCherry)y171 double-transgenic animals injected with 0.5 ng of MO1 (b), MO2 (c), or MO3 (d); injected pairwise with 0.5 ng each of MO1+MO2 (e), MO1+MO3 (f), or MO2+MO3 (g), for a final combined MO dose of 1.0 ng in each case; injected with 0.5 ng each of MO1+MO2+MO3 (h), for a final combined MO dose of 1.5 ng. (i) Quantitation of the single MO injections in panels b-d. (j) Quantitation of the combined MO injections in panels e-h. All images are lateral views, rostral to the left. Scale bar: 100 μm (b). All graphs are analyzed by t-test and the mean ± SD is shown.
Figure 2—video 1
Time lapse video of wildtype (top) and pan204 morphant (bottom) vessel development.
Mid-trunk of Tg(mrc1a:eGFP)y251, Tg(kdrl:mCherry)y171 embryos was imaged during 32–50 hpf. The venous secondary sprouts (green), lymphatic secondary sprouts (magenta), and parachoradal line (cyan) are pseudocolored.
Figure 3 with 2 supplements
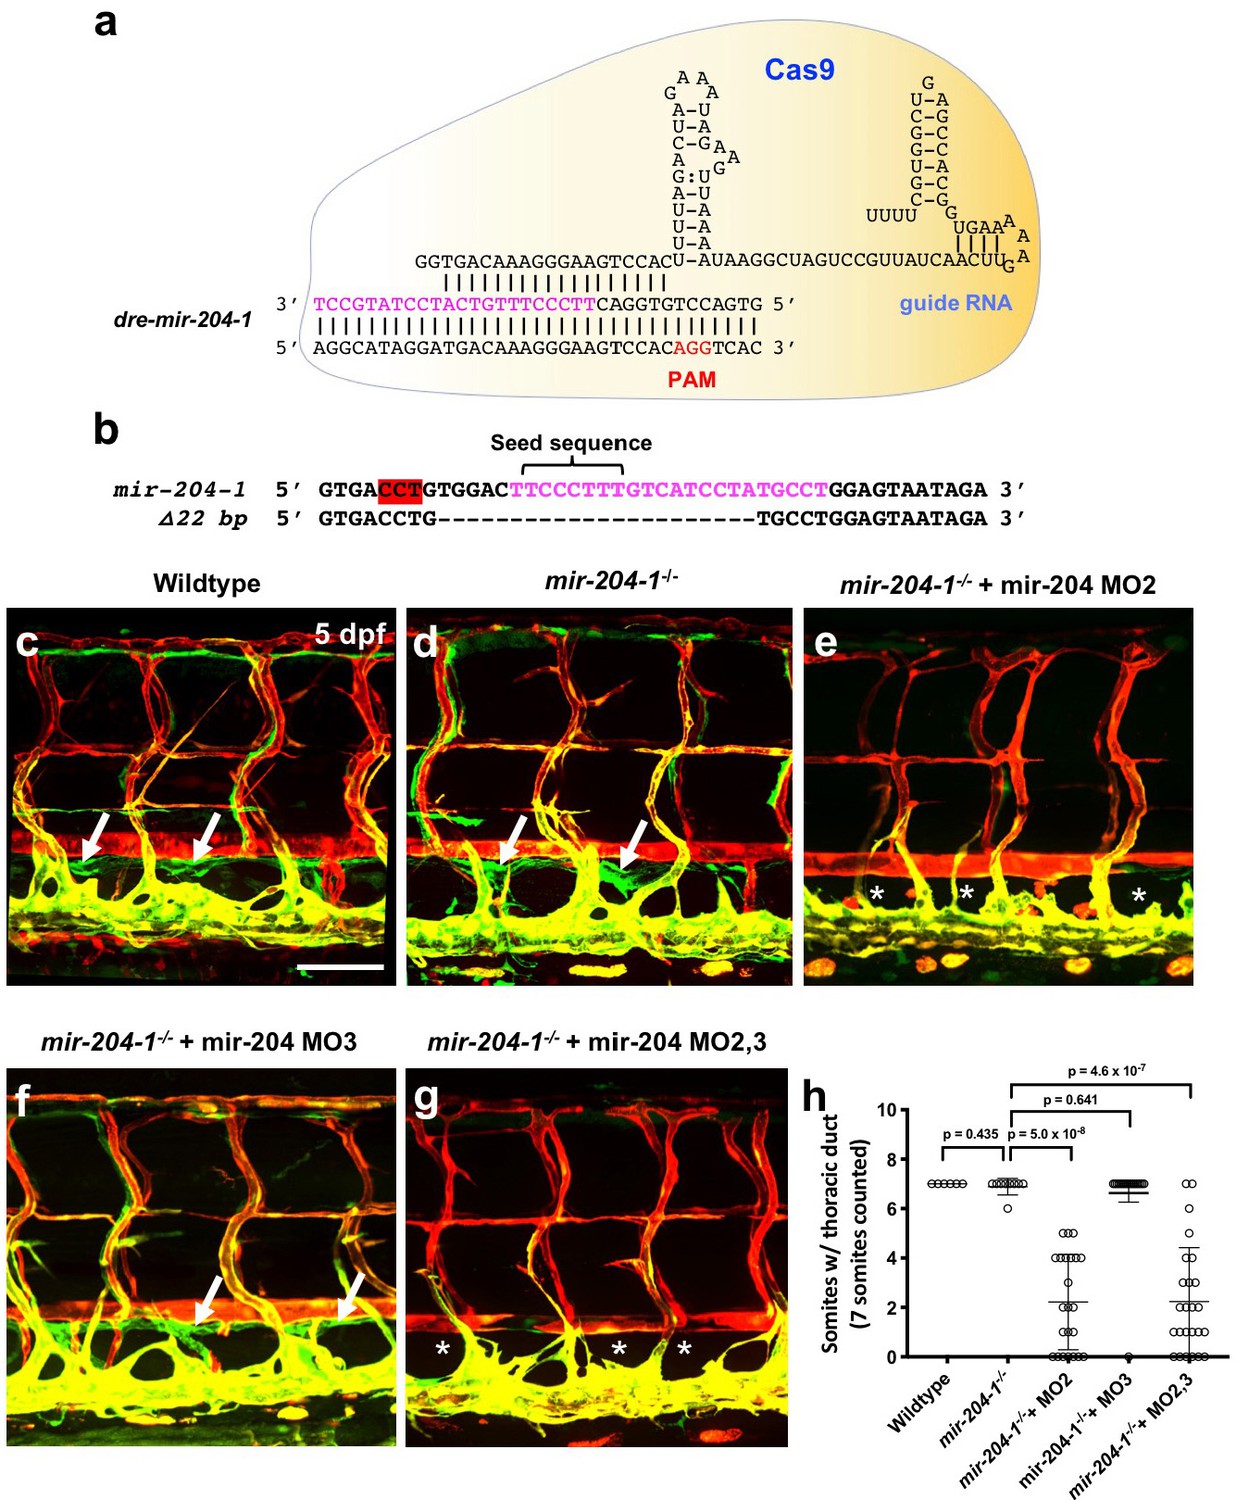
Mir-204 function is required for lymphatic development.
(a) Schematic of CRISPR/Cas9 and guide RNA targeting of mir-204–1. (b) Sequence alignment of wildtype and mir-204–1 mutant genomic DNA. The mature mir-204 sequence is noted in magenta, and the PAM sequence is highlighted in red (on the reverse strand). The mutant carries 22 bp deletion that removes 17 nucleotides of the mature mir-204 sequence. (c–g) Representative confocal images of the mid-trunk of 5 dpf wild type sibling (c), mir-204–1-/- mutant (d), MO2-injected mir-204–1-/- mutant (e), MO3-injected mir-204–1-/- mutant (f), and MO2 + MO3 co-injected mir-204–1-/- mutant (g) animals. Images are lateral views of Tg(mrc1a:eGFP)y251, Tg(kdrl:mCherry)y171 double-transgenic animals, rostral to the left. The thoracic duct is labeled with white arrows, and absence of the thoracic duct is noted with asterisks. (h) Quantification of thoracic duct formation in five dpf wild type (n = 6), mir-204–1-/- mutant (n = 9), MO2-injected mir-204–1-/- mutant (n = 23), MO2-injected mir-204–1-/- mutant (n = 19), and MO2 + MO3 co-injected mir-204–1-/- mutant animals (n = 25). The number of somitic segments with an intact thoracic duct was counted, with the same seven mid-trunk somites measured in each animal. Scale bar: 100 μm (c). All graphs are analyzed by t-test and the mean ± SD is shown.
-
Figure 3—source data 1
Numerical data for Figure 3 and Figure 3—figure supplement 1 and Figure 3—figure supplement 2.
- https://doi.org/10.7554/eLife.46007.015
Figure 3—figure supplement 1
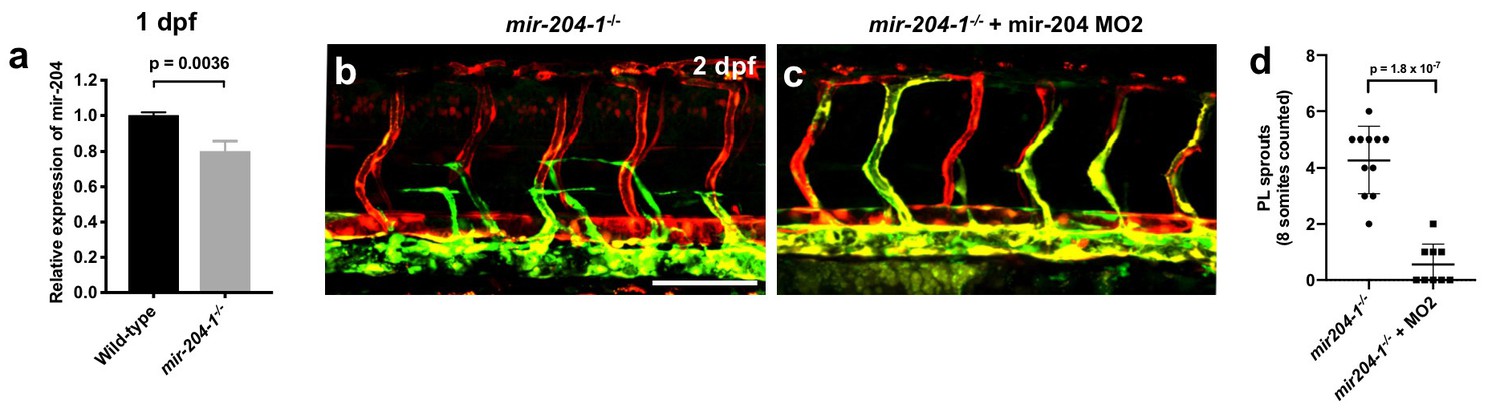
Lymphatic differentiation defects in mir-204-deficient animals.
(a) Quantitative TaqMan RT-PCR measurement of the relative levels of mature mir-204 in one dpf mir-204–1-/- mutants and wildtype siblings, normalized to wild type levels. (b,c) Confocal images of 2 dpf Tg(mrc1a:eGFP)y251, Tg(kdrl:mCherry)y171 mir-204–1-/- mutant (c) or MO2-injected mir-204–1-/- mutant (d) animals. (d) Quantitation of the number of PL sprouts in animals as in panels b and c. Scale bar: 100 μm (b). All graphs are analyzed by t-test and the mean ± SD is shown.
Figure 3—figure supplement 2
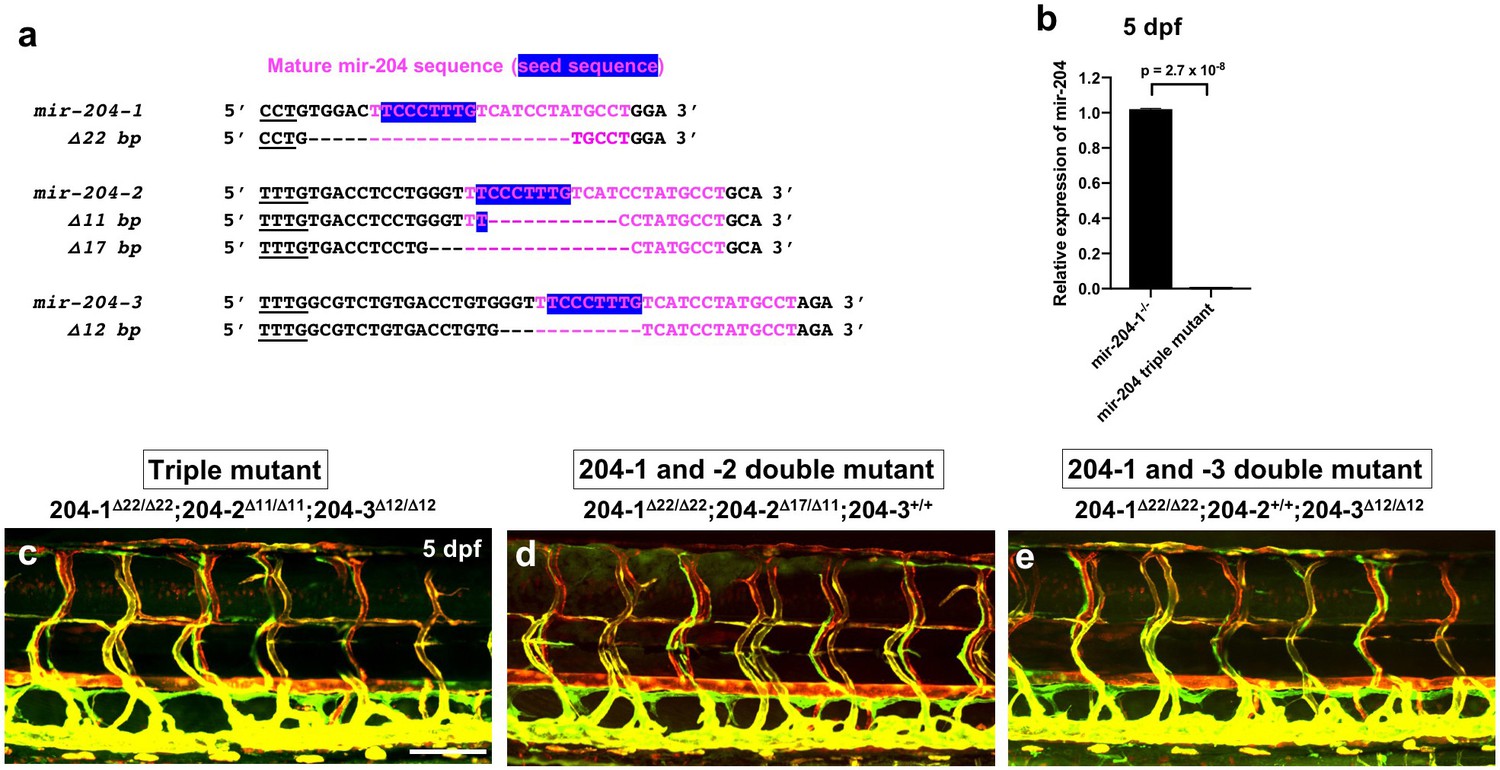
MicroRNA 204 mutants.
(a) Sequence alignment of mir-204–1, −2, and −3 wildtype and deletion mutant. The mature mir-204 sequence are noted with magenta lettering and the seed sequence is highlighted in blue. (b) Quantitative TaqMan RT-PCR measurement of the relative levels of mature mir-204 in five dpf mir-204 triple mutants and their mir-204–1-/- siblings, normalized to mir-204–1-/- mutants. Three biological replicates were analyzed. (c–e) Confocal image of 5 dpf Tg(mrc1a:eGFP)y251, Tg(kdrl:mCherry)y171 mir-204 triple mutant (c), mir-204–1 and −2 double mutant (d), and mir-204–1 and −3 double mutant (e) animals. All images are lateral views, rostral to the left. Scale bar: 100 μm (c). All graphs are analyzed by t-test and the mean ± SD is shown.
Figure 4 with 1 supplement
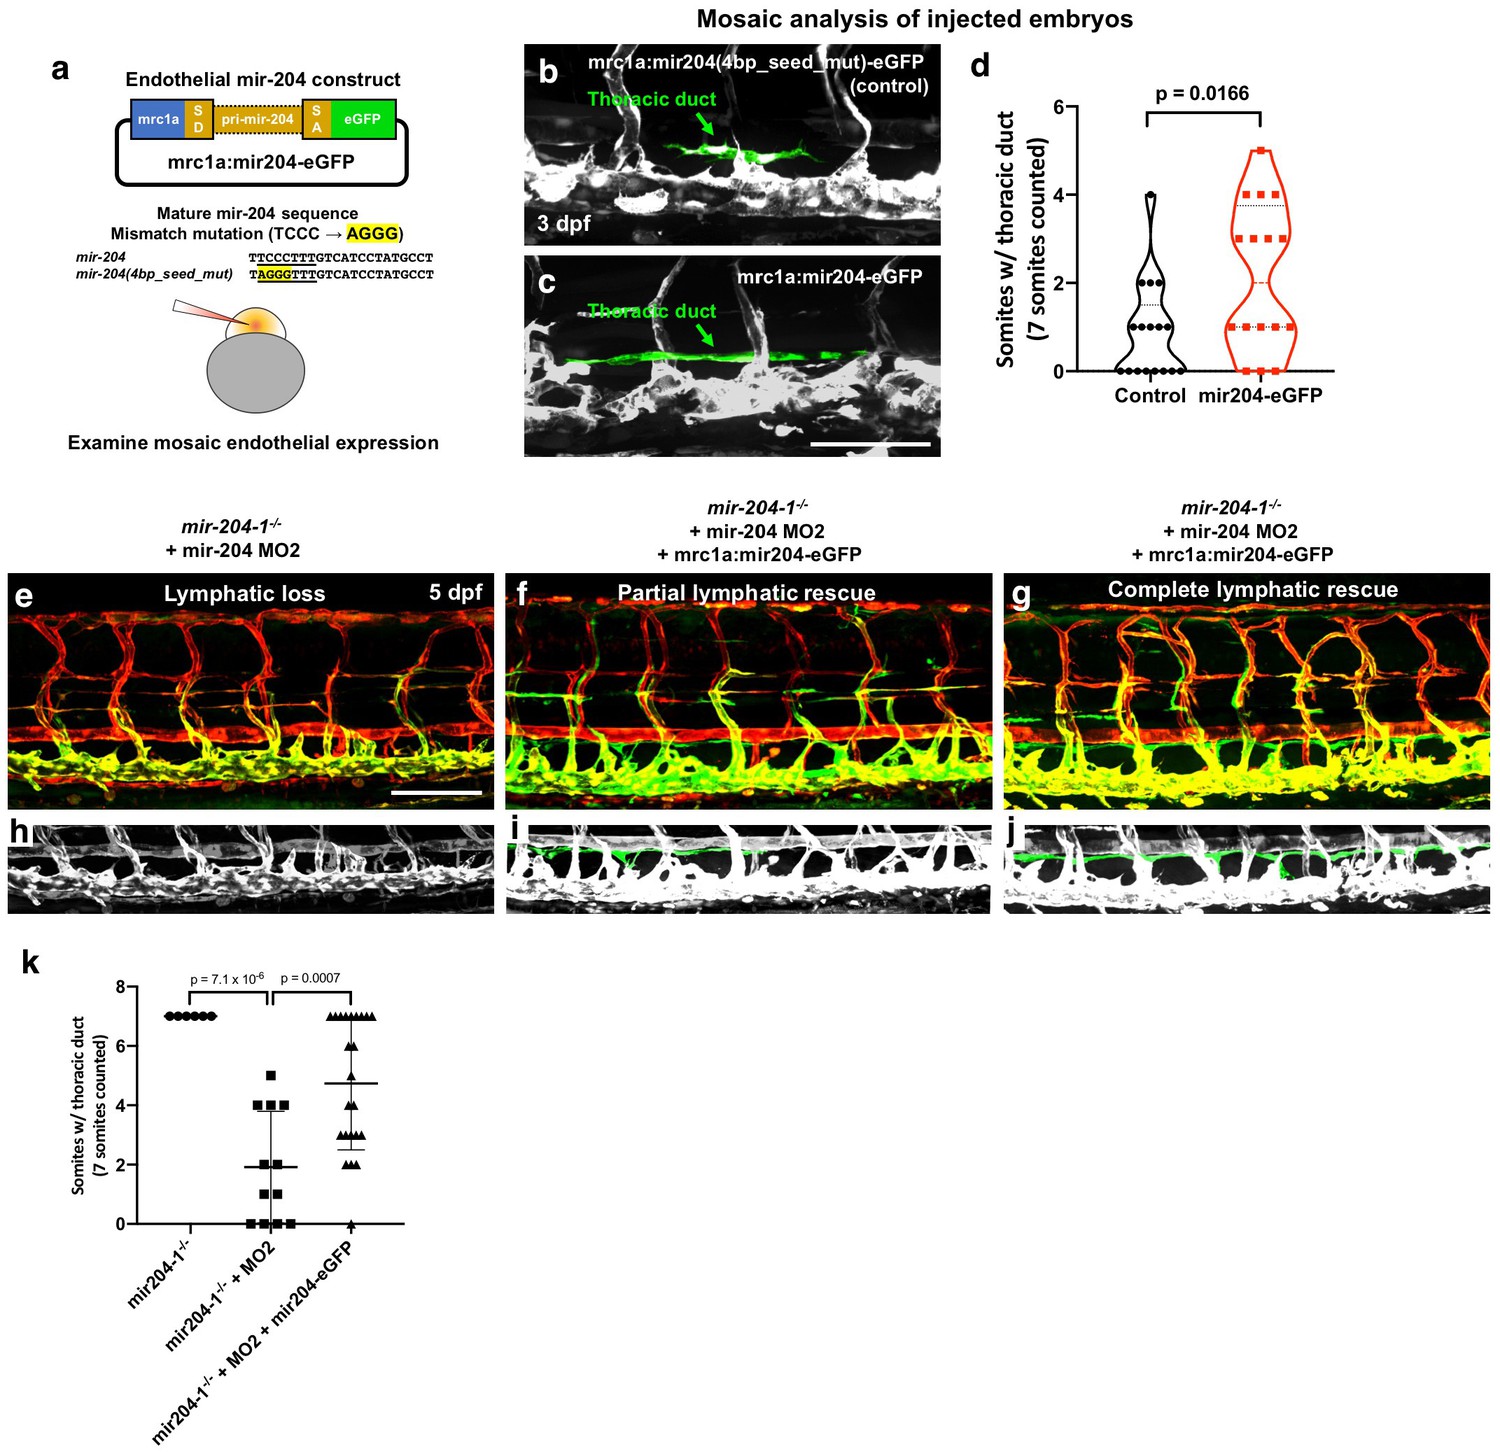
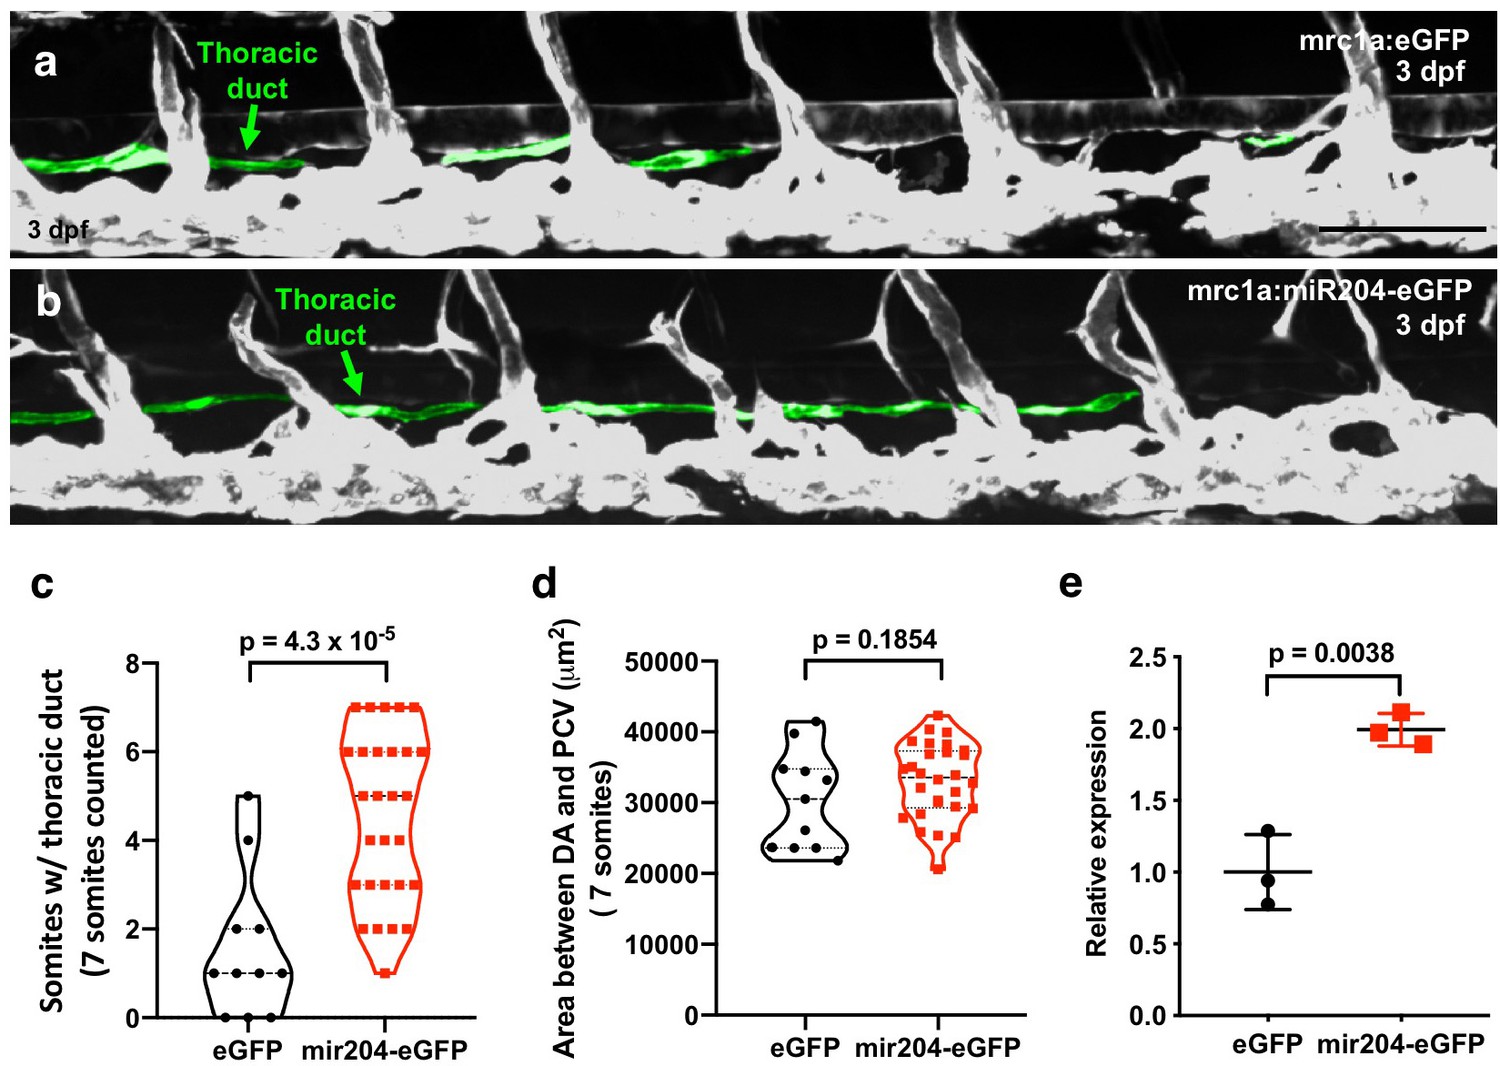
Endothelial expression of mir-204 drives precocious lymphatic development and rescues the loss-of-lymphatic phenotype in mir-204-deficient animals.
(a) Schematic illustration of the mir-204 expression construct. The EGFP expression cassette is driven by the mrc1a promoter (Jung et al., 2017), with ~1 kb of dre-miR-204–1 genomic sequence from the fifth intron of the trpm3 gene cloned between splice donor (SD) and splice acceptor (SA) sequences and flanking exonic sequences from the ef1a gene. The original vector backbone was previously described (Nicoli et al., 2010). As a control, a 4 bp mismatch mutation was introduced in the seed (underline) sequence of mature mir-204 sequence. The construct was injected into 1 cell stage embryos to examine the mosaic endothelial expression. (b,c) Representative confocal images of mid-trunk of 3 dpf embryos injected with (b) control mrc1a:mir204(4 bp_seed_mut)-eGFP DNA or (c) mrc1a:mir204-eGFP DNA. The thoracic duct is pseudocolored in green, with other vessels in gray. (d) Quantification of thoracic duct formation in animals injected with either mrc1a:eGFP control or mrc1a:mir204-eGFP DNA. (e–g) Confocal images of Tg(mrc1a:eGFP)y251, Tg(kdrl:mCherry)y171 double-transgenic MO2-injected mir-204–1-/- mutant animals without (e) or with (f,g) co-injected mrc1a:mir204-eGFP DNA. (h–j) Cropped portions of the corresponding images in e-g, with the thoracic duct pseudocolored in green and other nearby vessels in gray. (k) Quantification of thoracic duct formation in animals as in panels e-g. The number of somitic segments with an intact thoracic duct was counted, with the same seven mid-trunk somites measured in each animal. Scale bar: 100 μm (c,e). All graphs are analyzed by t-test and the mean ± SD is shown.
-
Figure 4—source data 1
Numerical data for Figure 4 and Figure 4—figure supplement 1.
- https://doi.org/10.7554/eLife.46007.018
Figure 4—figure supplement 1
Germline endothelial expression of mir-204 drives precocious lymphatic development.
(a,b) Representative confocal images of mid-trunk of 3 dpf of (a) Tg(mrc1a:eGFP) or (b) Tg(mrc1a:mir204-eGFP). The thoracic duct is pseudocolored in green, with other vessels in gray. (c) Quantification of thoracic duct formation in animals as in panels a and b. The number of somitic segments with an intact thoracic duct was counted, with the same seven mid-trunk somites measured in each animal. (d) Quantification of the area between the dorsal aorta (DA) and posterior cardinal vein (PCV) in animals as in panels a and b, as an indicator of developmental timing. (e) Quantitation of mir-204 level measured by TaqMan qPCR from whole embryo at three dpf. All graphs are analyzed by t-test and the mean ± SD is shown.
Figure 5
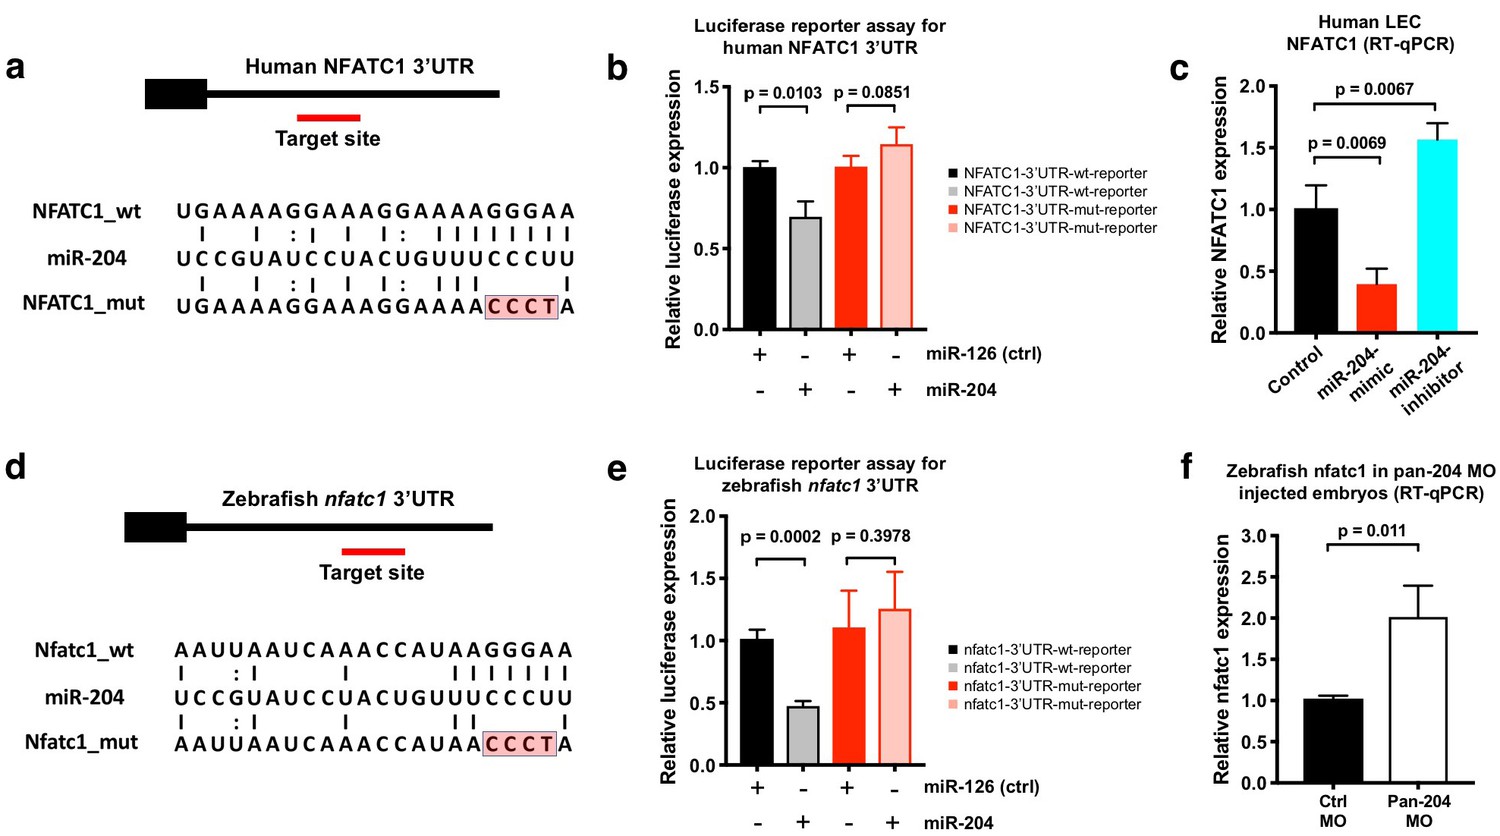
NFATC1 is a conserved target of miR-204.
(a) Sequence alignment of mature miR-204 (middle line) and its target region in the human NFATC1 3’UTR (top line). A mutant form of the human NFATC1 3’UTR used for the luciferase assay in panel b is also shown (bottom line; four mismatches in the seed binding region are highlighted in red). (b) Quantitative luciferase reporter assay using wild type or mutant forms of the human NFATC1 3’UTR transfected into HEK293 cells together with either miR-204 or miR-126 (control). Four biological replicates were analyzed. (c) Quantitative TaqMan RT-PCR measurement of relative endogenous NFATC1 transcript levels in human LEC (HMVEC-dLy) transfected with miR-204-mimic or miR-204-antagomir, normalized to control mock transfected levels. (d) Sequence alignment of mature miR-204 (middle line) and its target region in the zebrafish nfatc1 3’UTR (top line). A mutant form of the zebrafish nfatc1 3’UTR used for the luciferase assay in panel e is also shown (bottom line; four mismatches in the seed binding region are highlighted in red). (e) Quantitative luciferase reporter assay using wildtype or mutant forms of the zebrafish nfatc1 3’UTR co-transfected into HEK293 cells together with either miR-204 or miR-126 (control). Four biological replicates were analyzed. (f) Quantitative TaqMan RT-PCR measurement of relative endogenous zebrafish nfatc1 transcript levels in five dpf animals that were injected with either control MO or pan-204 MO. Three biological replicates were analyzed. All graphs are analyzed by t-test and the mean ± SD is shown.
-
Figure 5—source data 1
Numerical data for Figure 5.
- https://doi.org/10.7554/eLife.46007.020
Figure 6 with 1 supplement
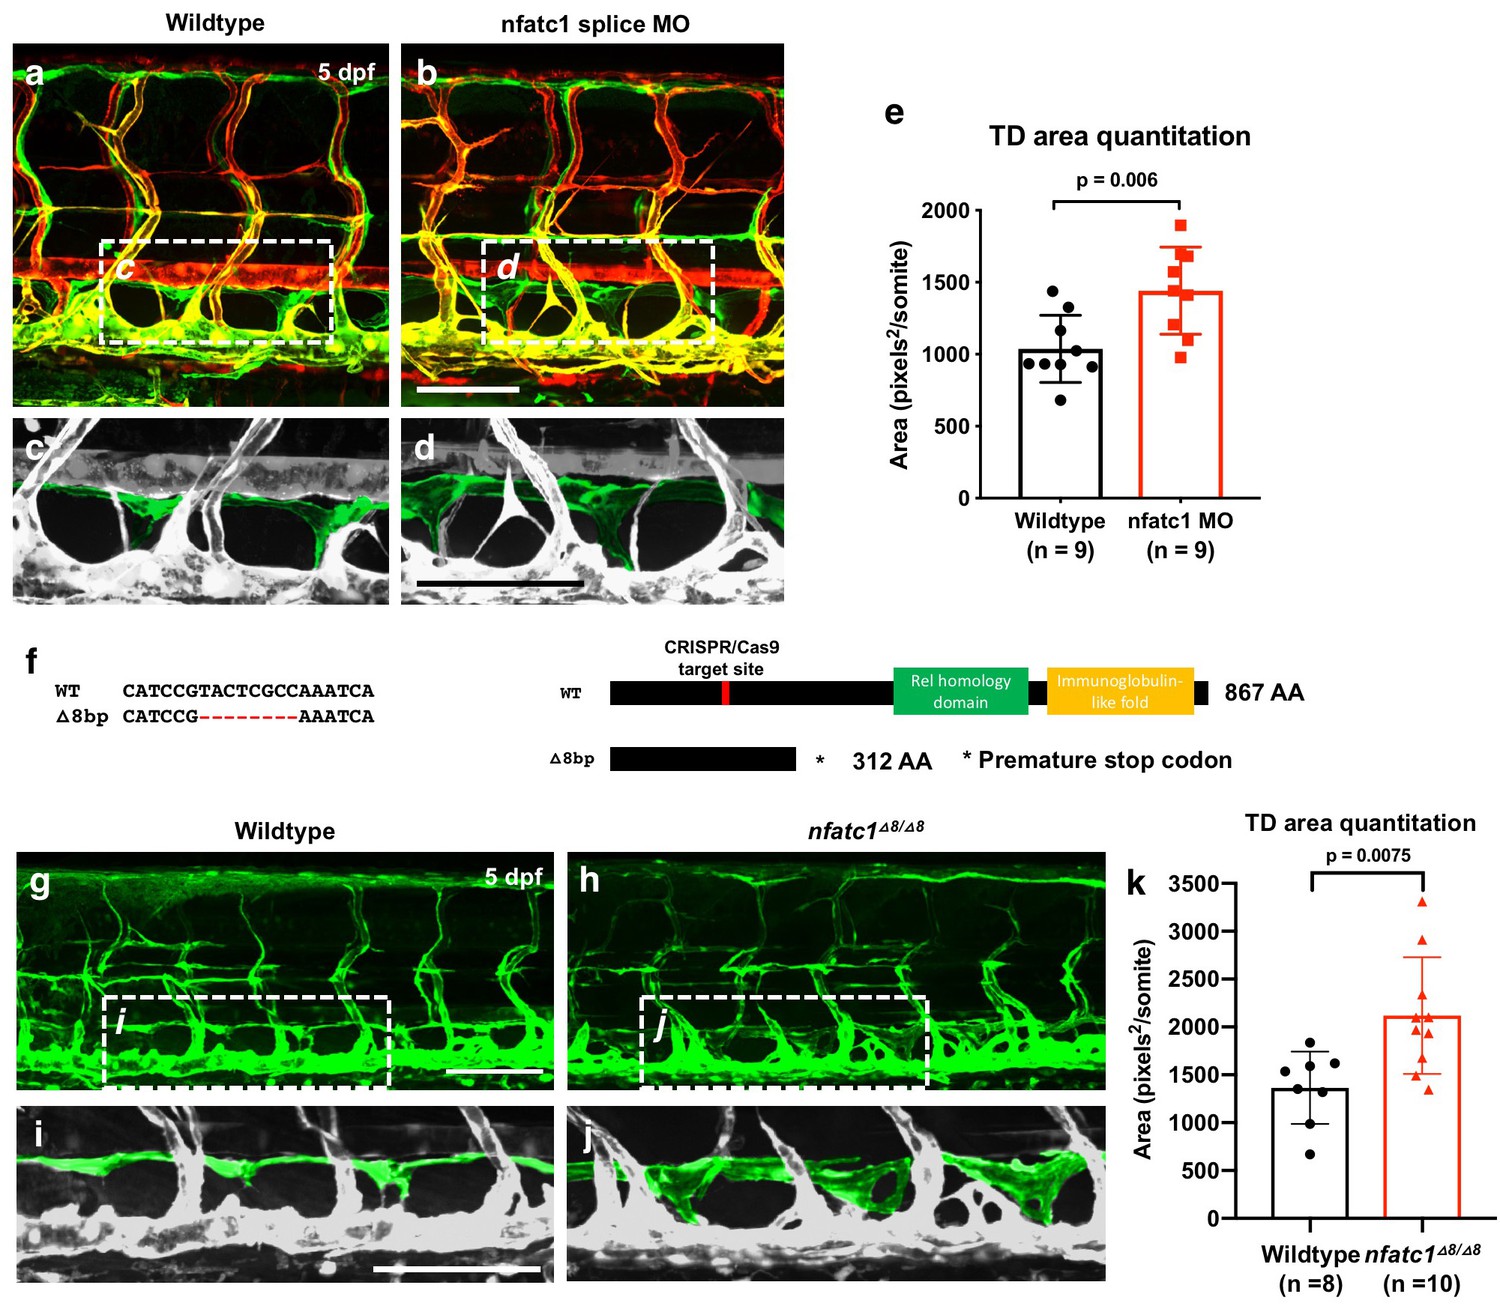
Suppression of Nfatc1 promotes enlargement of the thoracic duct.
(a,b) Confocal images of the mid-trunk of 5 dpf Tg(mrc1a:eGFP)y251, Tg(kdrl:mCherry)y171 double-transgenic control MO (a) or nfatc1 splice MO (b) injected animals. The dashed boxes in panels a and b show the areas magnified in panels c and d, respectively. (c,d) Magnified images from panels a and b, with the thoracic duct pseudocolored in green and other vessels in gray. (e) Quantitation of thoracic duct size measured as the area encompassed by the thoracic duct in confocal images of the same seven mid-trunk somitic segments in five dpf wildtype (n = 9) and nfatc1 MO-injected (n = 9) animals. (f) Sequence alignment of wildtype and nfatc1△8/△8 mutant genomic DNA. Schematic of nfatc1 protein domains, CRISPR target site, and truncated mutant nfatc1 polypeptides. (g,h) Confocal images of the mid-trunk of 5 dpf Tg(mrc1a:eGFP)y251 wildtype (g) or nfatc1△8/△8 mutant (h) animals. (i,j) Magnified images from panels g and h, with the thoracic duct pseudocolored in green and other vessels in gray. (k) Quantitation of thoracic duct size measured as the area encompassed by the thoracic duct in confocal images of the same seven mid-trunk somitic segments in five dpf wildtype (n = 8) and nfatc1△8/△8 mutant (n = 10) animals. Rostral is to the left in all images. Scale bar = 100 μm (b,d,g,i). All graphs are analyzed by t-test and the mean ± SD is shown.
-
Figure 6—source data 1
Numerical data for Figure 6 and Figure 6—figure supplement 1.
- https://doi.org/10.7554/eLife.46007.023
Figure 6—figure supplement 1
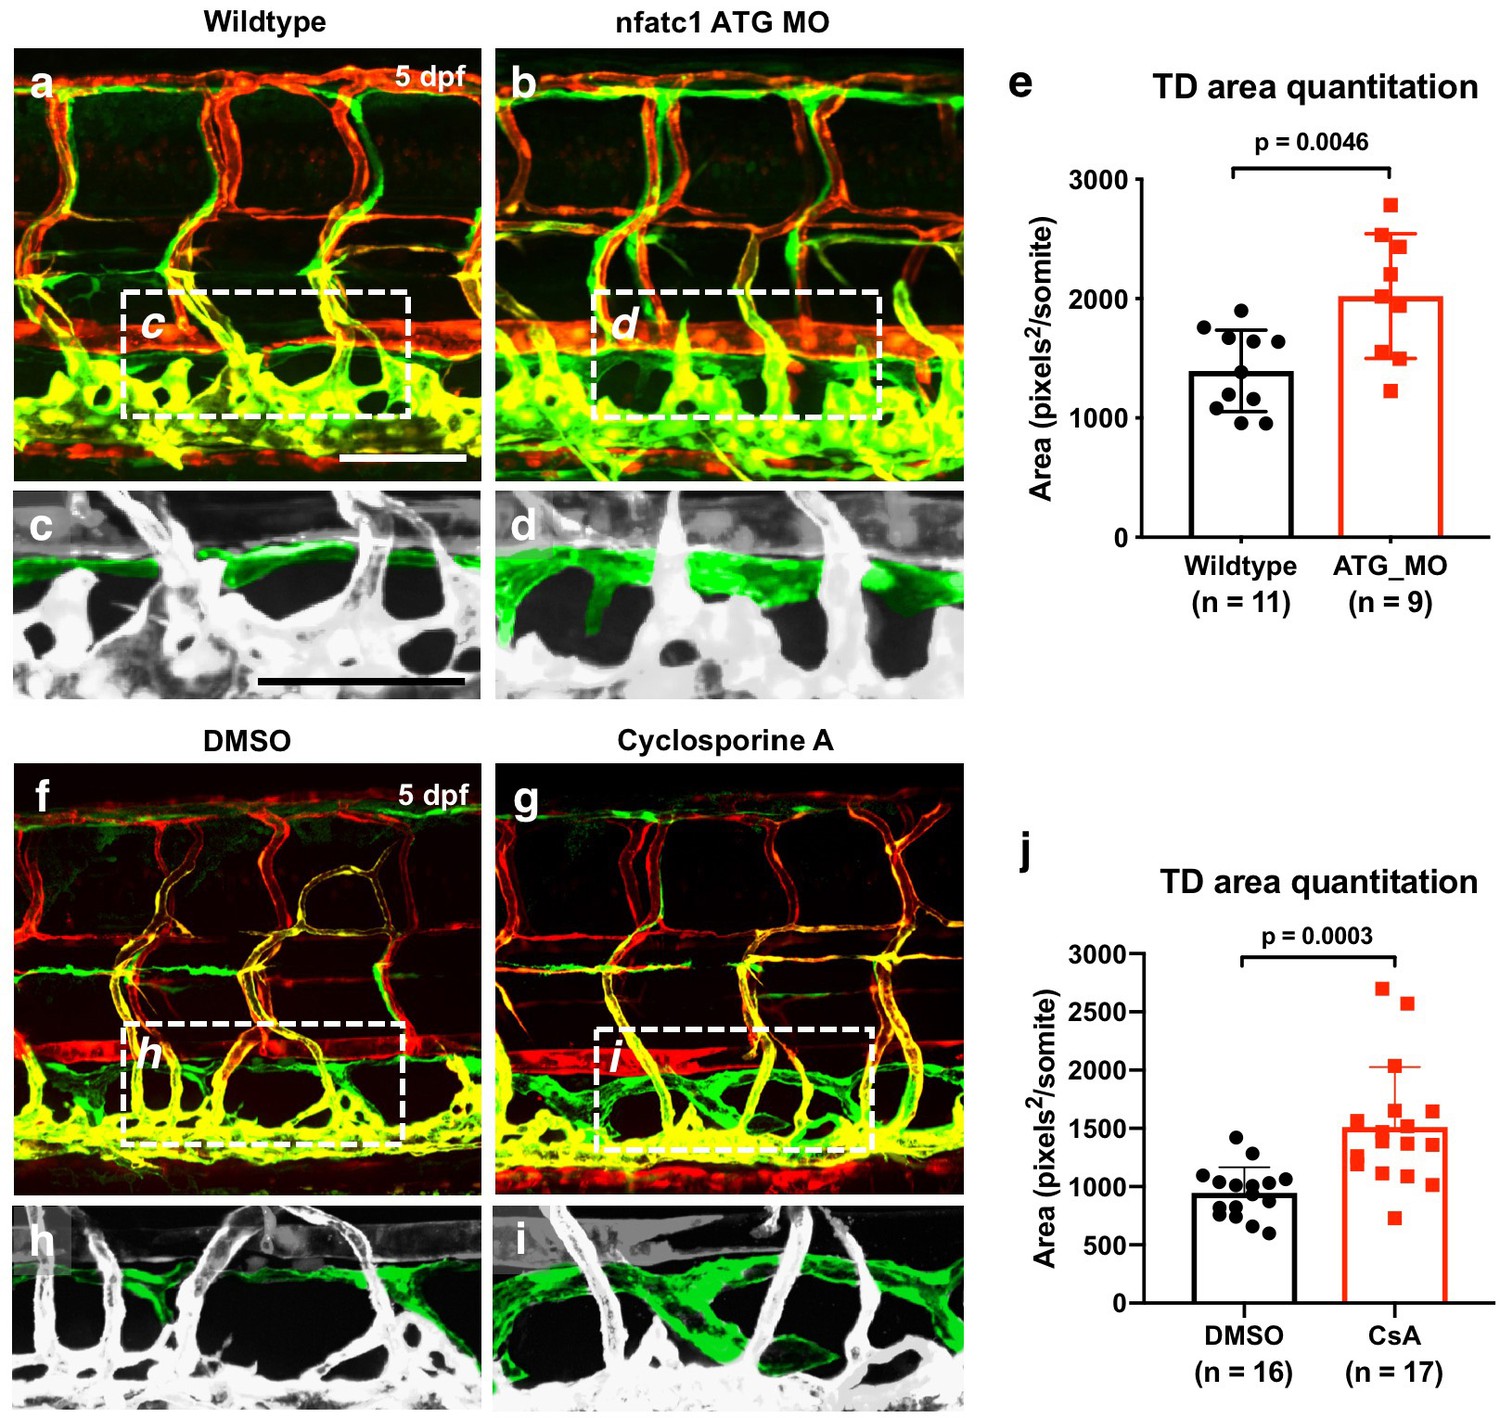
Suppressing nfatc1 promotes thoracic duct enlargement.
(a,b) Confocal images of the mid-trunk of 5 dpf Tg(mrc1a:eGFP)y251, Tg(kdrl:mCherry)y171 control (a) and nfatc1 ATG MO-injected (b) animals. The dashed boxes in panels a and b show the areas magnified in panels c and d, respectively. (c,d) Magnified images from panels a and b, with the thoracic duct pseudocolored in green and other vessels in gray. (e) Quantitation of thoracic duct size measured as the area encompassed by the thoracic duct in confocal images of the same seven mid-trunk somitic segments in five dpf wildtype (n = 11) and nfatc1 MO-injected (n = 9) animals. (f,g) Confocal images of the mid-trunk of 5 dpf DMSO (f) and cyclosporine A (g) treated animals. The dashed boxes in panels f and g show the areas magnified in panels h and i, respectively. (h,i) Magnified images from panels f and g, with the thoracic duct pseudocolored in green and other vessels in gray. (j) Quantitation of thoracic duct size measured as the area encompassed by the thoracic duct in confocal images of 7 somitic segments from five dpf DMSO (n = 16) and cyclosporine A (n = 17) treated animals. All images are lateral views, rostral to the left. Scale bar: 100 μm (a,c). All graphs are analyzed by t-test and the mean ± SD is shown.
Figure 7

Suppression of nfatc1 rescues the lymphatic defects in mir-204-deficient animals.
(a–c) Confocal images of the mid-trunk of 5 dpf control (a) pan-204 MO-injected (b) or pan-204 MO and nfatc1 splice MO co-injected (c) animals. White dotted boxes in panels a-c show areas magnified in panels d-f, respectively, while white dashed boxes show areas magnified in panels g-i, respectively. (d–f) Magnified images from panels a-c with the thoracic duct (TD) pseudocolored in green and other vessels in gray. The TD is labeled, and the absence of the TD is noted with asterisks. (g–i) Magnified images from panels a-c with the dorsal longitudinal lymphatic vessel (DLLV) pseudocolored in green and other vessels in gray. The DLLV is labeled, and the absence of the DLLV is noted with asterisks. (j) Quantification of thoracic duct (TD) formation in five dpf control (n = 8), pan-204 MO-injected (n = 19), or pan-204 MO and nfatc1 splice MO co-injected animals (n = 21). A total of 7 mid-trunk somitic segments were scored in each animal for the presence or absence of an intact TD. (k) Quantification of dorsal longitudinal lymphatic vessel (DLLV) formation in five dpf control (n = 8), pan-204 MO-injected (n = 19), or pan-204 MO and nfatc1 splice MO co-injected animals (n = 21). A total of 7 mid-trunk somitic segments were scored in each animal for the presence or absence of an intact DLLV. (l) Schematic diagrams illustrating five dpf zebrafish trunk lymphatic vessels present in (i) normal control, (ii) mir-204 deficient, (iii) nfatc1-deficient, and (iv) mir-204- and nfatc1-deficient animals. Suppression of mir-204 leads to loss of lymphatic vessels (ii), while nfatc1 deficiency causes lymphatic (thoracic duct) hyperplasia (iii). The lymphatic defects in mir-204 deficient animals can be rescued by simultaneous suppression of nfatc1 (iv). All images are lateral views of Tg(mrc1a:eGFP)y251, Tg(kdrl:mCherry)y171 double-transgenic animals, rostral to the left. Scale bar = 100 μm (c,i). All graphs are analyzed by t-test and the mean ± SD is shown.
-
Figure 7—source data 1
Numerical data for Figure 7.
- https://doi.org/10.7554/eLife.46007.025
Tables
Key resources table
| Reagent type (species) or resource | Designation | Source or reference | Identifiers | Additional information |
|---|---|---|---|---|
| Genetic reagent (D. rerio) | Tg(mrc1a:eGFPy251; kdrl:mCherryy171) | PMID: 28506987 | ZFIN ID: ZDB-TGCONSTRCT-170717–2 | |
| Genetic reagent (D. rerio) | Tg(mrc1a:eGFPy251) | PMID: 28506987 | ZFIN ID: ZDB-TGCONSTRCT-170717–2 | |
| Genetic reagent (D. rerio) | Tg(mrc1a:mir204-eGFP) | This paper | ||
| Genetic reagent (D. rerio) | mir-204–1-/-; mir-204–2-/-; mir-204–3-/- | This paper | ||
| Genetic reagent (D. rerio) | nfatc1△8/△8 | This paper | ||
| Cell line (H. sapiens) | HMVEC-dLy | Lonza | Cat# CC-2812 | |
| Cell line (H. sapiens) | HUVEC | GIBCO | Cat# C-003–5C | |
| Cell line (H. sapiens) | HEK293 | ATCC | Cat# CRL-1573 RRID:CVCL_0045 | |
| Recombinant DNA | pME-mir204 | This paper | Used pME-miR for backbone vector (PMID: 2914488) | |
| Recombinant DNA | mrc1a:mir204-eGFP | This paper | ||
| Recombinant DNA | mrc1a:mir204(4 bp_seed_mut)-eGFP | This paper | ||
| Recombinant DNA | psiCheck2- hNFATC1-3’UTR | This paper | Used for luciferase assay | |
| Recombinant DNA | psiCheck2-hNFATC1-3’UTR_4 bp_mut | This paper | Used for luciferase assay | |
| Recombinant DNA | psiCheck2-zNFATC1-3’UTR | This paper | Used for luciferase assay | |
| Recombinant DNA | psiCheck2-zNFATC1-3’UTR_4 bp_mut | This paper | Used for luciferase assay | |
| Sequence-based reagent | Cloning primers | This paper | See Supplementary file 2a for sequence information | |
| Sequence-based reagent | Morpholinos | This paper | See Supplementary file 2b for sequence information | |
| Sequence-based reagent | gRNAs | This paper | See Supplementary file 2c for sequence information | |
| Sequence-based reagent | hsa-miR-204–5 p mimic | Thermo Fisher Scientific | Cat# MC11116 | |
| Sequence-based reagent | hsa-miR-204–5 p inhibitor | Thermo Fisher Scientific | Cat# MH11116 | |
| Sequence-based reagent | hsa-miR-126–3 p mimic | Thermo Fisher Scientific | Cat# MC12841 | |
| Chemical compound, drug | Cyclosporine A | Sigma-Aldrich | Cat# PHR1092 | |
| Septide, recombinant protein | EnGen Lba Cas12a (Cpf1) | New England Biolabs | Cat# M0653T | |
| Software, algorithm | ImageJ | ImageJ (http://imagej.nih.gov/ij/) | RRID:SCR_003070 | |
| Software, algorithm | Imaris | Bitplane | RRID:SCR_007370 | |
| Software, algorithm | Adobe Photoshop | Adobe | RRID:SCR_014199 | |
| Software, algorithm | NIS-Elements | Nikon | RRID:SCR_014329 | |
| Software, algorithm | GraphPad Prism | GraphPad Prism (https://graphpad.com) | RRID:SCR_015807 |
Additional files
-
Supplementary file 1
List of lymphatic genes analyzed as putative miR-204 targets in both human and zebrafish.
- https://doi.org/10.7554/eLife.46007.026
-
Supplementary file 2
List of sequence information for the primers, morpholinos, and oligonucleotides used for CRISPR genome editing.
- https://doi.org/10.7554/eLife.46007.027
-
Transparent reporting form
- https://doi.org/10.7554/eLife.46007.028
Download links
A two-part list of links to download the article, or parts of the article, in various formats.
Downloads (link to download the article as PDF)
Open citations (links to open the citations from this article in various online reference manager services)
Cite this article (links to download the citations from this article in formats compatible with various reference manager tools)
MicroRNA-mediated control of developmental lymphangiogenesis
eLife 8:e46007.
https://doi.org/10.7554/eLife.46007


