Circulating T cell-monocyte complexes are markers of immune perturbations
- La Jolla Institute for Immunology, United States
- University of Colombo, Sri Lanka
- North Colombo Teaching Hospital, Sri Lanka
- National Institute of Infectious Diseases, Sri Lanka
- National Tuberculosis Reference Laboratory, Sri Lanka
- National Hospital for Respiratory Diseases, Sri Lanka
- Genetech Research Institute, Sri Lanka
- Johns Hopkins School of Public Health, United States
- Universidad Peruana Cayetano Heredia, Peru
- Tohoku University Graduate School of Medicine, Japan
- University of California, San Diego, United States
Figures
Figure 1 with 2 supplements

Two cell populations expressing both T cell (CD3) and monocyte (CD14) surface markers exist in the live singlet cell population of PBMC from human subjects.
(A) The top 100 most variable genes in memory CD4+ T cells across TB uninfected (TBneg) and LTBI infected subjects. (B) Immune cell type specific expression of the 22-var genes identified in A). Every bar consists of stacked sub-bars showing the TPM normalized expression of every gene in corresponding cell type. Expression of genes for the blood cell types shown were taken from the DICE database (Schmiedel et al., 2018, http://dice-database.org/). (C) Detection of CD14+ events within sorted CD4+ memory T cells and (D) non-parametric spearman correlation between their frequency and the PC1 from the 22-var genes. (E) Gated on ‘singlet total live cells’, two populations of CD3+CD14+ cells can be identified based on the level of expression of CD14. (F) Based on FSC and SSC parameters, CD3+CD14hi cells are contained within the monocyte gate, whereas CD3+CD14mid cells are contained within the lymphocyte gate. Data were derived from 30 LTBI subjects and 29 TB uninfected control subjects.
-
Figure 1—source data 1
Non-parametric spearman correlation between the 22-var genes in memory CD4+ T cells from human subjects.
Memory CD4+ T cells were sorted from 30 LTBI subjects and 29 TB uninfected control subjects (gating strategy Figure 1—figure supplement 1A) and their transcriptomic profile defined by RNA sequencing. The 22-var genes were identified as presented in Figure 1A.
- https://doi.org/10.7554/eLife.46045.005
Figure 1—figure supplement 1
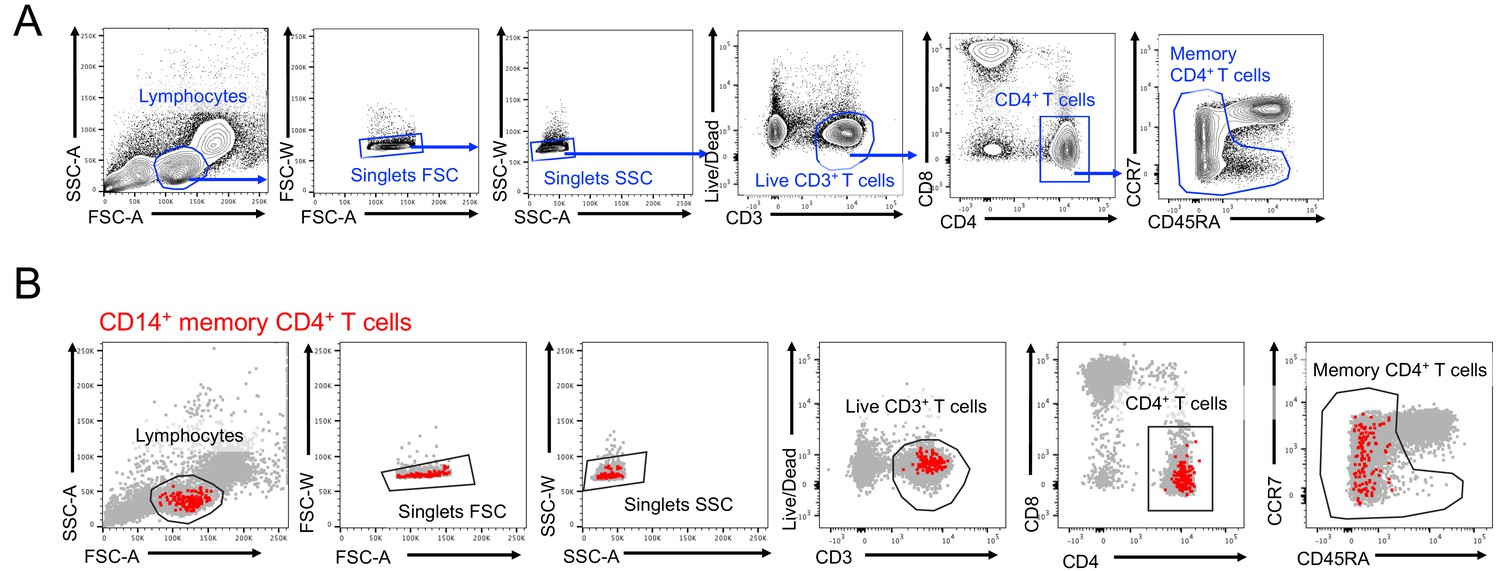
Identification of a CD14 +population within memory CD4 T cells.
(A) Gating strategy to isolate bulk memory CD4+ T cells. (B) Backgating of CD14+ cells within sorted memory CD4+ T cells.
Figure 1—figure supplement 2
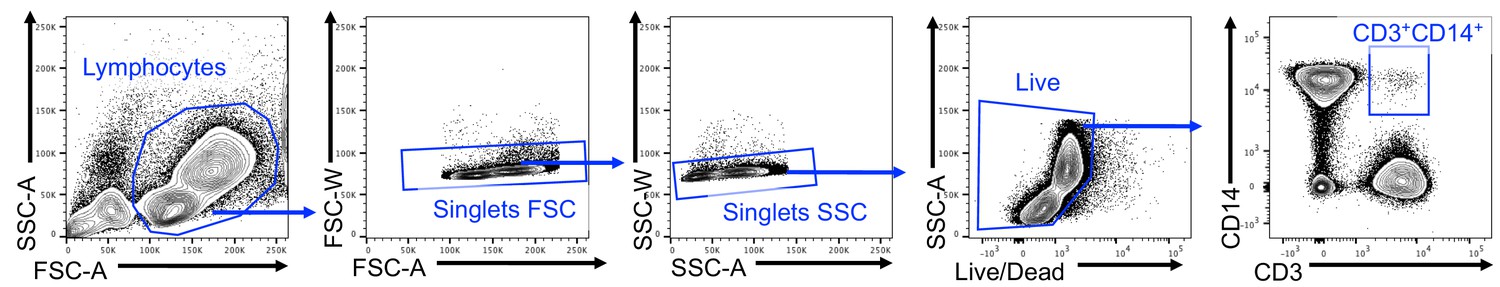
Gating strategy to identify CD3+CD14+ cells.
https://doi.org/10.7554/eLife.46045.004
Figure 2 with 3 supplements
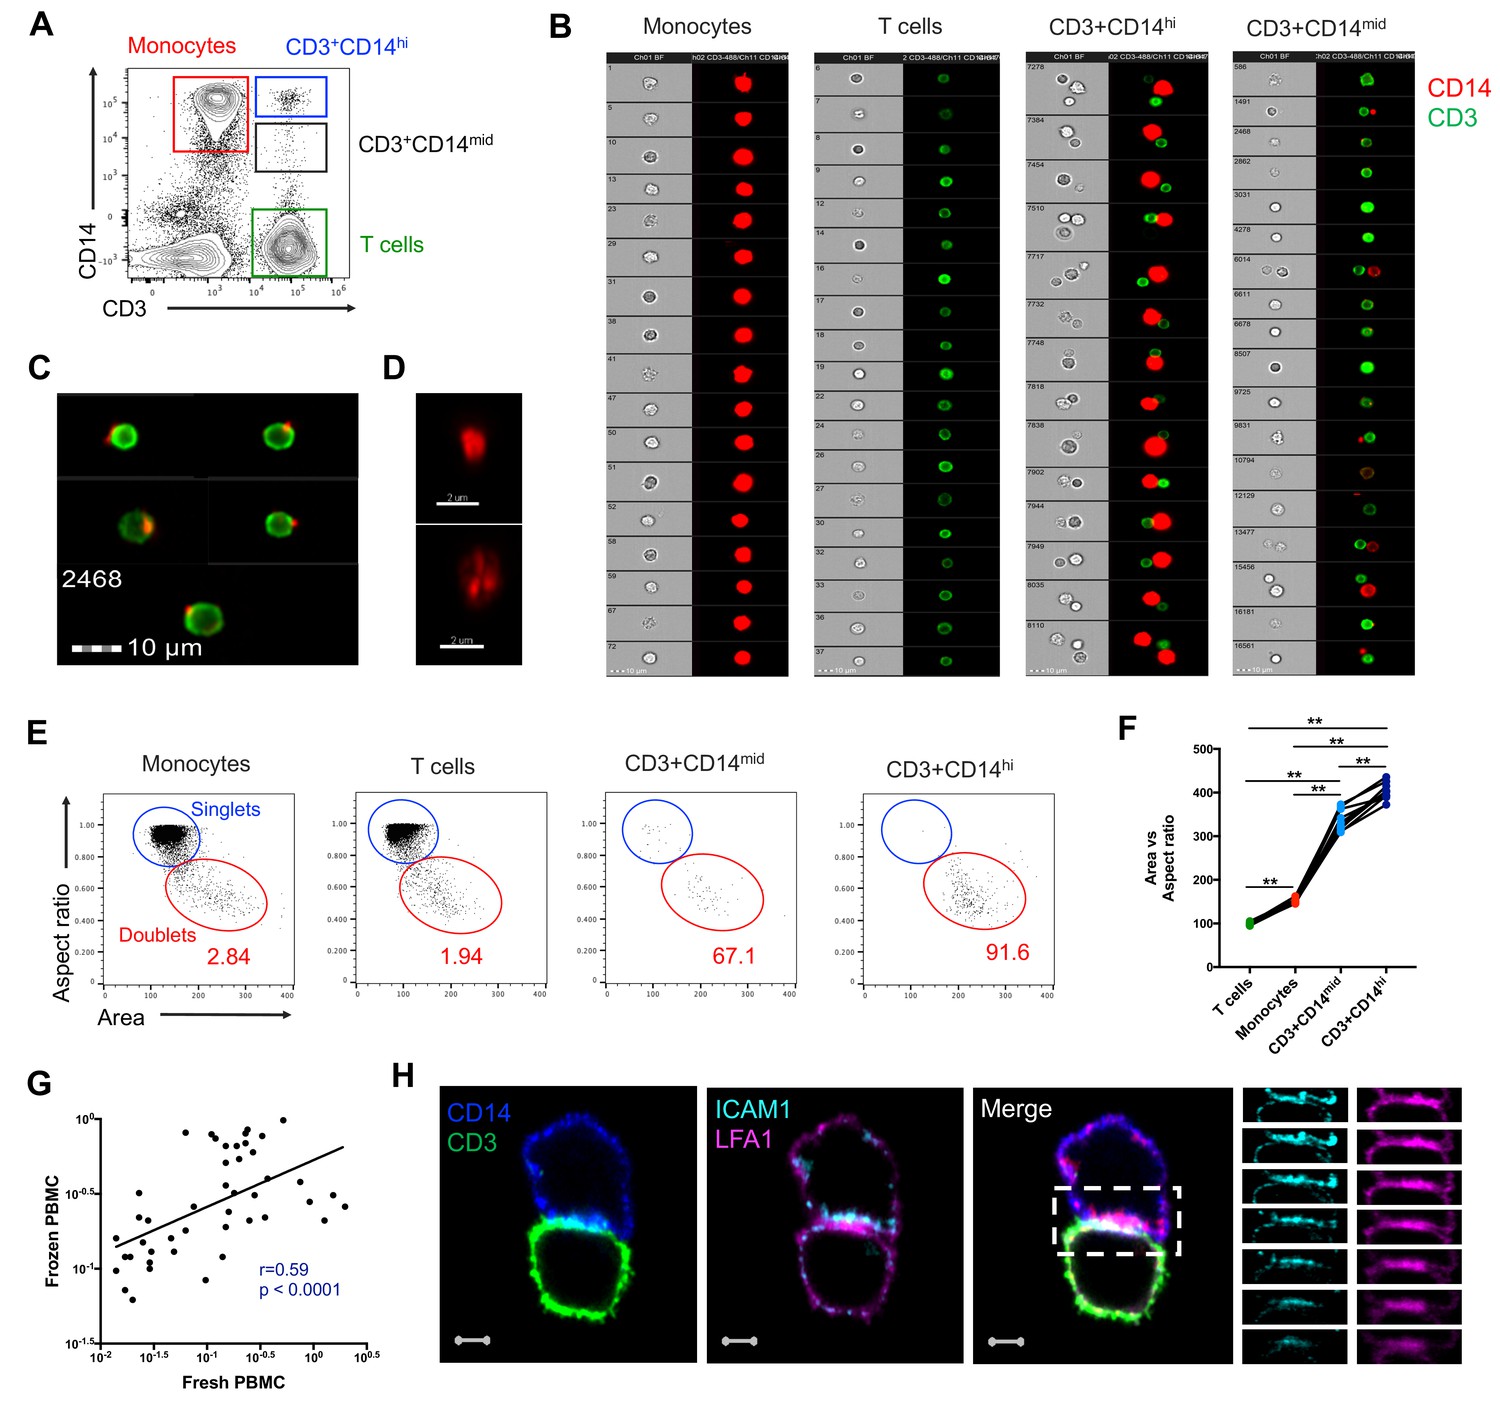
CD3+CD14+ cells are tightly bound T cell:monocyte complexes that represent in vivo association.
(A) Gating strategy and (B) random gallery of events for monocytes (CD14+CD3), T cells (CD3+CD14-), CD3+CD14hi cells and CD3+CD14mid cells determined by imaging flow cytometry (ImageStreamX, MkII Amnis Amnis). CD14+ cell debris were identified within CD3+CD14mid cells (C) by imaging flow cytometry and (D) confocal microscopy after bulk population cell sorting. (E) Plots and (F) Ratio of Aspect ratio vs Area of the brightfield parameter for monocytes (CD14+CD3-), T cells (CD3+CD14-), CD3+CD14hi cells and CD3+ CD14 mid cells, determined by imaging flow cytometry. (G) Non-parametric Spearman correlation of the frequency of T cell:monocyte complexes in paired fresh PBMC vs cryopreserved PBMC derived from 45 blood draws of healthy subjects. T cell:monocyte complexes were defined as the CD3+CD14+ cell population gated from live singlets as represented in Figure 1—figure supplement 2. (H) Single z-plan (0 μm) images (left) and z-plane stacks (right) of the region marked (dashed rectangle) from one sorted CD3+ CD14+ T cell:monocyte complex displaying accumulation of LFA1 and ICAM1 at the interface. Images show expression of CD14 (blue), CD3 (green), ICAM1(Cyan), and LFA1 (Magenta). Relative z-positions are indicated on the right, and scale bars represent 2 μm. Imaging flow cytometry data was derived from 10 subjects across three independent experiments and microscopy data was representative of the analysis of n = 105 CD3+CD14+ complexes isolated from three subjects across three independent experiments.
Figure 2—figure supplement 1

Technical variations in sample preparation do not impact the frequency of T cell:monocyte complexes.
(A) Non-parametric spearman correlation between T cell:monocyte complexes frequencies in whole blood versus fresh PBMC. Red blood cells were magnetically depleted from fresh whole blood using the EasySep RBC depletion kit (STEMCELL technologies) according to the manufacturer’s instructions. (B) Comparison of T cell:monocyte complexes frequencies in fresh and frozen PBMC isolated from blood samples collected in heparin or EDTA. (C) Non-parametric spearman correlation of T cell:monocyte complexes frequency over time in fresh and frozen PBMC samples isolated from longitudinal blood draws collected one week apart. (D) Effect of Fc-receptor blocking on the frequency of T cell:monocyte complexes in frozen PBMC. Data derived from n = 10 (A–B), n = 5 (C) and n = 4 (D) independent healthy individuals. T cell:monocyte complexes were defined as the CD3+CD14+ cell population gated from live singlets as represented in Figure 1—figure supplement 2.
Figure 2—figure supplement 2
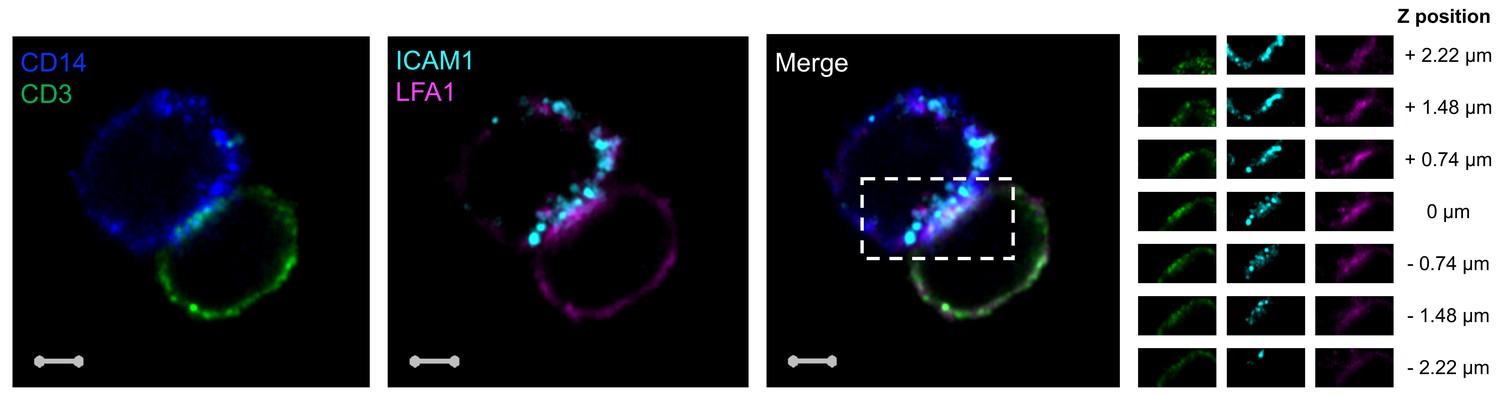
Accumulation of CD3, LFA1 and ICAM1 at the interface of a T cell:monocyte complex.
Single z-plan (0μm) images (left) and z-plane stacks (right) of the region marked (dashed rectangle) from one sorted CD3+CD14+ Tcell:monocyte complex displaying accumulation of LFA1 and ICAM1 at the interface. Images show expression of CD14 (blue), CD3 (green), ICAM1(Cyan), and LFA1 (Magenta). Relative z-positions are indicated on the right, and scale bars represent 2 μm.
Figure 2—figure supplement 3
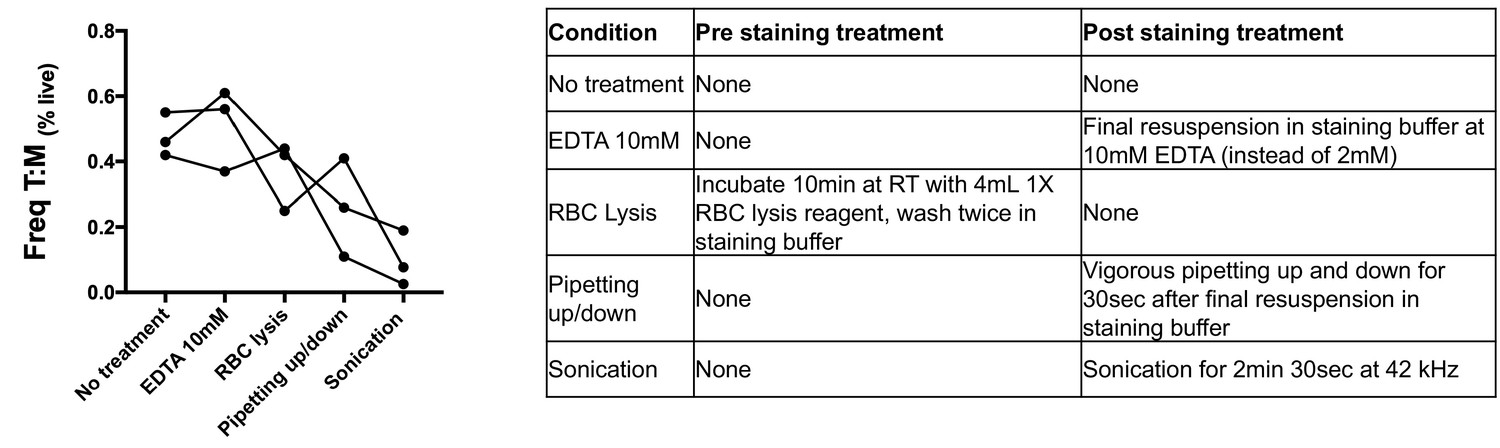
Effect of physical and chemical sample manipulation on the frequency of T cell:monocyte complexes.
The frequency of T cell:monocyte complexes was assessed with or without various treatments (as outlined in the table) from frozen PBMC of three healthy individuals. T cell:monocyte complexes were defined as the CD3+CD14+ cell population gated from live singlets as represented in Figure 1—figure supplement 2.
Figure 3 with 1 supplement
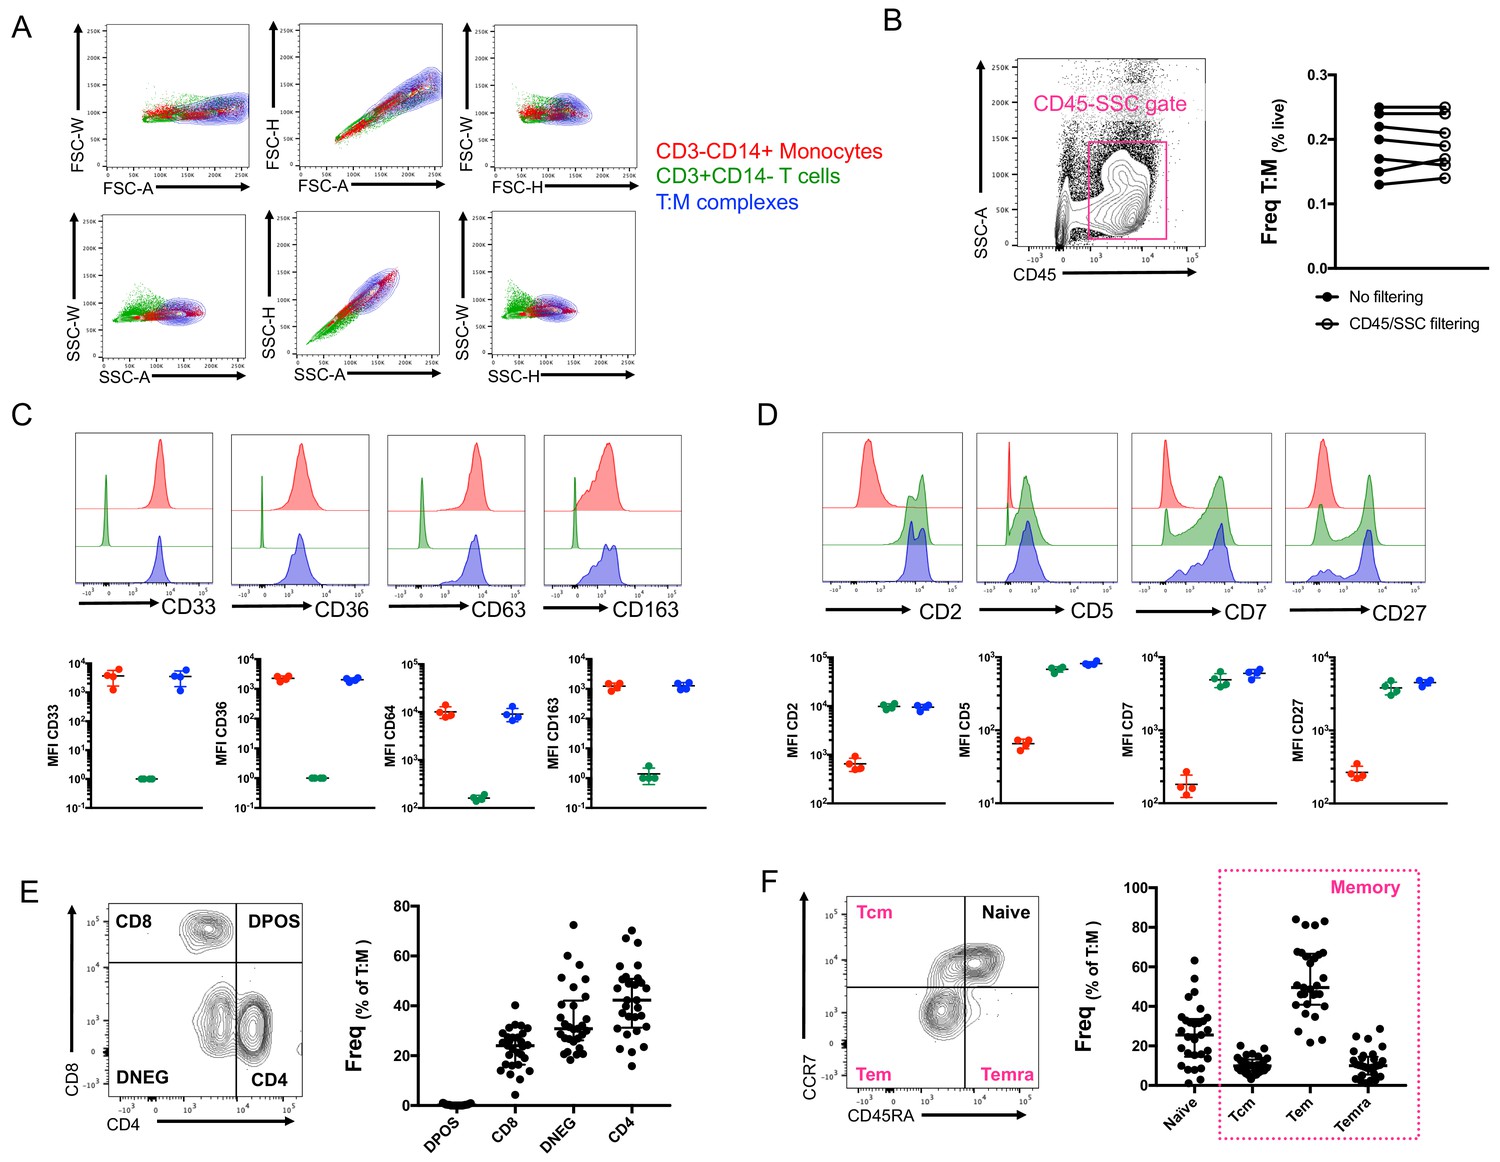
Conventional flow cytometry parameters and expression of T cell/monocyte canonical markers cannot differentiate between T cells and monocytes in a complex vs. not in a complex.
(A) 2D density plots of A, H and W from FSC and SSC parameters for CD3-CD14+ Monocytes (red), CD3+CD14- T cells (green) and CD3+CD14+ T cell:monocyte complexes (T:M, blue). Representative staining of one healthy individual. (B) Frequency of T cell:monocyte complexes cells with or without addition of CD45-SSC filtering gate (see Figure 3 – figure supplement 1 for gating strategy). Expression of canonical markers for (C) monocytes and (D) T cells in CD3-CD14+ Monocytes (red), CD3+CD14- T cells (green) and CD3+CD14+ T cell:monocyte complexes (T:M, blue). (E) Expression of CD4 and CD8 and division into T cell subsets within T cell:monocyte complexes. (F) Expression of CD45RA and CCR7 and division into naïve, central memory (Tcm), effector memory (Tem) and effector memory re-expressing CD45RA (Temra) subsets within T cell:monocyte complexes. Data derived from frozen PBMC of n=30 (A, E, F), n=8 (B) and n=4 (C, D) healthy individuals. Unless otherwise stated, T cell:monocyte complexes were defined as the CD3+CD14+ cell population gated from live singlets as represented in Figure 1—figure supplement 2.
Figure 3—figure supplement 1
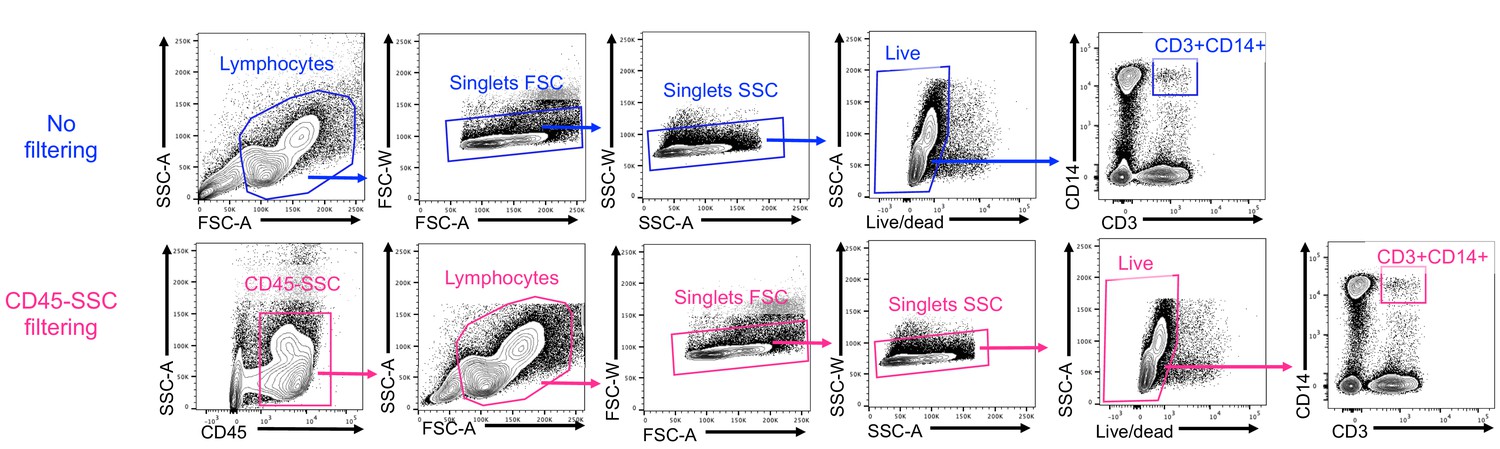
Gating strategy to identify CD3+CD14+ cells with or without a CD45-SSC gate filtering.
https://doi.org/10.7554/eLife.46045.011
Figure 4 with 4 supplements
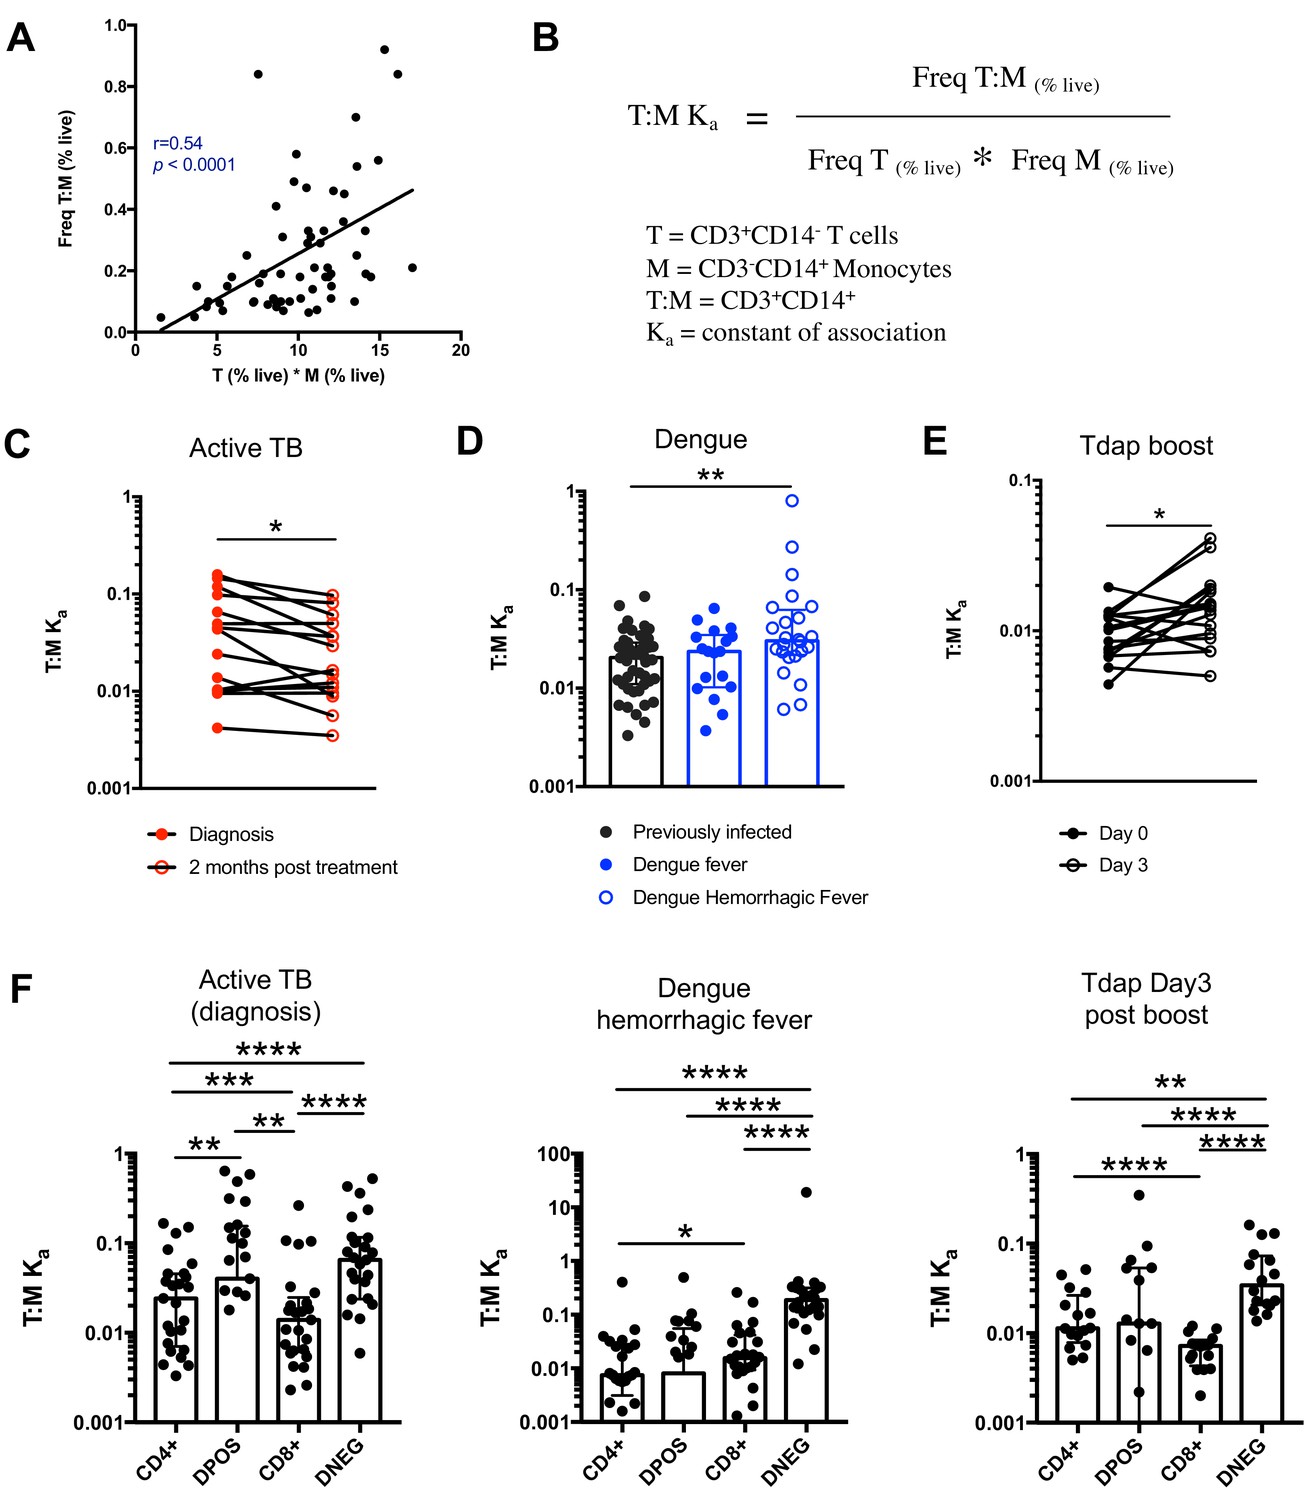
The constant of association Ka between monocytes and T cells (and T cell subsets) varies with the presence and nature of immune perturbations.
(A) Non-parametric spearman correlation between the frequency of T cell:monocyte complexes and the product of singlet T cells and monocyte frequencies in healthy subjects (n = 59). (B) Formula for the calculation of the T cell:monocyte constant of association Ka. T cell:monocyte complexes constant of association Ka in (C) active TB subjects at diagnosis and 2 months post treatment (n = 15), (D) individuals with acute dengue fever (n = 18), acute dengue hemorrhagic fever (n = 24) or previously infected (n = 47) and (E) previously vaccinated healthy adults (n = 16) before and three days post boost with Tdap vaccine, calculated as explained in B). (F) The constant of association Ka between monocytes and T cell subsets in active TB subjects at diagnosis (n = 25), individuals with acute dengue hemorrhagic fever (n = 24) and previously vaccinated healthy adults three days post boost with Tdap vaccine (n = 16), calculated as explained in B). Statistical differences over time and across cell populations within subjects were determined using the non-parametric paired Wilcoxon test; other statistical differences were determined using the non-parametric Mann-Whitney test; *, p<0.05; **, p<0.01; ***, p<0.01; ****, p<0.0001. Plots represent individual data points, median and interquartile range across all subjects within each cohort. Raw frequencies of T cell:monocyte complexes for the different disease cohorts are available on Figure 4—figure supplement 4. T cell:monocyte complexes were defined as the CD3+CD14+ cell population gated from live singlets as represented in Figure 1—figure supplement 2. CD4 and CD8 subsets within T cell:monocyte complexes were defined as presented in Figure 3E.
Figure 4—figure supplement 1
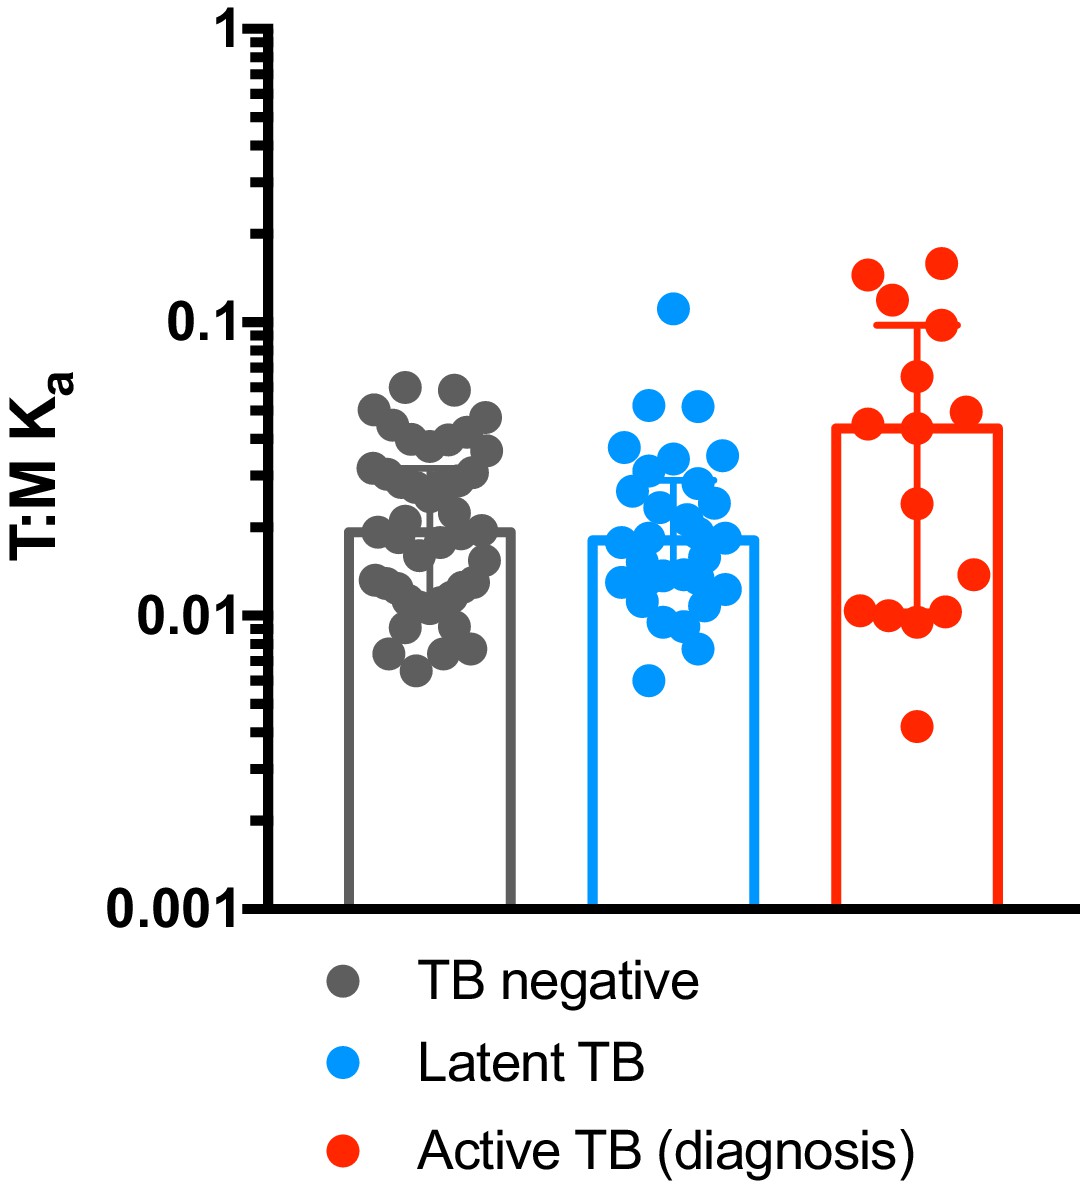
T cell:monocyte constant of association Ka in subjects with active TB, latent TB or TB uninfected individuals.
T cell:monocyte constant of association Ka was calculated as explained in Figure 4B from active TB samples (n = 15) collected at diagnosis from Sri Lanka, latent TB samples collected from subjects living in San Diego (n = 22) or Peru (n = 8), and TB uninfected samples collected from subjects living in San Diego (n = 29) or Sri Lanka (n = 14). Plots represent individual data points, median and interquartile range across all subjects within each cohort.
Figure 4—figure supplement 2

T cell:monocyte constant of association Ka fluctuates as a function of time following Tdap boost administration.
Previously vaccinated healthy subjects (n = 16) were re-immunized with Tdap and blood collected before, one day, three days, seven days and fourteen days post boost. Plots represent the median and interquartile range across all 16 subjects. T cell:monocyte constant of association Ka was calculated as explained in Figure 4B.
Figure 4—figure supplement 3
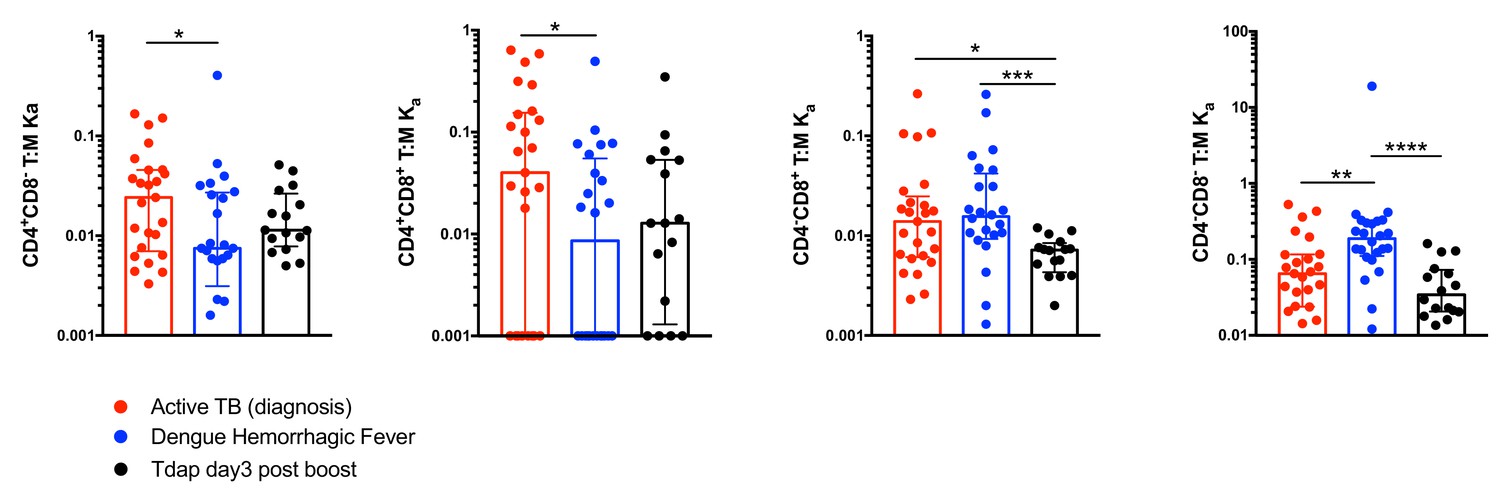
Comparison of constant of association Ka between monocytes and T cell subsets across different immune perturbations.
Constant of association Ka for each T cell subset and monocytes was calculated as explained in Figure 4B from active TB subjects at diagnosis (n = 25), individuals with acute dengue hemorrhagic fever (n = 24) and previously vaccinated healthy adults three days post boost with Tdap vaccine (n = 16). Plots represent individual data points, median and interquartile range across all subjects.
Figure 4—figure supplement 4
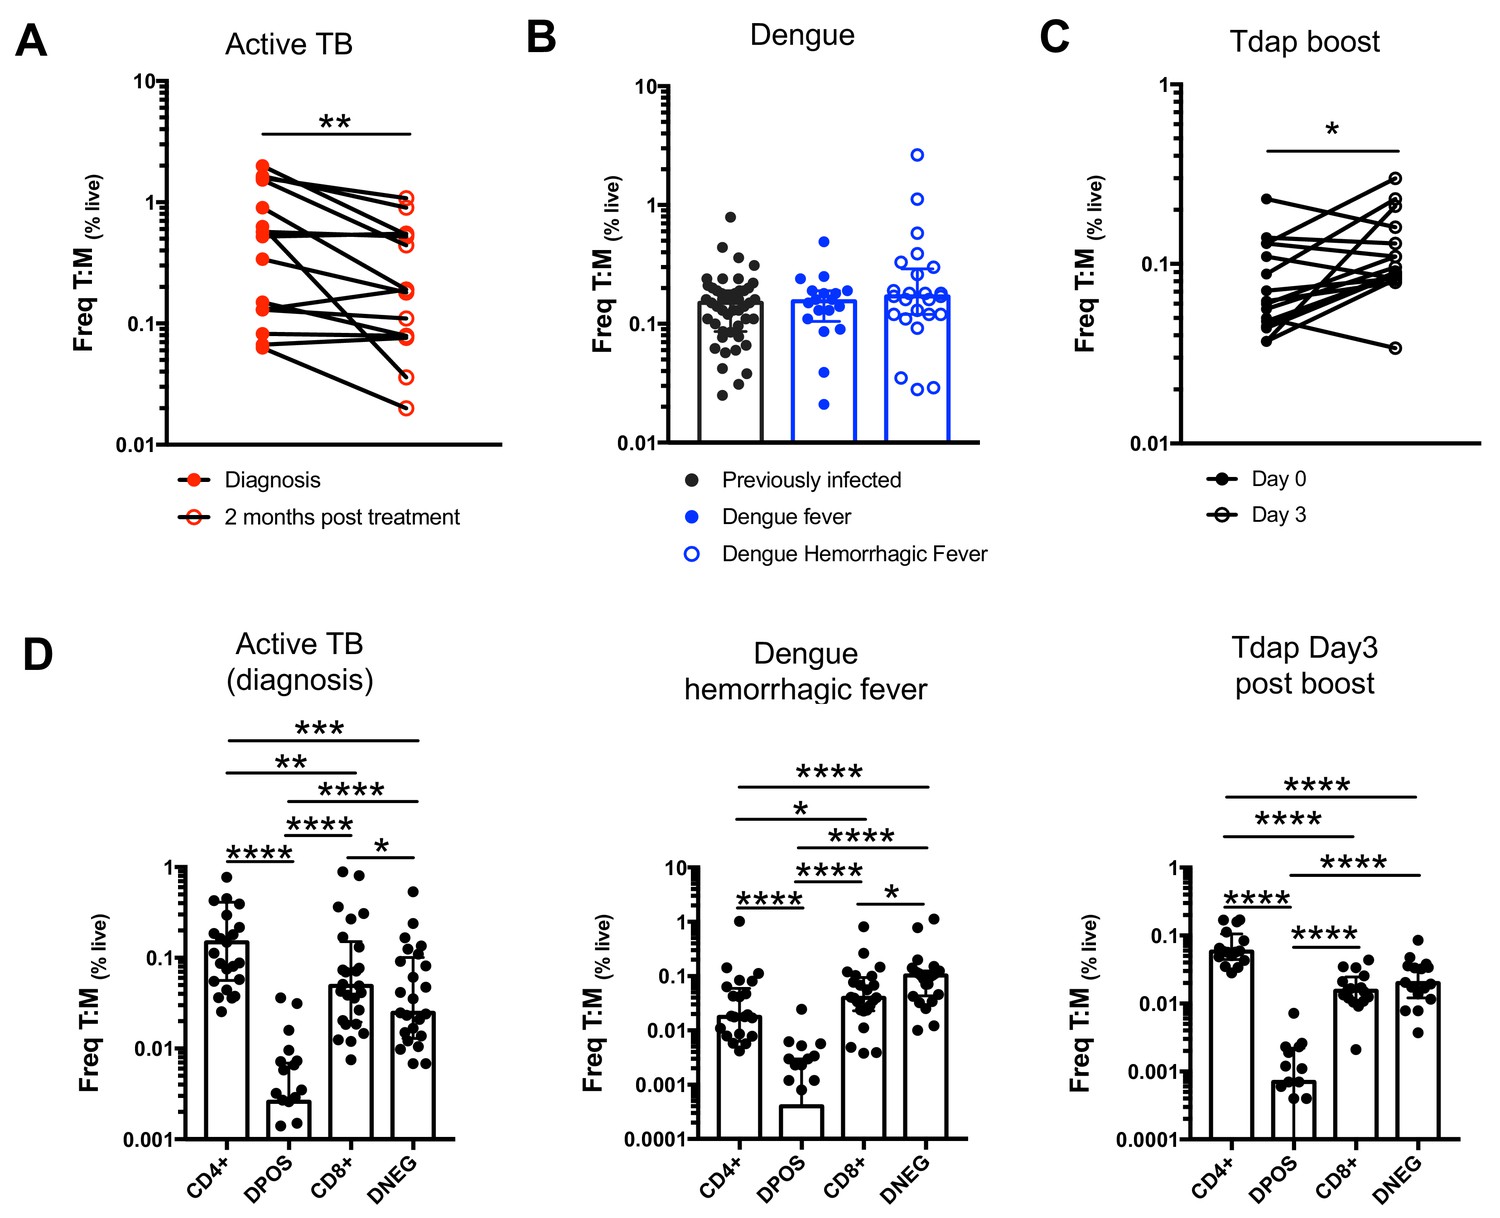
Frequencies of T cell:monocyte complexes in different immune perturbation models.
Frequencies of T cell:monocyte complexes (and T cell subsets:monocyte complexes) expressed as percent of live cells were determined in active TB subjects at diagnosis (n = 25) and two months post treatment (n = 15), individuals with acute dengue hemorrhagic fever (n = 24) and previously vaccinated healthy adults three days post boost with Tdap vaccine (n = 16). Statistical differences over time and across cell populations within subjects were determined using the non-parametric paired Wilcoxon test; other statistical differences were determined using the non-parametric Mann-Whitney test; *, p<0.05; **, p<0.01; ***, p<0.01; ****, p<0.0001. Plots represent individual data points, median and interquartile range across all subjects within each cohort. These frequencies were used to calculate the Ka values presented in Figure 4C–F, using the formula in Figure 4B.
Tables
Key resources table
| Reagent type (species) or resource | Designation | Source or reference | Identifiers | Additional information |
|---|---|---|---|---|
| Antibody | CCR7-PerCpCy5.5; clone G043H7; mouse monoclonal | Biolegend | Cat# 353220 | 1:50 (4 µl per test) |
| Antibody | CD2-BV421; clone RPA-2.10; mouse monoclonal | Biolegend | Cat# 300229 | 1:66 (3 µl per test) |
| Antibody | CD3-AF700; clone UCHT1; mouse monoclonal | BD pharmigen | Cat# 557943 | 1:66 (3 µl per test) |
| Antibody | CD3-AF488; clone UCHT1; mouse monoclonal | Biolegend | Cat# 300415 | 1:200 (1 µl per test) |
| Antibody | CD4-APCeF780; clone RPA-T4; mouse monoclonal | eBiosciences | Cat# 47-0049-42 | 1:200 (1 µl per test) |
| Antibody | CD5-APCCy7; clone L17F12; mouse monoclonal | Biolegend | Cat# 364009 | 1:66 (3 µl per test) |
| Antibody | CD7-APC; clone CD7-6B7; mouse monoclonal | Biolegend | Cat# 343107 | 1:66 (3 µl per test) |
| Antibody | CD8a-BV650; clone RPA-T8; mouse monoclonal | Biolegend | Cat# 301042 | 1:200 (1 µl per test) |
| Antibody | CD14-APC; clone 61D3; mouse monoclonal | Tonbo biosciences | Cat# 20–0149 T100 | 1:200 (1 µl per test) |
| Antibody | CD14-AF594; clone HCD14 | Biolegend | Cat# 325630 | 1:200 (1 µl per test) |
| Antibody | CD14-AF647; clone 63D3 | Biolegend | Cat# 367128 | 1:200 (1 µl per test) |
| Antibody | CD14-BV421; clone HCD14 | Biolegend | Cat# 325628 | 1:200 (1 µl per test) |
| Antibody | CD14-PE; clone 61D3; mouse monoclonal | eBioscience | Cat# 12-0149-42 | 1:200 (1 µl per test) |
| Antibody | CD27-BV650; clone O323 | Biolegend | Cat# 302827 | 1:100 (2 µl per test) |
| Antibody | CD33-APC; clone WM53 | Biolegend | Cat# 303407 | 1:200 (1 µl per test) |
| Antibody | CD36-APCCy7; clone 5–271 | Biolegend | Cat# 336213 | 1:100 (2 µl per test) |
| Antibody | CD45-PerCpCy5.5; clone HI30; mouse monoclonal | Tonbo biosciences | Cat# 65–0459 T100 | 1:66 (3 µl per test) |
| Antibody | CD45RA-eF450; clone HI100; mouse monoclonal | eBiosciences | Cat# 48-0458-42 | 1:200 (1 µl per test) |
| Antibody | CD64-AF488; clone 10.1; mouse monoclonal | Biolegend | Cat# 305010 | 1:200 (1 µl per test) |
| Antibody | CD163-PECy7; clone GHI/61; mouse monoclonal | Biolegend | Cat# 333613 | 1:100 (2 µl per test) |
| Antibody | ICAM1(CD54); unconjugated; clone HCD54; mouse monoclonal | Biolegend | Cat# 322704 | 1:40 (5 µl per test) |
| Antibody | LFA1(CD11a); unconjugated; clone TS2/4; mouse monoclonal | Biolegend | Cat# 350602 | 1:40 (5 µl per test) |
| Antibody | LFA1(CD11a/CD18)-AF647; clone m24; mouse monoclonal | Biolegend | Cat# 363412 | 1:40 (5 µl per test) |
Additional files
-
Supplementary file 1
Fluorochrome-conjugated antibodies used in the study.
- https://doi.org/10.7554/eLife.46045.017
-
Transparent reporting form
- https://doi.org/10.7554/eLife.46045.018
Download links
A two-part list of links to download the article, or parts of the article, in various formats.
Downloads (link to download the article as PDF)
Open citations (links to open the citations from this article in various online reference manager services)
Cite this article (links to download the citations from this article in formats compatible with various reference manager tools)
Circulating T cell-monocyte complexes are markers of immune perturbations
eLife 8:e46045.
https://doi.org/10.7554/eLife.46045


