Distinct roles of striatal direct and indirect pathways in value-based decision making
- Institute for Basic Science, Republic of Korea
- Korea Advanced Institute of Science and Technology, Republic of Korea
Figures
Figure 1 with 1 supplement
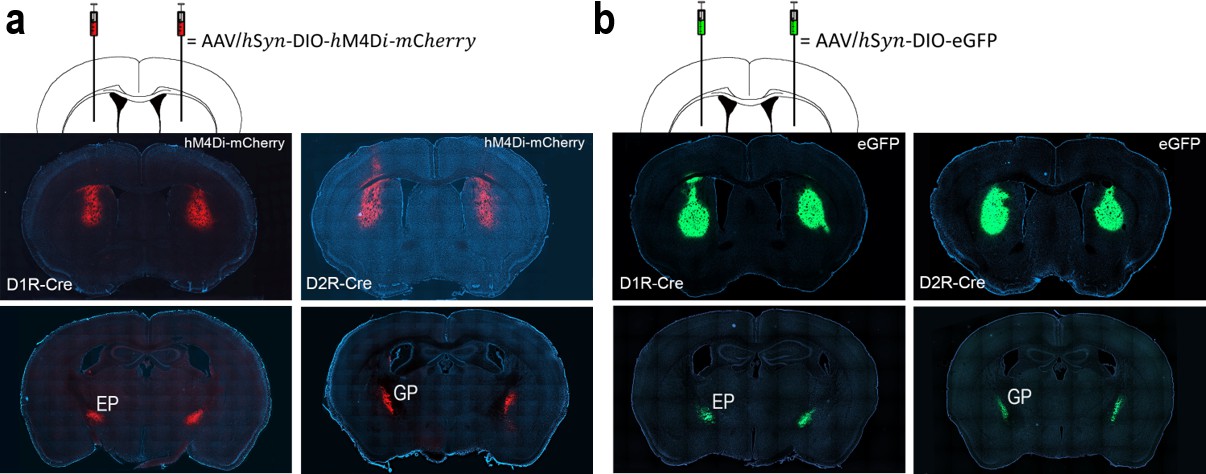
Selective expression of h4MDi-mCherry and eGFP in direct- or indirect-pathway striatal neurons.
(a) Representative brain sections showing h4MDi-mCherry expression in the dorsal striatum and EP in D1R-Cre mice (left), and in the dorsal striatum and GP in D2R-Cre mice (right). (b) Representative brain sections showing eGFP expression in the dorsal striatum and EP in D1R-Cre mice (left), and in the dorsal striatum and GP in D2R-Cre mice (right).
Figure 1—figure supplement 1
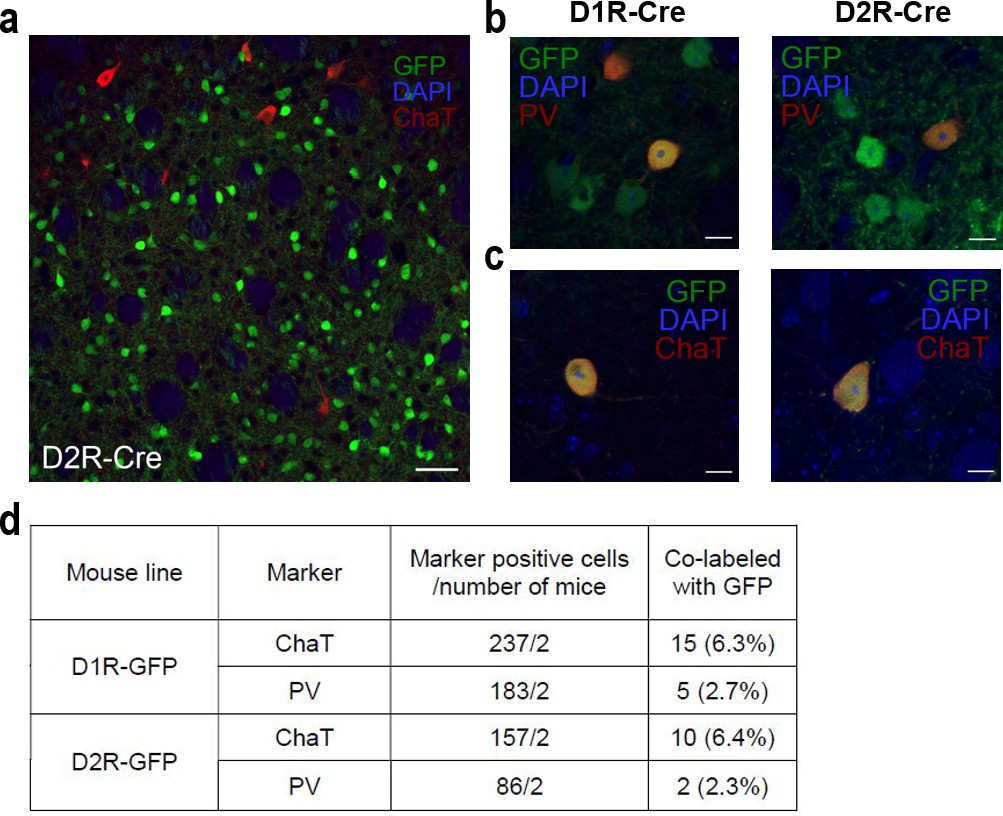
Expression of D1 and D2 receptors in striatal interneurons.
(a) A representative coronal section showing immunolabeling for choline acetyltransferase (ChaT; red) and fluorescence labeling for green fluorescent protein (GFP; green). This example was obtained from a D2R-Cre mouse. Scale bar, 50 μm. (b) Examples of parvalbumin (PV) and GFP co-labeled striatal neurons. Scale bar, 10 μm. (c) Examples of ChaT and GFP co-labeled striatal neurons. Scale bar, 10 μm. (d) Percentages of co-labeled striatal neurons. Percentages were similar between D1R-Cre and D2R-Cre mice (Fisher’s exact test, ChaT, p = 0.572; PV, p = 0.712).
Figure 2 with 1 supplement

Behavioral performance in the reversal task.
(a) Behavioral task. Following nose poke in the lit central hole, the animal was allowed to choose freely between two targets to obtain a water reward. (b) Daily performances (means ± SEM across animals) of the three animal groups (CNO, DMSO and eGFP-CNO) are shown separately for D1R-Cre and D2R-Cre mice. (c) Mean (± SEM across animals) performances of the three animal groups during each stage. Circles, data for individual animals. P-values are indicated for the main effect of animal group (Group) and the effect of mouse line ×animal group interaction (Intx) (two-way between-groups ANOVA). Asterisks indicate the results of Bonferroni post-hoc tests (**p<0.01; ***p<0.001).
Figure 2—figure supplement 1
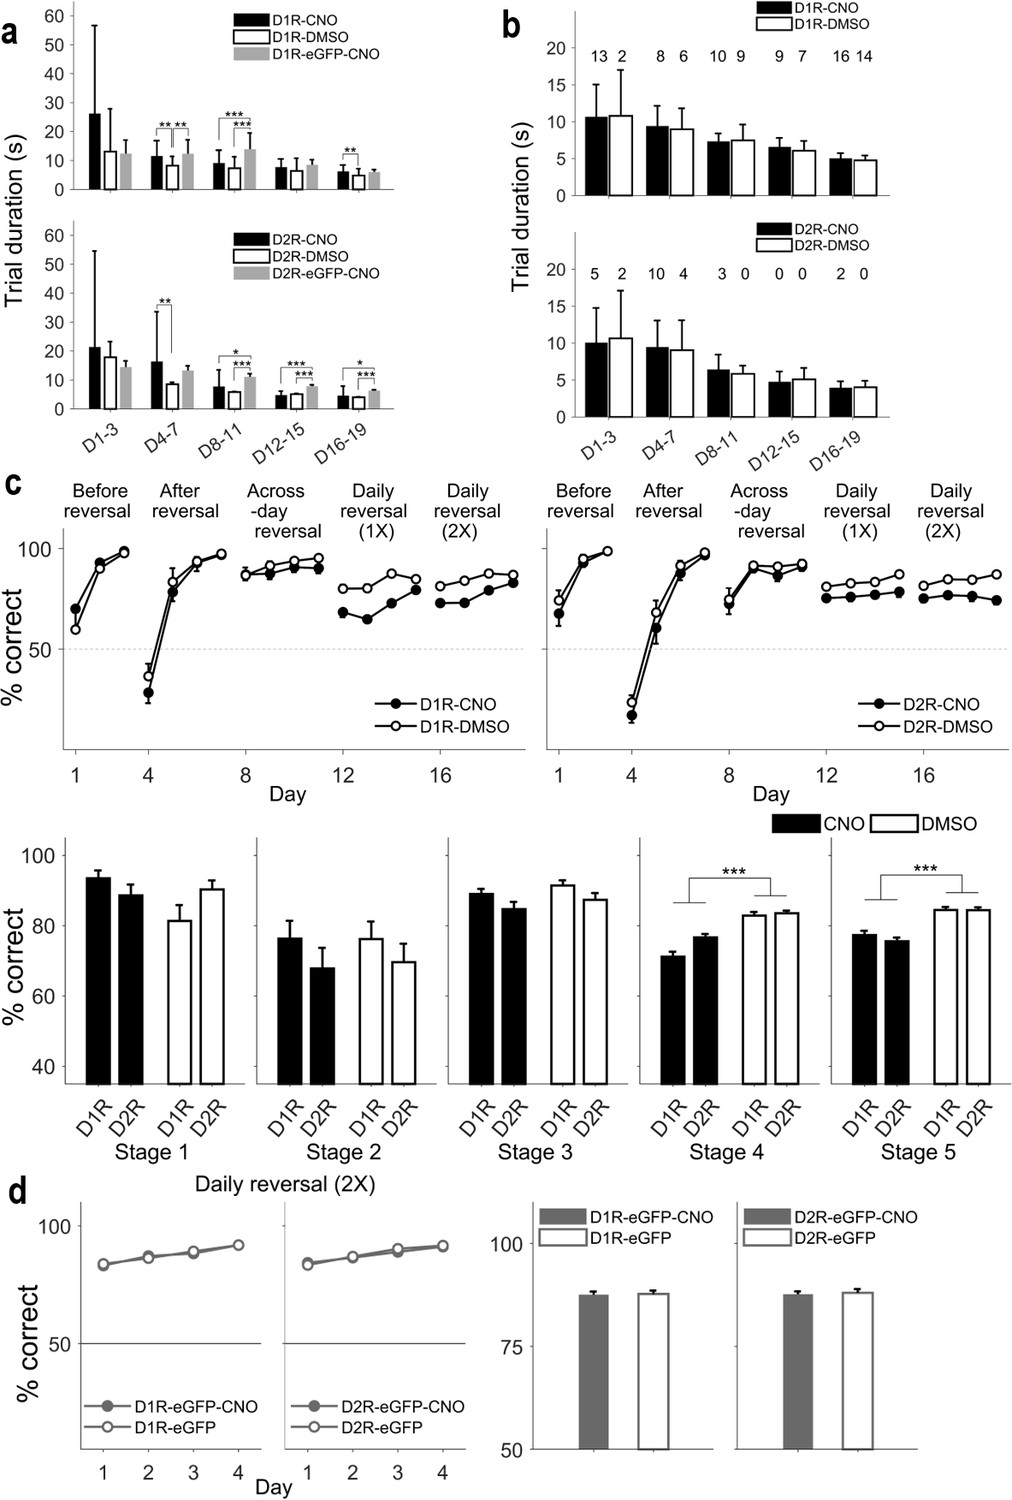
CNO effects in the reversal task cannot be accounted for by differences in trial duration.
It is unlikely that differences in behavioral performance among the three animal groups are attributable to differences in trial duration. First, even though trial duration varied across animal groups, mean trial durations of the three animal groups did not match their behavioral performances (a). Second, similar results were obtained in comparisons of behavioral performances of CNO and DMSO animal groups after matching their trial durations (b,c). We could not perform the same trial duration-matching analysis between CNO and eGFP-CNO D2R-Cre animal groups because the overlap in trial duration distribution between the two groups was relatively small. Note, however, that trial duration was shorter, rather than longer, in CNO compared with eGFP-CNO D2R-Cre animal groups. Furthermore, an additional test revealed that the performance of eGFP D2R-Cre mice was similar under CNO-injection and no-injection conditions (d). Also note that trial duration was not significantly different between CNO and eGFP-CNO D1R-Cre animal groups during stages 4 and 5 (a). Collectively, these results indicate that impaired performance following D1R or D2R neuronal inactivation cannot be attributed to impaired movement of the animals. (a) Mean (± SD) trial durations of the three animal groups during the reversal task. *p<0.05, **p<0.01, ***p<0.001 (one-way ANOVA followed by Bonferroni post-hoc tests). (b) Mean trial durations were matched between CNO and DMSO animal groups for each stage of the reversal task for each mouse line by deleting long trial-duration sessions of CNO mice and short trial-duration sessions of DMSO mice; numbers above bars indicate the number of sessions deleted from the total of 418 CNO-hM4Di sessions and 380 DMSO-hM4Di sessions. Error bars, SD. (c) Mean (± SEM) percentages of correct choices for trial duration-matched CNO and DMSO animal groups. The format is the same as that in Figure 2. ***p<0.001 (two-way between-groups ANOVA, stage 4, main effect of mouse line, F(1,35) = 4.29, p = 0.045; main effect of drug, F(1,35) = 37.45, p = 3.9 × 10⁻⁷; mouse line × drug interaction, F(1,35) = 2.19, p = 0.147; stage 5, main effect of mouse line, F(1,35) = 0.26, p = 0.610; main effect of drug, F(1,35) = 31.2, p = 2.7 × 10⁻⁶; mouse line × drug interaction, F(1,35) = 1.08, p = 0.305). (d) Performances of eGFP D1R-Cre and D2R-Cre mice with and without CNO injection. The target location was reversed twice in each session (2 × within session reversal). Left, daily performances; right, mean (± SEM) performances. The CNO behavioral data is identical to that during stage five in Figure 2.
Figure 3 with 1 supplement
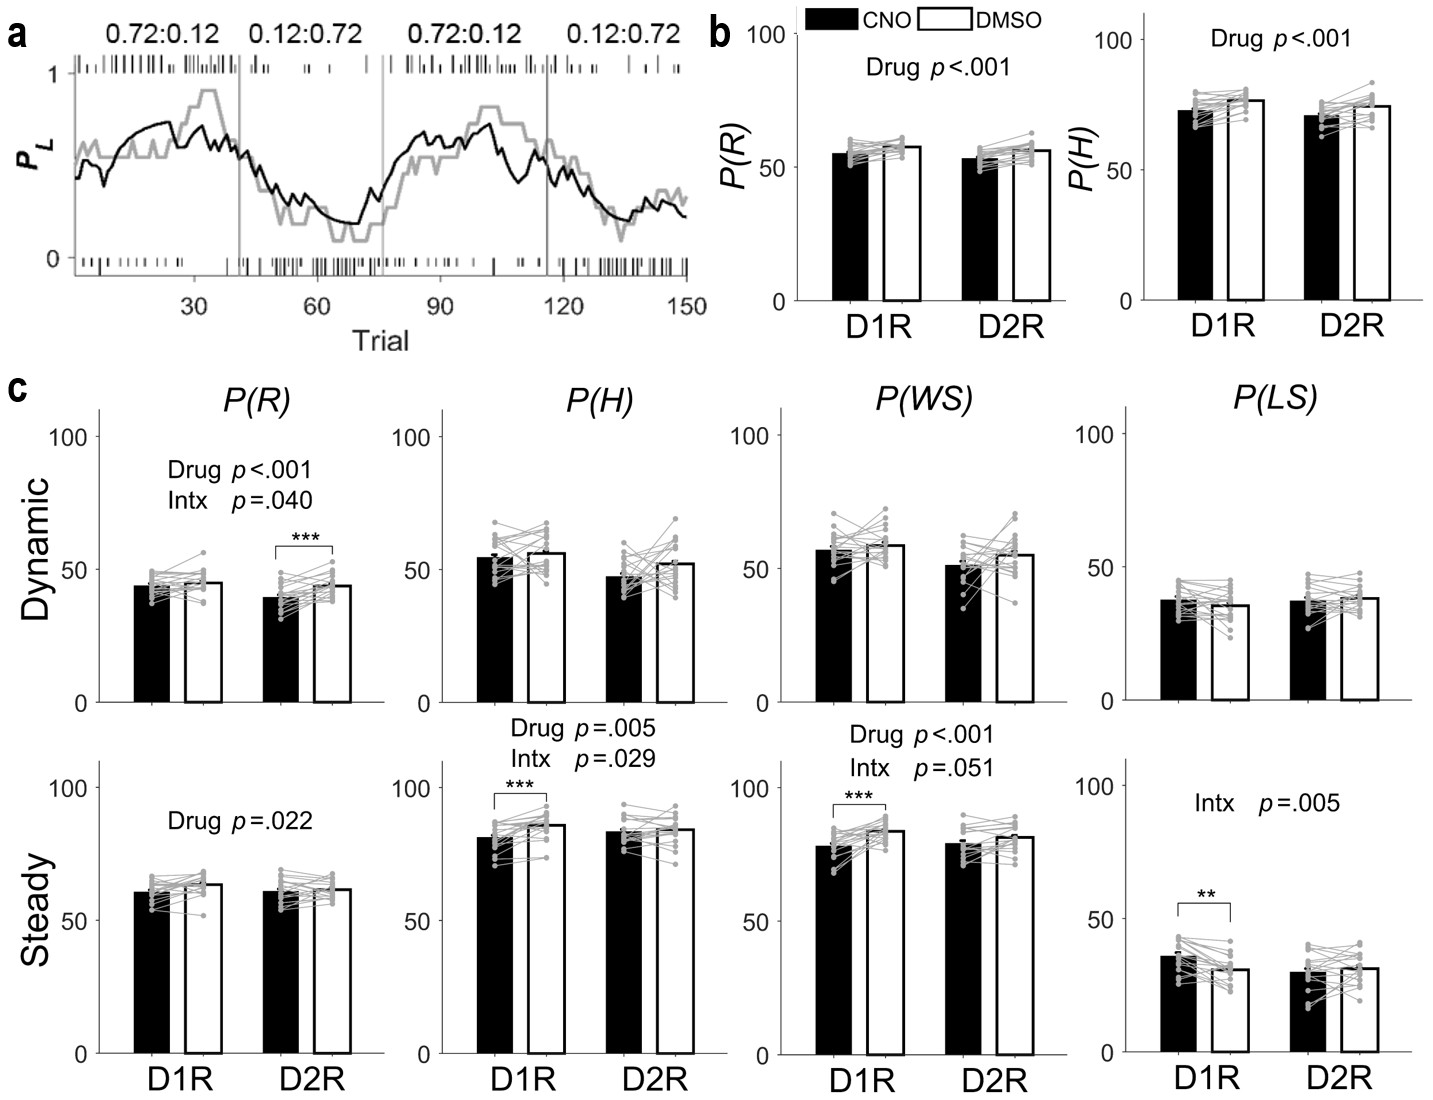
Behavioral performance in the dynamic TAB task.
(a) Representative TAB-task session (D1R-Cre mouse with DMSO injection). Tick marks indicate trial-by-trial choices of the animal (top, left choice; bottom, right choice; long, rewarded; short, unrewarded). Gray vertical lines denote block transitions. Numbers indicate block reward probabilities of left and right targets. The gray line indicates actual choices of the animal, shown as the probability of choosing the left goal (PL) in a moving average of 10 trials. The black line indicates PL, predicted by the Q-learning model. (b–d) Proportions (%) of rewarded trials (P(R)), higher-reward–probability target choices (P(H)), win-stay (P(WS)), and lose-switch (P(LS)) were compared between DMSO and CNO sessions for all trials (b), dynamic-state trials (c), and steady-state trials (d) (means ± SEM across animals). Gray circles and connecting lines, individual animal data. P-values are indicated for those measures with significant main effects of drug and/or mouse line × drug interaction (Intx) effects (two-way mixed-design ANOVA). Asterisks indicate the results of Bonferroni post-hoc tests (**p<0.01; ***p<0.001).
Figure 3—figure supplement 1
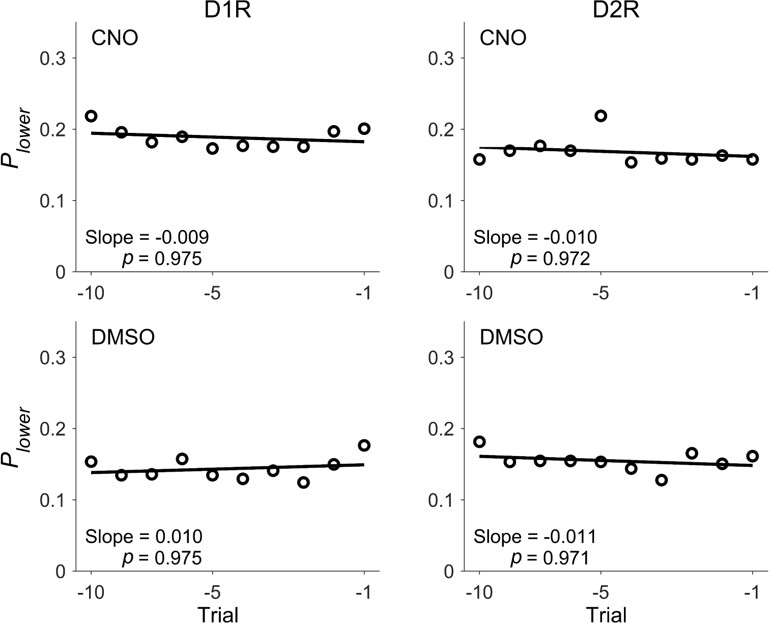
Analysis results related to anticipating the time of block transition.
Gray circles indicate the probabilities of choosing the lower-reward–probability target (Plower) during 10 trials before block transition in the TAB task. Probabilities were computed using all choice data of DMSO or CNO sessions. None of the slopes of logistic regression (solid lines) was significantly different from zero.
Figure 4 with 1 supplement
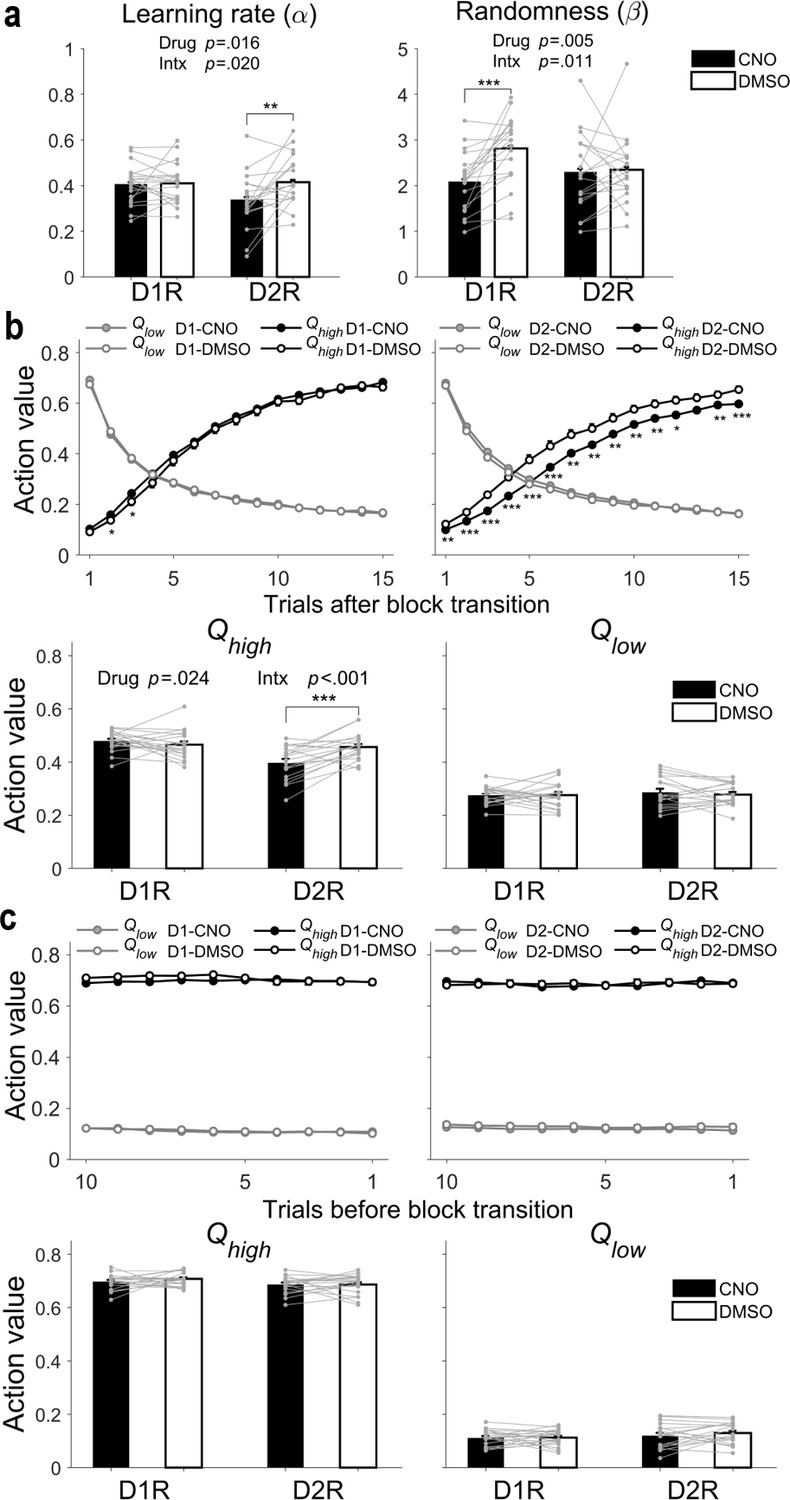
Effects of CNO on learning rate and randomness in action selection.
(a) Learning rate (α) and randomness in action selection (β), estimated from behavioral data during the TAB task, were compared between DMSO and CNO sessions (means ± SEM across animals). (b) Top, trial-by-trial action values during the initial 15 trials after block transition. Bottom, mean (± SEM across animals) action values in the dynamic state. (c) Top, trial-by-trial action values during the last 10 trials of a block. Bottom, mean (± SEM across animals) action values in the steady state. Gray circles and connecting lines, individual animal data. Asterisks indicate the results of Bonferroni post-hoc tests (*p<0.05; **p<0.01; ***p<0.001) for those measures with significant mouse line × drug interaction (Intx) effects (two-way mixed-design ANOVA).
Figure 4—figure supplement 1
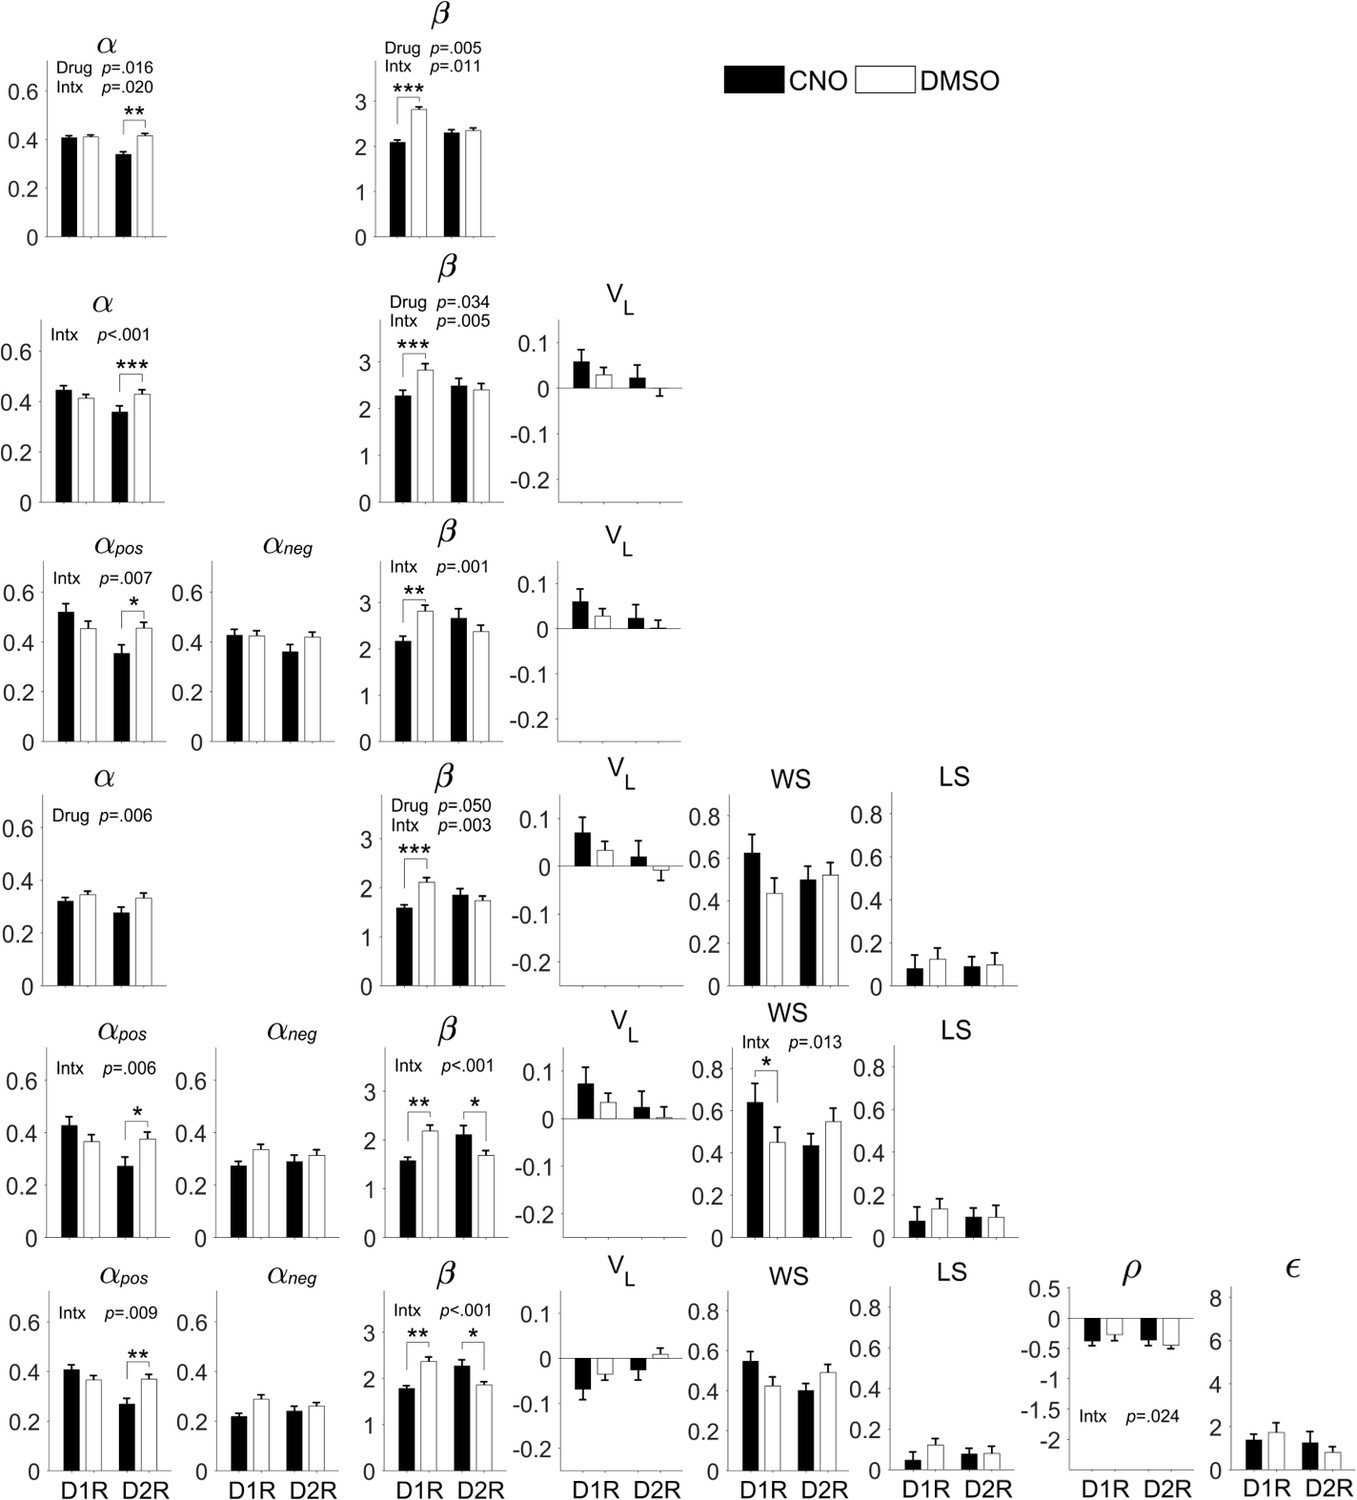
Consistent results were obtained using variants of the Q-learning model.
Coefficients (means ± SEM across animals) of model parameters are shown for models 1–6 (see Materials and methods). In all models, CNO significantly increased randomness in action selection in D1R-Cre mice and significantly decreased learning rate in D2R-Cre mice. Left, D1R-Cre mice; right, D2R-Cre mice. α, learning rate; αpos, learning rate for positive outcome (rewarded trials); αneg, learning rate for negative outcome (unrewarded trials); β, randomness in action selection; VL, choice bias; WS, win-stay; LS, lose-switch; ε and ρ, parameters for uncertainty-based exploration (see Materials and methods). P-values are indicated for those measures with significant main effects of drug and/or mouse line × drug interaction (Intx) effects (two-way mixed-design ANOVA). Asterisks indicate the results of Bonferroni post-hoc tests (*p<0.05; **p<0.01; ***p<0.001).
Tables
Key resources table
| Reagent type (species) or resource | Designation | Source or reference | Identifiers | Additional information |
|---|---|---|---|---|
| Strain, strain background (Mus musculus) | STOCK Tg(Drd1-cre)EY217Gsat/Mmucd | Gene Expression Nervous System Atlas | RRID:MMRRC_030778-UCD | |
| Strain, strain background (Mus musculus) | STOCK Tg(Drd2-cre)ER44Gsat/Mmucd | Gene Expression Nervous System Atlas | RRID:MMRRC_017263-UCD | |
| Recombinant DNA reagent | AAV8-hSyn-DIO-hM4Di-mCherry | Addgene (PMID:21364278) | RRID:Addgene_44362 | |
| Recombinant DNA reagent | AAV2-hSyn-DIO-eGFP | Addgene | RRID:Addgene_50457 | |
| Chemical compound, drug | clozapine-N-oxide | TOCRIS | Cat. #:4936 | |
| Chemical compound, drug | dimethyl sulfoxide | TOCRIS | Cat. #:3176 | |
| Software, algorithm | Matlab 9.4 | Matworks | R2018a |
Additional files
-
Supplementary file 1
Model comparison.
- https://doi.org/10.7554/eLife.46050.010
-
Transparent reporting form
- https://doi.org/10.7554/eLife.46050.011
Download links
A two-part list of links to download the article, or parts of the article, in various formats.
Downloads (link to download the article as PDF)
Open citations (links to open the citations from this article in various online reference manager services)
Cite this article (links to download the citations from this article in formats compatible with various reference manager tools)
Distinct roles of striatal direct and indirect pathways in value-based decision making
eLife 8:e46050.
https://doi.org/10.7554/eLife.46050


