An order-to-disorder structural switch activates the FoxM1 transcription factor
- University of California, Santa Cruz, United States
- University of Massachusetts Medical School, United States
Figures
Figure 1
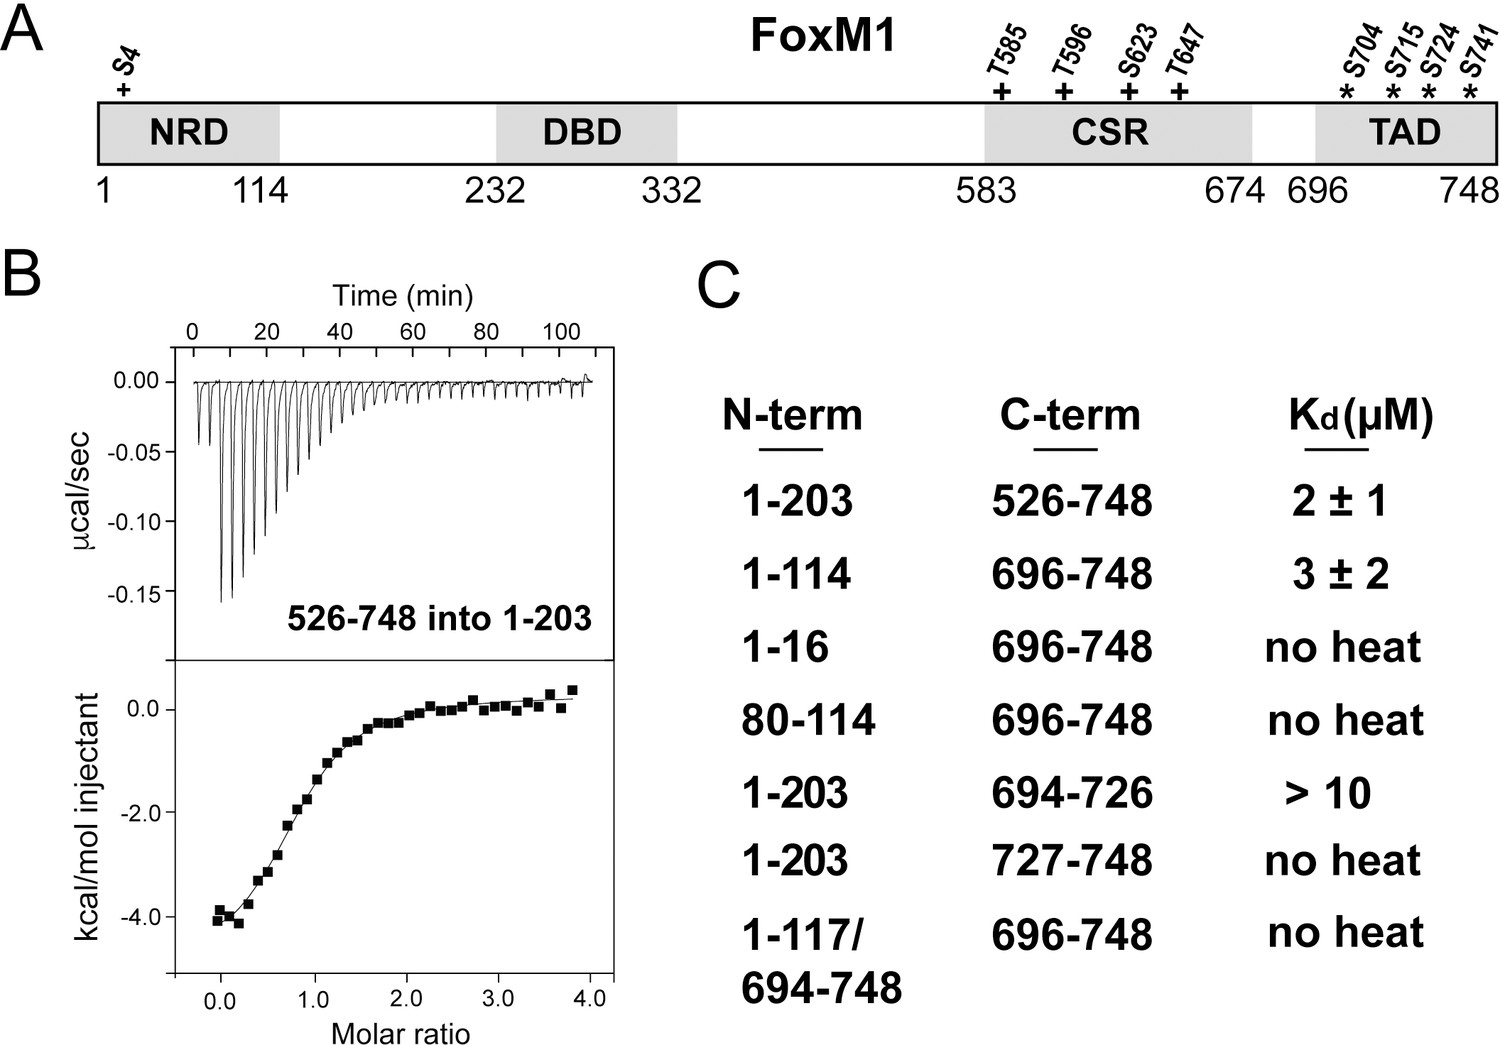
Direct association between the FoxM1 NRD and TAD.
(A) Domain boundaries for the negative regulatory domain (NRD), DNA binding domain (DBD), Cdk-site region (CSR), and transactivation domain (TAD). Numbering for human FoxM1 isoform b is used. Conserved consensus Cdk (+) phosphorylation sites and the Plk1 phosphorylation sites (*) identified here are indicated. (B) Isothermal titration calorimetry (ITC) data indicate association between purified TAD and NRD-containing constructs. (C) ITC affinity measurements for the indicated purified protein constructs. From these data, we define the NRD and TAD boundaries in panel A. All values from the ITC data fitting are listed in Supplementary file 1.
Figure 2 with 3 supplements
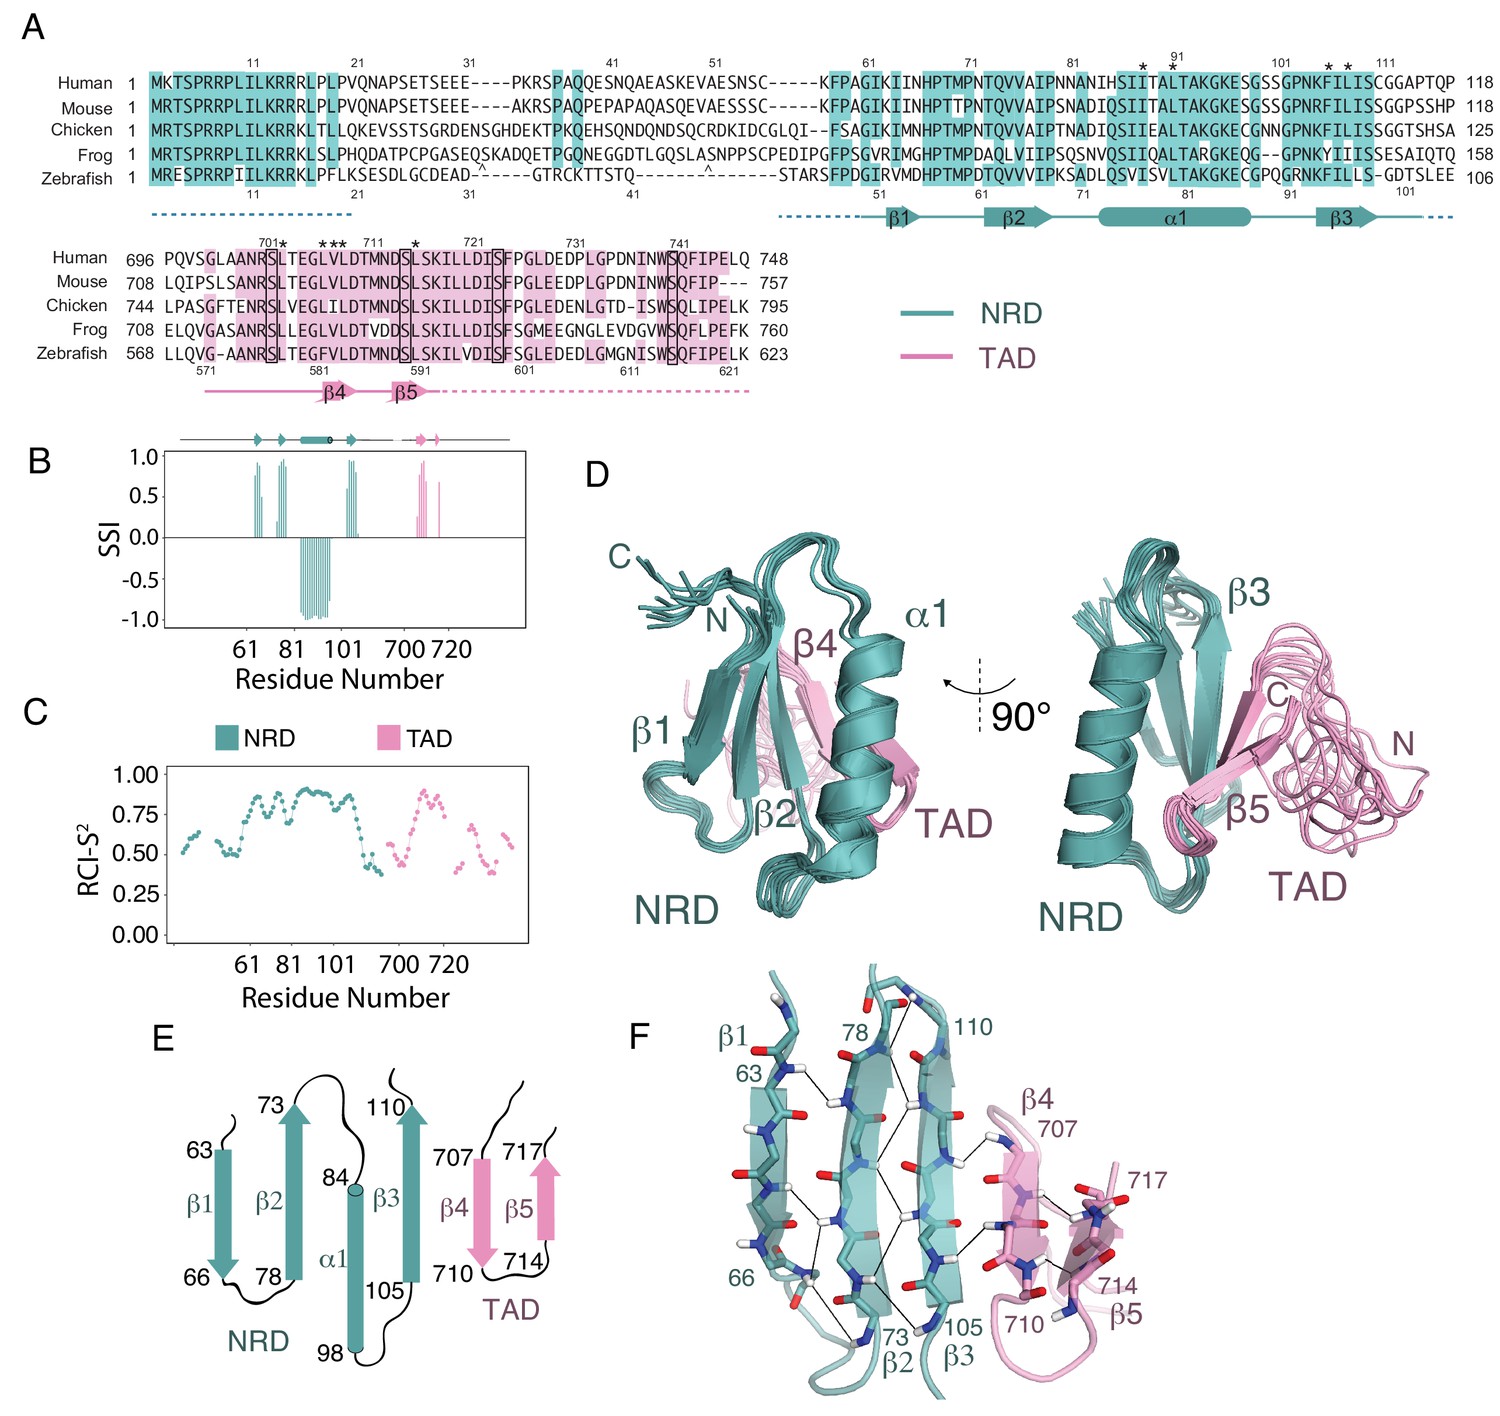
Solution structure of an NRD-TAD complex.
(A) Sequence alignment of FoxM1 orthologs from Homo sapiens (human), Mus musculus (mouse), Gallus gallus (chicken), Xenopus laevis (frog), and Danio rerio (zebrafish). Conserved residues in at least four of the five sequences are colored. Secondary structure assignments are determined from dictionary of protein secondary structure (DSSP) analysis of the final NMR ensemble (Kabsch and Sander, 1983). Dashed lines indicate residues that are present in the NMR construct but are not included in the structure calculations and are significantly disordered according to the backbone chemical shifts. The asterisks (*) mark residues for which interdomain (NRD-TAD) NOEs have been unambiguously assigned. The carets ( ^ ) mark poorly conserved sequence insertions not shown in the frog sequence. Plk1 phosphorylation sites in the TAD are boxed. (B) Secondary Structure Index (SSI) derived from TALOS-N analysis of backbone chemical shifts corresponding to residues in the NRD (cyan) and TAD (pink) domains. Positive SSI values are consistent with β-strand and negative values are consistent with α helical structure. Amino acid numbering corresponding to the human sequence is used. (C) Estimated backbone order parameters (Random Coil Index RCI-S2) derived from the chemical shifts are shown for residues in the NRD and TAD (Berjanskii and Wishart, 2005). Lower RCI-S2 values indicate flexibility, higher RCI-S2 values indicate rigidity. (D) Overlay of ten final Rosetta models guided by the chemical shift, NOE, and RDC data. (E) Topology diagram of the NRD and TAD domains. (F) Structure of the five-stranded β-sheet. Unambiguously assigned interstrand amide proton-proton NOEs are shown as lines.
Figure 2—figure supplement 1

Details of the zebrafish FoxM1 fusion construct used for NMR analysis.
(A) The zebrafish sequences used in the fusion and alignment with the human sequence. As in Figure 2, the dashed line in the secondary structure annotation indicates that the sequence above was not used in the final structure calculations. Cleavage of the TEV protease site (green) inserted between the NRD and TAD yielded the highest quality data. The amino acids in red were mutated to alanine in the 13C-ILV-labeled samples to help reduce overlap in the methyl NOESY and TOCSY experiments. (B) 1H-15N HSQC spectrum of the cleaved zebrafish fusion construct with assigned amide N-H peaks labeled. The zebrafish sequence numbering is used here, however, throughout the main text, the human sequence numbering is used.
Figure 2—figure supplement 2
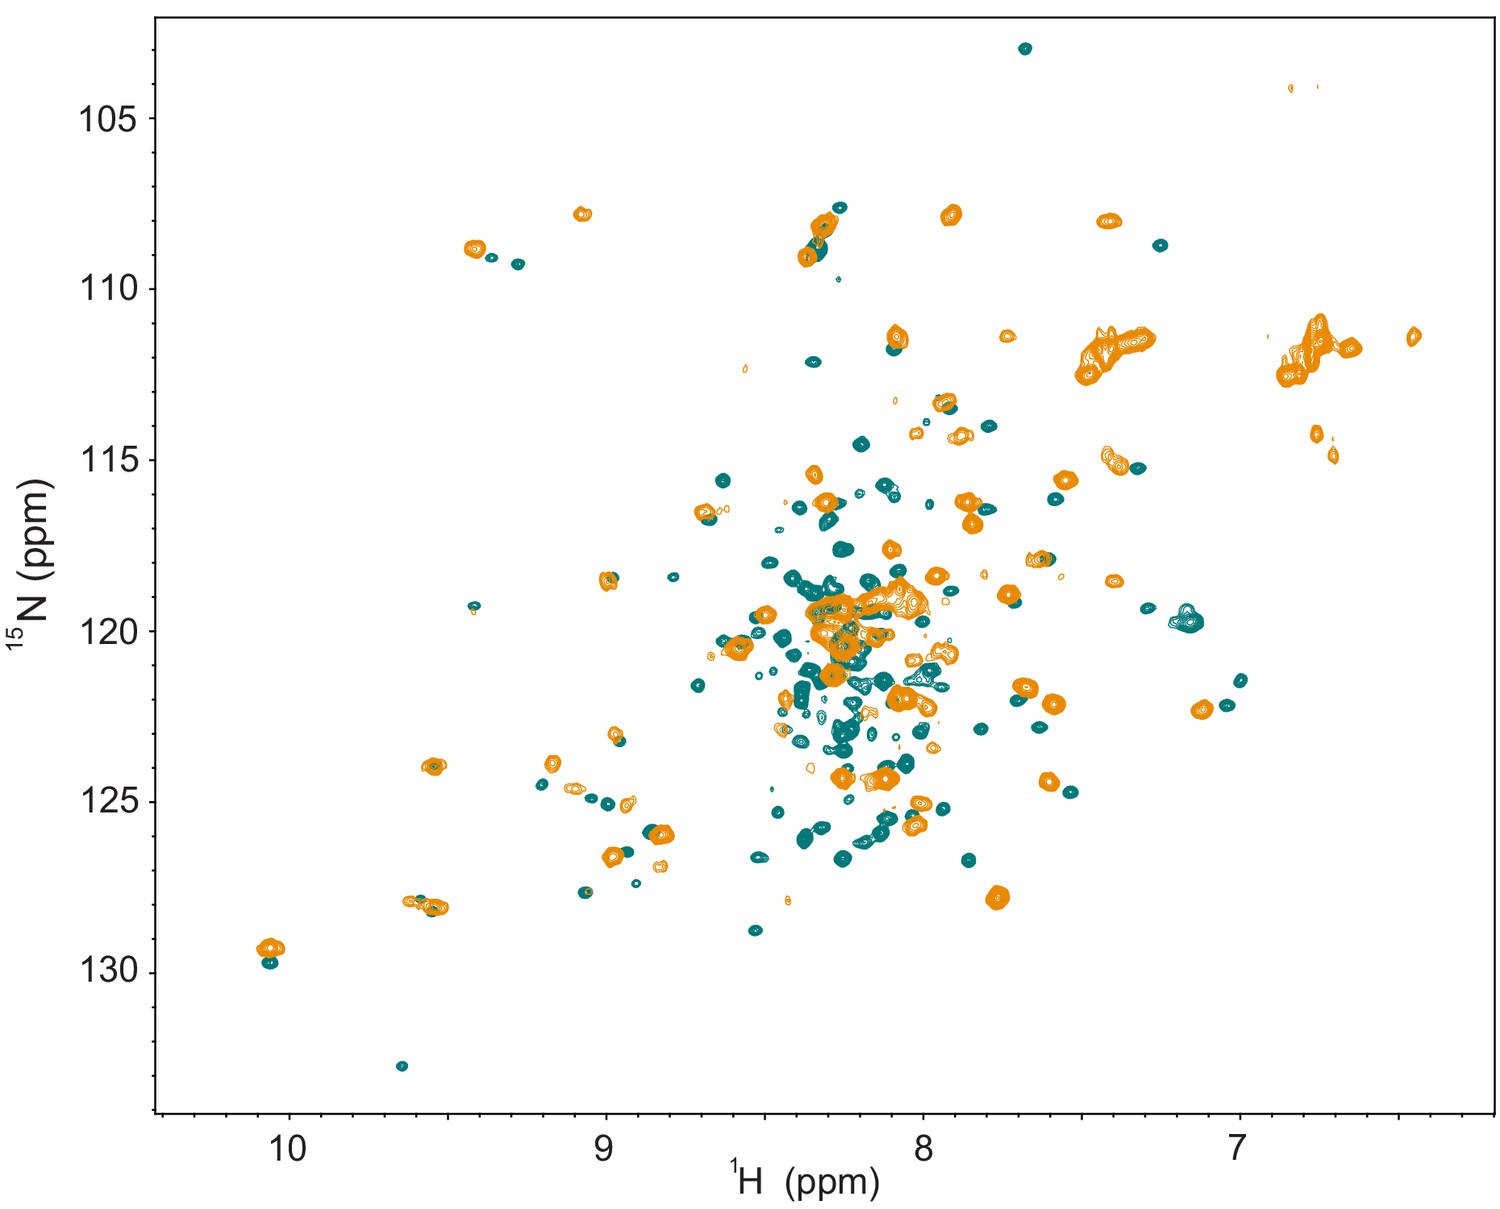
Comparison of NMR data between the NRD-TAD fusion construct with the linker cleaved and uncleaved.
(Green) 1H-15N HSQC spectrum of the zebrafish fusion construct as in Figure 2—figure supplement 1. The linker was cleaved with TEV protease and further purified. All samples used for structure determination had the linker similarly cleaved. (Orange) 1H-15N HSQC spectrum of a similar zebrafish fusion construct to that described in Figure 2—figure supplement 1A except that the TEV cleavage sequence was replaced with five additional amino acids from the natural FoxM1 sequence and the linker was uncleaved. While the overall spectrum has fewer peaks than that of the cleaved construct and the sample could not be used for structure determination, many peaks are in the same location or show a similar pattern to the cleaved protein. We note that some spectral differences may also be due to slight differences in temperature and buffer conditions for the samples (use of NaCl for the uncleaved fusion). While we cannot be certain that the structures are entirely similar, we conclude that the linker does not grossly perturb the structure.
Figure 2—figure supplement 3
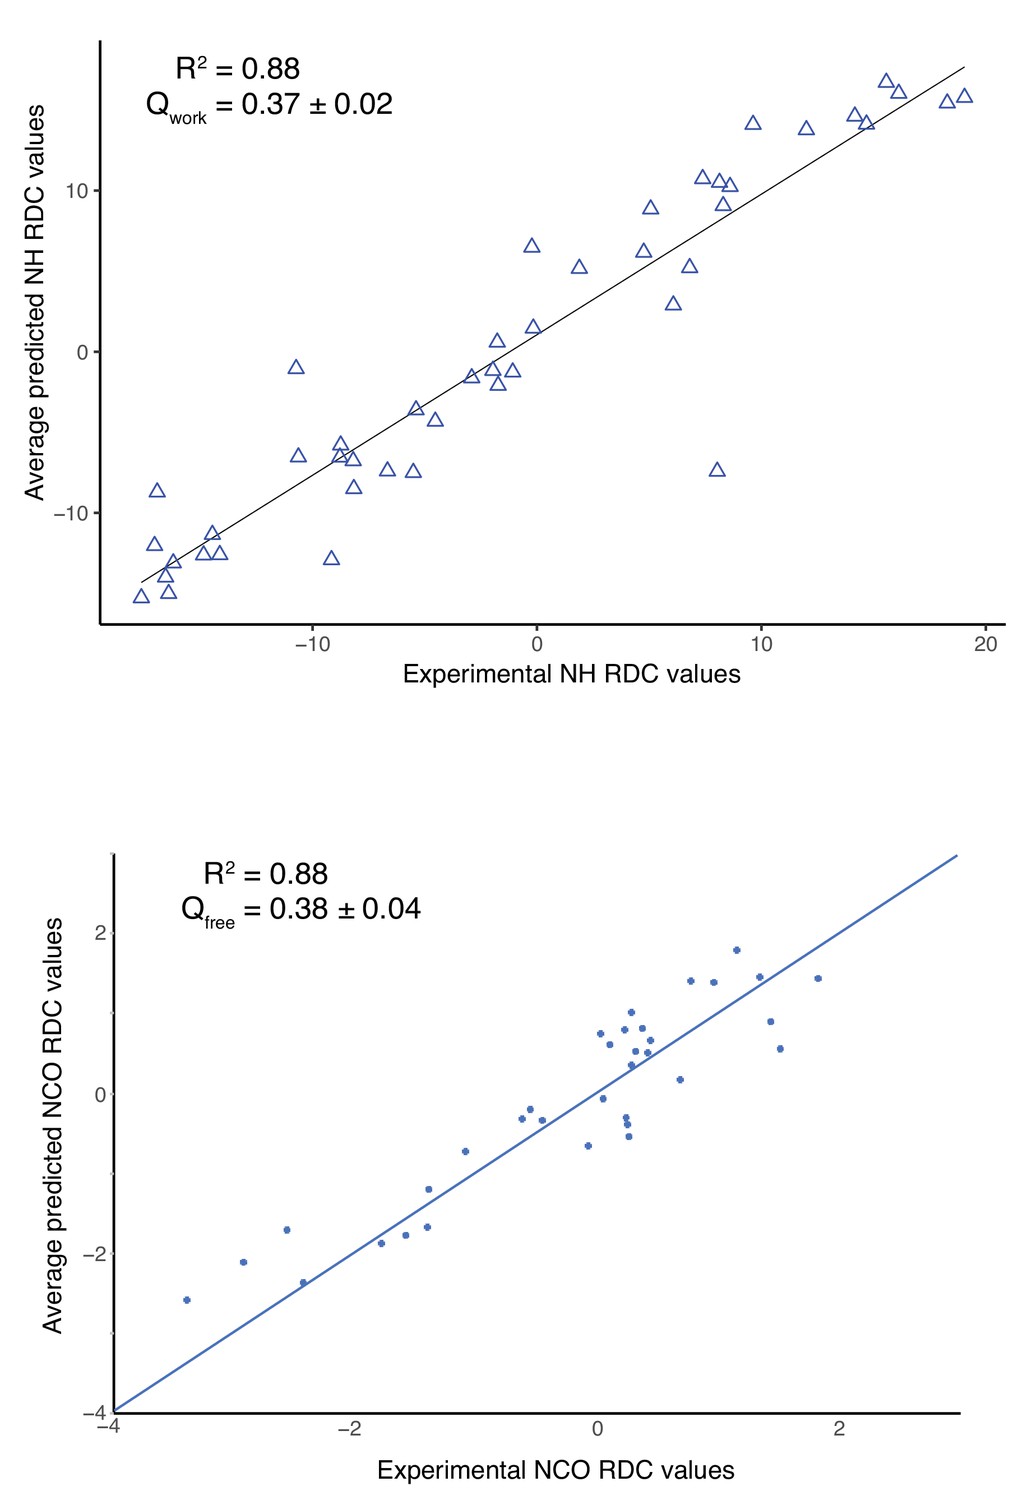
Correlation between the experimental and predicted RDC measurements of the NRD-TAD structural ensemble.
Plots show comparison between experimental and average predicted RDC values with a goodness of fit given by R2 value (a value of 1 indicates perfect fit) and Q factor (Cornilescu et al., 1998). The average predicted RDC values of the structural ensemble were calculated using Rosetta with the SVD (singular value decomposition) fit method for the residues 63–66, 69, 72–78, 80–99, 101–111, 113–114 (human sequence numbering). (A) Correlation of NH RDC values, which were used in the structure calculation. (B) Correlation of NCO RDC values. The NCO RDCs were not used in the structure calculation, so the correlation is an independent validation of the structural model. Note that the NH RDC values were measured using the ILV sample with (alanine mutations) but the NCO RDC values were calculated using the sample without alanine mutations (see Materials and methods and Figure 2—figure supplement 1).
Figure 3 with 1 supplement
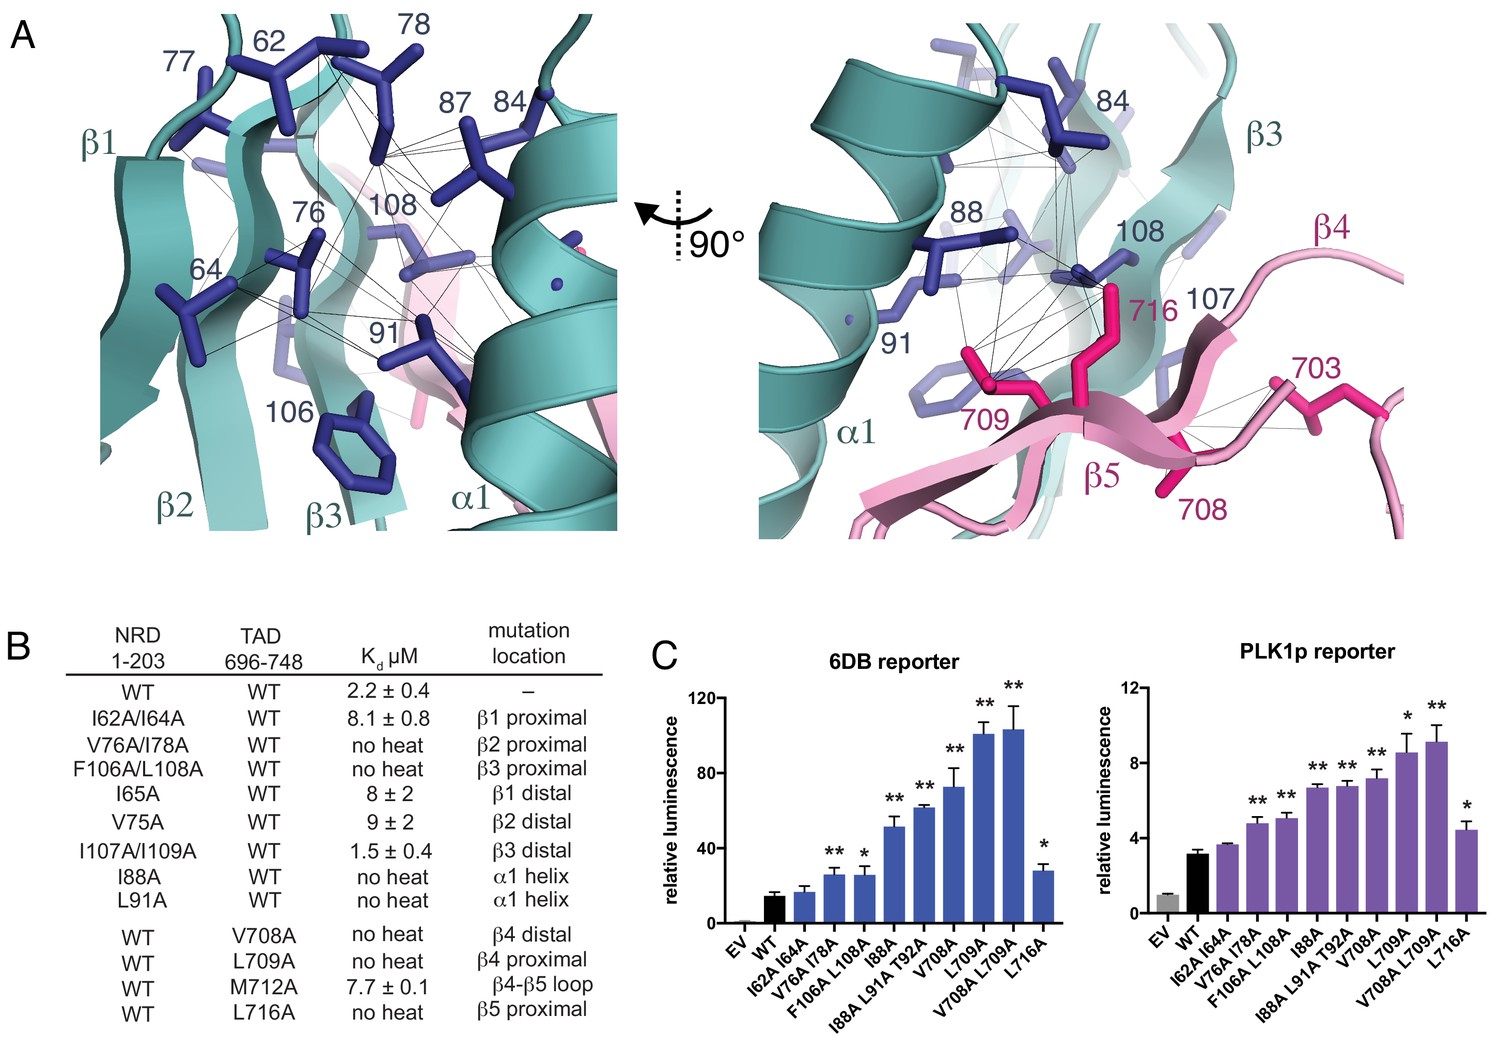
Interactions stabilizing the NRD-TAD hydrophobic core and interface.
(A) Hydrophobic sidechains forming the structural core of the NRD-TAD complex. Human amino acid numbering is indicated. Unambiguously assigned ILV methyl-methyl NOEs are shown as lines. (B) ITC measurements of the NRD-TAD binding affinity using the indicated WT or mutant domains. Mutations were chosen on the side of the β-sheet that is either proximal or distal to the α-helix. (C) Luciferase reporter assays of FoxM1 transactivation activity. Reporter plasmids containing the luciferase gene downstream of either six repeats of a FoxM1 responsive element (6DB, left) or the PLK1 promoter sequence (PLK1p, right) were co-transfected with WT or mutant FoxM1 into U2OS cells. EV is empty vector. Significant differences in the relative luminescence from WT are indicated with asterisks: *p<0.05, **p<0.01 (using two-tailed student’s t-test). For expression and cell cycle controls, see Figure 3—figure supplement 1.
Figure 3—figure supplement 1
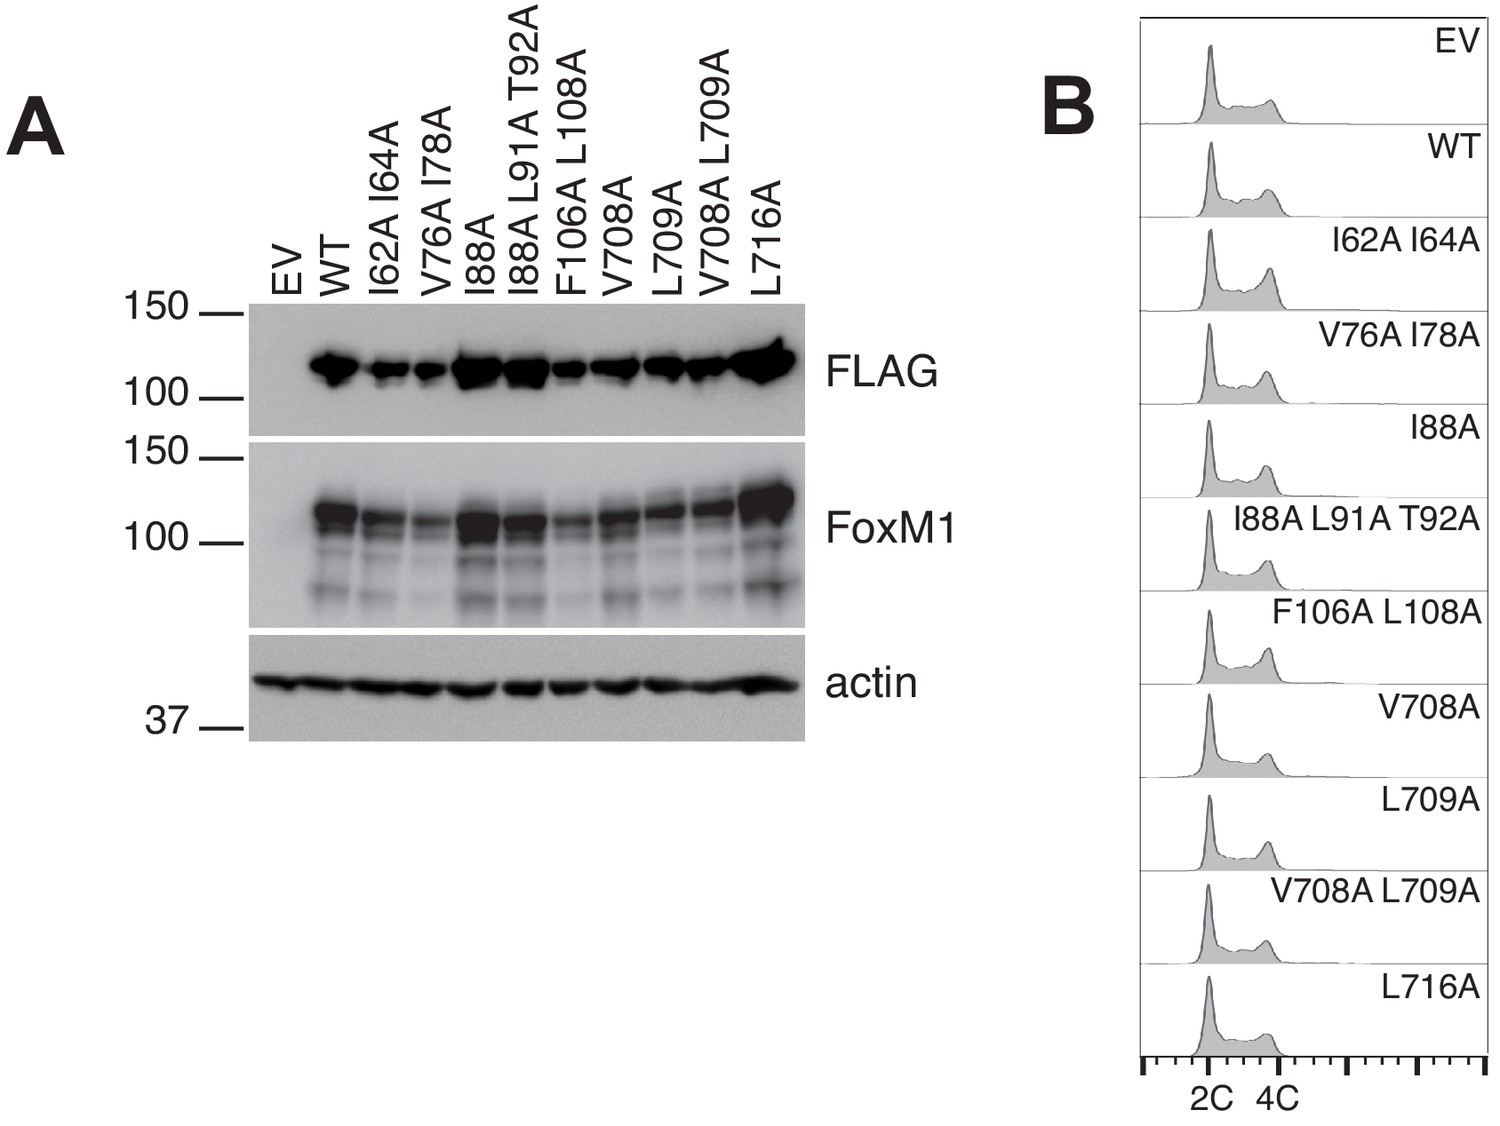
Data supporting luciferase transcription reporter assay.
(A) Western blots showing expression levels of FoxM1 following transfection of plasmid containing FLAG-tagged WT or the indicated mutant gene. Note that mutants with elevated activity (Figure 3C) are not expressed at levels higher than WT FoxM1. (B) FACS analysis of cells in (A) indicates that transient overexpression of WT or mutant FoxM1 protein does not perturb the cell cycle.
Figure 4 with 2 supplements
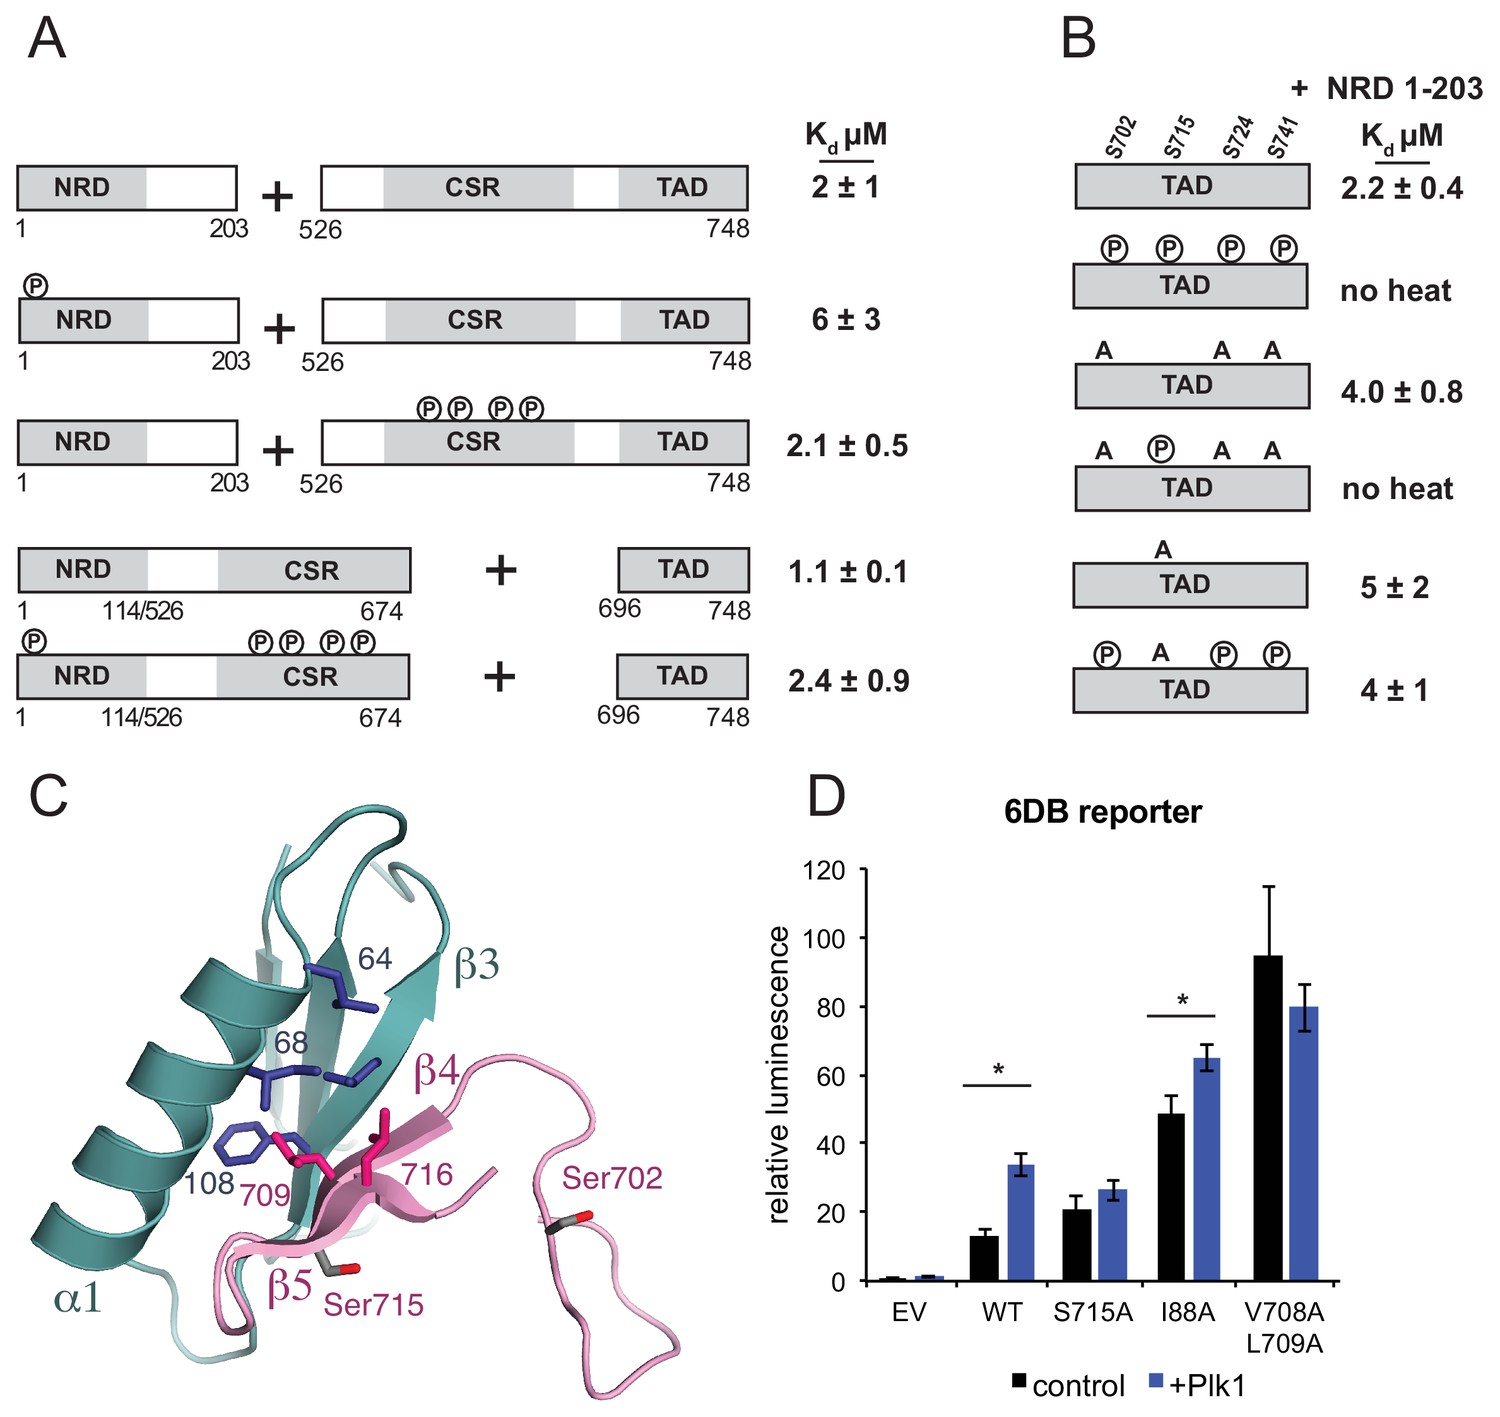
Plk1 phosphorylation of Ser715 inhibits NRD-TAD association.
(A) ITC binding affinities of NRD and TAD-containing FoxM1 fragments following Cdk phosphorylation as indicated. (B) ITC binding affinity of NRD (1–203) for WT TAD (696-748) and TAD containing mutations at Plk1 sites. Measurements were made with and without Plk1 phosphorylation. (C) Ser715 is near the interface in the NMR structure of the NRD-TAD complex. Human amino acid numbering is used. (D) Luciferase reporter expression from the 6DB promoter as in Figure 3C. Only experiments in which significant differences in the relative luminescence between expression of FoxM1 alone (control, black) or co-expression with Plk1 (purple) are indicated with asterisks (*p<0.05, using two-tailed student’s t-test).
Figure 4—figure supplement 1

Electrospray mass spectrometry characterization of kinase reactions.
(A) Purified NRD 1–203 without (left) and with (right) Cdk2-CycA phosphorylation. The construct has one highly conserved and strong Cdk consensus site ({S/T}Px{K/R}) at S4 and a less conserved weak consensus site ({S/T}P) at S35. The numbers in parentheses indicate the concluded number of added phosphoryl groups (+80 Da). (B) Purified CSR-TAD 526–748 without (left) and with Plk1 (middle) and Cdk2-CycA (right) phosphorylation. The human construct contains 34 potential serine phosphorylation sites for Plk1, which lacks a strong consensus. The CSR-TAD contains three strong (T585, T596, S657) and six weak (T595, T612, S623, T647, S678, S689) Cdk consensus sites. Four of these total consensus sites (T585, T596, S623, and T647) are conserved in all five of the orthologs used in the sequence alignment in Figure 2A. (C) Purified TAD 696–748 without (left) and with Plk1 (right) phosphorylation. The TAD construct has only five serines, and we observe quantitative phosphorylation on four sites. (D,E) Plk1 phosphorylation of a S715A mutant TAD results in three additional phosphoryl groups, while Plk1 phosphorylation of a S702A/S724A/S741A mutant TAD results in one additional phosphoryl group. From these and similar mutagenesis experiments, we conclude that Plk1 phosphorylated the TAD on S702, S715, S724, and S741.
Figure 4—figure supplement 2
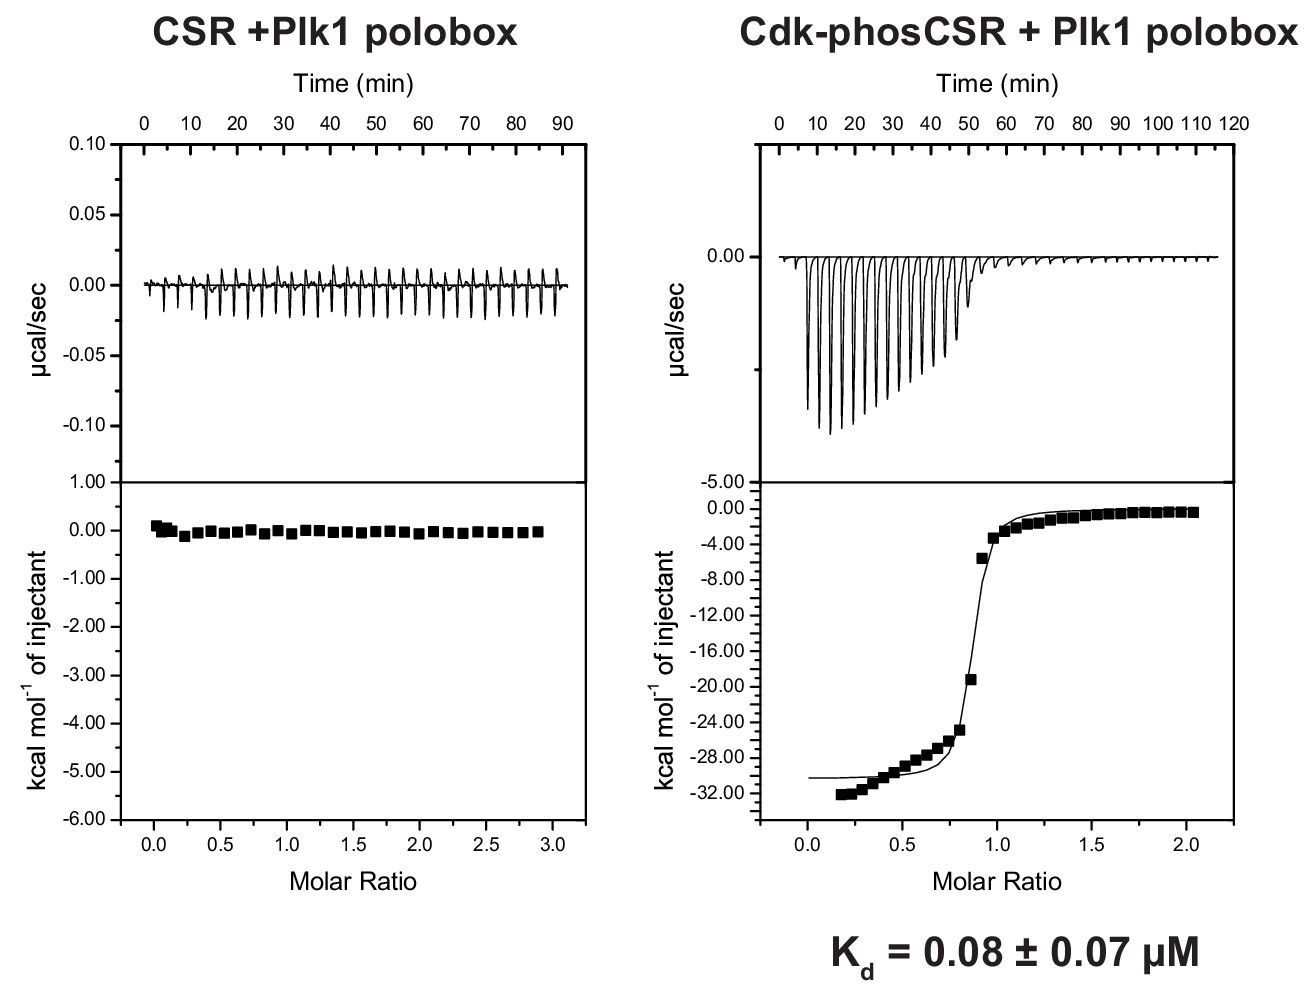
Phosphorylation dependent CSR association with the Plk1 polobox domain.
ITC measurements of FoxM1 CSR (residues 573–635) titrated into Plk1 polobox (residues 345–603). Left is without CSR phosphorylation and right is CSR treated with Cdk2-CycA.
Figure 5 with 2 supplements
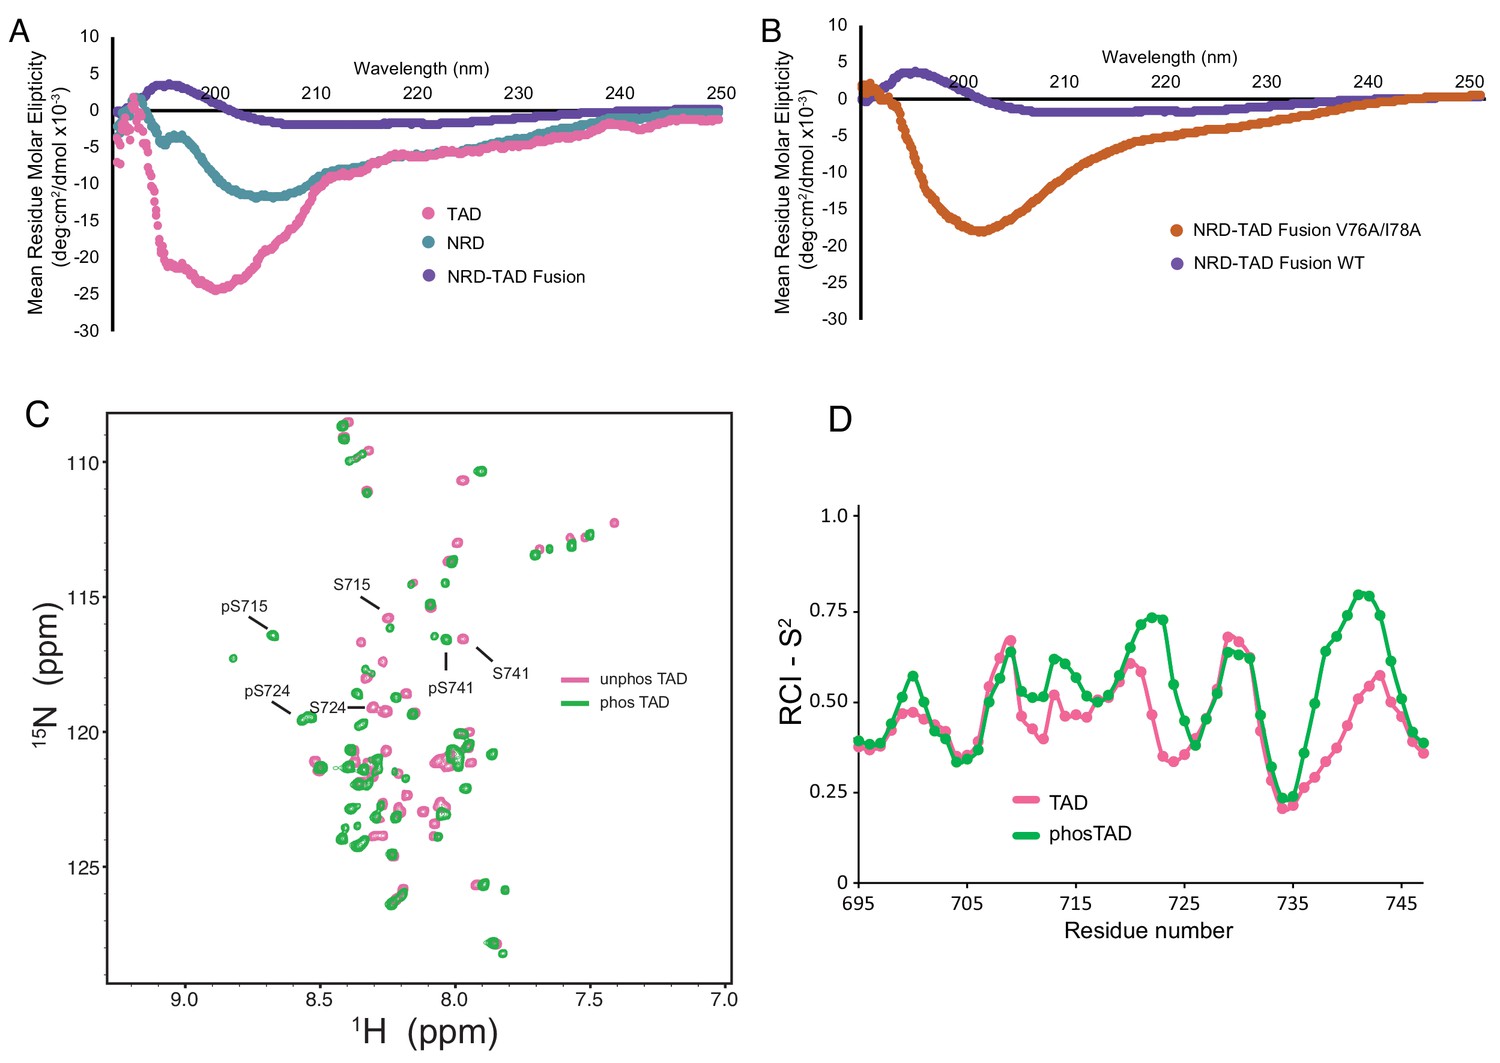
The dissociated NRD and TAD domains are intrinsically disordered.
(A, B) CD spectra of the indicated purified proteins. (C) 2D 1H-15N HSQC spectra of the zebrafish FoxM1 TAD (corresponding to residues 696–748 in the human protein) either unphosphorylated (pink) or phosphorylated (green) recorded at 25°C at 800 MHz. Sequence specific assignments (examples shown for three Plk1-phosphorylated serines) were made using backbone triple resonance correlation spectra. (D) RCI-S2 order parameter plot of assigned residues in the free TAD and Plk1-phosphorylated TAD.
Figure 5—figure supplement 1
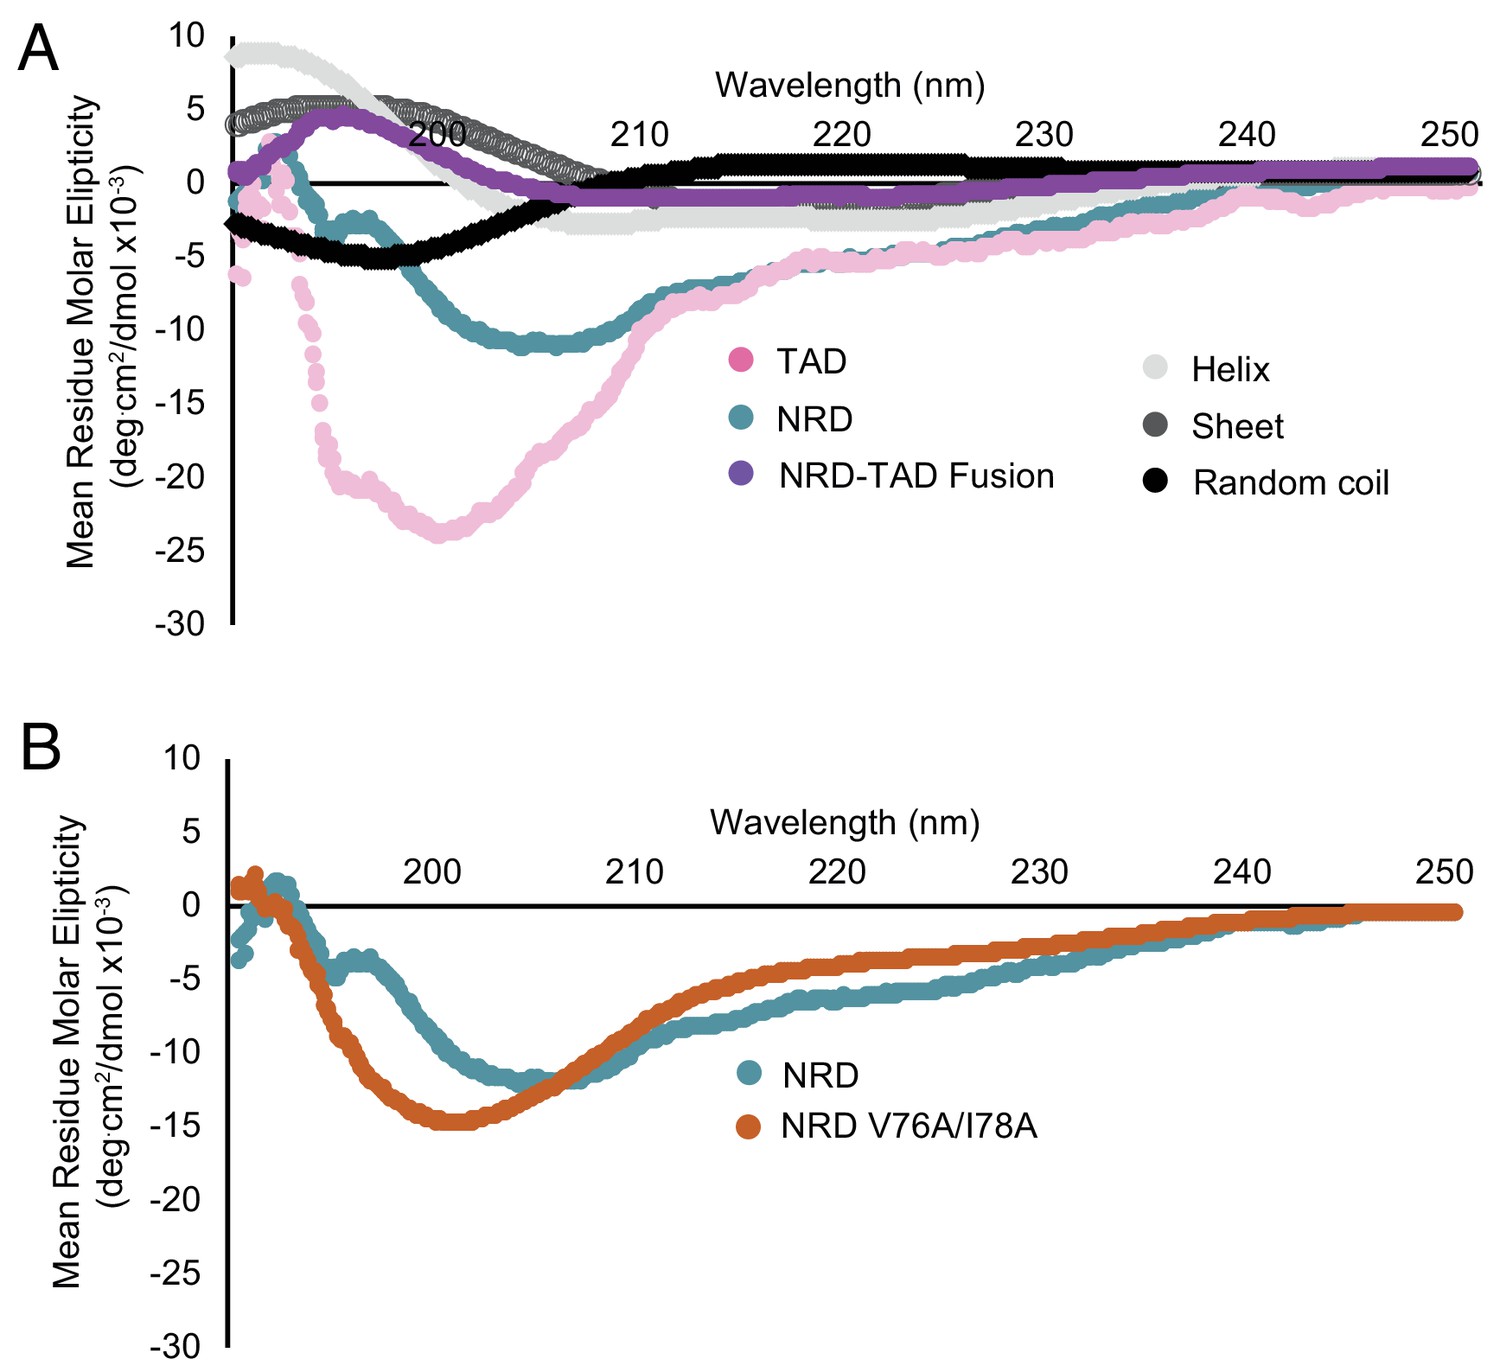
Additional circular dichroism measurements reporting the structural order of the associated NRD-TAD complex and disorder of the isolated TAD and NRD domains.
(A) Same spectra as in Figure 5A but overlaid with comparison spectra for different secondary structures. The comparison spectra were measured for poly-L-lysine, which adopts the different secondary structures depending on pH and temperature (Greenfield and Fasman, 1969). (B) CD spectra for the NRD (1-114) alone compared to the NRD containing the V76A/I78A mutation. The same mutation appears to disorder the NRD-TAD fusion protein (Figure 5B), but has only a modest effect on the NRD alone.
Figure 5—figure supplement 2
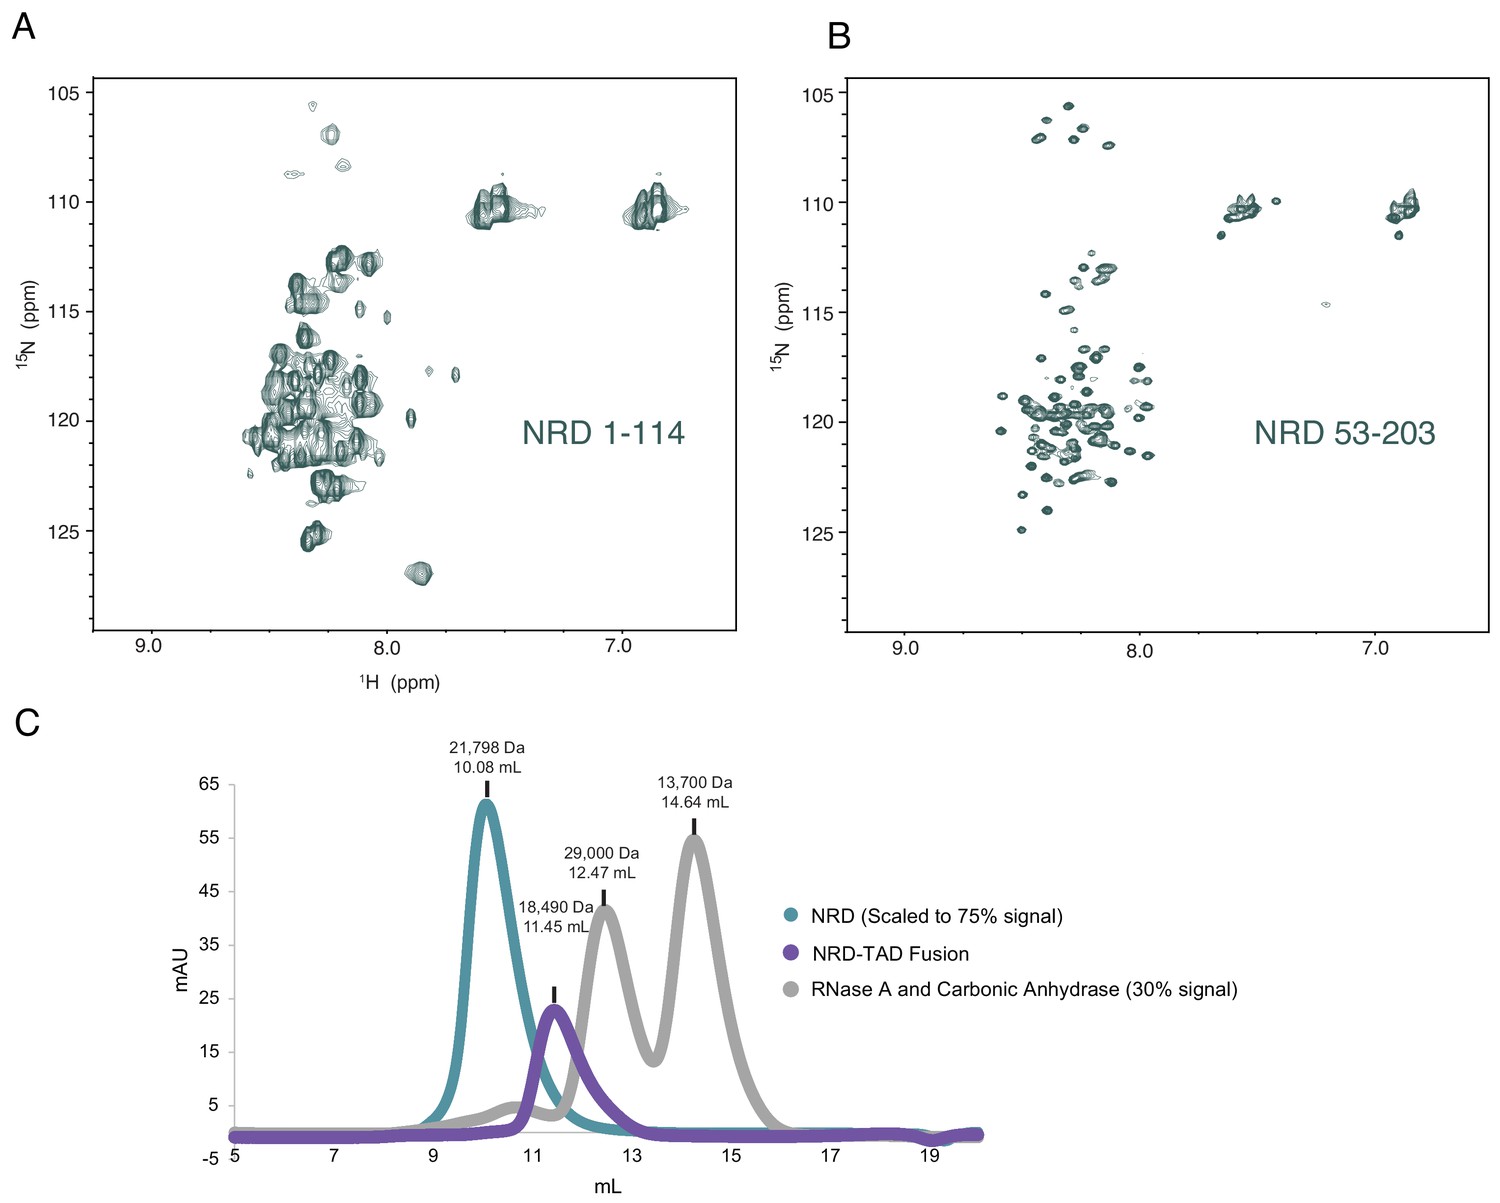
Additional data supporting the conclusion that the isolated NRD is highly disordered.
(A and B) 1H-15N HSQC spectra of purified NRD 1–114 and 53–203 constructs. The poor 1H chemical shift dispersion is consistent with structural disorder. Both spectra also have missing resonances that are likely from aggregation-induced broadening in certain regions of the protein. (C) UV absorption traces of three chromatographic elutions from a Superdex 75 size-exclusion column. Comparison of the NRD, the NRD-TAD fusion (1-117/694-748), and two standard globular proteins. Both the NRD and fusion elute in earlier fractions than expected based on their molecular weights, suggesting larger hydrodynamic radii than the standard globular proteins due to structural disorder. Notably, despite their similar molecular weight, the fusion elutes earlier, consistent with a more compact structure.
Figure 6 with 2 supplements

Direct binding of NRD-released TAD to CBP/p300.
(A) Raw ITC data and the calculated affinities of FoxM1 TAD (696-748) binding to the KIX, TAZ1, and TAZ2 domains of CBP. (B) Affinities of WT and I88A NRD-TAD fusion for TAZ2. (C and D) ITC affinities of the indicated FoxM1 construct for TAZ2. Where indicated, the purified CSR-TAD domain was phosphorylated with Plk1 or Cdk2-CycA prior to the affinity measurement. All values from the ITC data fitting are listed in Supplementary file 1.
Figure 6—figure supplement 1
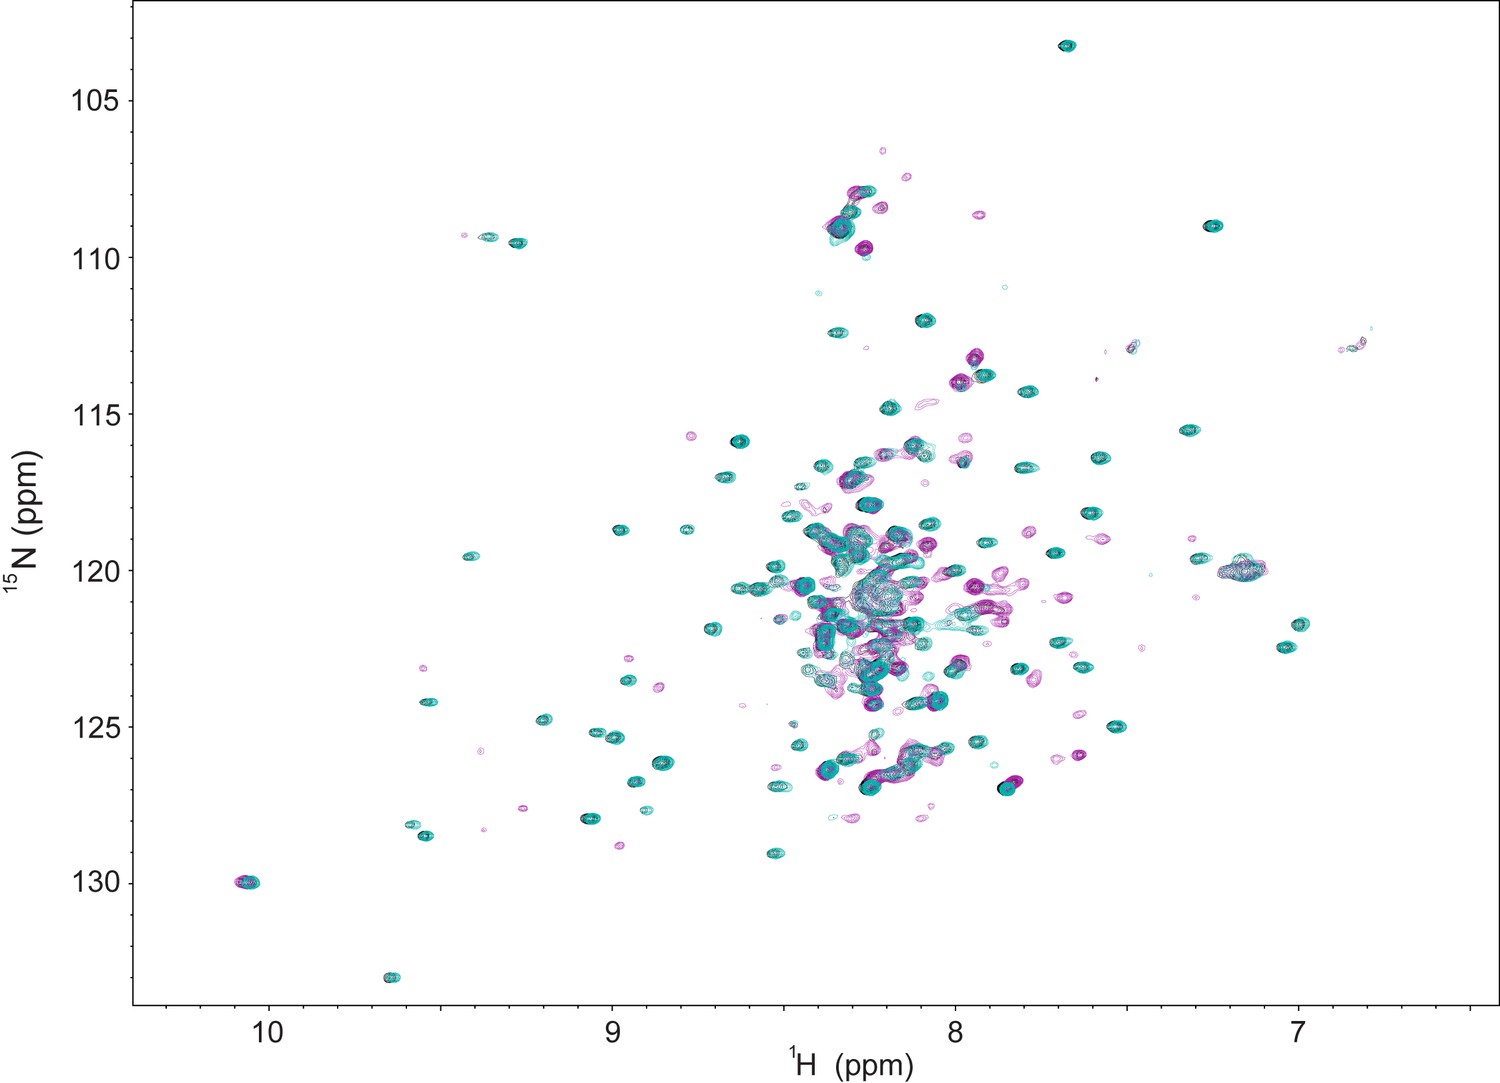
NMR data indicating weak association between CBP TAZ2 and the cleaved NRD-TAD fusion.
1H-15N HSQC spectra of 100 μM purified 15N-labeled zebrafish cleaved NRD-TAD fusion (see Figure 2—figure supplement 1 for construct details) in the absence (teal) or presence of equimolar (black) or 5-fold excess (magenta) unlabeled TAZ2 domain. While there are few spectral changes upon addition of 100 μM TAZ2, we do observe some chemical shift changes and peak broadening upon addition of 500 μM TAZ2. From these date we estimate the binding affinity of TAZ2 for unphosphorylated fusion as Kd ~0.1–1 mM. The observation that TAZ2 binds at high concentration indicates that the TAD is in an equilibrium between a sequestered and accessible state even when FoxM1 is unphosphorylated and that phosphorylation shifts the equilibrium.
Figure 6—figure supplement 2
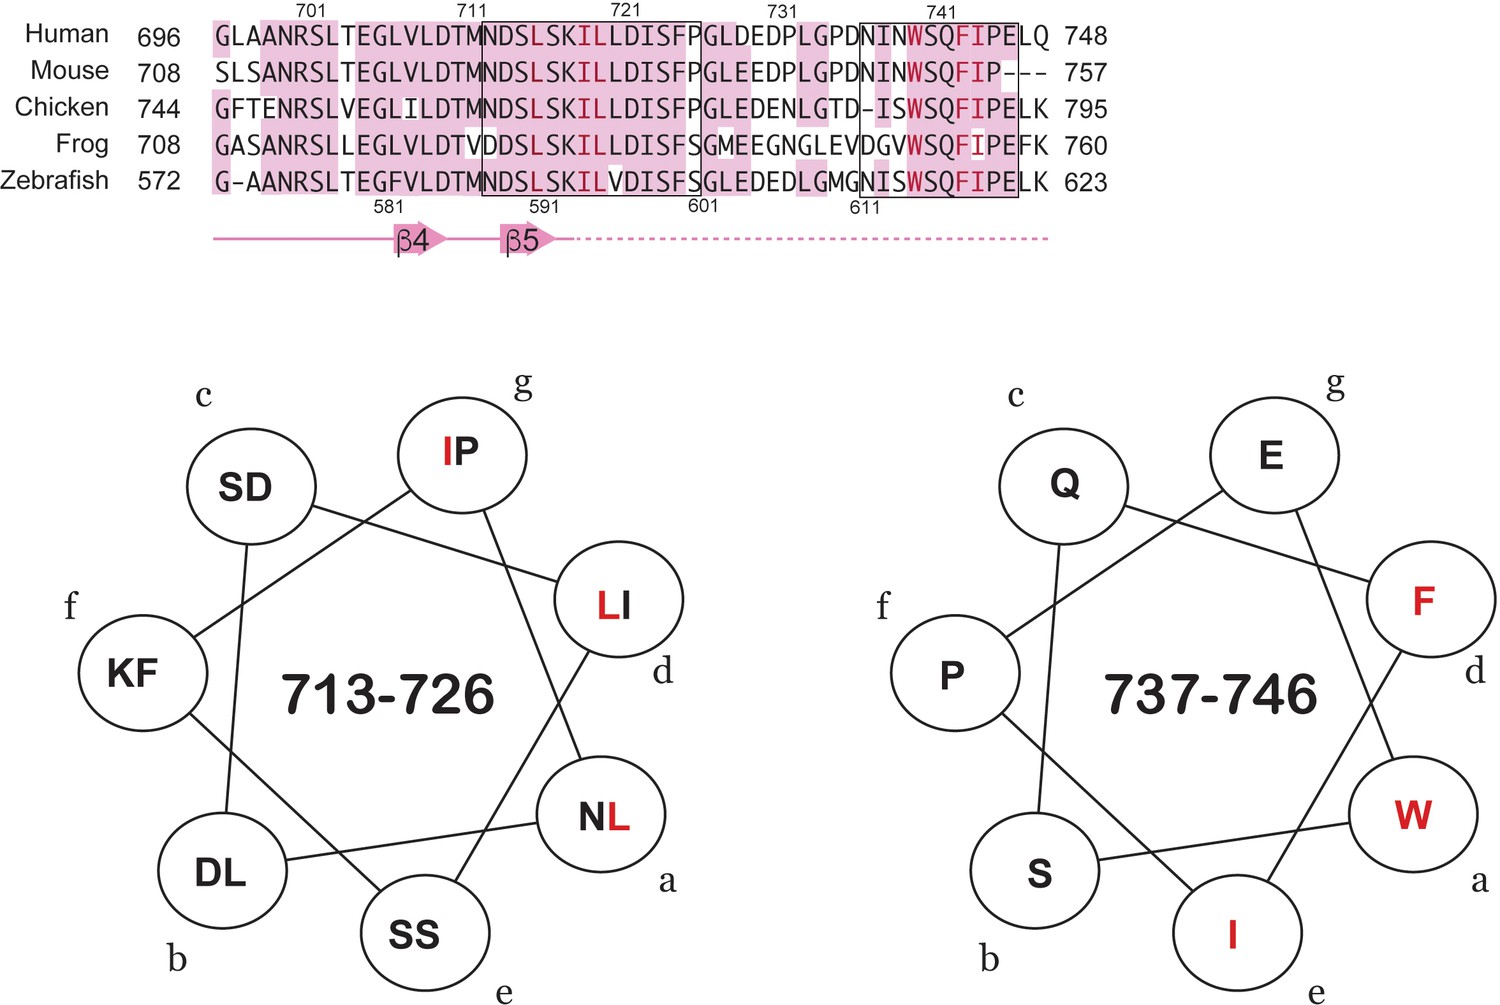
Predicted short amphipathic helices in the TAD.
Two sequences in the TAD (713-726 and 737-746, boxed in the top alignment) have sidechain patterns that are consistent with amphipathic helices. The model helical wheel projections show in red the XX motif clustering to one face of the helix. This motif is found in many TAD sequences that bind CBP/p300.
Figure 7
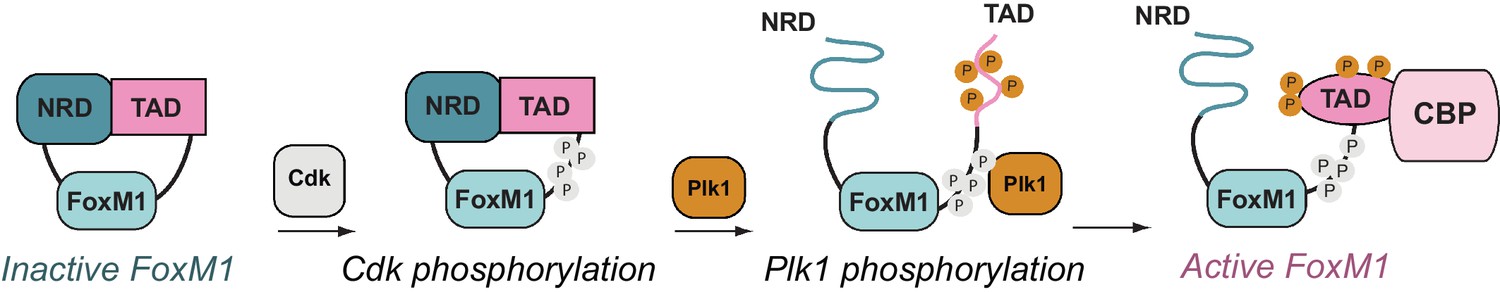
FoxM1 activation through conformational switching of the transactivation domain (TAD).
(Left) Autoinhibited conformation, in which the TAD binds the negative regulatory domain (NRD) as a β-hairpin. (Center) Cyclin-dependent kinase (Cdk) phosphorylation (gray) creates a docking site for the Plk1 kinase, which phosphorylates the TAD and induces TAD release from the NRD. Both the NRD and TAD become structurally disordered upon dissociation. (Right) The phosphorylated TAD adopts a helical fold and recruits the coactivator CBP.
Tables
Key resources table
| Reagent type (species) or resource | Designation | Source or reference | Identifiers | Additional information |
|---|---|---|---|---|
| Cell line (human) | U2OS | other | RRID:CVCL_0042 | Paul Kaufman (UMass Medical School) |
| Antibody | anti-FoxM1, rabbit polyclonal | Bethyl | cat #: A301-533A-M | (1:2000) |
| Antibody | anti-actin, mouse monoclonal | Sigma | cat #: A1978 | (1:100,000) |
| Antibody | anti-Flag, mouse monoclonal | Sigma | cat #: F1804 | (1:500) |
| Recombinant DNA reagent | PGEX 4 T-3 | Addgene | Engineered to contain TEV protease site. | |
| Recombinant DNA reagent | pFastBac HTB | Addgene | ||
| Recombinant DNA reagent | pET-14B | Addgene | Engineered to contain TEV protease site | |
| Recombinant DNA reagent | pRcCMV myc-Plk1 | Addgene; PMID: 7962193 | Erich Nigg | |
| Recombinant DNA reagent | pGL3-6DB | PMID: 22094256 | Peter Sicinski (Dana Farber Cancer Institute) | |
| Recombinant DNA reagent | pGL3-PLK1 | PMID: 22094256 | Peter Sicinski (Dana Farber Cancer Institute) | |
| Recombinant DNA reagent | pCDNA3-FOXM1C | PMID: 22094256 | Peter Sicinski (Dana Farber Cancer Institute) | |
| Recombinant DNA reagent | pCDNA3-FOXM1C-I62A I64A | this paper | mutation cloned into pCDNA3-FOXM1C | |
| Recombinant DNA reagent | pCDNA3-FOXM1C-V76A I78A | this paper | mutation cloned into pCDNA3-FOXM1C | |
| Recombinant DNA reagent | pCDNA3-FOXM1C-I88A | this paper | mutation cloned into pCDNA3-FOXM1C | |
| Recombinant DNA reagent | pCDNA3-FOXM1C -I88A L91A T92A | this paper | mutation cloned into pCDNA3-FOXM1C | |
| Recombinant DNA reagent | pCDNA3-FOXM1C -F106A L108A | this paper | mutation cloned into pCDNA3-FOXM1C | |
| Recombinant DNA reagent | pCDNA3-FOXM1C-V723A | this paper | mutation cloned into pCDNA3-FOXM1C | |
| Recombinant DNA reagent | pCDNA3-FOXM1C-L724A | this paper | mutation cloned into pCDNA3-FOXM1C | |
| Recombinant DNA reagent | pCDNA3-FOXM1C -V723A L724A | this paper | mutation cloned into pCDNA3-FOXM1C | |
| Recombinant DNA reagent | pCDNA3-FOXM1C-L731A | this paper | mutation cloned into pCDNA3-FOXM1C | |
| Recombinant DNA reagent | pCDNA3-FOXM1C-S730A | this paper | mutation cloned into pCDNA3-FOXM1C | |
| Recombinant DNA reagent | pCDNA3 | Invitrogen | ||
| Recombinant DNA reagent | pCMV-Renilla | this paper | Renilla luciferase cloned into CMV promoter expression vector | |
| Software, algorithm | RASREC-Rosetta for structure calculations | https://csrosetta.chemistry.ucsc.edu |
Additional files
-
Supplementary file 1
Summary of ITC data fitting.
- https://doi.org/10.7554/eLife.46131.019
-
Supplementary file 2
NMR restraints and structural statistics for NRD-TAD structural ensemble.
- https://doi.org/10.7554/eLife.46131.020
-
Transparent reporting form
- https://doi.org/10.7554/eLife.46131.021
Download links
A two-part list of links to download the article, or parts of the article, in various formats.
Downloads (link to download the article as PDF)
Open citations (links to open the citations from this article in various online reference manager services)
Cite this article (links to download the citations from this article in formats compatible with various reference manager tools)
An order-to-disorder structural switch activates the FoxM1 transcription factor
eLife 8:e46131.
https://doi.org/10.7554/eLife.46131


