Identification of potential biomarkers of vaccine inflammation in mice
- Imperial College London, United Kingdom
- Max Planck Institute for Infection Biology, Germany
- Imperial College Healthcare NHS Trust, Hammersmith Hospital, United Kingdom
- GSK, United States
- GSK, Italy
Figures
Figure 1
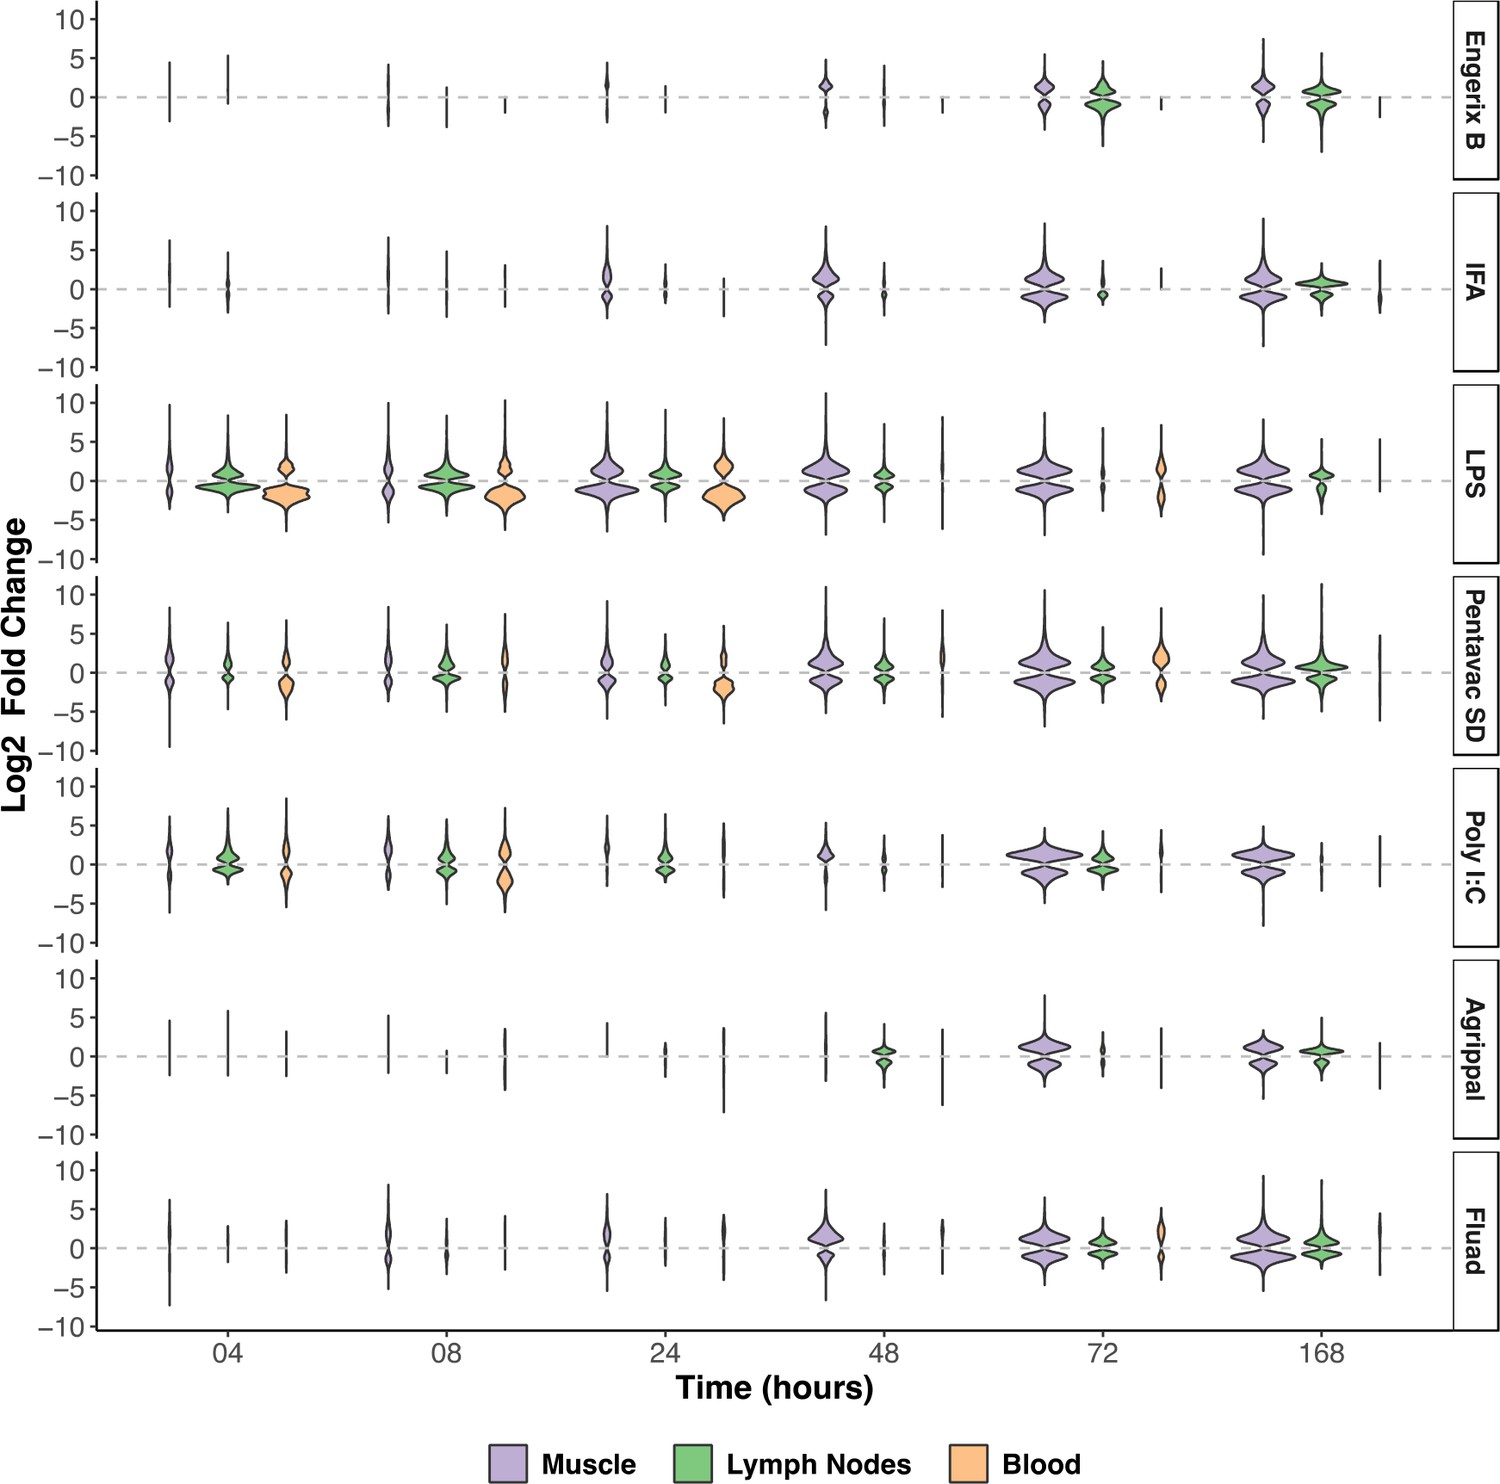
Overview of the transcriptomic responses to the injected vaccines and TLR agonists in the injected muscle, the draining lymph nodes (MLN), and the blood.
The width of each violin is scaled to the number of genes that are differentially expressed at each given time point (BH-adjusted p-value <0.01). Differentially expressed genes were defined as those with a significant (BH-adjusted p-value <0.01) change in expression in a vaccinated group, when compared to the unvaccinated group and the saline group at a given time point. The upregulated or downregulated differentially expressed genes (Log2 fold-change) are presented for each tissue sampled and at each timepoint after injection of the vaccine or TLR agonist (n = 5 mice per timepoint). The vaccines or TLR agonists that were used are indicated on the right of the figure. IFA, incomplete Freunds adjuvant; LPS, lipopolysaccharide.
Figure 2 with 3 supplements
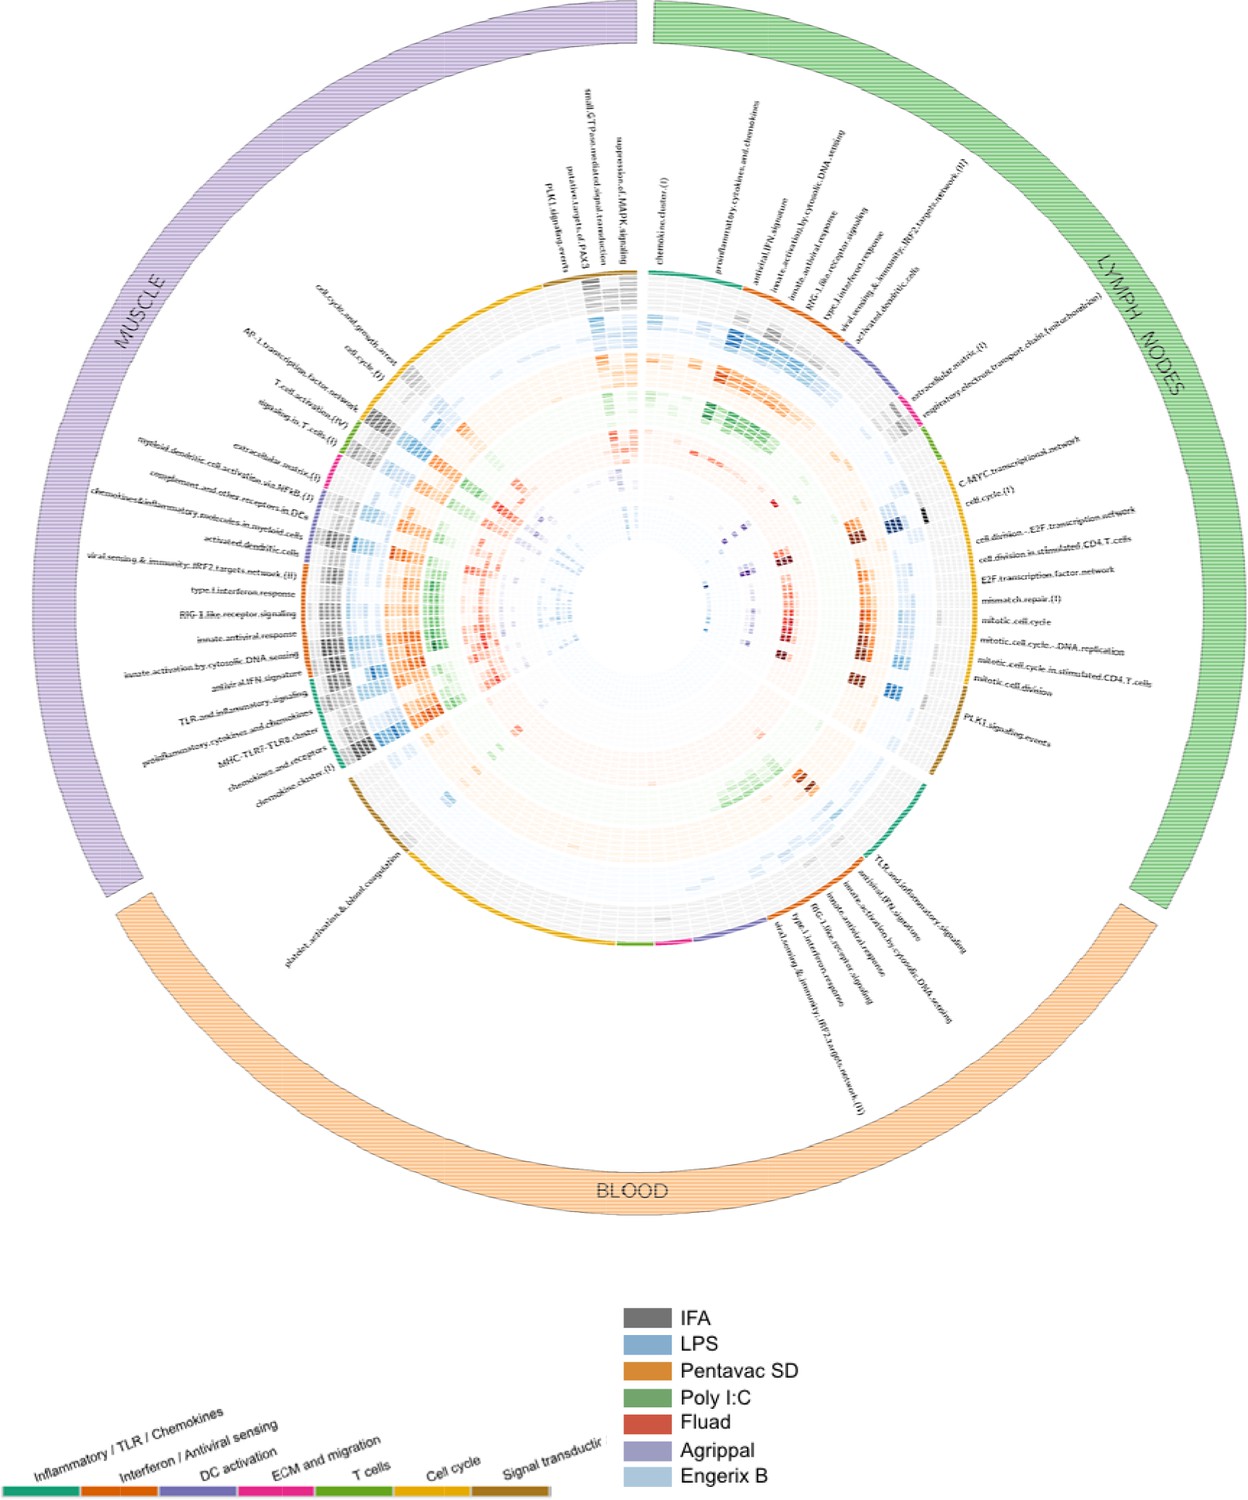
Gene-set enrichment analysis reveals distinct mechanisms of transcriptional response to the injected vaccines and TLR agonists.
Tissue data sets are presented as three coloured segments along the perimeter for the injected muscle (purple), the draining lymph nodes (green), and the blood compartment (red). An ordered list of blood transcriptional modules is labelled inside the outermost perimeter. Coloured bands adjacent to the module names correspond to the vaccines and Toll-like receptor (TLR) agonists (outside to inside bands): incomplete Freunds adjuvant (IFA) (grey), lipopolysaccharide (LPS) (blue), Pentavac SD (orange), Poly I:C (green), Fluad (red), Agrippal (purple), and Engerix (blue). For each band, there are six rings corresponding to time points 4, 8, 24, 48, 72, 168 hr (from outer to inner ring). The intensity of colours indicates the significance of the enrichment. Only modules with p-value for enrichment of <10−6 and an effect size (AUC) >0.8 are shown. DC, dendritic cell; ECM, extracellular matrix.
Figure 2—figure supplement 1
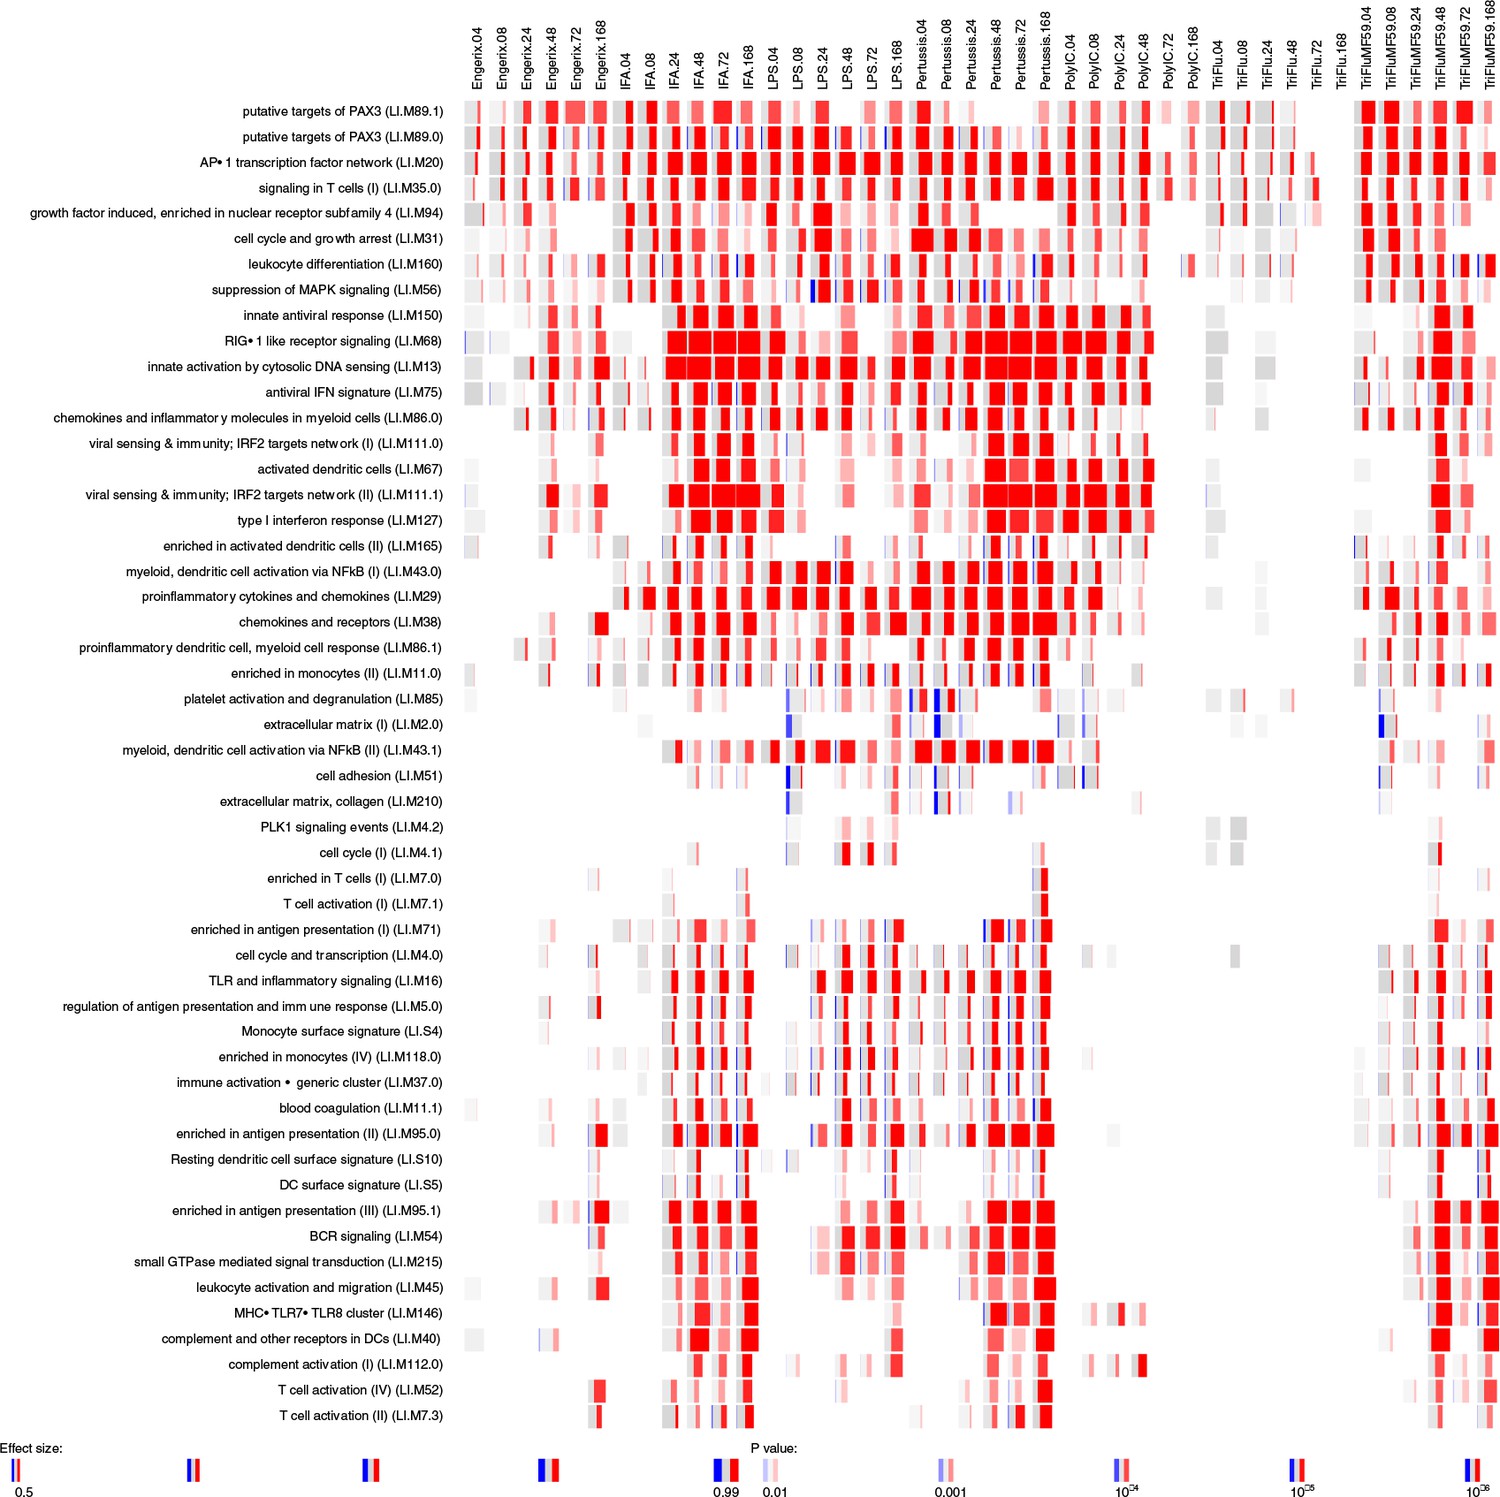
Gene-set enrichment analysis in the muscle data set.
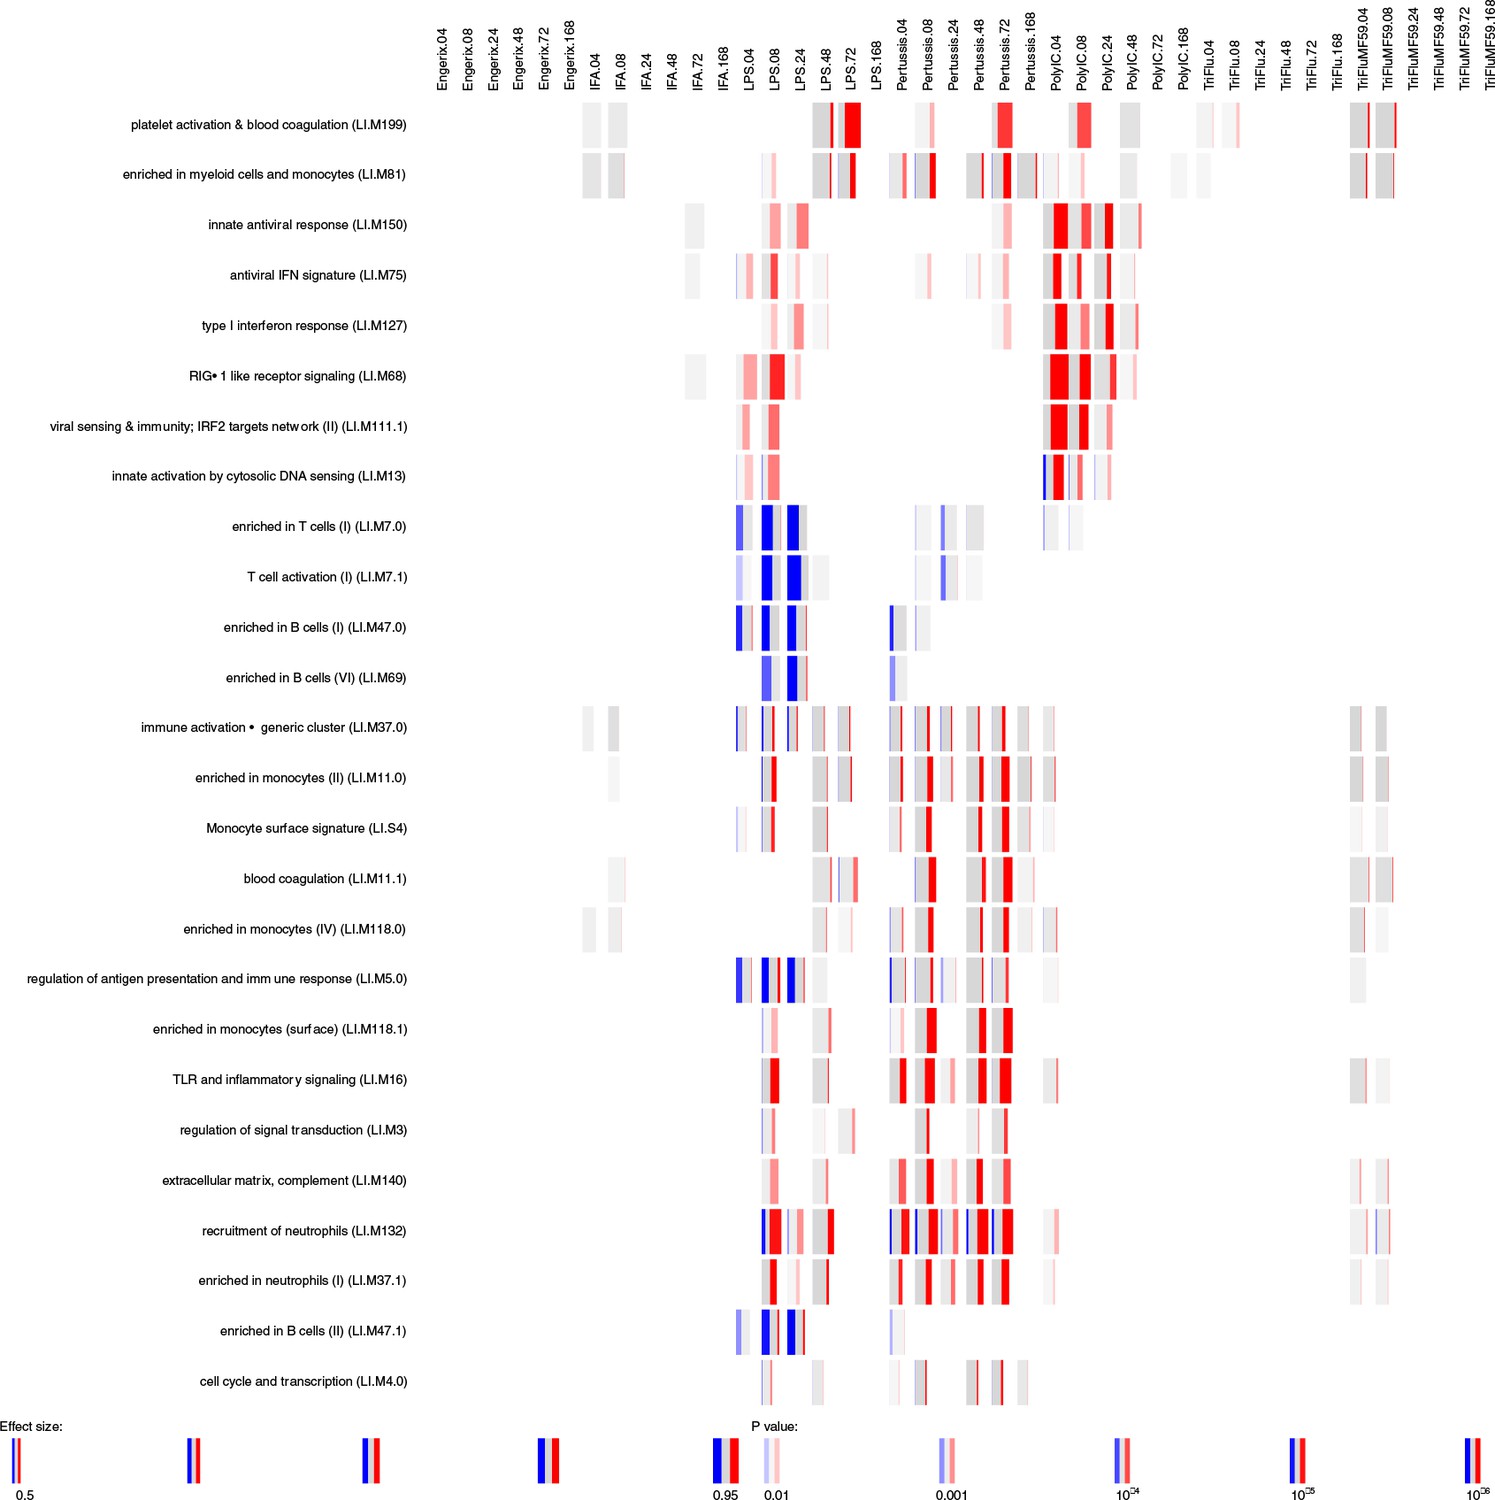
Enrichment scores were calculated for blood transcriptional modules defined by Li et al. (2014) using R package tmod (version 0.34) (US National Library of Medicine, 2004). The modules (in rows) are described by the titles followed by the original IDs. Each column corresponds to a different vaccine, TLR agonist or adjuvant and a different time point. The size of each miniature graphic shows how strong the enrichment is. The intensity of the colours indicates the p-value (stronger colours indicate lower p-values). The amount of colour shows the fraction of genes in each module that are significantly up- (red) or downregulated (blue). Only the modules with a p-value for the enrichment that is lower than 10−6 and an effect size of the gene-set enrichment (area under the curve (AUC)) greater than 0.5 are shown.
Figure 2—figure supplement 2
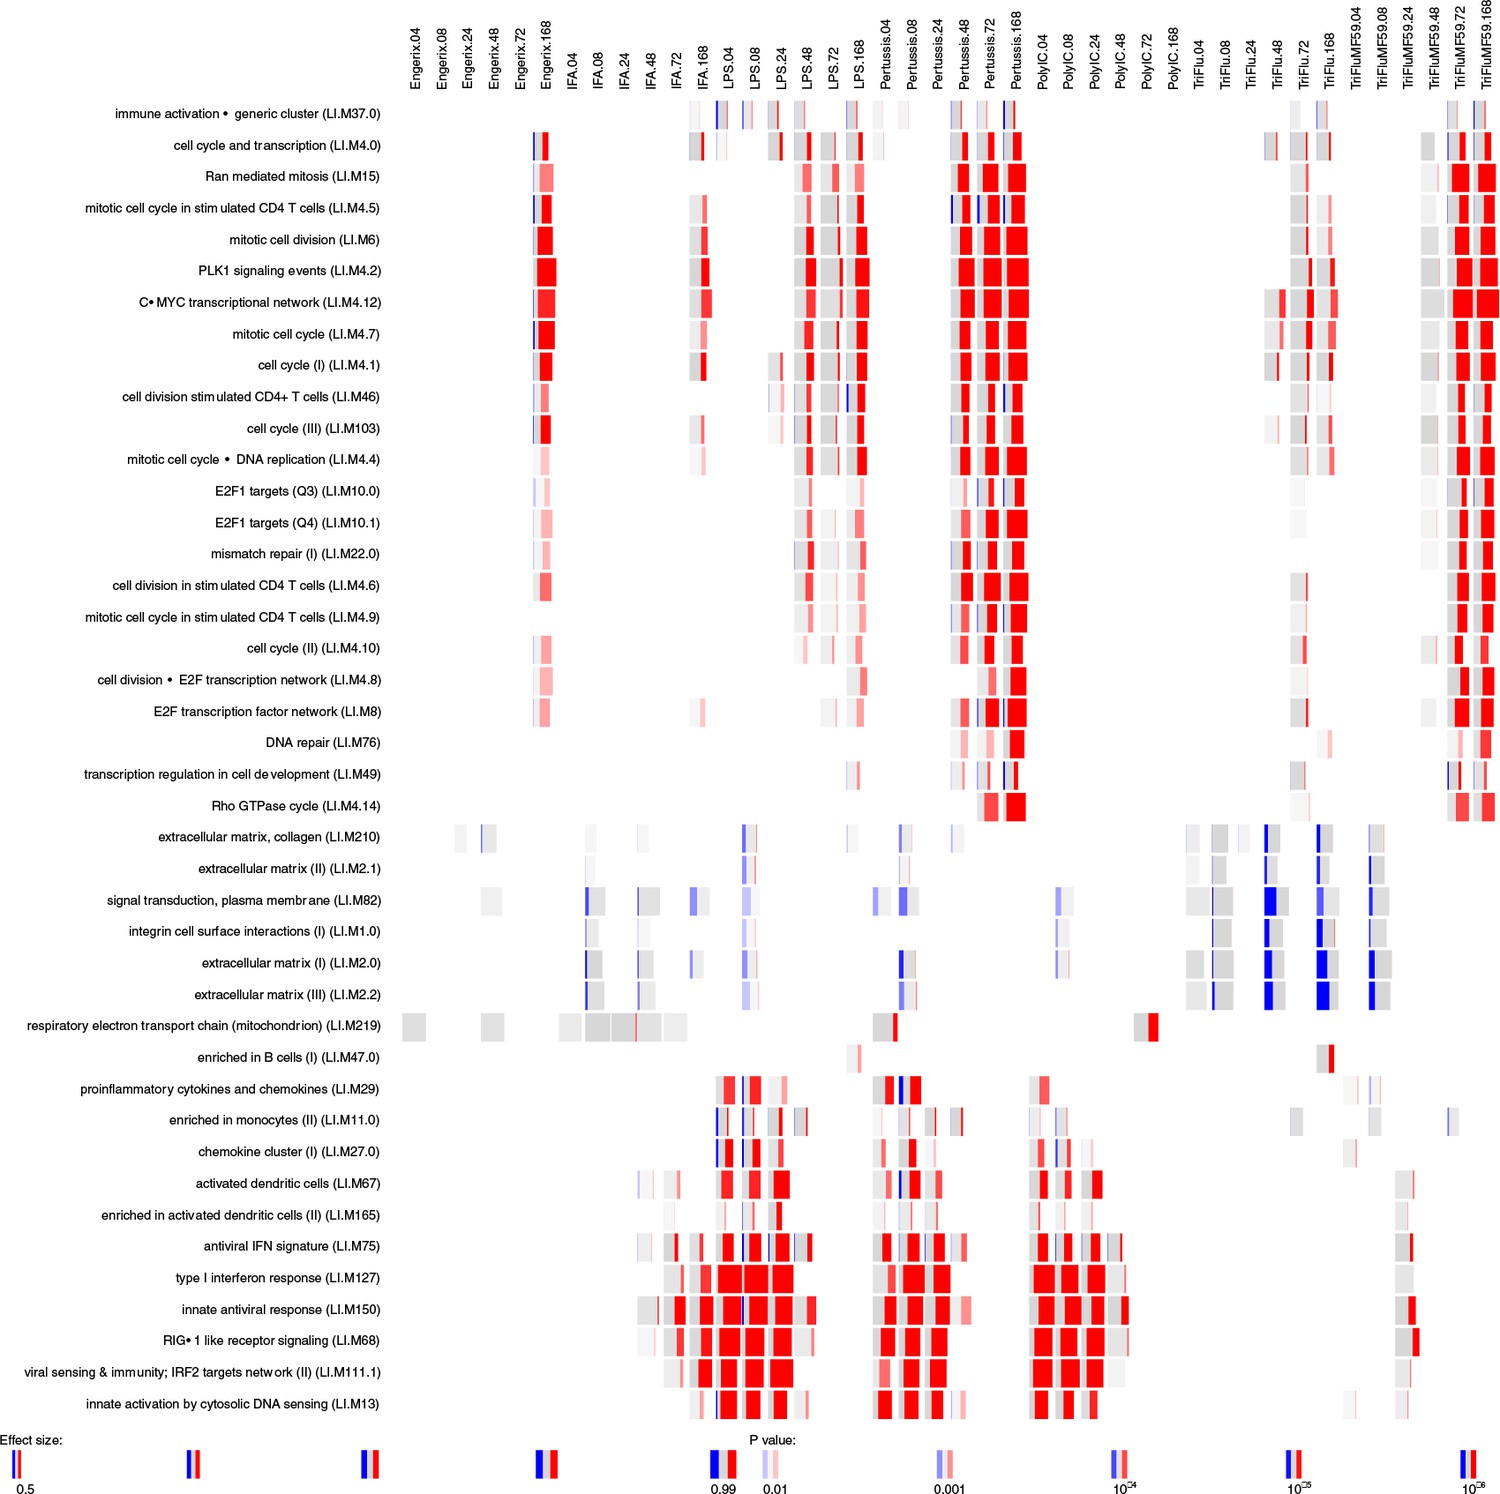
Gene-set enrichment analysis in the draining lymph nodes data set.
Enrichment scores were calculated for blood transcriptional modules defined by Li et al. (2014) using R package tmod (version 0.34) (US National Library of Medicine, 2004). The modules (in rows) are described by the titles followed by the original IDs. Each column corresponds to a different vaccine, TLR agonist or adjuvant and a different time point. The size of each miniature graphic shows how strong the enrichment is. The intensity of the colours indicates the p-value (stronger colours indicate lower p-value). The amount of colour shows the fraction of genes in each module that are significantly up- (red) or downregulated (blue). Only the modules with a p-value for the enrichment of <10−6 and an effect size of the gene set enrichment (AUC) >0.5 are shown.
Figure 2—figure supplement 3
Gene-set enrichment analysis in blood data set.
Enrichment scores were calculated for blood transcriptional modules defined by Li et al. (2014) using R package tmod (version 0.34) (US National Library of Medicine, 2004). The modules (in rows) are described by the titles followed by the original IDs. Each column corresponds to a different vaccine, TLR agonist or adjuvant and to a different time point. The size of each miniature graphics shows how strong the enrichment is. The intensity of the colours indicates the p-value (stronger colours lower p-value). The amount of colour shows the fraction of genes in each module that are significantly up- (red) or downregulated (blue). Only the modules with p-value for enrichment of <10−6 and an effect size of for the gene-set enrichment (AUC)of >0.5 are shown.
Figure 3 with 1 supplement
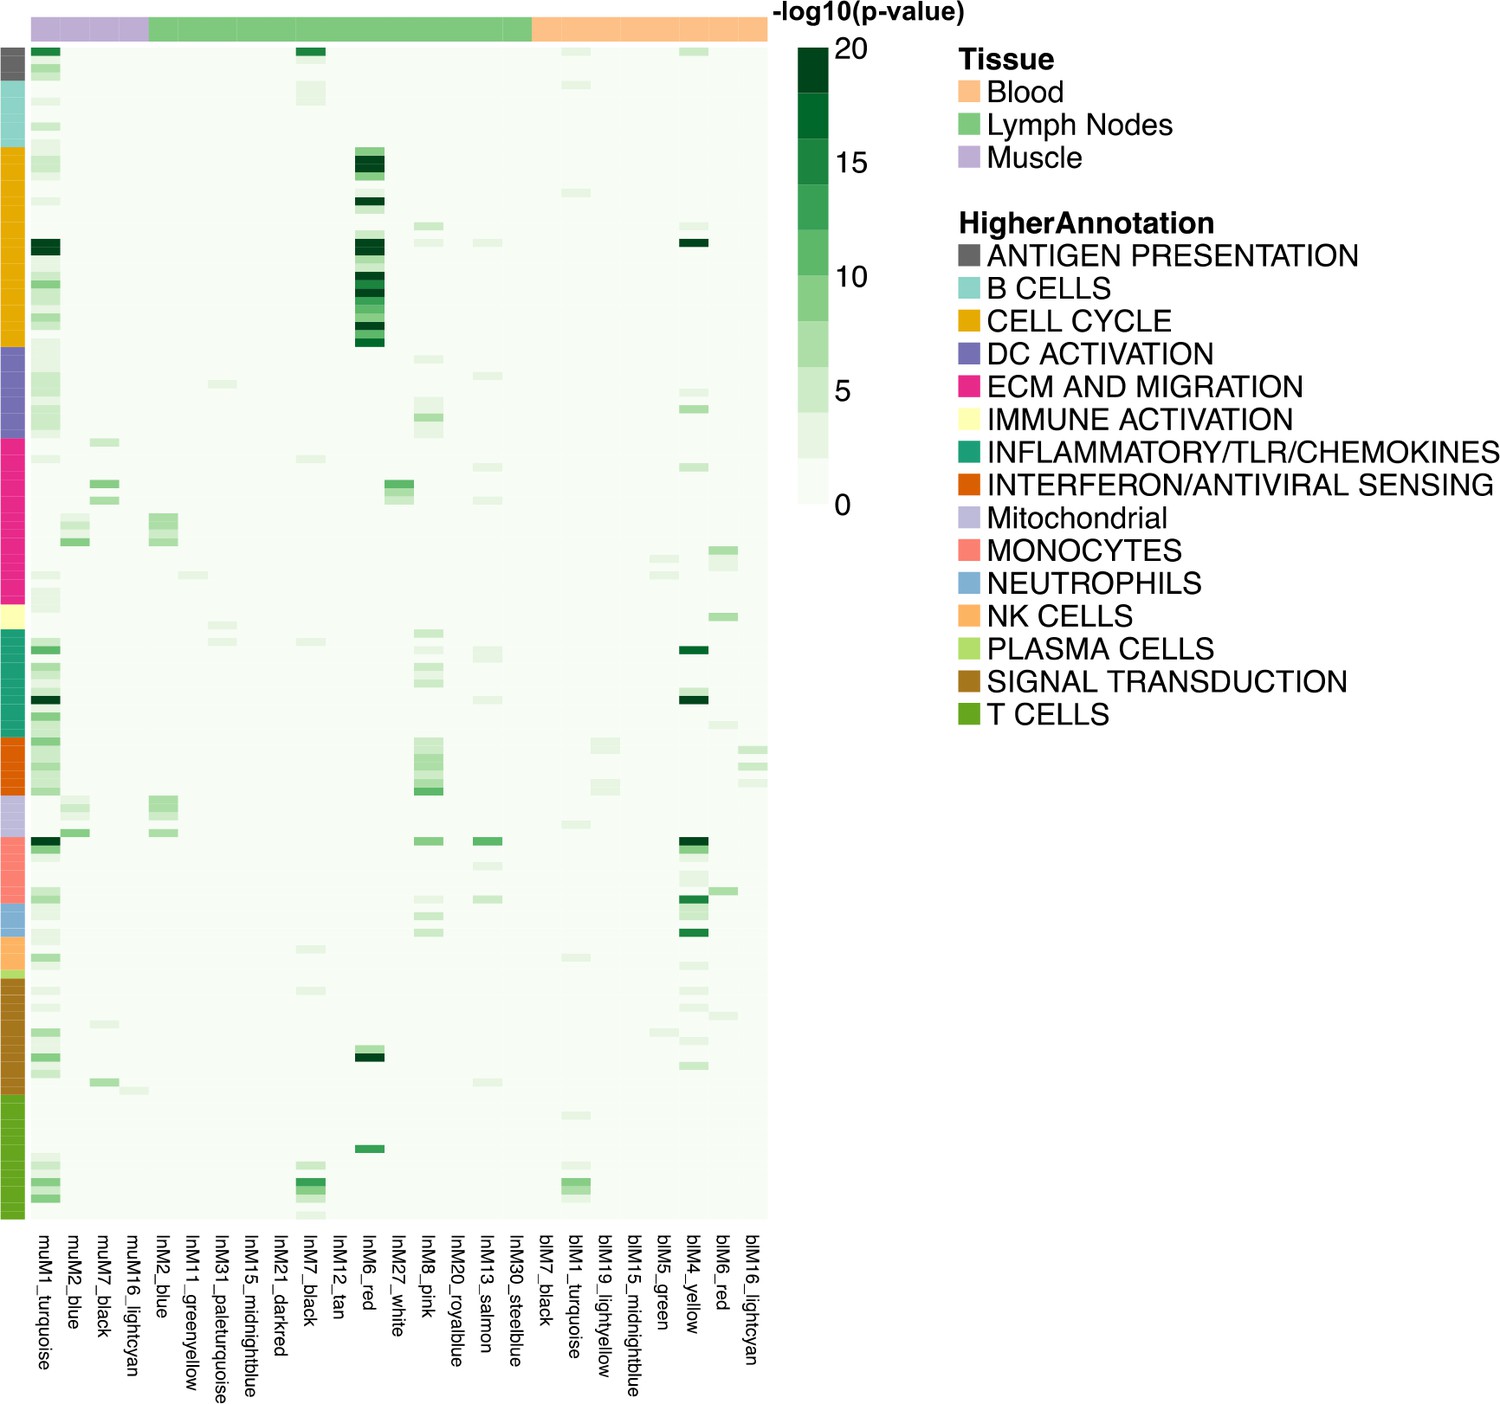
Heatmap representing the transcript overlap between WGCNA modules and the reference modules.
Reference modules are the blood transcriptional modules defined by Li et al. (2014). These modules are shown in rows and are annotated within a higher functional group. Only WGCNA modules that showed a significant enrichment (hypergeometric test adjusted p-value<0.05) in any of the reference modules were included and shown in columns (hypergeometric test adjusted p-value<0.05). The legends on the figure report the strength of the p-value as a gradient of green. The colours at the top of the columnsindicate the tissue being analysed, whereas rows are colour-coded to indicate their higher annotation, as indicated in the key.
Figure 3—figure supplement 1
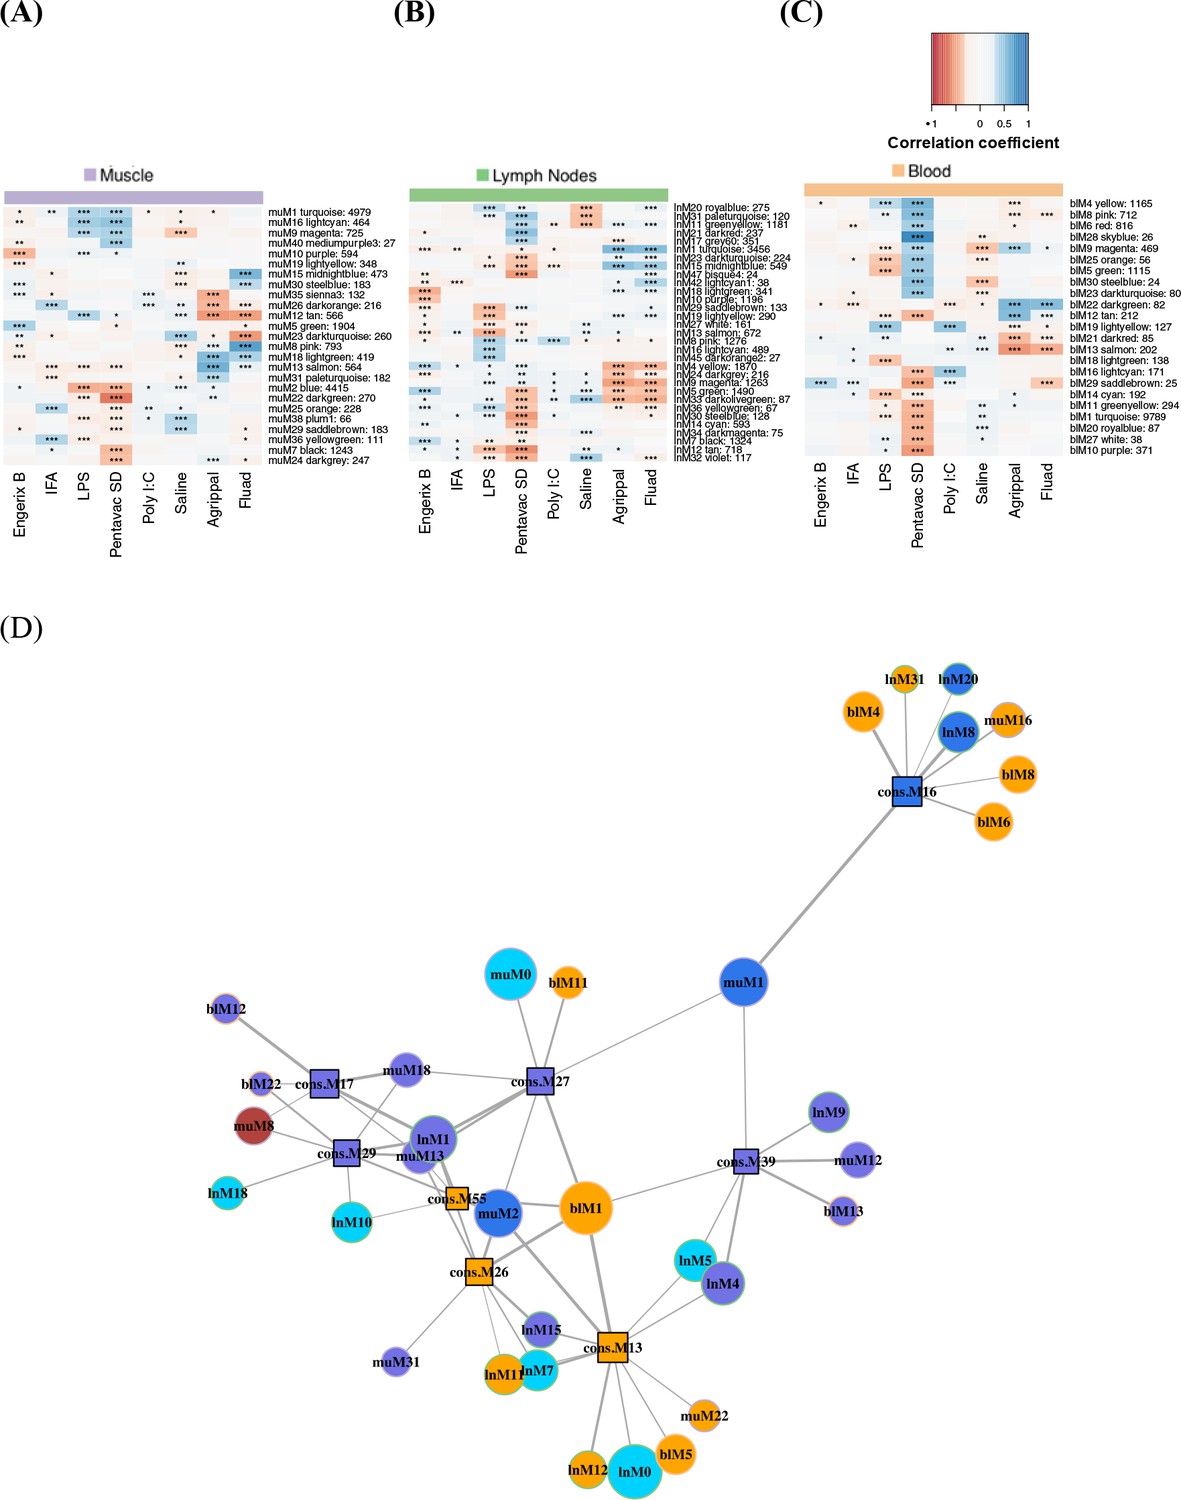
Weighted gene co-expression network analysis of module–trait relationships.
Modules extracted by co-expression analyses in the injected muscle (A), draining lymph nodes (B), and blood (C) datasets are in rows labelled with a colour for each treatment and an identificaton number. The number of genes contained in the given module is also listed after the identification numbers. The heatmaps are colour coded by the Pearson correlation coefficient between the given module eigengene and the trait (r > 0.3 in blue and r < −0.3 in red, *p<0.01, **p<0.001, ***p<0.0001; see legend above heatmaps). (D) Consensus modules (square-shaped nodes) across the different tissue datasets are represented in a network diagram. Nodes are scaled to the module size and coloured by their strongest associated trait, with Engerix B in light blue, Agrippal in purple, Fluad in red, Pentavac SD in orange and LPS in dark blue. The thickness of the lines is scaled to the number of genes shared between the connected modules. Modules are connected if they share more than four genes, and connected modules that are not associated with a trait are not shown (absolute correlation coefficient r < 0.35).
Figure 4
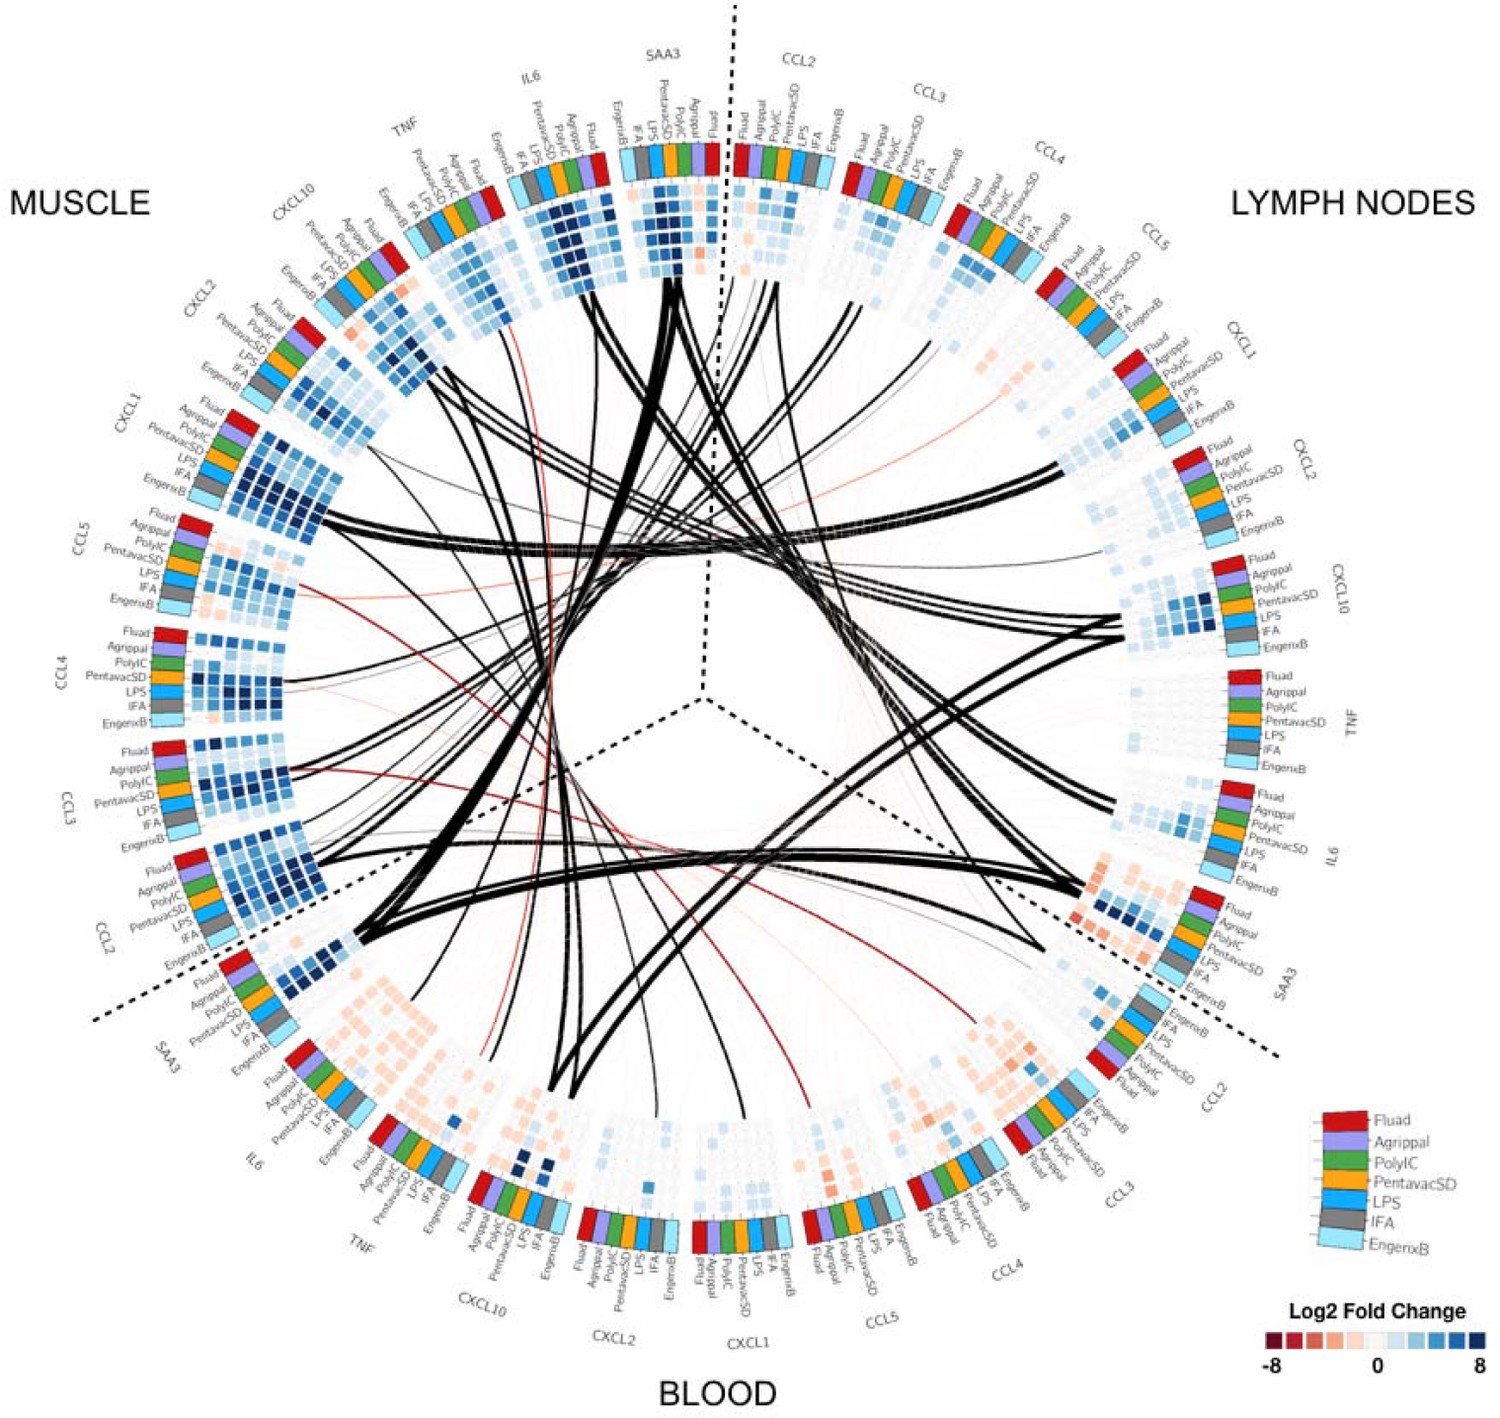
Circular map representing the differentially expressed genes and reporting the observed correlations between each tissue.
The three tissues analysed are organised as in Figure 2 and are indicated on the outer part of the circular map. Each outer tile has a different colour to denote which injection they received: Fluad (red), Agrippal (purple), Poly I:C (green), Pentavac SD (yellow), LPS (blue), IFA (grey) and Engerix B (light blue). Each cell in the inner circles shows the fold change for each given time point, treatment, and tissue (dark blue/blue for upregulation and dark red/red for downregulation, with the density of the colour corresponding to the magnitude of fold change). The lines connecting the different subsets of tiles represent the correlation between tissues for each gene-treatment combination with black lines showing a positive correlation and red lines a negative correlation. The thickness of the lines indicates the magnitude of the correlation.
Figure 5 with 1 supplement
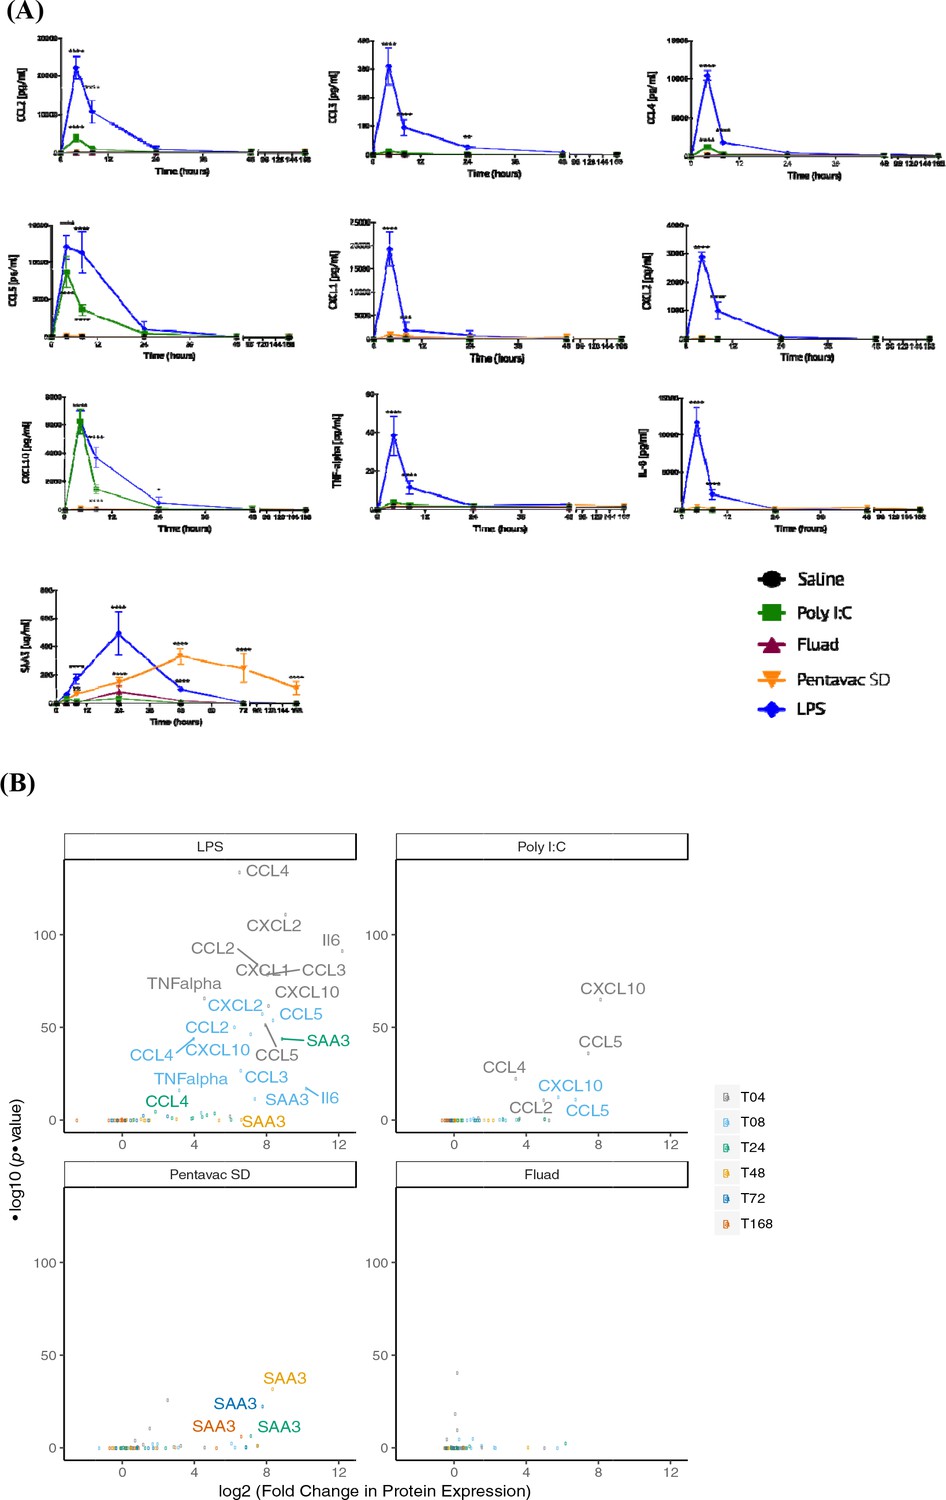
Serum chemokine and cytokine expression.
Serum chemokines and cytokines were measured using a Luminex bead 9-plex assay, and serum amyloid A3 was measured by quantitative ELISA. (A) Each panel shows the longitudinal expression of an individual chemokine/cytokine in murine peripheral blood sera at times 0, 4, 8, 24, 48, 72 and 168 hr post-injection with the indicated vaccine (n = 5 mice per time point). Chemokine/cytokine levels induced by different vaccines that were in excess of those induced by saline alone were analysed using two-way ANOVA followed by Dunnett’s multiple comparisons test, **p<0.01, ***p<0.001, ****p<0.0001. (B) Volcano plot representing the differential expression of all measured proteins in the sera induced by different vaccines shown as fold-change in the levels induced by saline alone at different time points. Data points corresponding to responses with adjusted p-value <0.01 are labelled with the protein name, and colour coded according to the time point.
Figure 5—figure supplement 1
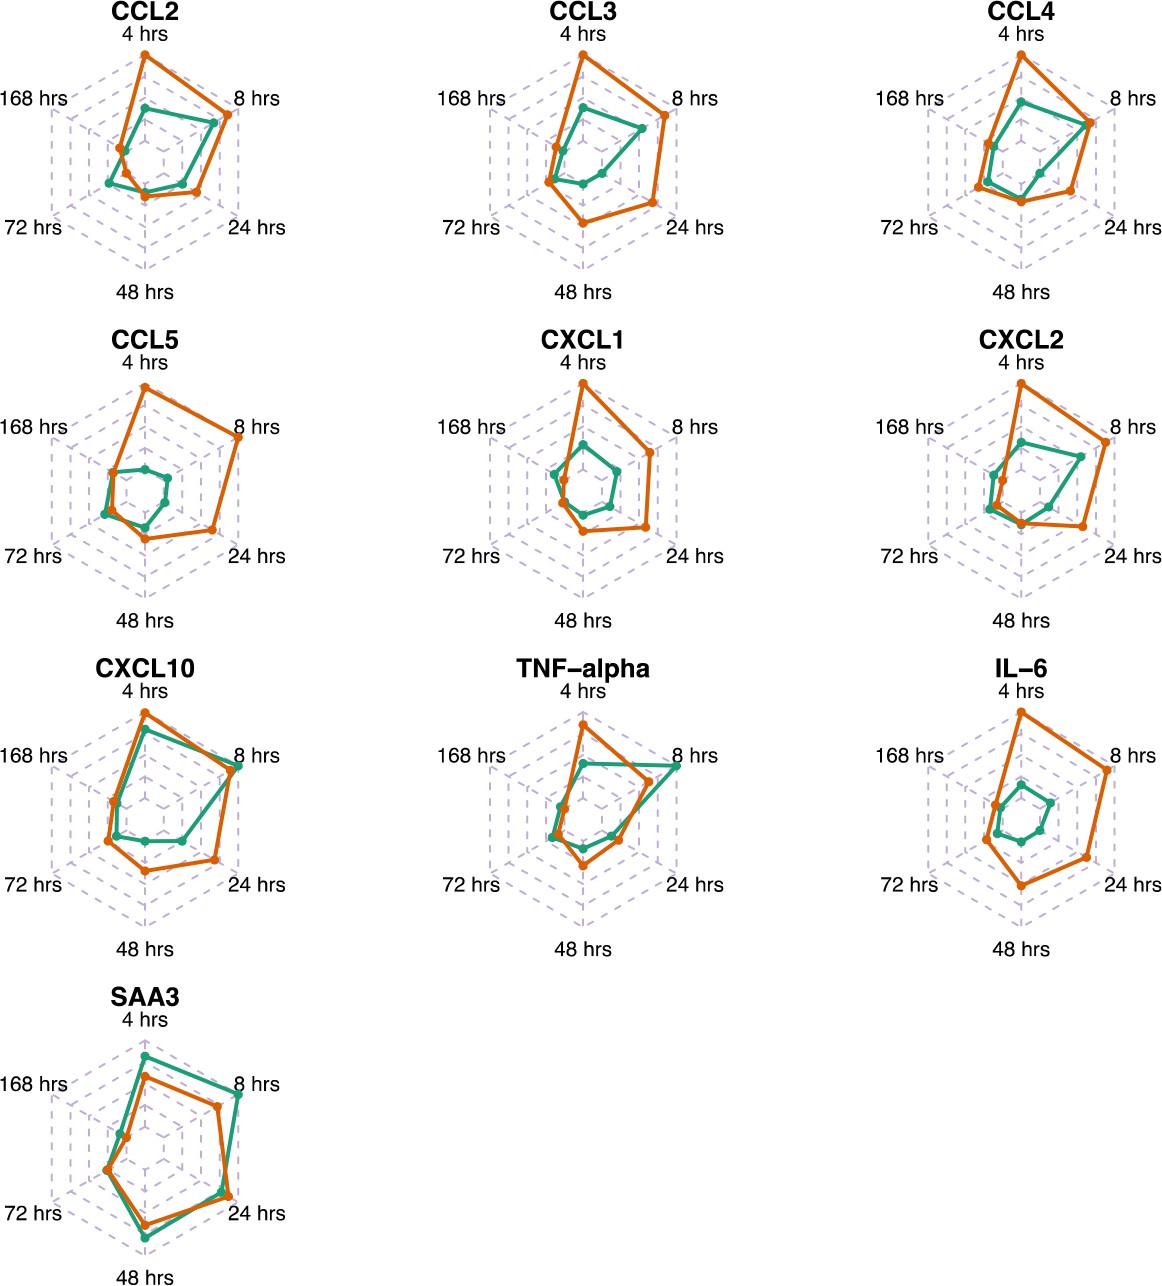
Comparison of gene expression levels measured by microarray and protein levels of chemokines and cytokines measured by Luminex bead 9-plex assay and quantitative ELISA.
Differential expression of transcripts and proteins induced by the LPS immunisation are shown. Each panel shows the fold changes (transcripts – green line; proteins – orange line) of individual chemokine/cytokines in murine peripheral blood sera at 0, 4, 8, 24, 48, 72 and 168 hr after the LPS immunisation. Fold changes in proteins levels were calculated at each time point by dividing the mean values of proteins in the LPS group by the mean values of those in the saline-alone group. Fold changes of transcripts and proteins were correlated: for CCL2, r = 0.79, p-value = 0.0614; for CCL3, r = 0.70, p-value = 0.1297; for CCL4, r = 0.73, p-value = 0.1038; for CCL5, r = −0.86, p-value = 0.0243; for CXCL1, r = 0.83, p-value = 0.0486; for CXCL2, r = 0.76, p-value = 0.0967); for CXCL10, r = 0.89, p-value=0.0216; TNF-α, r = 0.67, p-value=0.1367; for IL-6, r = 0.69, p-value = 0.1685; and for SAA3, r = 0.92, p-value = 0.0089.
Figure 6
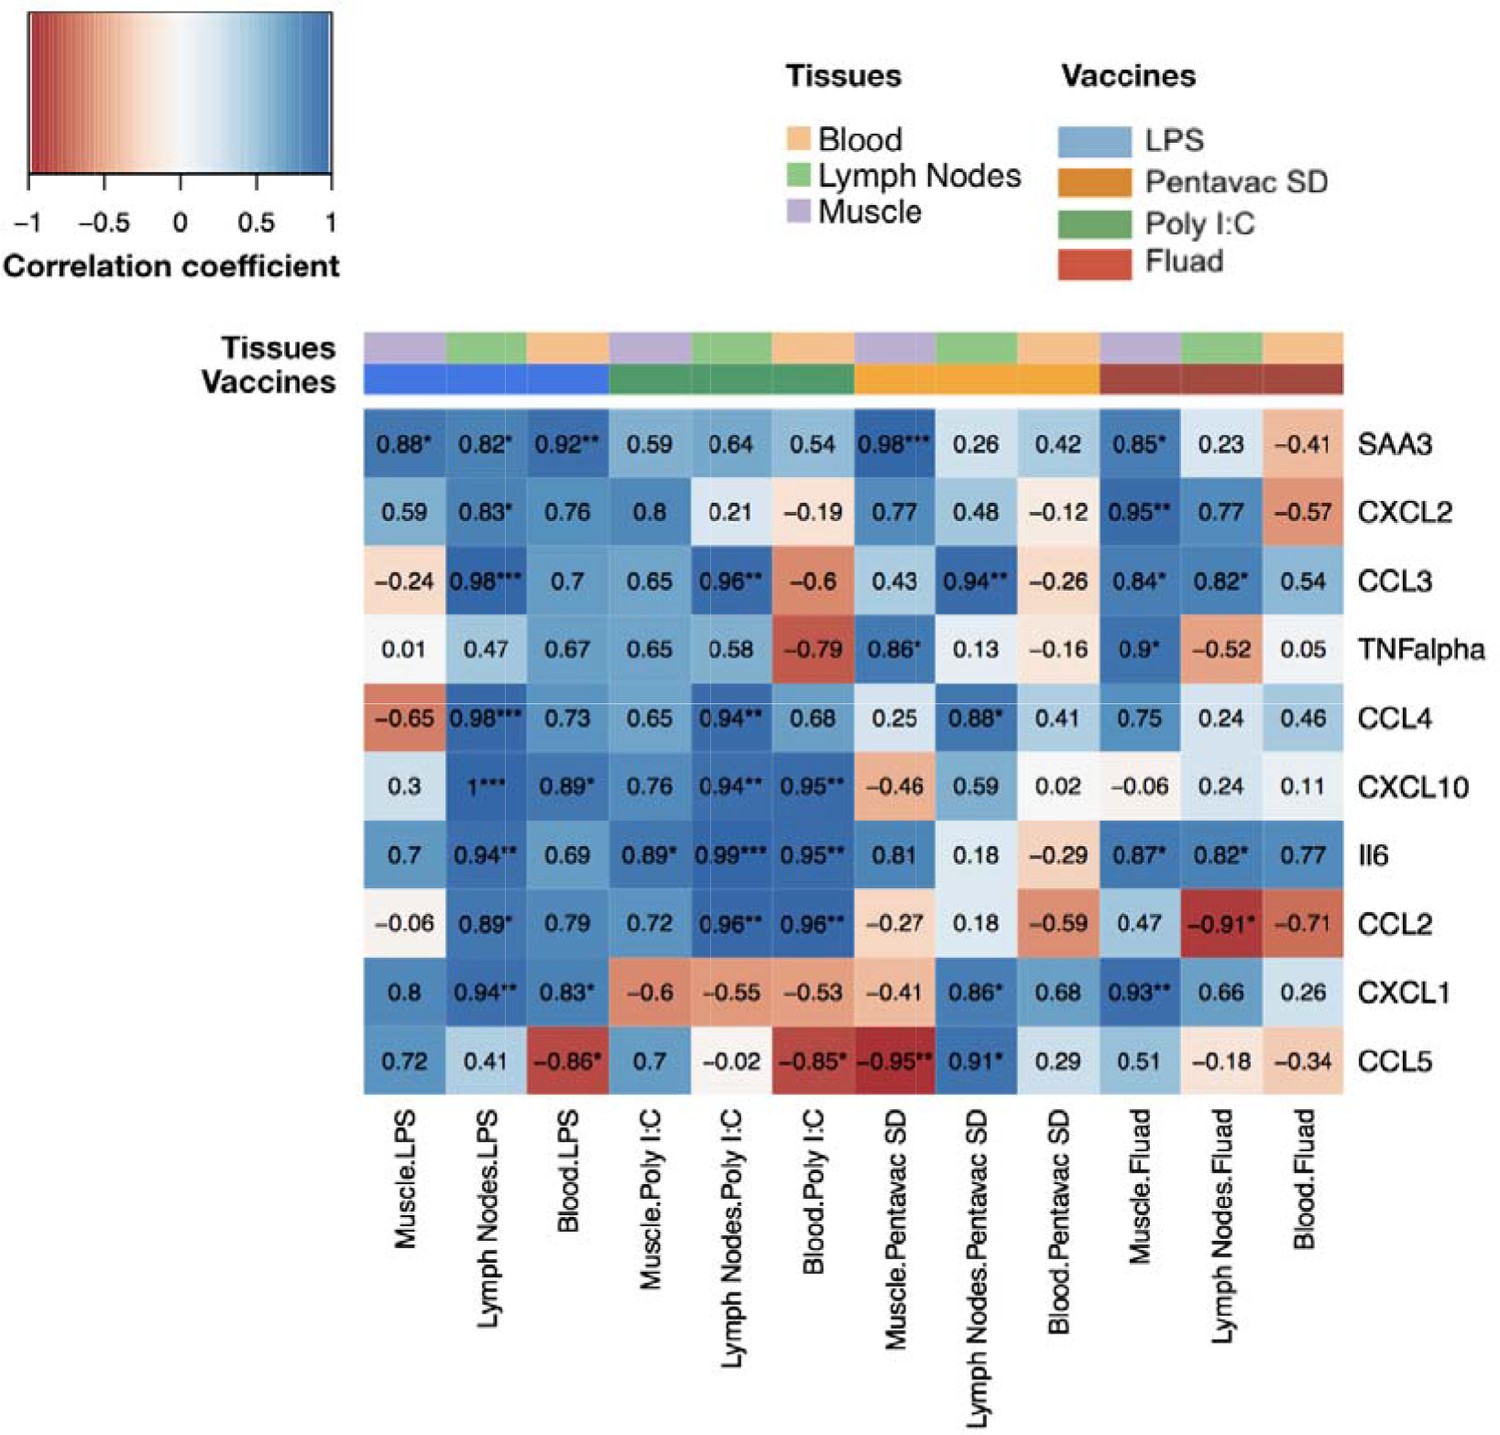
Comparison of gene expression levels measured by microarray with the protein levels of chemokines and cytokines measured by Luminex bead 9-plex assay and quantitative ELISA.
The correlations between fold changes in transcript and protein levels are presented in this heatmap. All measured chemokine and cytokines are in rows (left axis legend). Columns represent different tissues and immunisations ,as indicated by the colour-coded legend above the heatmap. Each cell shows the coefficient of correlation between protein levels in murine peripheral blood sera and the transcript changes measured at the same time points(4, 8, 24, 48, 72 and 168 hr after vaccination) in the muscle, lymph nodes, and blood. Fold changes of protein levels were calculated at each time point by dividing the mean values of proteins in each vaccine group by the mean values of those of the saline-alone group. Correlations between the fold changes in transcript and protein levels were calculated using as Pearson correlation coefficients. Each cell shows the correlation coefficient followed by a sign for the significance with *p<0.05, **p<0.01 and ***p<0.001 (see legend on the top left corner).
Tables
Table 1
Vaccines and inflammatory agents.
The vaccines, TLR agonists, adjuvant and saline used in the present study are detailed. Vaccines were administered by injection of 1/10th the human dose in a 50 µL volume. TLR agonists, IFA and saline were also given in a single 50 µL volume. All injections were into the mouse hind leg quadriceps muscle.
| Vaccine/TLR | Components | Abbreviation | Manufacturer |
|---|---|---|---|
| Pentavac SD | Diphtheria, tetanus, pertussis (whole cell), hepatitis B (rDNA) and haemophilus type b conjugate vaccine | Pentavac | Serum Institute India |
| Agrippal | Trivalent flu subunits – H3N2, H1N1 and influenza B | Tri-Flu | Seqirus |
| Fluad | Trivalent flu subunits – H3N2, H1N1 and influenza B + MF59 | Tri-Flu + MF59 | Seqirus |
| Engerix B | Recombinant hepatitis B sAg absorbed on alum | GlaxoSmithKline | |
| IFA | Montanide ISA 51 VG | Seppic | |
| LPS | LPS-EB Ultrapure | Invivogen | |
| Poly I:C | Polyinosinic:polycytidylic acid | Sigma |
Key resources table
| Reagent type (species) or resource | Designation | Source or reference | Identifiers | Additional information |
|---|---|---|---|---|
| Strain, strain background) M. musculus, Female) | CB6F1/Crl; Strain Code 176 | Charles River | ||
| Commercial assay or kit | RNAprotect animal blood tubes | Qiagen | Cat number: 76544 | |
| Commercial assay or kit | miRNeasy mini kit | Qiagen | Cat number: 217004 | |
| Commercial assay or kit | QIAzol lysis reagent | Qiagen | Cat number: 79306 | |
| Commercial assay or kit | 9-plex Luminex | Bio-Techne | Cat number: LXSAMS-09 | |
| Chemical compound, drug | Pentavac SD | Serum Institute India | ||
| Chemical compound, drug | Agrippal | Seqirus | ||
| Chemical compound, drug | Fluad | Seqirus | ||
| Chemical compound, drug | Engerix B | GlaxoSmithKline | ||
| Chemical compound, drug | IFA - Montanide ISA 51 VG | Seppic | NSC#737063 | |
| Chemical compound, drug | LPS-EB Ultrapure | Invivogen | Cat number: tlrl-3pelps | |
| Chemical compound, drug | Poly I:C | Sigma | Cat number: P1530 |
Additional files
-
Transparent reporting form
- https://doi.org/10.7554/eLife.46149.015
Download links
A two-part list of links to download the article, or parts of the article, in various formats.
Downloads (link to download the article as PDF)
Open citations (links to open the citations from this article in various online reference manager services)
Cite this article (links to download the citations from this article in formats compatible with various reference manager tools)
Identification of potential biomarkers of vaccine inflammation in mice
eLife 8:e46149.
https://doi.org/10.7554/eLife.46149


