Network-wide abnormalities explain memory variability in hippocampal amnesia
- University of Oxford, United Kingdom
- University College London, United Kingdom
- University Hospital Marqués de Valdecilla, Spain
Figures
Figure 1

Outline of Results Section.
We first (1) identified cognitive deficits by comparing patients with healthy controls in a broad range of tests of neuropsychological assessment. We identified regions in which patients showed (2) reduced gray matter volumes and (3) resting-state functional connectivity and activity relative to healthy controls; (4) we also identified relationships between structural/functional abnormalities and performance in tests in which patients showed impairment as compared with healthy controls; 'connectome-MVPA': connectome ‘multi-variate pattern analysis’ (Whitfield-Gabrieli and Nieto-Castanon, 2012); MRI: Magnetic Resonance Imaging; MTL: medial temporal lobe; n: number of participants; rsALFF: resting-state amplitude of low-frequency fluctuations; rsFC: resting-state functional connectivity; VBM: voxel-based morphometry.
Figure 2 with 1 supplement
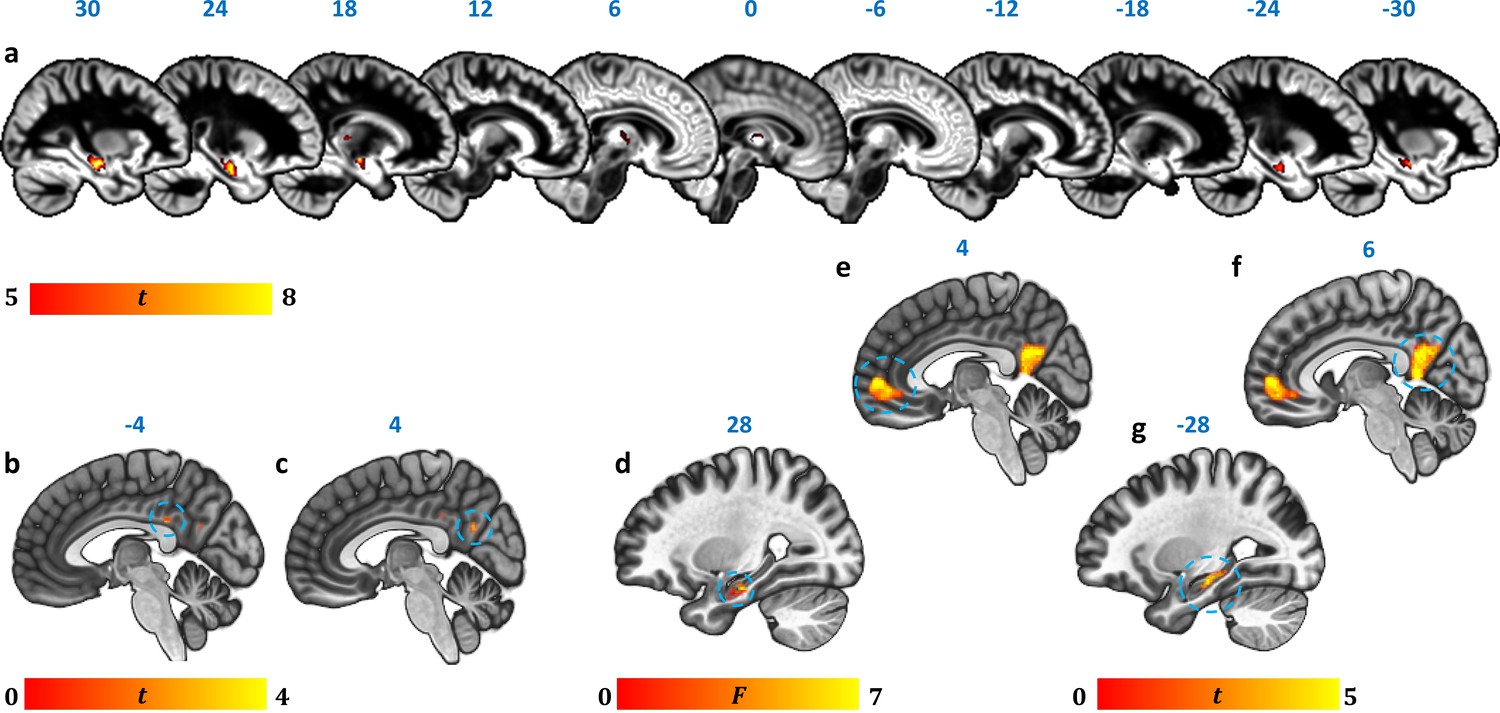
Reduction in GM volume, rsALFF and rsFC in autoimmune LE patients.
(a) A whole-brain VBM on GM volume (contrast: controls > patients) showed volume reduction in patients’ HPC bilaterally, as well as in mediodorsal-anterior and right dorsolateral thalamic regions (Table 4); clusters survive FWE peak-level correction (p<0.05) over p<0.001 unc; color bar indicates t values; b-c: Reduced rsALFF in patients in (b) the posterior cingulate (kE = 89, p-FWE = 0.033; peak voxel coordinates: −4,–36, 28) and (c) precuneus (kE = 137; p-FWE = 0.003; peak voxel coordinates: 4,–60, 26); d-j: reduced rsFC in patients; d: a whole-brain MVPA (omnibus F) showed abnormal rsFC for patients in a cluster in the right HPC (kE = 178, p-FWE = 0.001; peak voxel coordinates: 28,–16,−20; color bar indicates F values); e-g: reduced rsFC of the right HPC (whole-brain seed-to-voxel analysis; seed: right HPC, anatomically delineated in native space, unsmoothed timeseries; contrast: controls > patients); e: medial prefrontal cortex (kE = 1152, p-FWE <0.0001, peak voxel coordinates: 4, 56, 2); f: posteromedial cortex (posterior cingulate, retrosplenial cortex, precuneus; kE = 986, p-FWE <0.0001, peak voxel coordinates: 6,–50, 8); g: left HPC (kE = 393, p-FWE <0.0001, peak voxel coordinates: −12,–36, 2). All rsFC and rsALFF clusters survive FWE correction (p<0.05) for cluster size over an individual voxel threshold of p<0.001; FWE: family-wise error; HPC: hippocampus; kE: cluster size (number of voxels); rsALFF: Resting-state amplitude of low frequency fluctuations; rsFC: Resting-state functional connectivity; VBM: voxel-based morphometry.
Figure 2—figure supplement 1
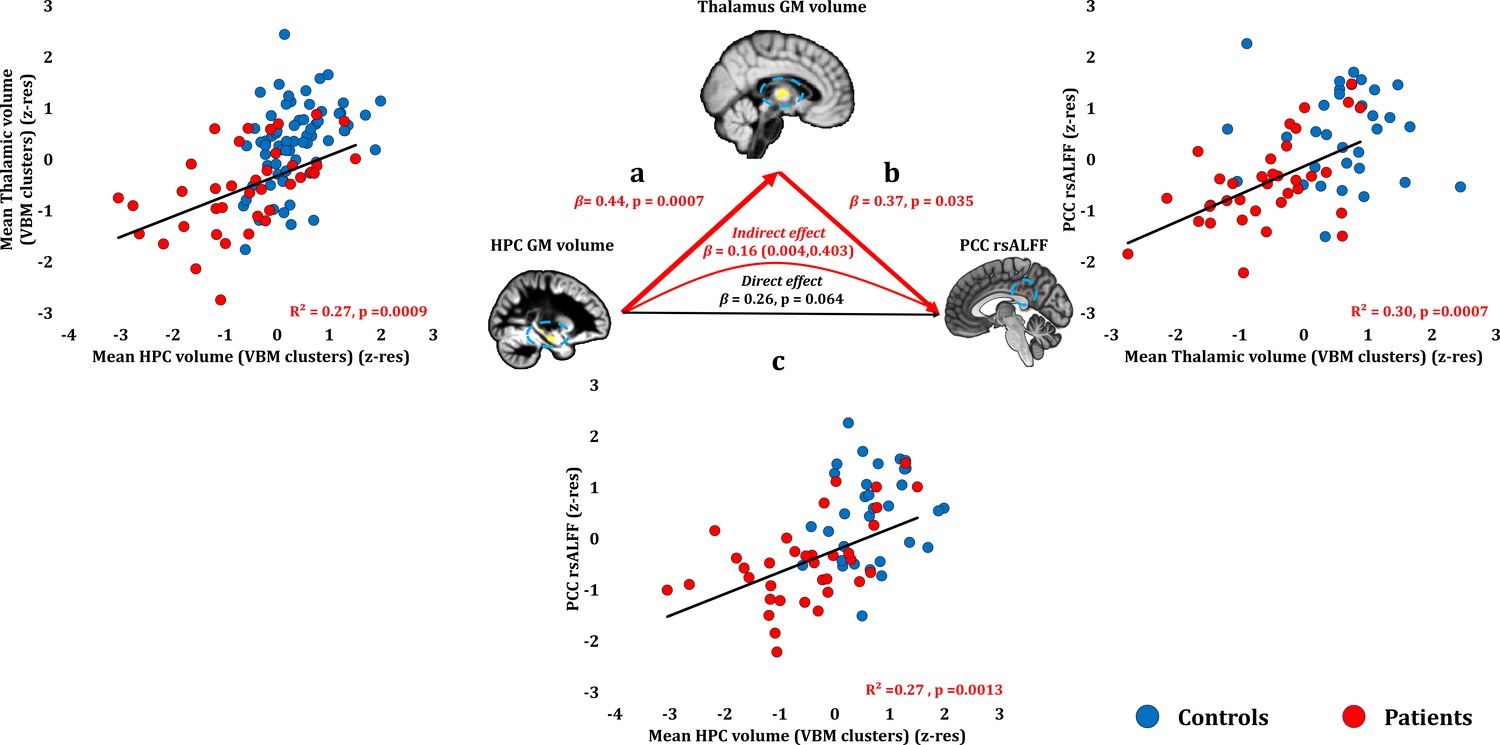
Relationship of HPC atrophy with PCC functional abnormalities.
Given the reciprocal connectivity of thalamic nuclei with both the HPC and the cingulate cortex (Aggleton, 2014; Aggleton et al., 2010; Bubb et al., 2017) and our hypothesis that HPC atrophy is followed by structural and functional abnormalities in interconnected areas within the HPC-diencephalic-cingulate networks, we assumed a causal chain of events, whereby HPC damage has remote effects on thalamic volume, which, in turn, lead to abnormalities in the cingulate cortex, observed here in the form of reduced rsALFF in the PCC. We used a series of bivariate correlations and mediation analyses, with HPC volume as the independent variable, thalamic volume as the mediator variable, and rsALFF in the PCC as the dependent variable. A mediation analysis supported this hypothesis, showing that the effects of the average GM volume reduction in the HPC VBM clusters on patients’ reduced rsALFF in the PCC were fully mediated by the correlative reduction of the average GM volume of the thalamic VBM clusters (direct effect: β = 0.26, p=0.064; indirect effect: β = 0.16, 95% CI: 0.004,0.403); a: mean GM volume of the two HPC clusters correlated with the mean GM volume of the two thalamic clusters across patients; b: mean PCC rsALFF correlated across patients with the mean GM volume of the two thalamic clusters; the mediation analysis demonstrates that this effect held when the correlation of thalamic GM volume with the mean GM volume of the HPC clusters was accounted for; c: mean GM volume of the HPC clusters correlated with PCC rsALFF; the mediation analysis demonstrated that this relationship did not hold over and above the correlation of the mean GM volume of the thalamic clusters with the HPC clusters; there was thus no direct effect of reduced HPC GM volume on PCC rsALFF (within parenthesis: 95% confidence intervals); GM: gray matter; HPC: hippocampus; MAP: Memory and Amnesia Project; OPTIMA: Oxford Project To Investigate Memory and Aging; PCC: posterior cingulate cortex; rsALFF: resting-state amplitude of low frequency fluctuations; TIV: total intracranial volume; VBM: voxel-based morphometry; z-res: GM volumes from VBM clusters are residualized against age, sex, scan source (MAP, OPTIMA), and TIV across participants; mean rsALFF is residualized against age and sex across participants.
-
Figure 2—figure supplement 1—source data 1
This spreadsheet contains the mean GM volume of the HPC and thalamic VBM clusters and the mean rsALFF in the PCC cluster (z-res) for healthy controls and patients that are plotted in Figure 2—figure supplement 1; GM: gray matter; HPC: hippocampus; MAP: Memory and Amnesia Project; OPTIMA: Oxford Project To Investigate Memory and Aging; PCC: posterior cingulate cortex; rsALFF: resting-state amplitude of low frequency fluctuations; TIV: total intracranial volume; VBM: voxel-based morphometry; z-res: GM volumes from VBM clusters are residualized against age, sex, scan source (MAP, OPTIMA), and TIV across participants; mean rsALFF is residualized against age and sex across participants.
These data can be opened with Microsoft Excel or with open-source alternatives such as OpenOffice.
- https://doi.org/10.7554/eLife.46156.007
Figure 3
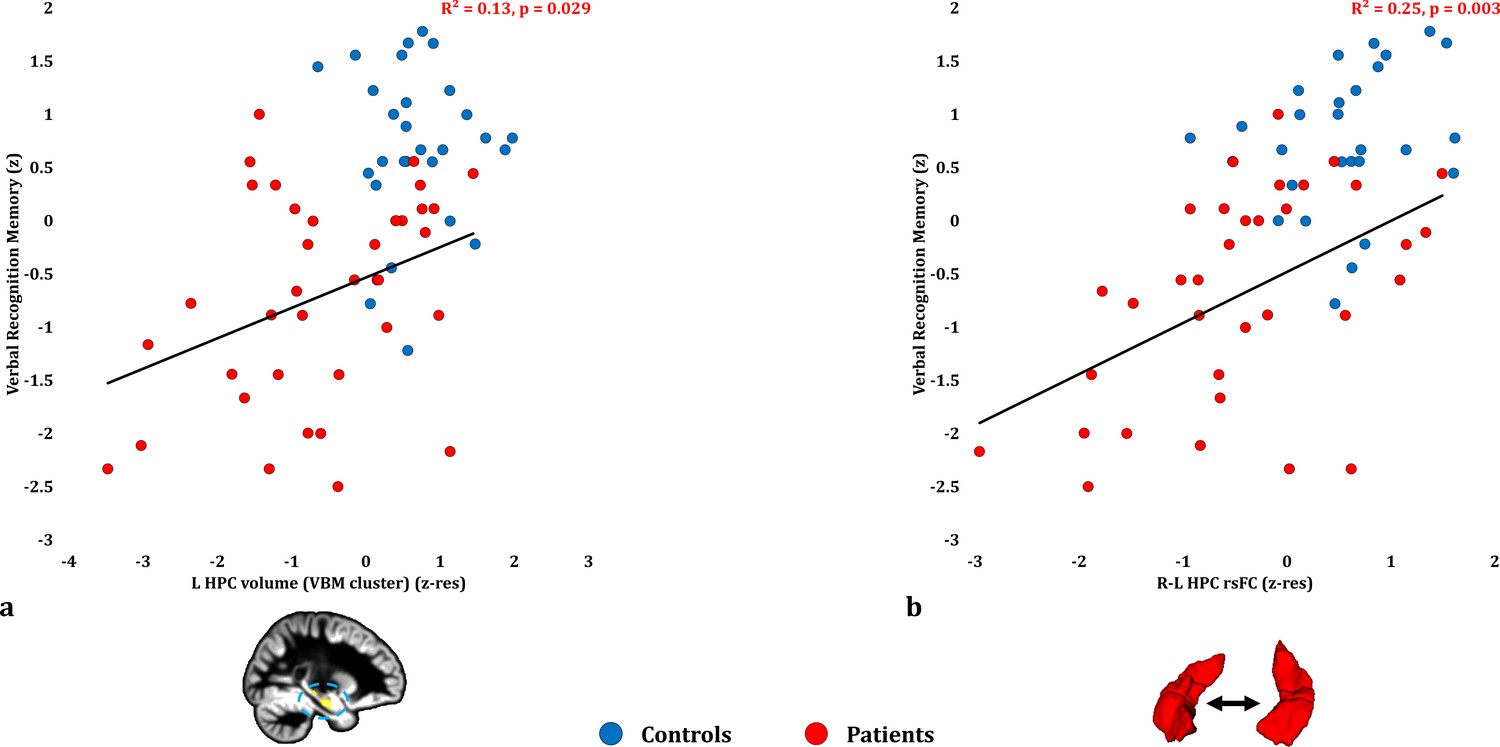
Verbal Recognition Memory: Structural/Functional correlates.
( a) GM volume expressed by the left HPC VBM cluster correlated across patients with their verbal recognition composite memory scores only at uncorrected levels (r = 0.36, p-unc = 0.029); (b) mean inter-HPC rsFC correlated across patients with their verbal recognition composite memory scores and survived correction for multiple (structural/functional brain abnormalities examined: n = 13) testing (r = 0.50, p-corr = 0.039); GM: gray matter; HPC: hippocampus; L, R: left, right (hemisphere); MAP: Memory and Amnesia Project; OPTIMA: Oxford Project To Investigate Memory and Aging; p: significance values are presented at uncorrected levels; rho: Spearmann’s rank correlation coefficient; rsFC: resting-state functional connectivity; VBM: voxel-based morphometry; z: memory scores are averaged age-scaled and standardized scores of participants’ performance in the subtests of interest; z-res: GM volume from VBM clusters is residualized against age, sex, scan source (MAP, OPTIMA) and TIV across participants; mean rsFC is residualized across participants against age and sex.
-
Figure 3—source data 1
This spreadsheet contains the mean GM volume of the left HPC VBM cluster and the mean inter-HPC rsFC (z-res) and the verbal recognition memory composite scores (z) of healthy controls and patients that are plotted in Figure 3; GM: gray matter; HPC: hippocampus; MAP: Memory and Amnesia Project; OPTIMA: Oxford Project To Investigate Memory and Aging; rsFC: resting-state functional connectivity; VBM: voxel-based morphometry; z: memory scores are averaged age-scaled and standardized scores of participants’ performance in the subtests of interest; z-res: GM volumes from VBM clusters are residualized against age, sex, scan source (MAP, OPTIMA), and TIV across participants; mean rsFC is residualized against age and sex across participants. These data can be opened with Microsoft Excel or with open-source alternatives such as OpenOffice.
- https://doi.org/10.7554/eLife.46156.010
Figure 4
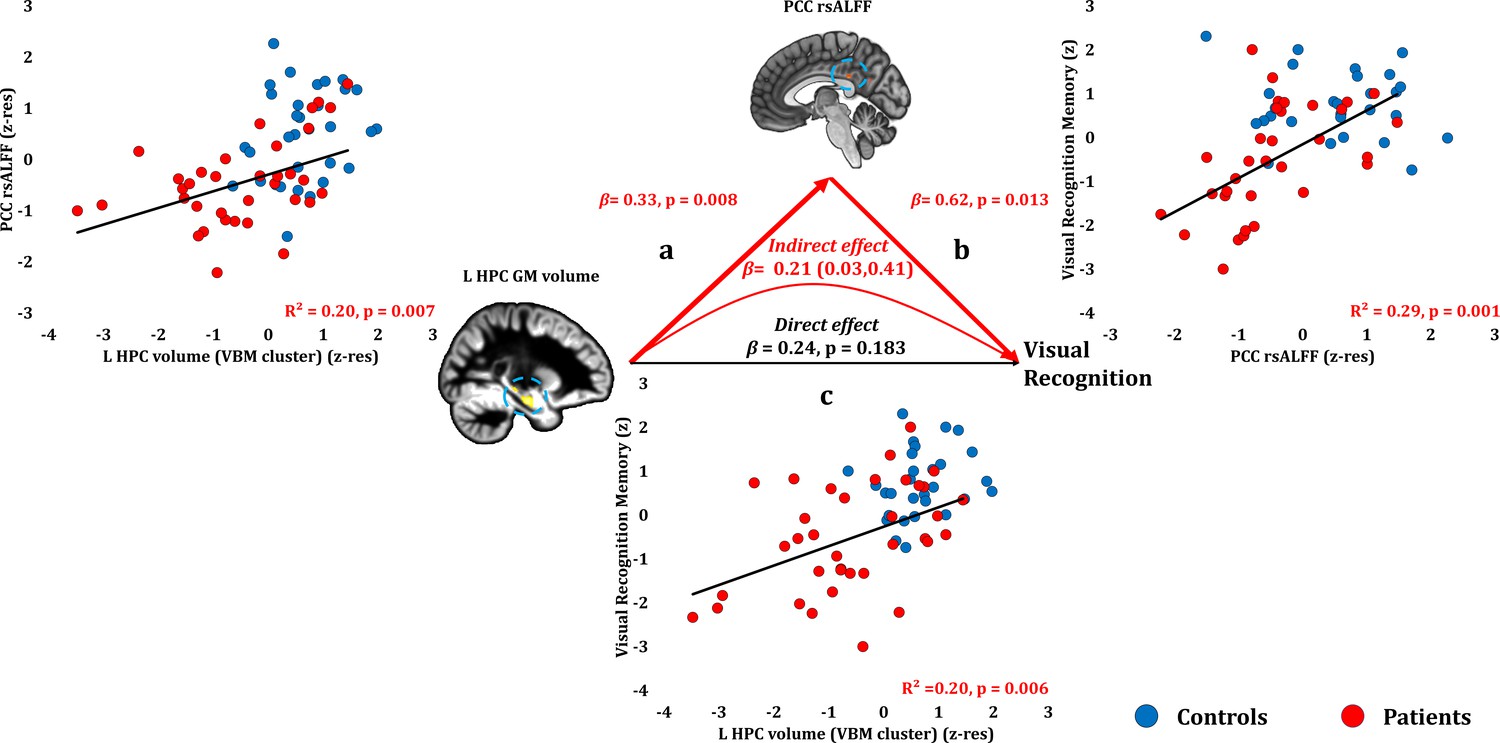
Visual Recognition Memory: Structural/Functional correlates.
(a) mean GM volume of the left HPC cluster correlated with the mean rsALFF of the PCC cluster across patients; (b) visual recognition memory scores correlated across patients with their mean rsALFF in the PCC cluster, surviving correction for multiple testing for the 13 structural/functional abnormalities examined (r = 0.54, p-corr = 0.014); the mediation analysis demonstrates that this effect held over and above the correlation of PCC rsALFF with the mean GM volume of the left HPC cluster; (c) mean GM volume of the left HPC cluster correlated with visual recognition memory scores across patients, but did not survive correction for multiple testing (r = 0.45, p-corr = 0.072); however, the mediation analysis demonstrated that this relationship did not hold over and above the correlation of the mean GM volume of the left HPC cluster with the mean PCC rsALFF; there was only an indirect effect of reduced HPC GM volume on visual recognition memory (within parenthesis: 95% confidence intervals); GM: gray matter; HPC: hippocampus; L: left (hemisphere); MAP: Memory and Amnesia Project; OPTIMA: Oxford Project To Investigate Memory and Aging; p: significance values are presented at uncorrected levels; PCC: posterior cingulate cortex; rsALFF: resting-state amplitude of low frequency fluctuations; TIV: total intracranial volume; VBM: voxel-based morphometry; z: memory scores are averaged age-scaled and standardized scores of participants’ performance in the subtests of interest; z-res: GM volumes from VBM clusters are residualized against age, sex, scan source (MAP, OPTIMA), and TIV across participants; mean rsALFF values are residualized across participants against age and sex.
-
Figure 4—source data 1
This spreadsheet contains the mean GM volume of the left HPC VBM cluster and the mean rsALFF in the PCC (z-res) and the visual recognition memory composite scores (z) of healthy controls and patients that are plotted in Figure 4; GM: gray matter; HPC: hippocampus; MAP: Memory and Amnesia Project; OPTIMA: Oxford Project To Investigate Memory and Aging; PCC: posterior cingulate cortex; rsALFF: resting-state amplitude of low-frequency fluctuations; VBM: voxel-based morphometry; z: memory scores are averaged age-scaled and standardized scores of participants’ performance in the subtests of interest; z-res: GM volumes from VBM clusters are residualized against age, sex, scan source (MAP, OPTIMA), and TIV across participants; mean rsALFF is residualized against age and sex across participants. These data can be opened with Microsoft Excel or with open-source alternatives such as OpenOffice.
- https://doi.org/10.7554/eLife.46156.012
Figure 5
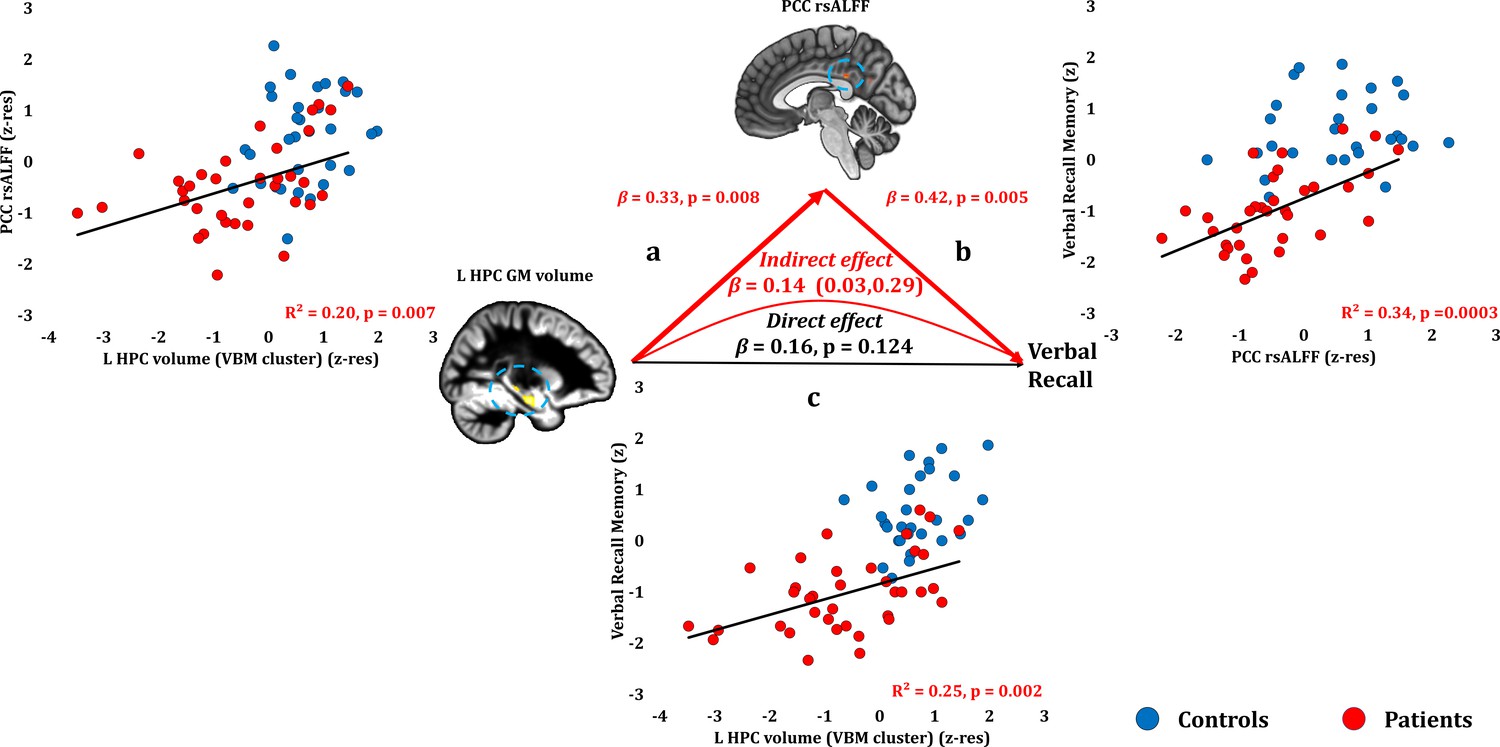
Verbal Recall Memory: Structural/Functional correlates.
(a) mean GM volume of the left HPC cluster correlated with the mean rsALFF of the PCC cluster across patients; (b) verbal recall memory scores correlated across patients with their mean rsALFF in the PCC cluster, surviving corrections for multiple testing across the 13 structural/functional abnormalities examined (r = 0.582, p-corr = 0.004); the mediation analysis demonstrates that this effect held over and above the correlation of PCC rsALFF with the mean GM volume of the left HPC cluster; (c) mean GM volume of the left HPC cluster correlated with verbal recall memory scores across patients (r = 0.495, p-corr = 0.024); however, the mediation analysis demonstrated that this relationship did not hold over and above the correlation of the mean GM volume of the left HPC cluster with the mean PCC rsALFF; there was only an indirect effect of reduced HPC GM volume on verbal recall memory (within parenthesis: 95% confidence intervals); GM: gray matter; HPC: hippocampus; L: left (hemisphere); MAP: Memory and Amnesia Project; OPTIMA: Oxford Project To Investigate Memory and Aging; PCC: posterior cingulate cortex; rsALFF: resting-state amplitude of low frequency fluctuations; TIV: total intracranial volume; VBM: voxel-based morphometry; z: memory scores are averaged age-scaled and standardized scores of participants’ performance in the subtests of interest; z-res: GM volumes from VBM clusters are residualized against age, sex, scan source (MAP, OPTIMA), and TIV across participants; mean rsALFF values are residualized across participants against age and sex.
-
Figure 5—source data 1
This spreadsheet contains the mean GM volume of the left HPC VBM cluster and the mean rsALFF in the PCC (z-res) and the verbal recall memory composite scores (z) of healthy controls and patients that are plotted in Figure 5; GM: gray matter; HPC: hippocampus; MAP: Memory and Amnesia Project; OPTIMA: Oxford Project To Investigate Memory and Aging; PCC: posterior cingulate cortex; rsALFF: resting-state amplitude of low-frequency fluctuations; VBM: voxel-based morphometry; z: memory scores are averaged age-scaled and standardized scores of participants’ performance in the subtests of interest; z-res: GM volumes from VBM clusters are residualized against age, sex, scan source (MAP, OPTIMA), and TIV across participants; mean rsALFF is residualized against age and sex across participants. These data can be opened with Microsoft Excel or with open-source alternatives such as OpenOffice.
- https://doi.org/10.7554/eLife.46156.014
Figure 6
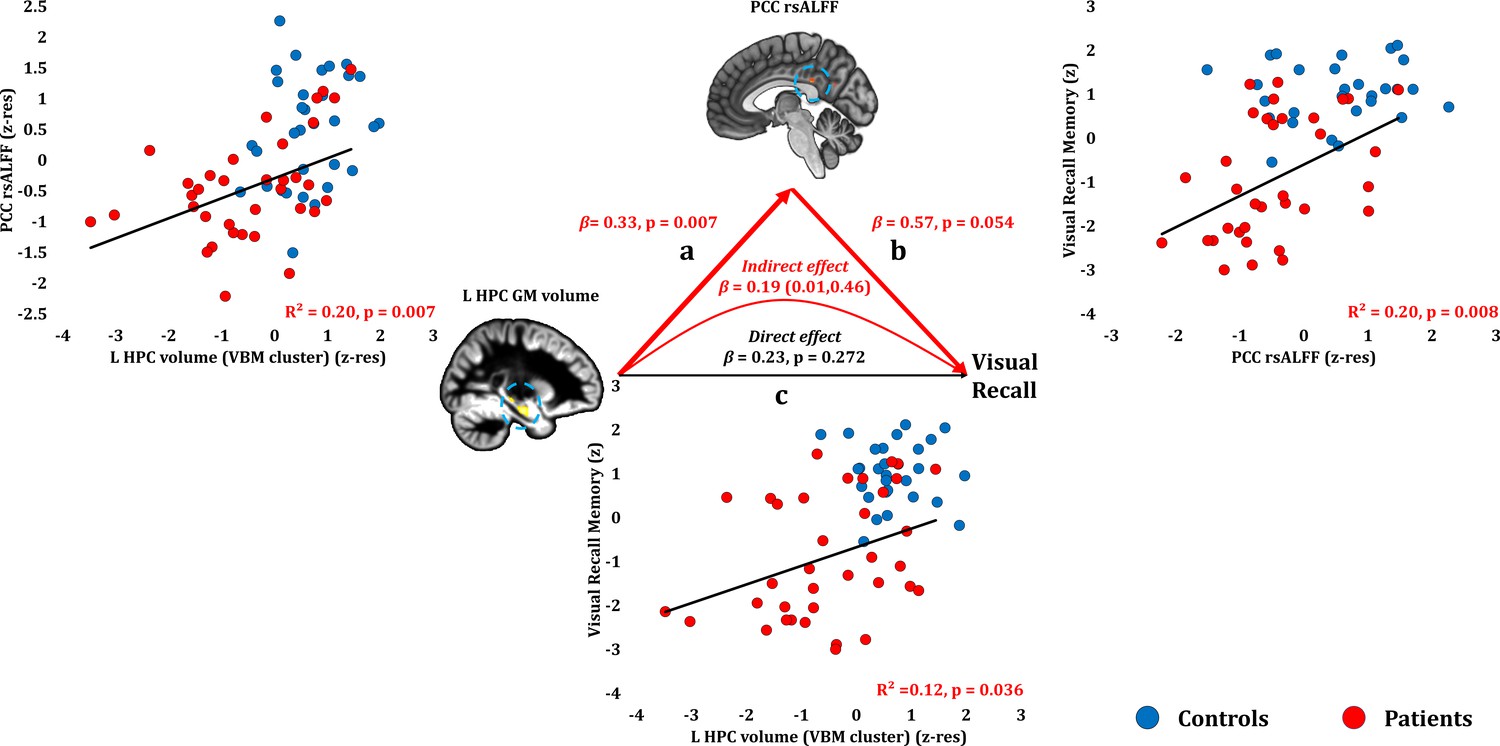
Visual Recall Memory: Structural/Functional correlates.
(a) mean GM volume of the left HPC cluster correlated with the mean rsALFF of the PCC cluster across patients; (b) visual recall memory scores correlated at uncorrected levels across patients with their mean rsALFF in the PCC cluster; the mediation analysis demonstrates that this effect held over and above the correlation of PCC rsALFF with the mean GM volume of the left HPC cluster; (c) mean GM volume of the left HPC cluster correlated with visual recall memory scores across patients at uncorrected levels; however, the mediation analysis demonstrated that this relationship did not hold over and above the correlation of the mean GM volume of the left HPC cluster with the mean PCC rsALFF; there was only an indirect effect of reduced HPC GM volume on visual recall memory (within parenthesis: 95% confidence intervals); GM: gray matter; HPC: hippocampus; L: left (hemisphere); MAP: Memory and Amnesia Project; OPTIMA: Oxford Project To Investigate Memory and Aging; p: significance values are presented at uncorrected levels; PCC: posterior cingulate cortex; rsALFF: resting-state amplitude of low frequency fluctuations; TIV: total intracranial volume; VBM: voxel-based morphometry; z: memory scores are averaged age-scaled and standardized scores of participants’ performance in the subtests of interest; z-res: GM volumes from VBM clusters are residualized against age, sex, scan source (MAP, OPTIMA), and TIV across participants; mean rsALFF values are residualized across participants against age and sex.
-
Figure 6—source data 1
This spreadsheet contains the mean.
GM volume of the left HPC VBM cluster and the mean rsALFF in the PCC (z-res) and the visual recall memory composite scores (z) of healthy controls and patients that are plotted in Figure 6; GM: gray matter; HPC: hippocampus; MAP: Memory and Amnesia Project; OPTIMA: Oxford Project To Investigate Memory and Aging; PCC: posterior cingulate cortex; rsALFF: resting-state amplitude of low-frequency fluctuations; VBM: voxel-based morphometry; z: memory scores are averaged age-scaled and standardized scores of participants’ performance in the subtests of interest; z-res: GM volumes from VBM clusters are residualized against age, sex, scan source (MAP, OPTIMA), and TIV across participants; mean rsALFF is residualized against age and sex across participants. These data can be opened with Microsoft Excel or with open-source alternatives such as OpenOffice.
- https://doi.org/10.7554/eLife.46156.016
Figure 7

Forgetting: Structural/Functional correlates.
(a) mean GM volume of the right HPC cluster correlated with the mean rsALFF of the PCC cluster across patients; (b) visual forgetting scores correlated across patients with their mean rsALFF in the PCC cluster, without, however, surviving correction for multiple tests (rho = 0.40, p-corr = 0.216); the mediation analysis demonstrates that this effect did not hold when the correlation of PCC rsALFF with the mean GM volume of the right HPC cluster was accounted for; (c) mean GM volume of the right HPC cluster correlated with visual forgetting scores across patients, surviving correction across the 13 structural/functional abnormalities examined (rho = 0.56, p-corr = 0.008); the mediation analysis demonstrated that this relationship held over and above the correlation of the mean GM volume of the right HPC cluster with the mean PCC rsALFF; there was thus a direct effect of reduced HPC GM volume on visual forgetting (within parenthesis: 95% confidence intervals); D and P: Doors and People (Baddeley et al., 1994); GM: gray matter; HPC: hippocampus; MAP: Memory and Amnesia Project; OPTIMA: Oxford Project To Investigate Memory and Aging; p: significance values are presented at uncorrected levels; PCC: posterior cingulate cortex; R: right (hemisphere); rsALFF: resting-state amplitude of low frequency fluctuations; TIV: total intracranial volume; VBM: voxel-based morphometry; z: age-scaled and standardized scores on Visual Forgetting (D and P); z-res: GM volumes from VBM clusters are residualized against age, sex, scan source (MAP, OPTIMA), and TIV across participants; mean rsALFF values are residualized across participants against age and sex.
-
Figure 7—source data 1
This spreadsheet contains the mean.
GM volume of the right HPC VBM cluster and the mean rsALFF in the PCC (z-res) and the visual forgetting scores (z) of healthy controls and patients that are plotted in Figure 7; GM: gray matter; HPC: hippocampus; MAP: Memory and Amnesia Project; OPTIMA: Oxford Project To Investigate Memory and Aging; PCC: posterior cingulate cortex; rsALFF: resting-state amplitude of low-frequency fluctuations; VBM: voxel-based morphometry; z: age-scaled and standardized scores for visual forgetting [Doors and People (Baddeley et al., 1994)]; z-res: GM volumes from VBM clusters are residualized against age, sex, scan source (MAP, OPTIMA), and TIV across participants; mean rsALFF is residualized against age and sex across participants. These data can be opened with Microsoft Excel or with open-source alternatives such as OpenOffice.
- https://doi.org/10.7554/eLife.46156.018
Figure 8
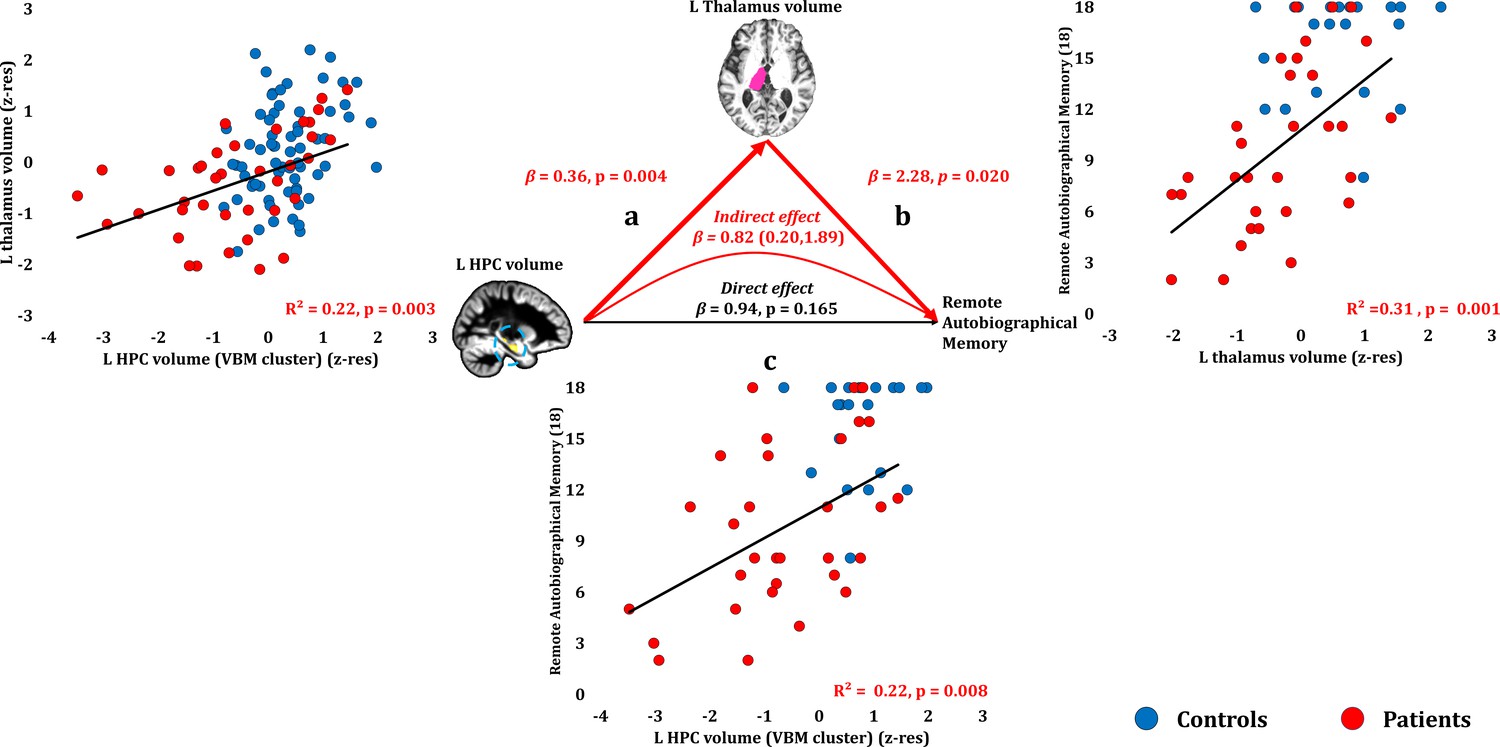
Remote Autobiographical Memory: Structural/Functional correlates.
(a) GM volume of the left HPC VBM cluster correlated with the left thalamic volume across patients; (b) remote autobiographical memory (AMI) scores correlated across patients with the volume of the left thalamus, surviving correction across the 13 structural/functional abnormalities examined (r = 0.558, p-corr = 0.015); the mediation analysis demonstrates that this effect held when the correlation of thalamic volume with the volume expressed by the left HPC VBM cluster was accounted for; (c) the volume expressed by the left HPC VBM cluster correlated with remote autobiographical memory scores, albeit this correlation did not survive correction for multiple testing (r = 0.467, p-corr = 0.096); the mediation analysis demonstrated that this relationship did not hold over and above the correlation of the left thalamic volume with the HPC clusters; there was thus no direct effect of reduced HPC GM volume on remote autobiographical memory (within parenthesis: 95% confidence intervals); ‘18’: remote autobiographical memory scores are the sums of the AMI scores for autobiographical memories for childhood and early adulthood (max = 18); AMI: Autobiographical Memory Interview; GM: gray matter; HPC: hippocampus; MAP: Memory and Amnesia Project; OPTIMA: Oxford Project To Investigate Memory and Aging; p: significance values are presented at uncorrected levels; TIV: total intracranial volume; VBM: voxel-based morphometry; z-res: volumes are residualized against age, sex, scan source (MAP, OPTIMA) and TIV across participants.
-
Figure 8—source data 1
This spreadsheet contains the mean GM volume of the left HPC VBM cluster and the volume of the automatically delineated left thalamus (z-res) and the remote autobiographical memory scores [max = 18; Autobiographical Memory Interview; (Kopelman et al., 1989)] of healthy controls and patients (over the age of 50 at the time of assessment; See Materials and methods section) that are plotted in Figure 8; GM: gray matter; HPC: hippocampus; MAP: Memory and Amnesia Project; OPTIMA: Oxford Project To Investigate Memory and Aging; VBM: voxel-based morphometry; z-res: volumes are residualized against age, sex, scan source (MAP, OPTIMA), and TIV across participants. These data can be opened with Microsoft Excel or with open-source alternatives such as OpenOffice.
- https://doi.org/10.7554/eLife.46156.020
Tables
Table 1
Neuropsychological profile of autoimmune LE patients (post-acute phase) and healthy controls
https://doi.org/10.7554/eLife.46156.003| Domain | Test | Subtest | Controls | Patients | Controls vs patients | ‘Impaired' range | |||||||
|---|---|---|---|---|---|---|---|---|---|---|---|---|---|
| M | IQR | M | IQR | Test | Statistic | p-corr | cut-off score | Patients (n) | Controls (n) | ||||
| Episodic Memory | Immediate Verbal Recall | WMS-III | Logical Memory I (z) | 0.33 | 1.92 | −1.00 | 1.34 | t | 6.78 | <0.0005 | ≤ - 1.67 | 14 | 0 |
| Word List I (z) | 0.67 | 1.83 | −1.00 | 1.51 | U | 178.00 | <0.0005 | ≤ - 1.67 | 11 | 0 | |||
| D and P | People (z) | −0.33 | 1.59 | −1.33 | 1.00 | U | 266.00 | <0.0005 | ≤ - 1.67 | 15 | 1 | ||
| Delayed Verbal Recall | WMS-III | Logical Memory II (z) | 0.67 | 1.67 | −2.00 | 2.00 | U | 106.50 | <0.0005 | ≤ - 1.67 | 23 | 0 | |
| Word List II (z) | 1.33 | 1.00 | −0.67 | 1.83 | U | 179.00 | <0.0005 | ≤ - 1.67 | 3 | 0 | |||
| Verbal Forgetting | D and P | Verbal Forgetting (z) | 0.67 | 1.00 | −0.33 | 1.75 | U | 415.50 | 0.0584 | ≤ - 1.67 | 8 | 1 | |
| Verbal Recognition | Names (z) | 0.33 | 2.00 | −1.00 | 2.00 | t | 5.16 | <0.0005 | ≤ - 1.67 | 13 | 1 | ||
| RMT | Words (z) | 1.00 | 1.51 | 0.00 | 2.26 | U | 317.50 | <0.0005 | ≤ - 1.67 | 9 | 4 | ||
| WMS-III | Word List II Recognition (z) | 0.67 | 1.00 | −0.67 | 2.16 | U | 266.50 | <0.0005 | ≤ - 1.67 | 9 | 0 | ||
| Immediate Visual Recall | D and P | Shapes (z) | 0.67 | 1.00 | −0.84 | 2.08 | Wt | 5.78 | <0.0005 | ≤ - 1.67 | 13 | 0 | |
| ROCFT | Immediate Recall (z) | 1.26 | 1.93 | −0.93 | 2.58 | U | 255.50 | <0.0005 | ≤ - 1.67 | 12 | 1 | ||
| Delayed Visual Recall | Delayed Recall (z) | 1.26 | 1.98 | −1.37 | 3.55 | U | 258.00 | <0.0005 | ≤ - 1.67 | 16 | 1 | ||
| Visual Forgetting | D and P | Visual Forgetting (z) | 0.33 | 0.00 | 0.33 | 1.83 | U | 433.00 | 0.0098 | ≤ - 1.67 | 8 | 1 | |
| Visual Recognition | Doors (z) | 0.67 | 1.33 | −0.67 | 1.75 | t | 3.74 | 0.0072 | ≤ - 1.67 | 7 | 1 | ||
| RMT | Scenes (z) | 1.00 | 0.99 | −0.35 | 2.65 | U | 281.00 | 0.0025 | ≤ - 1.67 | 9 | 0 | ||
| Faces (z) | 0.00 | 2.33 | −0.33 | 1.66 | t | 1.29 | 0.6536 | ≤ - 1.67 | 8 | 6 | |||
| Autobiographical Memory | AMI | Childhood (9) | 9.00 | 3.00 | 5.00 | 4.00 | U | 174.50 | <0.0005 | ≤3.00 * | 11 | 1 | |
| Early Adulthood (9) | 9.00 | 1.50 | 4.00 | 4.00 | U | 123.00 | <0.0005 | ≤3.00 * | 14 | 0 | |||
| Intelligence, Semantic Memory, and Language | Personal Semantic Memory | Childhood (21) | 19.50 | 3.00 | 18.00 | 5.00 | U | 267.00 | 0.0835 | ≤11.00 * | 3 | 0 | |
| Early Adulthood (21) | 20.50 | 2.00 | 19.00 | 2.50 | U | 263.00 | 0.0687 | ≤14.00 * | 4 | 1 | |||
| NART | p-FSIQ (z) | 1.44 | 0.85 | 1.04 | 1.05 | U | 486.00 | 0.1281 | ≤ - 1.67 | 0 | 0 | ||
| WASI/ | Vocabulary (z) | 1.40 | 1.25 | 0.70 | 1.20 | t | 3.05 | 0.0584 | ≤ - 1.67 | 0 | 0 | ||
| WASI-II | Similarities (z) | 1.05 | 0.80 | 0.70 | 0.85 | U | 378.00 | 0.1024 | ≤ - 1.67 | 0 | 0 | ||
| GNT | (z) | 0.63 | 0.98 | 0.15 | 1.89 | U | 423.50 | 0.0683 | ≤ - 1.67 | 5 | 0 | ||
| C and CT | (z) | 0.34 | 1.22 | 0.02 | 1.22 | U | 496.50 | 0.1484 | ≤ - 1.67 | 5 | 0 | ||
| Executive Function | WMS-III | Digit Span (z) | 0.84 | 1.25 | 0.33 | 1.67 | t | 2.70 | 0.1024 | ≤ - 1.67 | 2 | 1 | |
| DKEFS Trails | Number-Letter Switching (z) | 0.67 | 0.67 | 0.33 | 1.00 | U | 470.00 | 0.1024 | ≤ - 1.67 | 3 | 1 | ||
| Visuomotor Function | Visual Scanning (z) | 0.67 | 1.50 | 0.00 | 1.34 | U | 584.00 | 0.6536 | ≤ - 1.67 | 5 | 4 | ||
| Motor Speed (z) | 0.67 | 1.00 | 0.33 | 1.34 | U | 552.00 | 0.4915 | ≤ - 1.67 | 7 | 5 | |||
| ROCFT | copy rank | > 16th %ile | 0.00 | > 16th %ile | 0.00 | U | 619.00 | 0.4915 | ≤ 16th %ile | 2 | 1 | ||
| VOSP | Cube Analysis (z) | 10.00 | 1.00 | 9.00 | 2.00 | U | 548.00 | 0.3116 | ≤6.00 ** | 3 | 0 | ||
| Dot Counting (z) | 10.00 | 0.00 | 10.00 | 0.00 | U | 655.50 | 0.6536 | ≤8.00 ** | 1 | 1 | |||
| Position Discrimination (z) | 20.00 | 0.00 | 20.00 | 1.00 | U | 673.00 | 0.6536 | ≤18.00 ** | 4 | 2 | |||
| Mood | HADS | Anxiety (21) | 4.00 | 4.00 | 5.00 | 5.50 | U | 420.00 | 0.0910 | ≥15.00 *** | 3 | 0 | |
| Depression (21) | 1.00 | 1.00 | 3.00 | 4.50 | U | 298.00 | 0.0006 | ≥15.00 *** | 0 | 0 | |||
-
AMI: Autobiographical Memory Interview; D and P: Doors and People Test; DKEFS: Delis-Kaplan Executive Function System; GNT: Graded Naming Test; HADS: Hospital Anxiety and Depression Scale; IQR: Inter-Quartile Range; M: median; NART: National Adult Reading Test; p-corr: p values are corrected using the Holm-Bonferroni sequential correction for multiple comparisons (n = 35); RMT: Warrington Recognition Memory Tests (words, faces) and Warrington Topographical Memory test (scenes); ROCFT: Rey-Osterrieth Complex Figure Test; t: Student’s t-test; U: Mann-Whitney U; VOSP: Visual Object and Space Perception Battery; WASI/WASI-II Wechsler Abbreviated Scale of Intelligence; WMS-III: Wechsler Memory Scale III; Wt: Welch’s t-test; *,**,***: no standardized scores available for these subtests; *: highest score of ‘definitely abnormal’ range, that is scores at or below which none of the healthy controls scored in Kopelman et al. (1989); **: 5% cut-off score; ***: cut-off score for severe range.
Table 2
Clinical details of autoimmune LE patients (acute phase).
https://doi.org/10.7554/eLife.46156.022| Code | Age (years) | Sex | Antibody type | Acute T2 scan notes | ||
|---|---|---|---|---|---|---|
| HPC | Other structures | |||||
| R | L | |||||
| 1 | 65.75 | M | LGI1 | Normal T2 signal and volume; facilitated diffusion | High T2 signal; swelling; normal diffusion | L AMG: high T2 signal |
| 2 | 69.98 | F | VGKCC | Normal T2 signal; mild atrophy; facilitated diffusion | High T2 signal; normal volume; facilitated diffusion | No abnormalities |
| 3 | 62.23 | M | VGKCC | Normal T2 signal and volume; facilitated diffusion | High T2 signal; swelling; normal diffusion | L AMG, L ERC: high T2 signal |
| 4 | 46.41 | M | LGI1 | High T2 signal; normal volume; normal diffusion | Normal T2 signal and volume; facilitated diffusion | No abnormalities |
| 5 | 56.65 | M | LGI1 | L/R: high T2 signal | No abnormalities | |
| 6 | 58.18 | M | LGI1 | No abnormalities | ||
| 7 | 56.13 | M | LGI1 | Normal volume and signal | High T2 signal; swelling | L/R AMG: high T2 signal |
| 8 | 76.54 | M | LGI1 | High T2 signal; normal volume and diffusion | High T2 signal; normal volume; facilitated diffusion | No abnormalities |
| 9 | 54.94 | M | LGI1 | High T2 signal; swelling; normal diffusion | High T2 signal; swelling; normal diffusion | No abnormalities |
| 10 | 44.81 | M | LGI1 | L/R: high T2 signal; swelling | No abnormalities | |
| 11 | 45.77 | M | LGI1 | High T2 signal; normal volume | High T2 signal; normal volume | No abnormalities |
| 12 | 46.06 | M | LGI1/Caspr2 | High T2 signal; atrophy | Normal T2 signal and volume | No abnormalities |
| 13 | 35.75 | M | LGI1/Caspr2 | L/R: normal T2 signal; mild atrophy; normal diffusion | No abnormalities | |
| 14 | 72.08 | M | LGI1 | High T2 signal; mild atrophy; facilitated diffusion | Normal T2 signal; atrophy; facilitated diffusion | No abnormalities |
| 15 | 52.28 | M | LGI1 | High T2 signal; normal volume; facilitated diffusion | Normal T2 signal and volume; facilitated diffusion | No abnormalities |
| 16 | 52.48 | M | LGI1/Caspr2 | High T2 signal; swelling; facilitated diffusion | Normal T2 signal and volume; facilitated diffusion | No abnormalities |
| 17 | 51.62 | M | VGKCC | High T2 signal; swelling | Normal T2 signal and volume | No abnormalities |
| 18 | 75.18 | M | LGI1 | L/R: high T2 signal; swelling; normal diffusion | L/R AMG: high T2 signal; swelling | |
| 19 | 78.73 | M | LG1/Caspr2 | High T2 signal; mild atrophy; normal diffusion | High T2 signal; normal volume; normal diffusion | No abnormalities |
| 20 | 53.75 | F | LGI1 | L/R: high T2 signal; normal volume and diffusion | No abnormalities | |
| 21 | 73.68 | F | VGKCC | L/R: high T2 signal; swelling; facilitated diffusion | No abnormalities | |
| 22 | 63.59 | M | LGI1 | L/R: high T2 signal; normal volume and diffusion | No abnormalities | |
| 23 | 60.35 | M | VGKCC | No abnormalities | ||
| 24 | 54.30 | M | VGKCC | L/R: high T2 signal; atrophy | L/R AMG: high T2 signal; atrophy | |
| 25 | 52.70 | M | seronegative | L/R: high T2 signal | No abnormalities | |
| 26 | 47.43 | F | seronegative | No abnormalities | ||
| 27 | 58.60 | M | seronegative | L/R: high T2 signal | No abnormalities | |
| 28 | 25.42 | M | Anti-Ma2 | L/R: high T2 signal and swelling | No abnormalities | |
| 29 | 45.77 | F | seronegative | L/R: high T2 signal | No abnormalities | |
| 30 | 16.64 | F | GAD | No abnormalities | ||
| 31 | 71.35 | M | seronegative | L/R: high T2 signal; atrophy | No abnormalities | |
| 32 | 60.44 | M | VGKCC | L/R: atrophy | PHC atrophy | |
| 33 | 53.48 | M | seronegative | L/R: atrophy | No abnormalities | |
| 34 | 64.87 | F | seronegative | L/R: atrophy | No abnormalities | |
| 35 | 47.32 | F | seronegative | L/R: high T2 signal | R AMG: high T2 signal; swelling | |
| 36 | 61.88 | F | seronegative | L/R: high T2 signal; atrophy | No abnormalities | |
| 37 | 71.90 | F | seronegative | L/R: high T2 signal (especially R) | No abnormalities | |
| 38 | 34.49 | F | GAD | L/R: high T2 signal | No abnormalities | |
-
Age: age at symptom onset (years); AMG: Amygdala; Caspr2: anti-contactin-associated protein-like 2; ERC: entorhinal cortex; F = female; GAD: anti-glutamic acid decarboxylase autoantibody; HPC: hippocampus; L: left hemisphere; LGI1: anti-leucine-rich glioma-inactivated1; M = male; PHC: parahippocampal cortex; R: right hemisphere; VGKCC: anti-voltage-gated potassium channel complex. The clinical details of patients 1–24 have also been presented in Loane et al. (2019).
Table 3
Volumetry of MTL and subcortical structures in autoimmune LE patients.
https://doi.org/10.7554/eLife.46156.004| Structure | Controls | Patients | Mean % reduction | F | Partial η2 | p-corr | ||
|---|---|---|---|---|---|---|---|---|
| Mean (mm3) | SD (mm3) | Mean (mm3) | SD (mm3) | |||||
| R HPC | 3648.99 | 459.59 | 2733.87 | 751.09 | −25.08 | 63.38 | 0.390 | <0.0005 |
| L HPC | 3439.48 | 431.91 | 2671.18 | 710.65 | −22.34 | 46.02 | 0.317 | <0.0005 |
| R ERC | 1602.69 | 324.07 | 1254.97 | 404.70 | −21.70 | 10.76 | 0.119 | 0.0308 |
| L ERC | 1508.83 | 326.07 | 1200.18 | 432.07 | −20.46 | 9.48 | 0.106 | 0.0534 |
| R Thalamus | 7407.51 | 762.15 | 7072.79 | 845.09 | −4.52 | 8.23 | 0.077 | 0.0900 |
| L Thalamus | 7633.09 | 788.11 | 7194.76 | 797.73 | −5.74 | 15.41 | 0.135 | 0.0034 |
| R PRC | 1791.42 | 378.97 | 1561.61 | 403.86 | −12.83 | 7.11 | 0.082 | 0.1575 |
| L PRC | 1812.50 | 523.31 | 1601.39 | 478.78 | −11.65 | 2.88 | 0.035 | >0.9999 |
| R PHC | 1900.73 | 423.85 | 1665.68 | 331.28 | −12.37 | 6.36 | 0.074 | 0.2240 |
| L PHC | 2016.52 | 435.92 | 1851.53 | 445.52 | −8.18 | 1.53 | 0.019 | >0.9999 |
| R AMG | 1395.67 | 267.38 | 1313.76 | 406.51 | −5.87 | 5.15 | 0.060 | 0.3899 |
| L AMG | 1321.96 | 217.40 | 1268.47 | 384.22 | −4.05 | 4.43 | 0.053 | 0.5320 |
| R Nacc | 339.42 | 107.77 | 318.53 | 109.69 | −6.16 | 0.25 | 0.003 | >0.9999 |
| L Nacc | 433.79 | 127.41 | 381.89 | 153.66 | −11.96 | 3.70 | 0.036 | 0.7410 |
| R TPC | 4558.60 | 846.26 | 4520.16 | 1026.08 | −0.84 | 0.12 | 0.002 | >0.9999 |
| L TPC | 4331.40 | 742.35 | 4512.95 | 795.76 | 4.19 | 1.90 | 0.023 | >0.9999 |
| R Putamen | 4332.54 | 548.04 | 4157.00 | 630.21 | −4.05 | 0.85 | 0.008 | >0.9999 |
| L Putamen | 4382.39 | 705.40 | 4151.89 | 662.93 | −5.26 | 1.67 | 0.017 | >0.9999 |
| R Caudate | 3403.96 | 440.42 | 3369.16 | 453.63 | −1.02 | 0.06 | 0.001 | >0.9999 |
| L Caudate | 3211.40 | 438.40 | 3134.26 | 497.42 | −2.40 | 0.12 | 0.001 | >0.9999 |
| R Pallidum | 1705.61 | 260.63 | 1630.00 | 251.08 | −4.43 | 0.90 | 0.009 | >0.9999 |
| L Pallidum | 1720.40 | 297.86 | 1661.13 | 308.18 | −3.45 | 0.41 | 0.004 | >0.9999 |
| brainstem | 22119.06 | 2258.25 | 21931.42 | 2647.93 | −0.85 | 0.23 | 0.002 | >0.9999 |
-
Volumetry of manually and automatically delineated MTL and other subcortical structures of all patients (n = 38). Volumes for each structure are compared between patients and controls, using age, sex, TIV, and scan source (MAP, OPTIMA) as between-subjects covariates in a series of univariate ANCOVAs; AMG: amygdala; ANCOVA: analysis of covariance; ; ERC: entorhinal cortex; HPC: hippocampus; L: left hemisphere; MAP: Memory and Amnesia Project; MTL: medial temporal lobe; Nacc: nucleus accumbens; OPTIMA: Oxford Project To Investigate Memory and Aging; p-corr: p values are adjusted with the Holm-Bonferroni sequential correction method for multiple comparisons (n = 23); PHC: parahippocampal cortex; PRC: perirhinal cortex; R: right hemisphere; SD: standard deviation; TIV: total intracranial volume; TPC: temporopolar cortex.
Table 4
GM volume reduction in autoimmune LE patients (whole-brain VBM).
https://doi.org/10.7554/eLife.46156.008| kE | Peak | Center of mass | Structure | ||||||
|---|---|---|---|---|---|---|---|---|---|
| p-FWE | T | X | Y | Z | X | Y | Z | ||
| 2574 | <0.0005 | 7.53 | 28 | −17 | −20 | 28 | −16 | −18 | R HPC |
| 910 | <0.0005 | 6.81 | −29 | −12 | −18 | −27 | −15 | −19 | L HPC |
| 113 | 0.002 | 6.18 | 19 | −28 | 5 | 18 | −26 | 6 | R lateral thalamus |
| 414 | 0.006 | 5.85 | -1 | −16 | 0 | 3 | −12 | 7 | anterior/mediodorsal thalamus |
-
Contrast: controls > patients; covariates: age, sex, scan source (MAP, OPTIMA), and TIV. Clusters are FWE-corrected at peak-voxel level (p<0.05) over an individual voxel threshold of p<0.001 (unc.); voxel size: 1 mm3 isotropic; spatial smoothing kernel: 4 mm FWHM; FWHM: Full-width at half-maximum; HPC: hippocampus; kE: cluster size (number of voxels; minimum cluster size: 50 voxels); L: Left hemisphere; mm: millimeter; MAP: Memory and Amnesia Project; OPTIMA: Oxford Project To Investigate Memory and Aging; R: Right hemisphere; TIV: total intracranial volume; x, y, z: coordinates in mm.
Table 5
Summary of relationships between memory impairment and structural/functional abnormalities across patients.
https://doi.org/10.7554/eLife.46156.021| Memory composite score | Effects of HPC atrophy | |
|---|---|---|
| Anterograde retrieval | Verbal recognition | Does not explain additional variance beyond that explained by inter-HPC rsFC reduction |
| Visual Recognition | Fully mediated by PCC rsALFF reduction | |
| Verbal Recall | ||
| Visual Recall | ||
| Anterograde Retention (Visual Forgetting) | Direct effect - not mediated by extra-HPC abnormalities | |
| Remote Autobiographical Memory | Fully mediated by thalamic volume reduction | |
-
HPC: hippocampus; PCC: posterior cingulate cortex; rsALFF: resting-state amplitude of low frequency fluctuations; rsFC: resting-state functional connectivity.
Additional files
-
Supplementary file 1
Supplementary tables.
(A) Composite Memory scores for autoimmune LE patients and healthy controls; ‘max = 18’: the maximum score sum attainable for the autobiographical memory for childhood and early adulthood in the AMI (Kopelman et al., 1989), which does not use age-scaled / standardized scores; p-corr: p values are adjusted for multiple testing using the Holm-Bonferroni sequential method (n=3); U: Mann-Whitney U; Wt: Welch’s test; z: standardized age-scaled scores; *: Shapiro-Wilk test: p < 0.05. (B) Relationship of delay since symptom onset with structural and functional abnormalities. Given our hypothesis that broader network abnormalities unfold as a consequence of acute HPC atrophy (i.e. at a time-point after the acute focus of HPC damage), we also assessed the relationship of the delay between symptom onset and research participation with the extent of HPC and extra-HPC structural and functional abnormalities in a series of bivariate correlations. Of the structural/functional abnormalities (n=13) identified in our patient group, only inter-HPC rsFC decreased across patients as a function of the delay between symptom onset and research scan (rho=-0.58, p-corr=0.004). No other brain abnormalities showed this relationship, even at uncorrected levels (all rhos, |rho| ≤ 0.255; all ps, p-unc ≥ 0.122); bold: p-corr < 0.05; HPC: hippocampus; L, R: left, right (hemisphere); MPFC: medial prefrontal cortex; p-corr: p values are adjusted for multiple testing (n=13) using the Holm-Bonferroni sequential method; PCC: posterior cingulate cortex; PrCu: precuneus; rho: Spearmann’s rank correlation coefficient; rsALFF: resting-state amplitude of low frequency fluctuations; rsFC: resting-state functional connectivity; OPTIMA: Oxford Project To Investigate Memory and Aging; MAP: Memory and Amnesia Project; TIV: total intracranial volume; z-res: volumes are residualized against age, sex, scan source (MAP, OPTIMA), and TIV; functional abnormalities are residualized against age and sex. (C) Correlation of memory scores with structural / functional abnormalities across patients [analysis-level correction for multiple testing (n=39)]; bold: p-corr < 0.05; GM: gray matter; HPC: hippocampus; L: left hemisphere; M: medial; MAP: Memory and Amnesia Project; MPFC: medial prefrontal cortex; OPTIMA: Oxford Project To Investigate Memory and Aging; PCC: posterior cingulate cortex; p-corr: p values of bivariate correlations are corrected for multiple testing using the Holm-Bonferroni sequential method of correction for the total number of correlations (n = 39); PMC: posteromedial cortex; PrCu: precuneus; rsALFF: amplitude of low frequency fluctuations; rsFC: resting-state functional connectivity; R: right hemisphere; TIV: total intracranial volume; VBM: voxel-based morphometry; z-res: Mean rsALFF and rsFC values are residualized for age and sex across participants; volumes are residualized against age, sex, scan source (OPTIMA, MAP) and TIV across participants. (D) Correlation of memory scores with structural / functional abnormalities across patients [score-level correction for multiple testing (n=13), separately for each of the different memory scores (n=6) examined]; bold: p-corr < 0.05; HPC: hippocampus; MAP: Memory and Amnesia Project; MPFC: medial prefrontal cortex; OPTIMA: Oxford Project To Investigate Memory and Aging; PCC: posterior cingulate cortex; p-corr: p values of bivariate correlations are corrected for multiple testing using the Holm-Bonferroni sequential method of correction for the number of different variables (n = 13) per memory score examined; PrCu: precuneus; rsALFF: amplitude of low frequency fluctuations; rsFC: resting-state functional connectivity; VBM: voxel-based morphometry; z-res: Mean rsALFF and rsFC values are residualized for age and sex across participants; volumes (derived from manual / automated segmentation or from the mean GM volume expressed by VBM clusters) were residualized against age, sex, TIV, and scan source (MAP, OPTIMA) across participants. (E) Relationship of memory scores with volumes of manually delineated HPC portions. *: verbal / visual recognition, visual recall composite scores: No significant correlations were observed between those scores and the volumes of the manually delineated left/right anterior/posterior HPC portions at uncorrected levels (all ps, p-unc > 0.05); **: verbal recall composite scores: A weak correlation was observed with the left anterior HPC at uncorrected levels (r = 0.351, p-unc = 0.033; rest of ps, p-unc ≥ 0.095). Since patients’ rsALFF in the PCC did not correlate significantly with the volume of the manually delineated left anterior HPC (r = 0.333, p = 0.050), we entered these two factors as independent variables in a multiple step-wise linear regression, with verbal recall scores as the dependent variable. The regression terminated in a single step, with rsALFF in the PCC as the only predictor of patients’ performance (R2=0.34; β(z)=0.58; F=16.40, p < 0.0005); ***: visual forgetting scores: There was no clear evidence for a selective relationship of visual forgetting with anterior vs. posterior portions of the HPC (all rhos, 0.471≥ rho ≥ 0.332; all ps, 0.055 ≥ p-unc ≥ 0.005); ****: Correlations of remote autobiographical memory with volumes of manually delineated portions of the HPC (anterior / posterior right / left HPC) were observed at uncorrected levels (0.429 ≥ r ≥ 0.334; 0.066 ≥ p-unc ≥ 0.016). All four HPC portions correlated volumetrically with the left thalamus (right anterior HPC: r = 0.327, p-unc = 0.045; left anterior HPC: r = 0.427, p-unc = 0.007; right posterior HPC: r = 0.362, p-unc = 0.025; left posterior HPC: r = 0.360, p-unc = 0.026). A series of four partial correlational analyses demonstrated that left thalamic volume correlated with remote autobiographical memory scores over and above the volume of each of those four manually delineated HPC portions (control variable: right anterior HPC: r = 0.489, p = 0.006; left anterior HPC: r = 0.482, p = 0.007; right posterior HPC: r = 0.505; p = 0.004; left posterior HPC: r = 0.509, p = 0.004); aHPC: anterior hippocampus; HPC: hippocampus; L: left hemisphere; MAP: Memory and Amnesia Project; OPTIMA: Oxford Project To Investigate Memory and Aging; pHPC: posterior hippocampus; p-unc: p values of bivariate correlations are presented at uncorrected levels for display purposes; R: right hemisphere; rho: Spearmann’s rank correlation coefficient; r: Pearson’s correlation coefficient; TIV: total intracranial volume; z: average of age-scaled standardized scores on neuropsychological tests of episodic memory; z-res: volumes for each HPC portion are residualized against age, sex, TIV, and scan source (MAP, OPTIMA) across participants. (F) ‘Impaired’ vs. ‘Unimpaired’ patients on visual forgetting: Structural/Functional abnormalities. Given that 17 of our patients reached ceiling scores in visual forgetting, we also dichotomized our patient group into two subgroups, those that attained ceiling scores (z=0.33), and those with lower scores (z<0.33). We therefore compared the two patient subgroups across the 13 structural and functional abnormalities identified above at whole-group level. Consistent with our correlational approach, the two patient subgroups differed only with respect to the volume of the right HPC, as expressed in manual volumetry (t = -3.32, p-corr = 0.027) and in the right HPC VBM cluster (t = -4.05, p-corr = 0.004; rest of ps, p-corr ≥ 0.143); We then iterated these comparisons with a series of one-way ANCOVAs, including patients’ HADS scores for depression as a covariate of no interest. The results retained their significance (manually delineated right HPC volume: F = 9.96; p-corr = 0.048; right HPC VBM cluster: F = 14.94, p-corr = 0.007; rest of ps, p-corr ≥ 0.232); p-corr: significance values are corrected for multiple testing using the Holm-Bonferroni sequential method (Holm, 1979); t/Wt: comparison between the two subgroups across the 13 structural/functional abnormalities identified at group level for patients; F: these comparisons were iterated in the form of a series of univariate ANCOVAs, including patients’ scores for depression (HADS) as between-subjects covariates; z-res: volumes are residualized against age, sex, scan source (MAP, OPTIMA), and TIV; functional abnormalities are residualized against age and sex; t: Student t-test; Wt: Welch t-test; SD: standard deviation; bold: p-corr < 0.05; HADS: Hospital Anxiety and Depression Scale (Zigmond and Snaith, 1983); ANCOVA: analysis of covariance; OPTIMA: Oxford Project To Investigate Memory and Aging; MAP: Memory and Amnesia Project. (G) Comparison of treated vs. untreated patients on memory scores and structural/functional brain abnormalities. We investigated whether patients that had been treated with immunosuppressive therapy (n=31) showed less pronounced memory impairment and brain abnormalities as compared with those that had not received treatment (n=7), in order to ensure that the structure/function-behavior relationships disclosed across all 38 patients were not driven by the subgroup of patients that had not received such treatment. Patients who had not received such treatment scored lower than the rest of the patients on anterograde retrieval, but not on visual forgetting, or remote autobiographical memory. Nevertheless, the two patient subgroups did not differ with respect to the extent of structural or functional brain abnormalities that we observed above for the entire group of patients (all ps, p-corr ≥ 0.832), even at uncorrected levels (all ps, p-unc > 0.06); p-corr: Holm-Bonferroni (Holm, 1979) correction applied separately for the number of memory scores (n=3) and the number of structural/functional abnormalities (n=13); bold: p-corr < 0.05; z: average of age-scaled standardized scores on neuropsychological tests of episodic memory; z-res: volumes are residualized against age, sex, scan source (MAP, OPTIMA), and TIV; functional abnormalities are residualized against age and sex. (H) Correlation of anterograde retrieval scores with structural / functional abnormalities across patients that had received immunosuppressive therapy. Given the more pronounced impairment on anterograde retrieval of patients that had not received immunosuppressive therapy, we sought to determine whether the relationship of this composite score with reduced rsALFF in the PCC held when the analysis was confined to the 31 patients that had received immunosuppressive therapy. Indeed, the relationship between reduced rsALFF in the PCC and impaired anterograde retrieval retained its significance across this patient subgroup; L, R: left, right (hemisphere); HPC: hippocampus; MPFC: medial prefrontal cortex; p-corr: p values are adjusted for multiple testing using the Holm-Bonferroni sequential method; bold: p-corr < 0.05; rsALFF: resting-state amplitude of low frequency fluctuations; rsFC: resting-state functional connectivity; PrCu: precuneus; PCC: posterior cingulate cortex; z-res: volumes are residualized against age, sex, scan source (MAP, OPTIMA), and TIV; functional abnormalities are residualized against age and sex. (I) Participants - data availability. Numbers of healthy controls and patients that underwent structural, functional MRI, and neuropsychological assessment. *: While the healthy controls whose structural MRI datasets were added from the OPTIMA project had not been assessed with our laboratory’s neuropsychological battery, they had been assessed with tests measuring overall cognitive impairment [Mini-Mental State Examination – MMSE; (Folstein et al., 1975)]. Expectedly, these scores indicated that none of those healthy controls had any apparent cognitive impairment [mean = 29.74, SD = 0.56, min = 28, well above widely accepted cut-offs, for example (Aevarsson and Skoog, 2000; Di Carlo et al., 2002)]. OPTIMA: Oxford Project To Investigate Memory and Aging; MAP: Memory and Amnesia Project; (rsf)MRI: (resting-state functional) Magnetic Resonance Imaging; n: number of participants.
- https://doi.org/10.7554/eLife.46156.023
-
Transparent reporting form
- https://doi.org/10.7554/eLife.46156.024
Download links
A two-part list of links to download the article, or parts of the article, in various formats.
Downloads (link to download the article as PDF)
Open citations (links to open the citations from this article in various online reference manager services)
Cite this article (links to download the citations from this article in formats compatible with various reference manager tools)
Network-wide abnormalities explain memory variability in hippocampal amnesia
eLife 8:e46156.
https://doi.org/10.7554/eLife.46156


