Identification of RBPMS as a mammalian smooth muscle master splicing regulator via proximity of its gene with super-enhancers
- University of Cambridge, United Kingdom
- Francis Crick Institute, United Kingdom
Figures
Figure 1 with 3 supplements
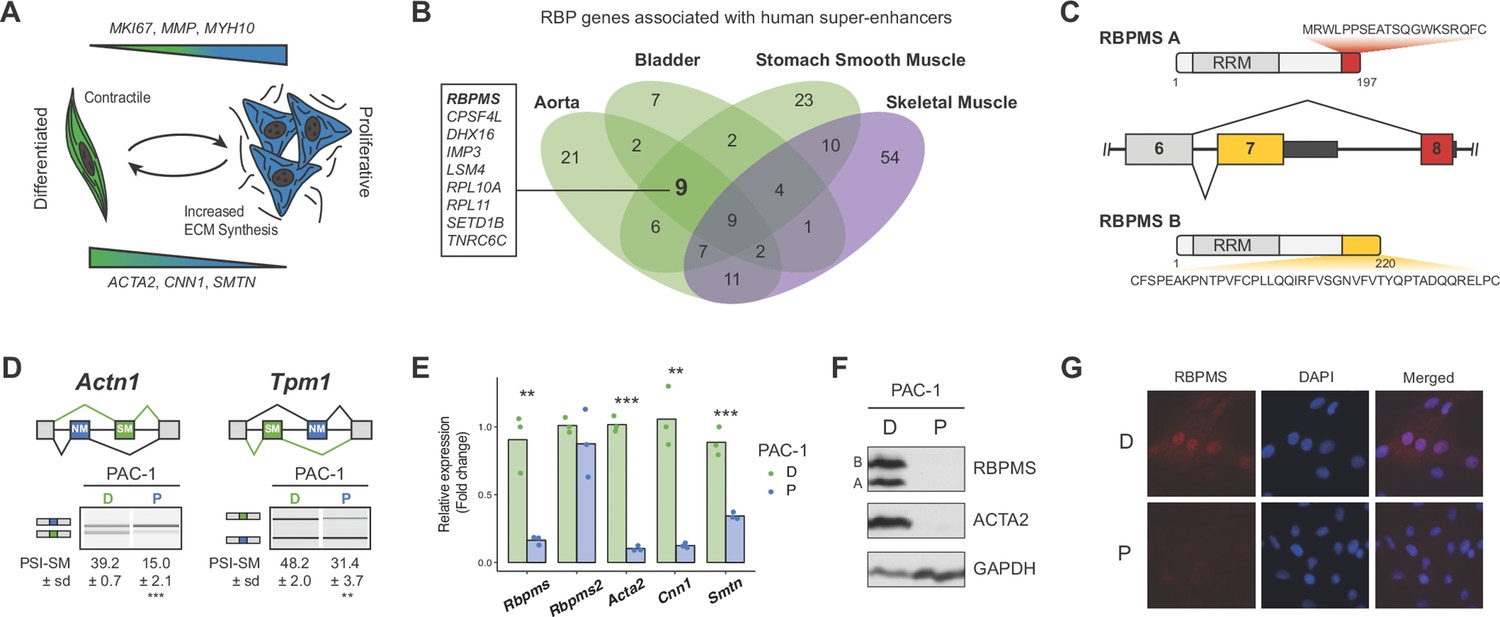
RBPMS is associated with SMC super-enhancers and is highly expressed in the differentiated PAC1 cells.
(A) Diagram of the SMC dedifferentiation. SMC markers of differentiation and dedifferentiation are respectively shown at the bottom and top of the diagram. (B) Venn diagram of RBP genes associated with super-enhancers across different human smooth muscle tissues. Skeletal muscle was used as an outlier. RBPs common to all smooth muscle tissues but not skeletal muscle are shown on the left. (C) Schematic of the AS event determining the two major RBPMS isoforms, RBPMS A (red) and RBPMS B (yellow). (D) RT-PCR analysis of SMC splicing markers, Actn1 and Tpm1, in differentiated (D) and proliferative (P) PAC1 cells. Schematic of the regulated mutually exclusive splicing events on top and respective isoforms products on the left. Values shown are the quantified PSI (percent spliced in) of the smooth muscle isoforms (SM) ± standard deviation (n = 3). (E) qRT-PCR analysis of Rbpms (all isoforms), Rbpms2 and SMC differentiation markers Acta2, Cnn1 and Smtn, in PAC1 cells D (green) and P (blue). Expression was normalized to the average of two housekeepers (Gapdh and Rpl32) and the mean of the relative expression is shown (n = 3). Each point shows data from an individual sample. Statistical significance was performed using Student’s t-test (*p<0.05, **p<0.01, ***p<0.001). (F) Western blots for RBPMS in D and P PAC1 cells. ACTA2 is a SMC differentiation marker and GAPDH a loading control. A and B indicates the two RBPMS isoforms. (G) Immunofluorescence in D and P PAC1 cells for RBPMS. DAPI staining for nuclei.
Figure 1—figure supplement 1
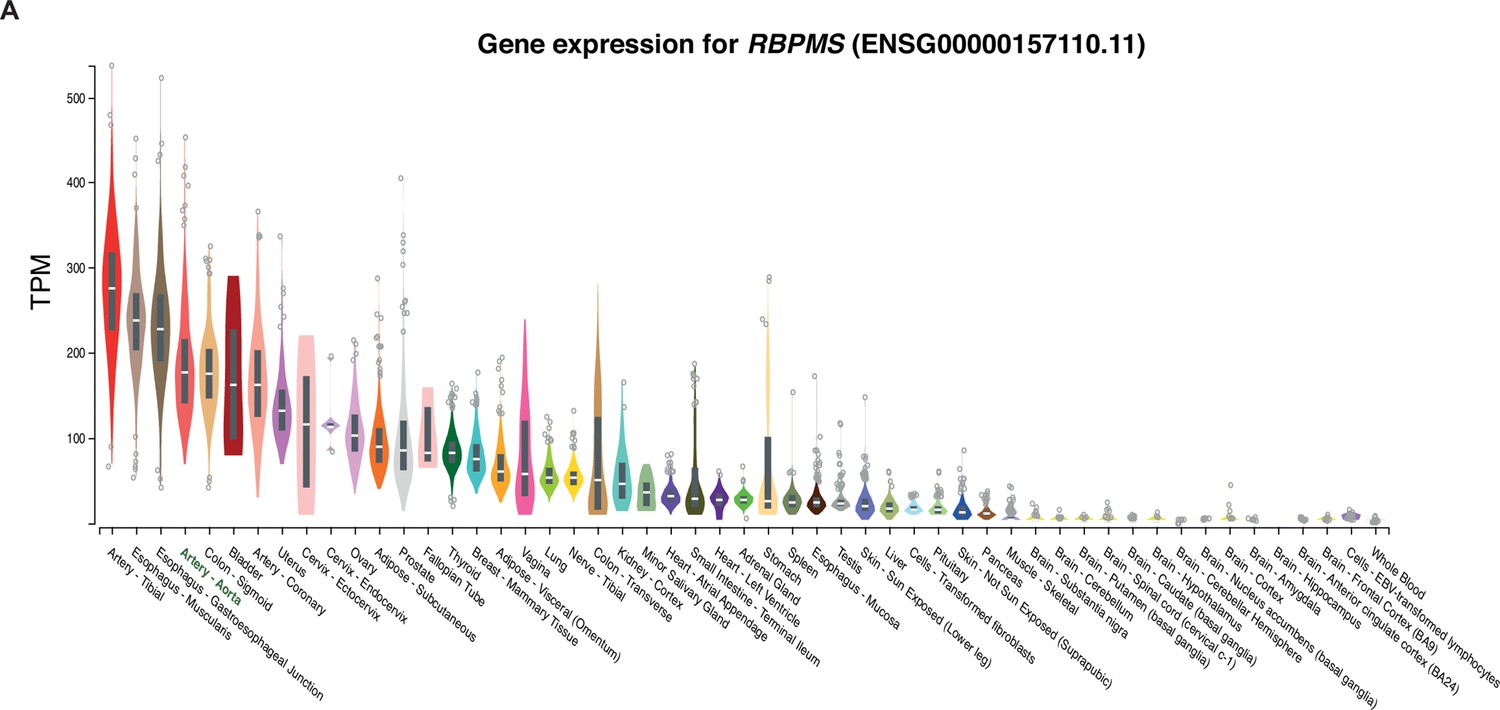
RBPMS is highly expressed in SM tissues.
(A) RBPMS mRNA expression across different human tissues in the GTEX database (GTEx Consortium, 2013). TPM: transcripts per million.
Figure 1—figure supplement 2
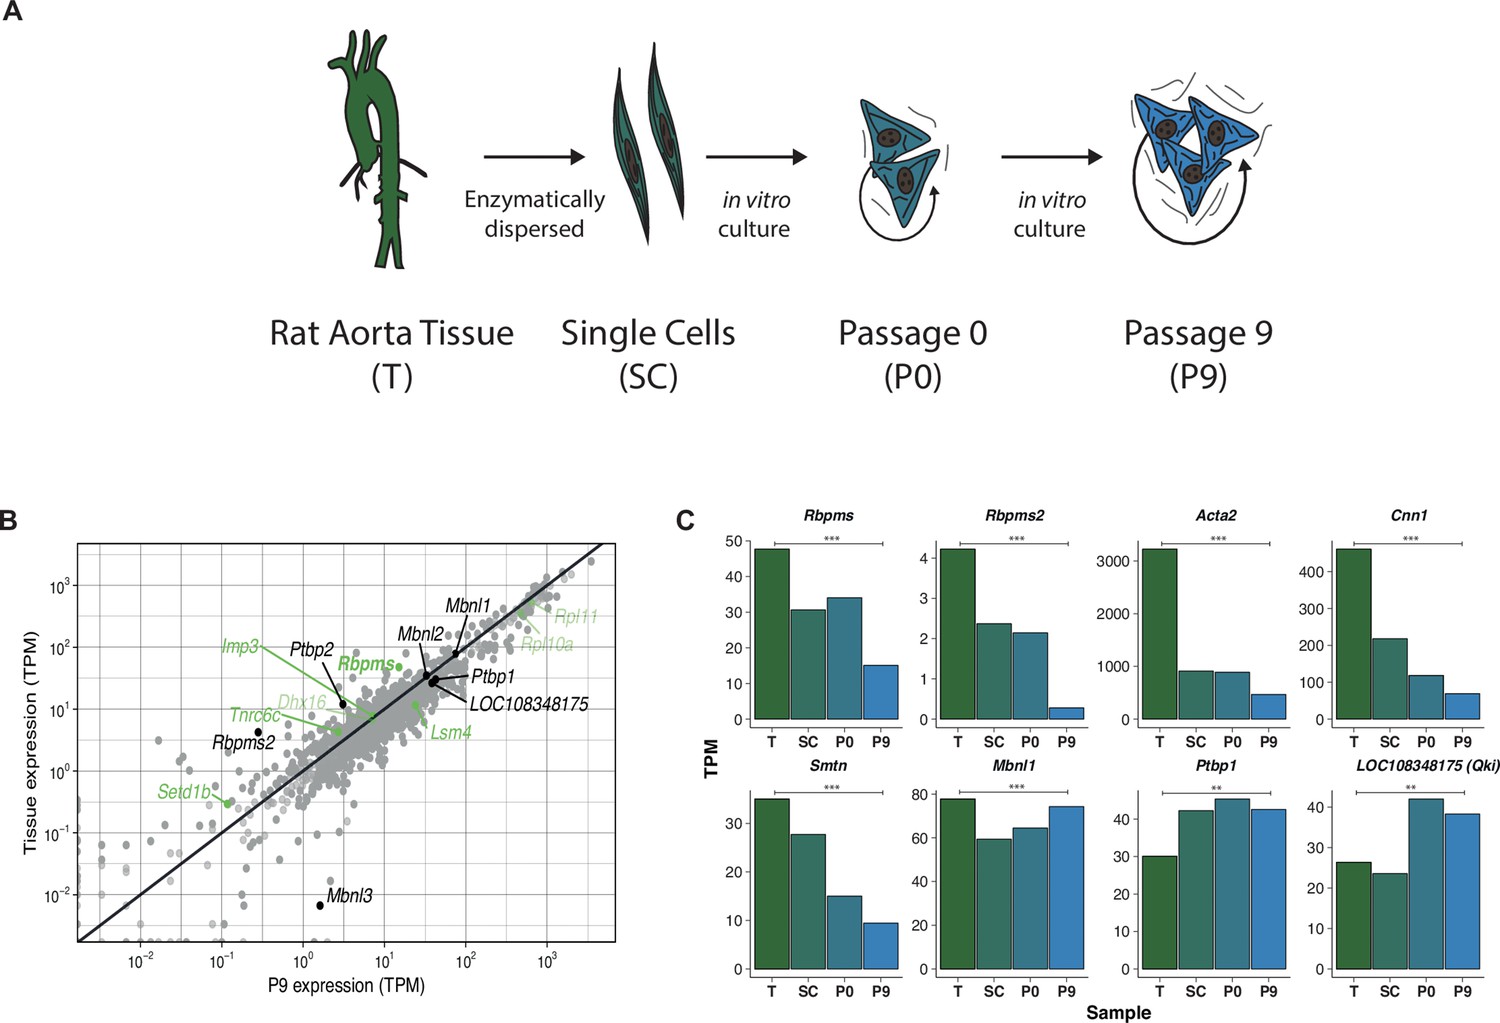
mRNA abundance analysis of the rat aorta SMC de-differentiation RNA-Seq.
(A) Schematic of the experimental design of the rat aorta tissue dedifferentiation. (B) mRNA abundance of RBP genes in differentiated aorta tissue (T) and proliferative passage 9 (P9). RBPs whose genes were found associated with smooth muscle tissue super-enhancers (Figure 1B) are highlighted in green. Additionally, other well characterized RBPs and Rbpms2 are labelled in black. LOC108348175 is the Ensembl annotated rat Qki like gene. Statistical significance in mRNA abundance changes between T and P9 was calculated by DESeq2 and is indicated in dark and light gray color (padj <0.05 and non-significant changes respectively). mRNA levels are expressed in transcripts per million (TPM). Cpsf4l gene was not found in this dataset. (C) mRNA abundance changes measured in transcripts per million (TPM) during rat aorta dedifferentiation (T, SC, P0 and P9). Genes shown are Rbpms and its paralog Rbpms2, SMC differentiation markers, Acta2, Cnn1 and Smtn, and other RBPs, Mbnl1, Ptbp1 and Qk1.
Figure 1—figure supplement 3
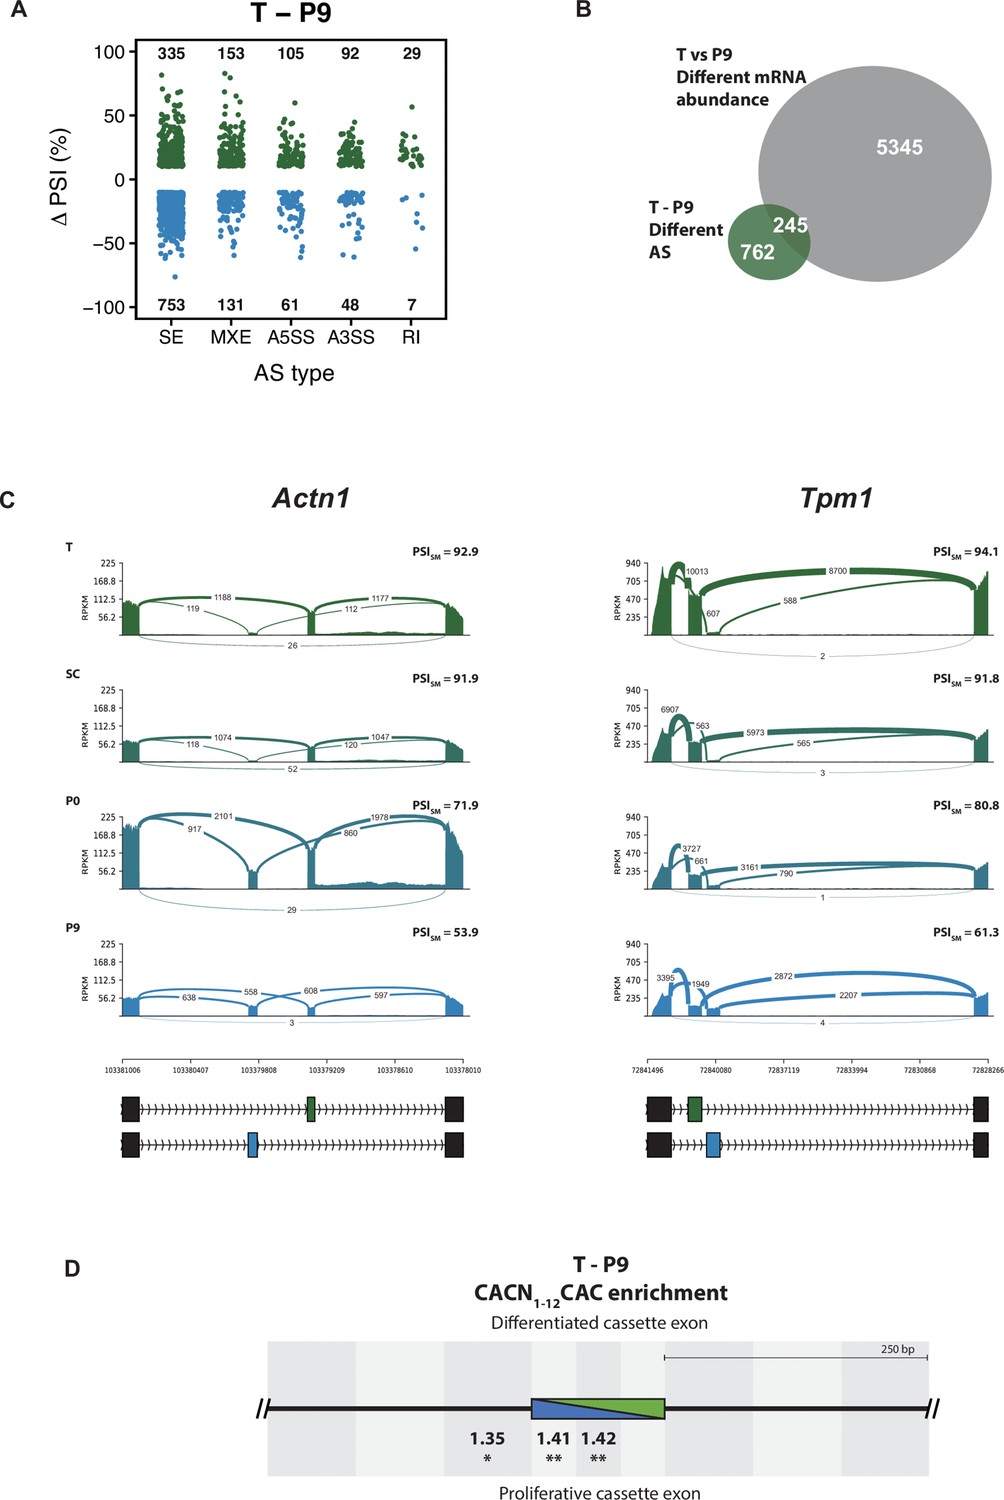
Alternative splicing analysis of the rat aorta SMC de-differentiation RNA-Seq.
(A) AS changes when comparing T and P9 conditions. Only significant ASE with FDR < 0.05 and ΔPSI greater than 10% are shown. ASE were classified as skipped exons (SE), mutually exclusive exons (MXE), 5’and 3’ alternative splice sites (A5SS and A3SS) and retained intron (RI). The number of events differentially alternatively spliced are shown in the graph. (B) Overlap of the number of genes affected at the levels of mRNA abundance and AS in the T and P9 comparison. (C) Sashimi plot of the SMC mutually exclusive splicing markers, Actn1 and Tpm1, in rat aorta tissue dedifferentiation. PSI values represent the mean of the PSI values calculated by rMATS. (D) RBPMS motif enrichment in differentially alternatively spliced SE in the T and P9 comparison. A pair of CAC separated by 1 to 12 nt was used as the RBPMS motif. Values indicate the motif enrichment. Statistical significance was calculated by the Matt tool (*p<0.05, **p<0.01, ***p<0.001).
Figure 2 with 3 supplements
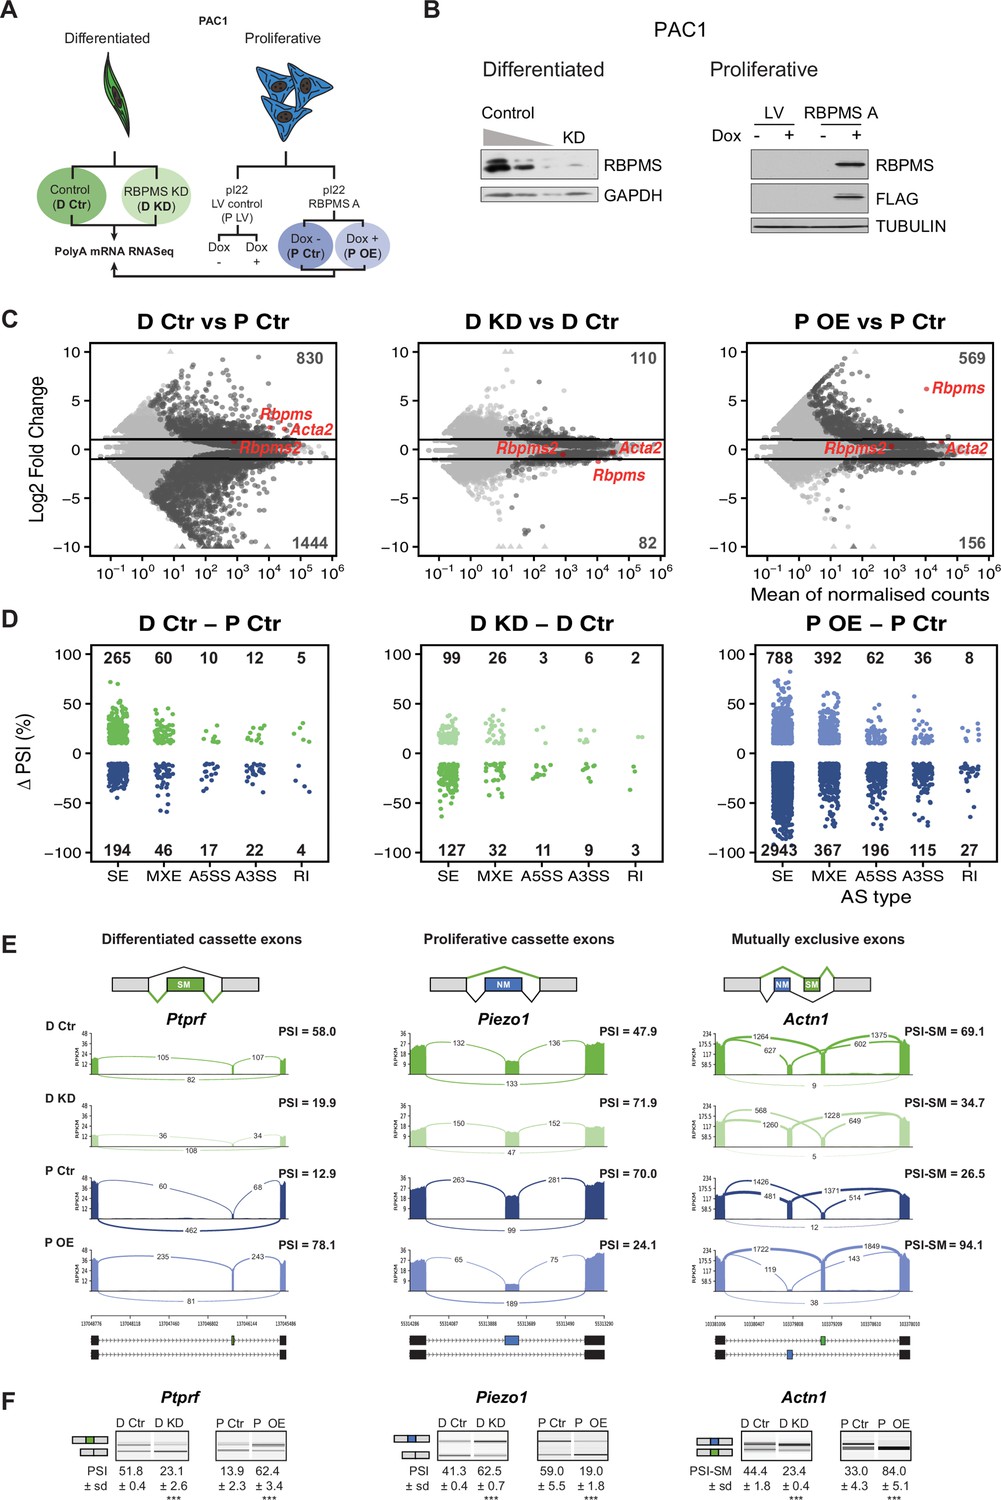
RBPMS regulates AS in PAC1 cells.
(A) Schematic of experimental design of RBPMS knockdown and overexpression in PAC1 cells. (B) Western blots for RBPMS in PAC1 knockdown, left, and inducible lentiviral overexpression, right. FLAG antibodies were also used for the overexpression of 3xFLAG tagged RBPMS. GAPDH and TUBULIN were used as loading controls. (C) MA plots of alterations in mRNA abundance in PAC1 dedifferentiation, left, RBPMS knockdown, middle, and RBPMS A overexpression, right. Dark gray: genes with significant changes (p-adj <0.05). Light gray: genes with p-adj ≥0.05. Red: Rbpms, Rbpms2 and the SMC marker, Acta2. Numbers of up and down-regulated are shown at top and bottom. Horizontal lines; log2 fold change = 1 and −1. (D) AS changes (FDR < 0.05 and ΔPSI greater than 10%) in PAC1 cell dedifferentiation, left, RBPMS knockdown, middle, and RBPMS A overexpression, right. ASE were classified into skipped exon (SE), mutually exclusive exon (MXE), alternative 5′ and 3′ splice site (A5SS and A3SS) and retained intron (RI) by rMATS. Numbers indicate the number of significant ASE of each event type between the conditions compared. (E) Sashimi plots of selected ASEs. Ptprf is shown as a differentiated cassette exon (green), Piezo1 as a proliferative cassette exons (blue) and Actn1 as a MXE. The numbers on the arches indicate the number of reads mapping to the exon-exon junctions. PSI values for the ASE are indicated for each condition. Values correspond to the mean PSI calculated by rMATS. In the case of the Actn1 MXE, the percent inclusion of the SM exon is shown (PSI-SM). Schematic of the mRNA isoforms generated by the alternative splicing are found at the bottom as well as the chromosome coordinates. (F) RT-PCR validation of ASEs from panel E. Values shown are the mean of the PSI ± standard deviation (n = 3). Statistical significance was calculated using Student’s t-test (*p<0.05, **p<0.01, ***p<0.001). See Figure 2—figure supplement 3 for more ASEs validated in the RBPMS knockdown and RBPMS A overexpression by RT-PCR.
Figure 2—figure supplement 1
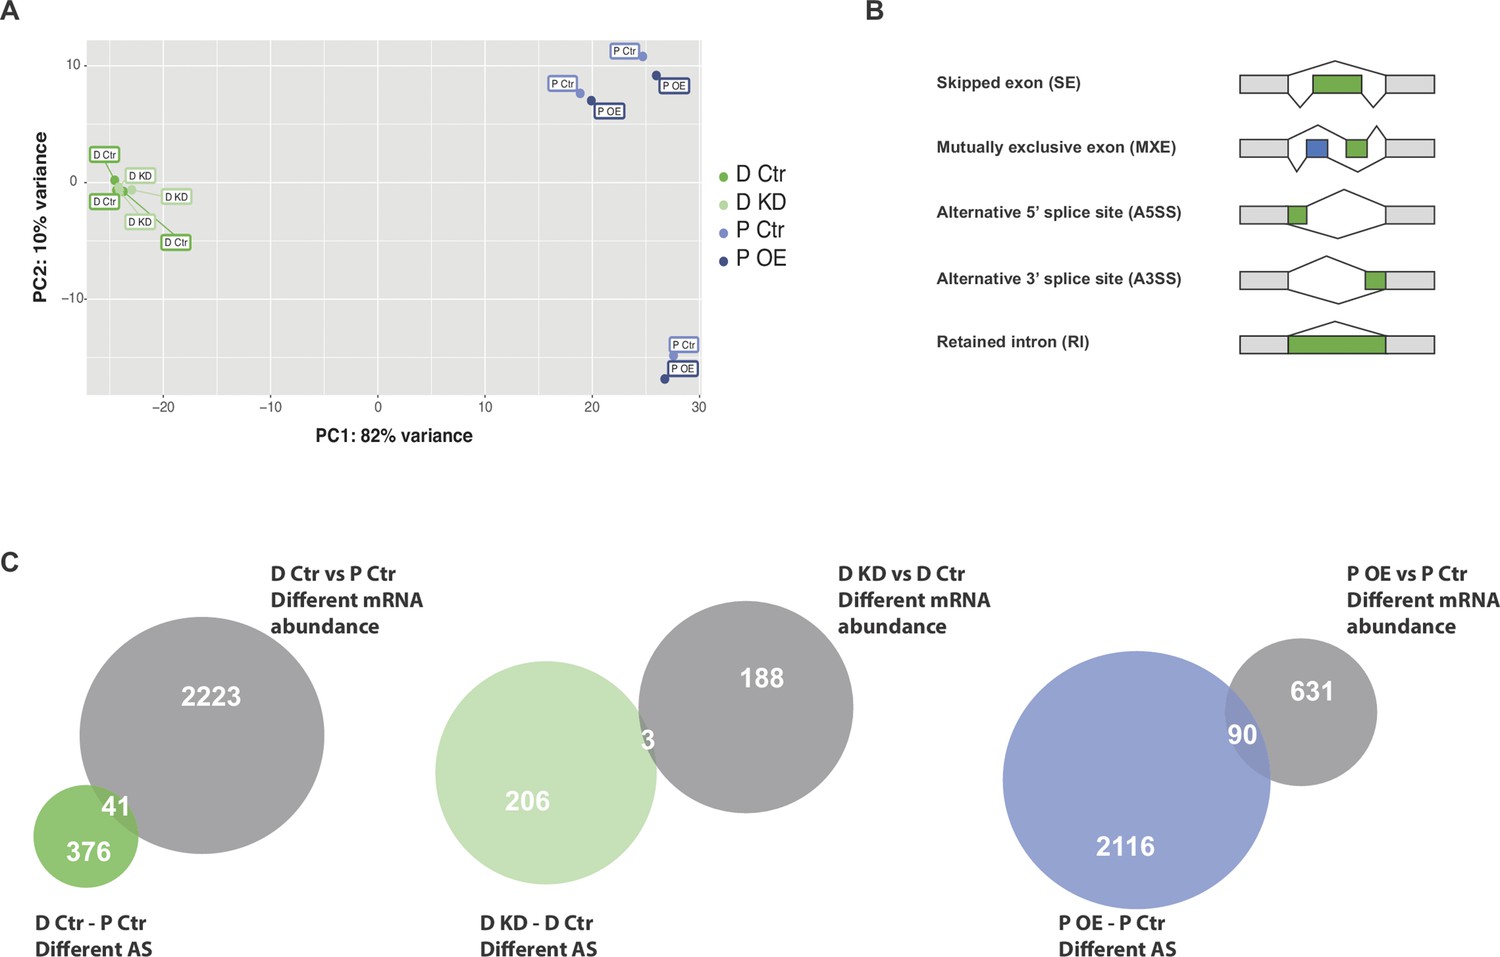
Principal Component Analysis of PAC1 RNAseq samples and overlap of genes regulated at the splicing and abundance levels.
(A) Principal Component Analysis (PCA) based upon mRNA abundance variance of RBPMS knockdown (D Ctr and D KD) and overexpression (P Ctr and P OE) replicates. (B) Schematics of the different AS types detected by rMATS. (C) Overlap of the number of genes affected at the levels of mRNA abundance and AS in the PAC1 dedifferentiation and RBPMS knockdown and overexpression comparisons.
Figure 2—figure supplement 2
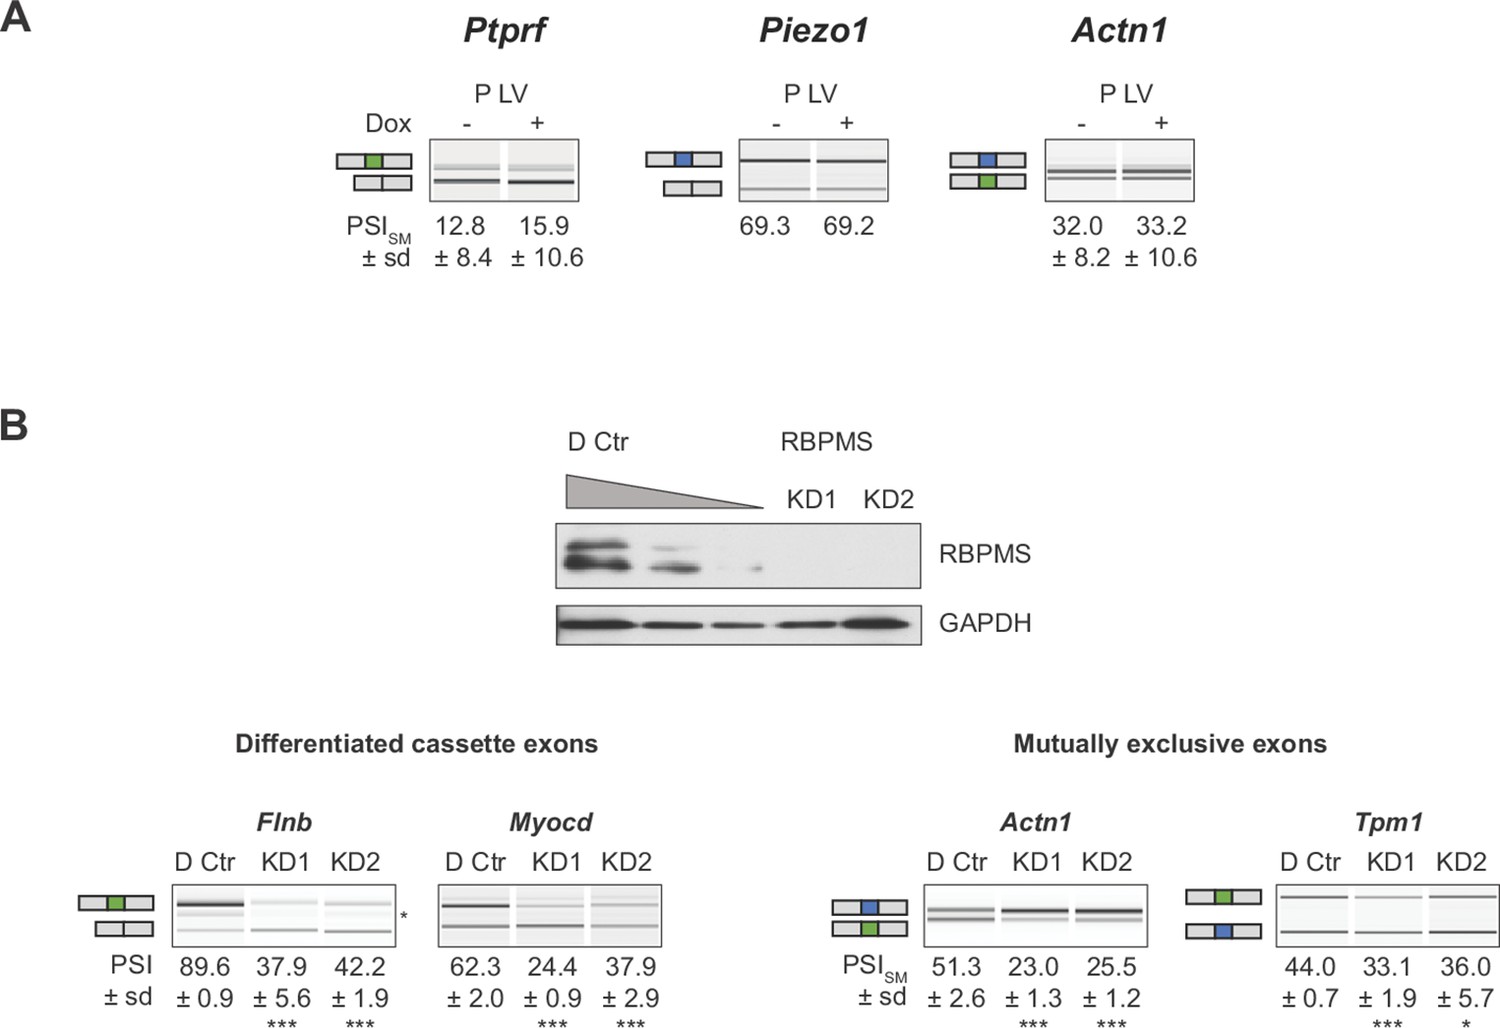
AS changes of SM genes are specific to RBPMS expression.
(A) Validation of lack of regulated splicing in lentiviral control populations (P LV) upon doxycycline treatment. (B) Validation of a second RBPMS siRNA (KD2, Stealth siRNAs, Thermo Fisher Scientific (RSS363829): CGCUUCGAUCCUGAAAUCCCGCAAA). Western blot probing for RBPMS in differentiated PAC1 cells treated with one of the siRNAs. GAPDH was used as a loading control in the western blot. RNAs were extracted and RT-PCR carried out to validate the ASE previously characterized for KD1. In (A) and (B), values shown are the mean ± sd of PSI (n = 3). Statistical significance was calculated using Student’s t-test (*p<0.05, **p<0.01, ***p<0.001).
Figure 2—figure supplement 3
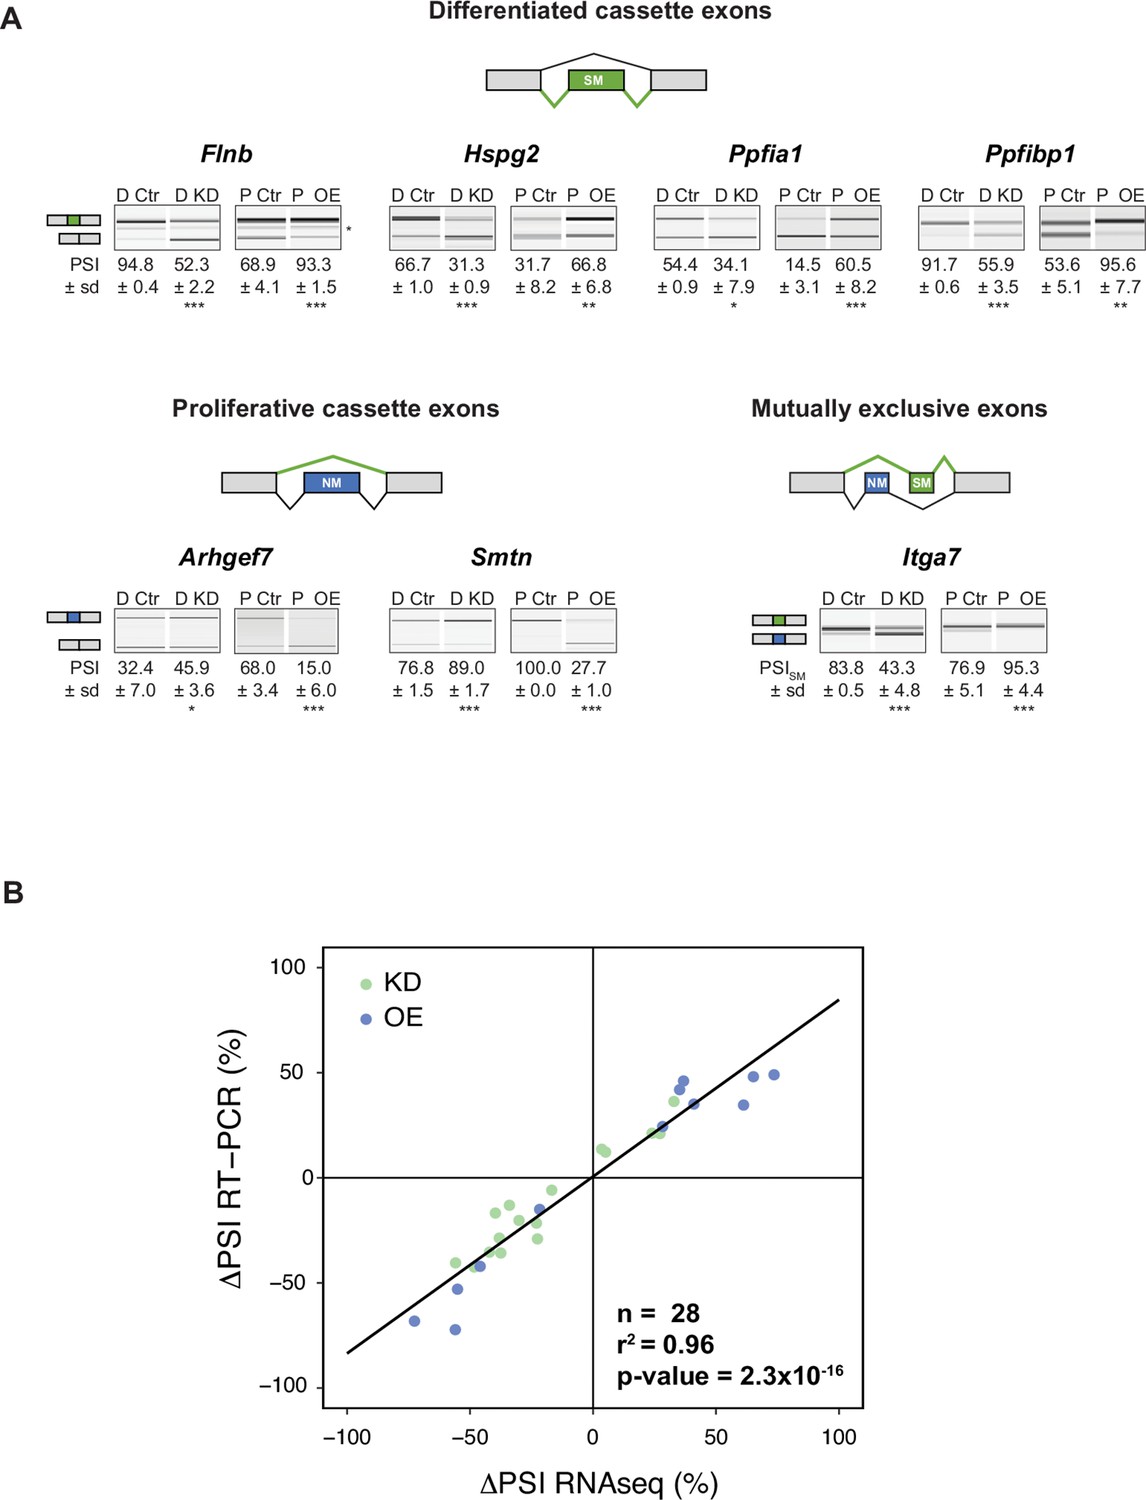
ΔPSI values determined by RT-PCR and RNA-Seq show good agreement.
(A) Validation of differentiated and proliferative cassette and mutually exclusive splicing events by RT-PCR for both RBPMS knockdown and overexpression. Schematics indicate the splicing isoform corresponding to the PCR product. Values shown are the mean ± sd of PSI (n = 3). Statistical significance was calculated using Student’s t-test (*p<0.05, **p<0.01, ***p<0.001). (B) PSI correlation between the estimated ΔPSI from the rMATS analysis of the RBPMS knockdown and overexpression RNAseq experiments and the observed ΔPSI from the RT-PCR validations of RBPMS experiments (n = 28). Black line indicates the linear regression model. For statistical significance, a Pearson correlation test was carried out in RStudio and the results are shown in the right corner of the plot. r2 is the correlation coefficient and the p-value indicates the statistical significance of the correlation.
Figure 3 with 1 supplement
RBPMS recapitulates the AS program of differentiated PAC1 and aorta tissue.
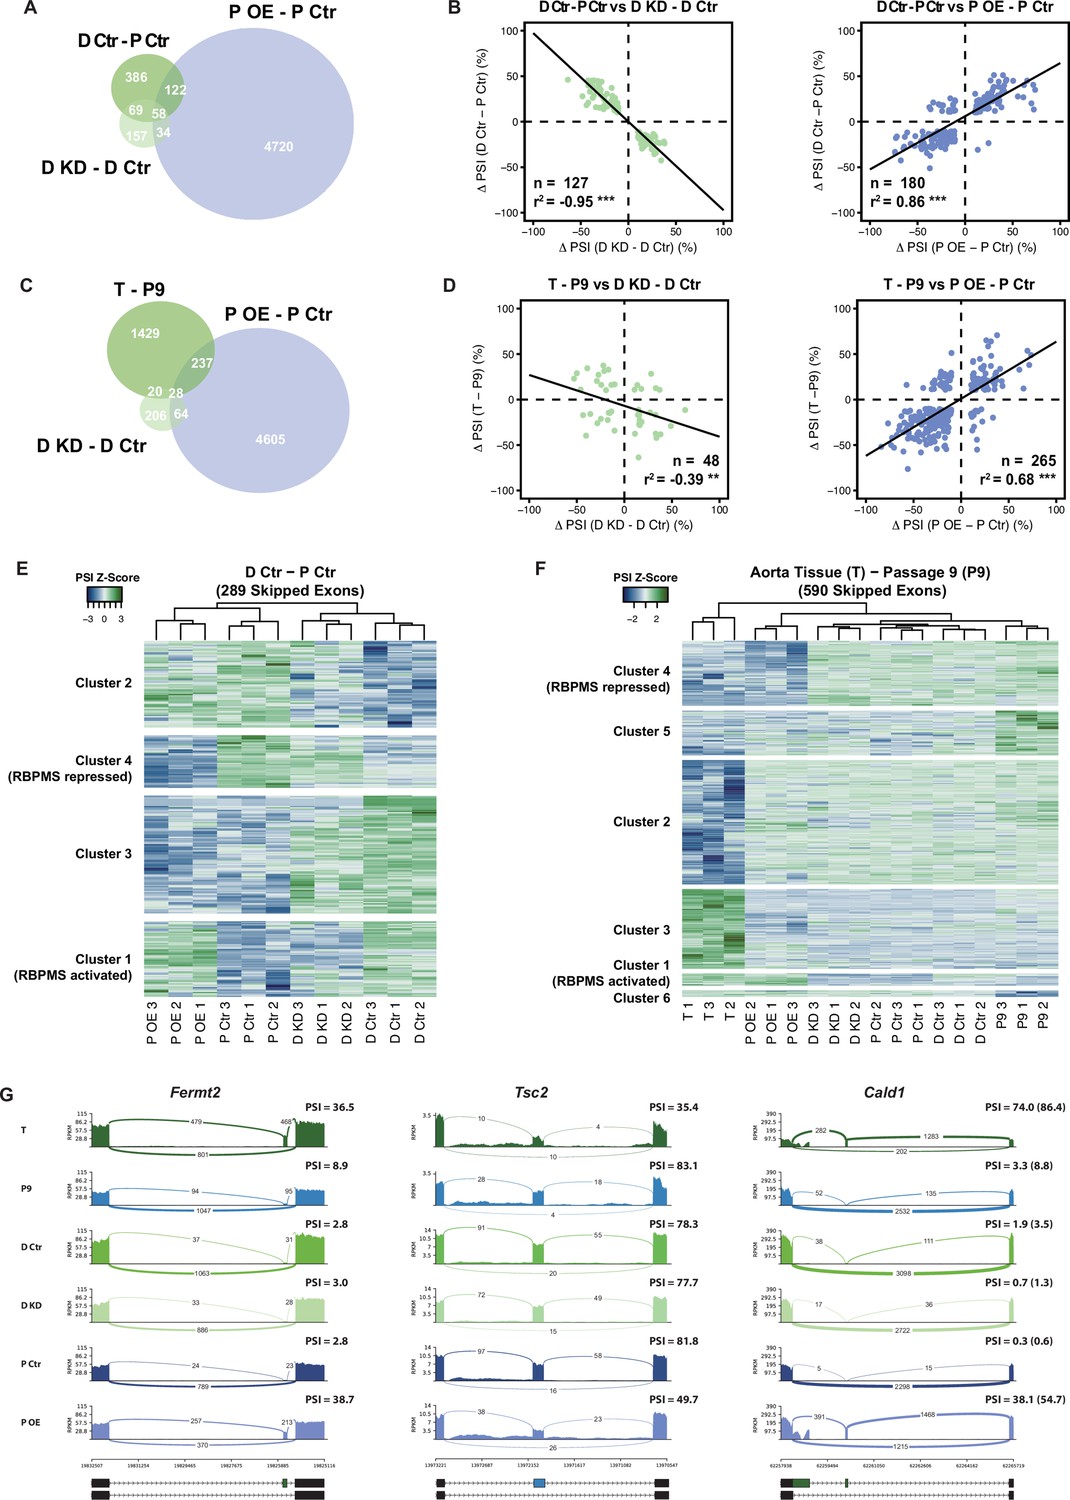
(A) Venn diagram of significant ASEs (FDR < 0.05 and ΔPSI cutoff of 10%) identified in the PAC1 dedifferentiation, RBPMS knockdown and RBPMS A overexpression comparisons. (B) ΔPSI correlation of overlapping ASEs (FDR < 0.05 and ΔPSI cutoff of 10%) from the PAC1 cells dedifferentiation and RBPMS knockdown, left, or RBPMS A overexpression, right. The line indicates the linear regression model. Statistical significance was carried out by Pearson correlation test. n is the number of ASEs assessed, r2 is the correlation coefficient. Statistical significance of the correlation: *p<0.05, **p<0.01, ***p<0.001. (C) Venn diagram of significant ASEs identified in RBPMS knockdown, overexpression and aorta tissue to passage nine comparisons. (D) ΔPSI correlation of overlapping ASEs from the rat aorta tissue dedifferentiation and RBPMS knockdown, left, or RBPMS A overexpression, right. (E) Heatmap of 289 SEs regulated in the PAC1 dedifferentiation comparison (D Ctr - P Ctr). Each column represents a replicate sample (1-3) from RBPMS knockdown (D Ctr and D KD) or overexpression (P Ctr and P OE). Rows are significant SE events from PAC1 dedifferentiation. Rows and columns were grouped by hierarchical clustering. Blue and green colors in the Z-score scaled rows represent low and high PSI values respectively. (F) Heatmap of 590 SEs regulated in the rat aorta tissue dedifferentiation comparison (T - P9). Each column represents one sample from either aorta tissue dedifferentiation (T and P9), RBPMS knockdown (D Ctr and D KD) or RBPMS overexpression (P Ctr and P OE). Rows are significant SE events from the T - P9 comparison. Rows and columns were grouped by hierarchical clustering. Blue and green colors in the Z-score scaled rows represent low and high PSI values respectively. (G) Sashimi plots of selected ASEs highly regulated in the aorta tissue and RBPMS overexpression. Fermt2 is an RBPMS activated exon from Cluster one in panel F. Tsc2 is an RBPMS repressed exon from Cluster 4 of panel E. Cald1 has an RBPMS activated exon 4 and downstream five splice site on exon 3b. For Cald1, a manually calculated PSI in parentheses takes into account the A5SS which was not included in the rMATS annotation.
Figure 3—figure supplement 1
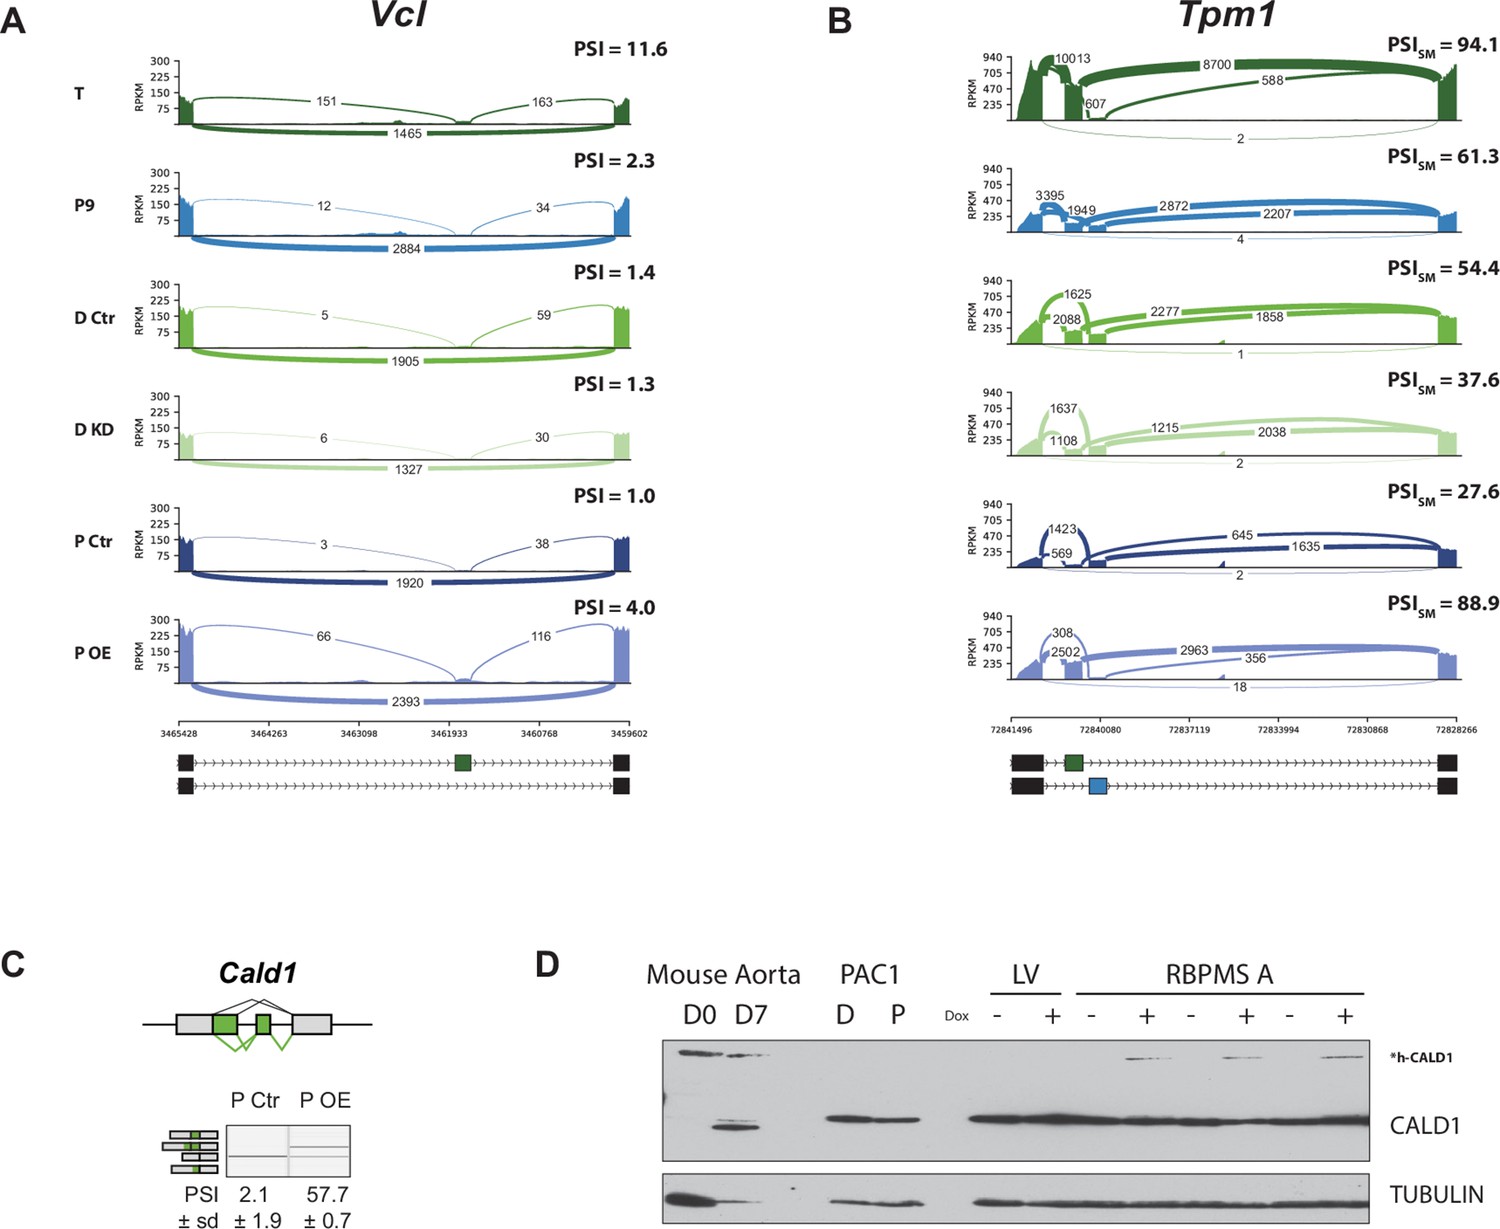
RBPMS recapitulates the aorta tissue AS pattern of Vcl, Tpm1 and Cald1.
(A) Sashimi plot of the Vcl cassette exon regulated during aorta tissue dedifferentiation (FDR < 4×10⁻¹⁴) and by RBPMS overexpression (FDR < 1.2×10⁻¹²). PSI values represent the mean of the PSI values calculated by rMATS analysis. (B) Sashimi plot of the Tpm1 mutually exclusive exon regulated during aorta tissue dedifferentiation and by RBPMS overexpression. PSI values represent the mean of the PSI values calculated by rMATS analysis for the SM exon 2. (C) RT-PCR validation of Cald1 ASE (A5SS and SE) in the RBPMS overexpression in proliferative PAC1 cells. Schematic of the Cald1 ASE and Cald1 isoforms amplified in the PCR are shown on the top and left, respectively. (D) Western blot probing for CALD1 showing the appearance of the h-CALD1 protein isoform upon RBPMS overexpression. The specificity of the isoform switch was also confirmed in Mus musculus differentiated (D0) and proliferative (D7) SMC samples from aorta tissue. The larger smooth muscle specific isoform of CALD1 is indicated by h-CALD1. Values shown are mean ± sd (n = 3) of the PSI. Statistical significance was calculated using Student’s t-test (*p<0.05, **p<0.01, ***p<0.001).
Figure 4 with 4 supplements
RBPMS directly regulates exons associated with CAC motifs.
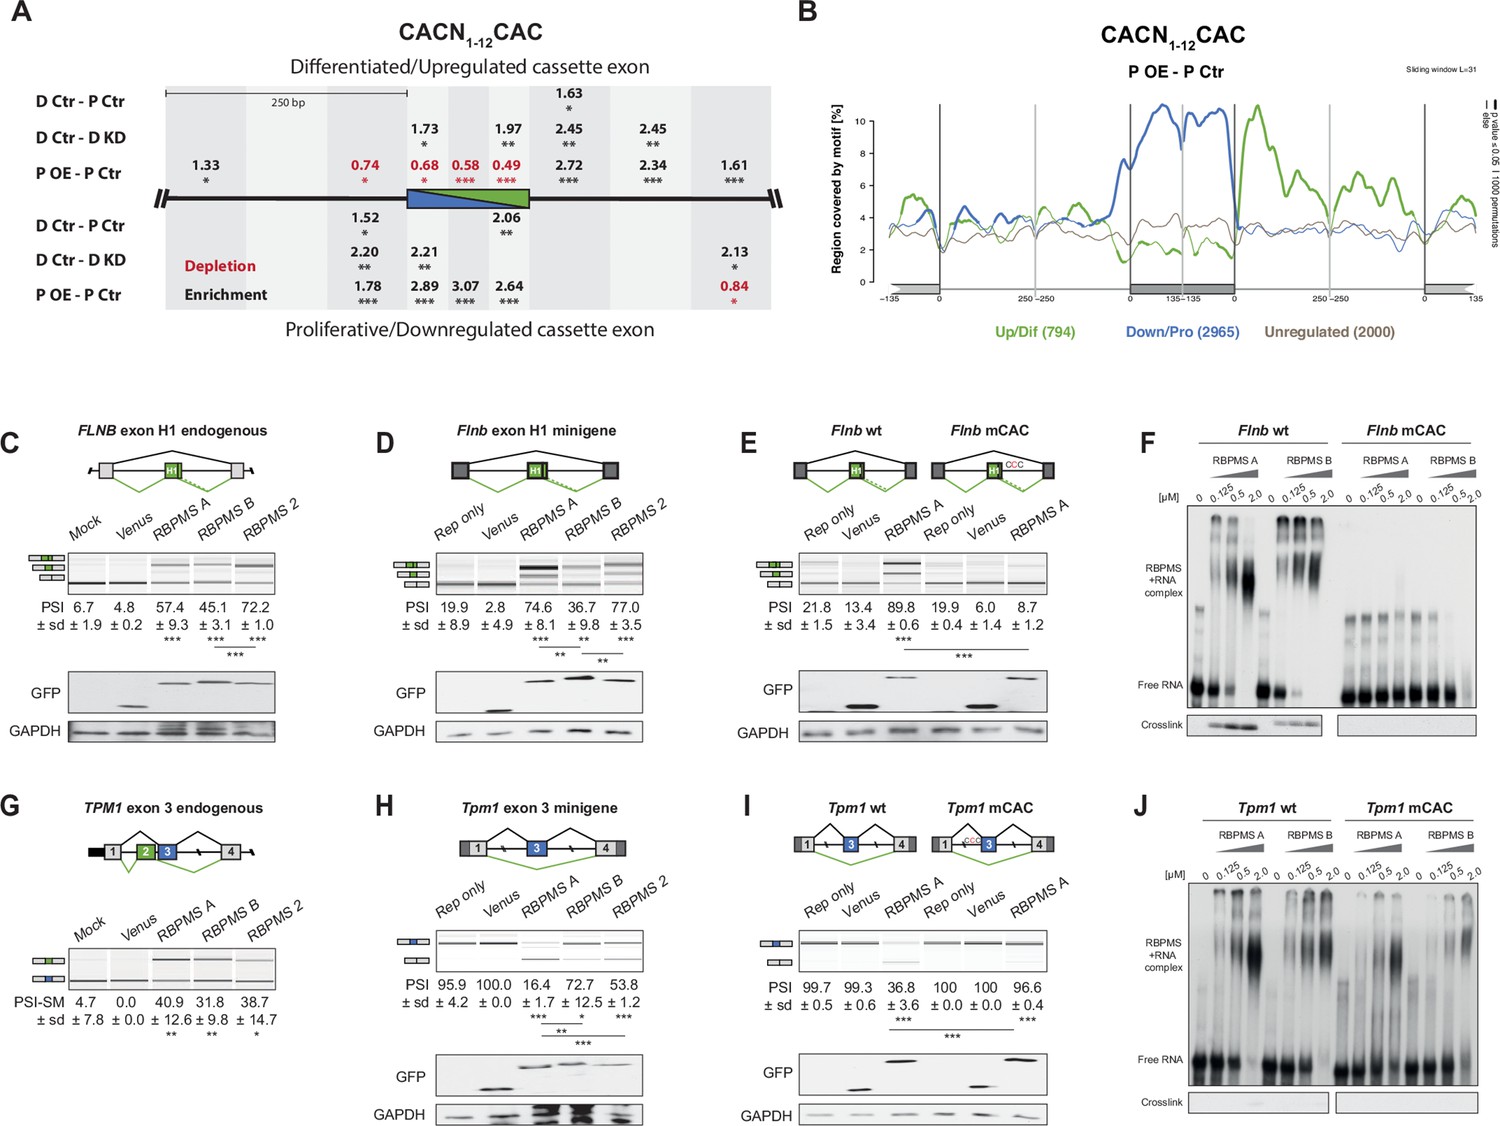
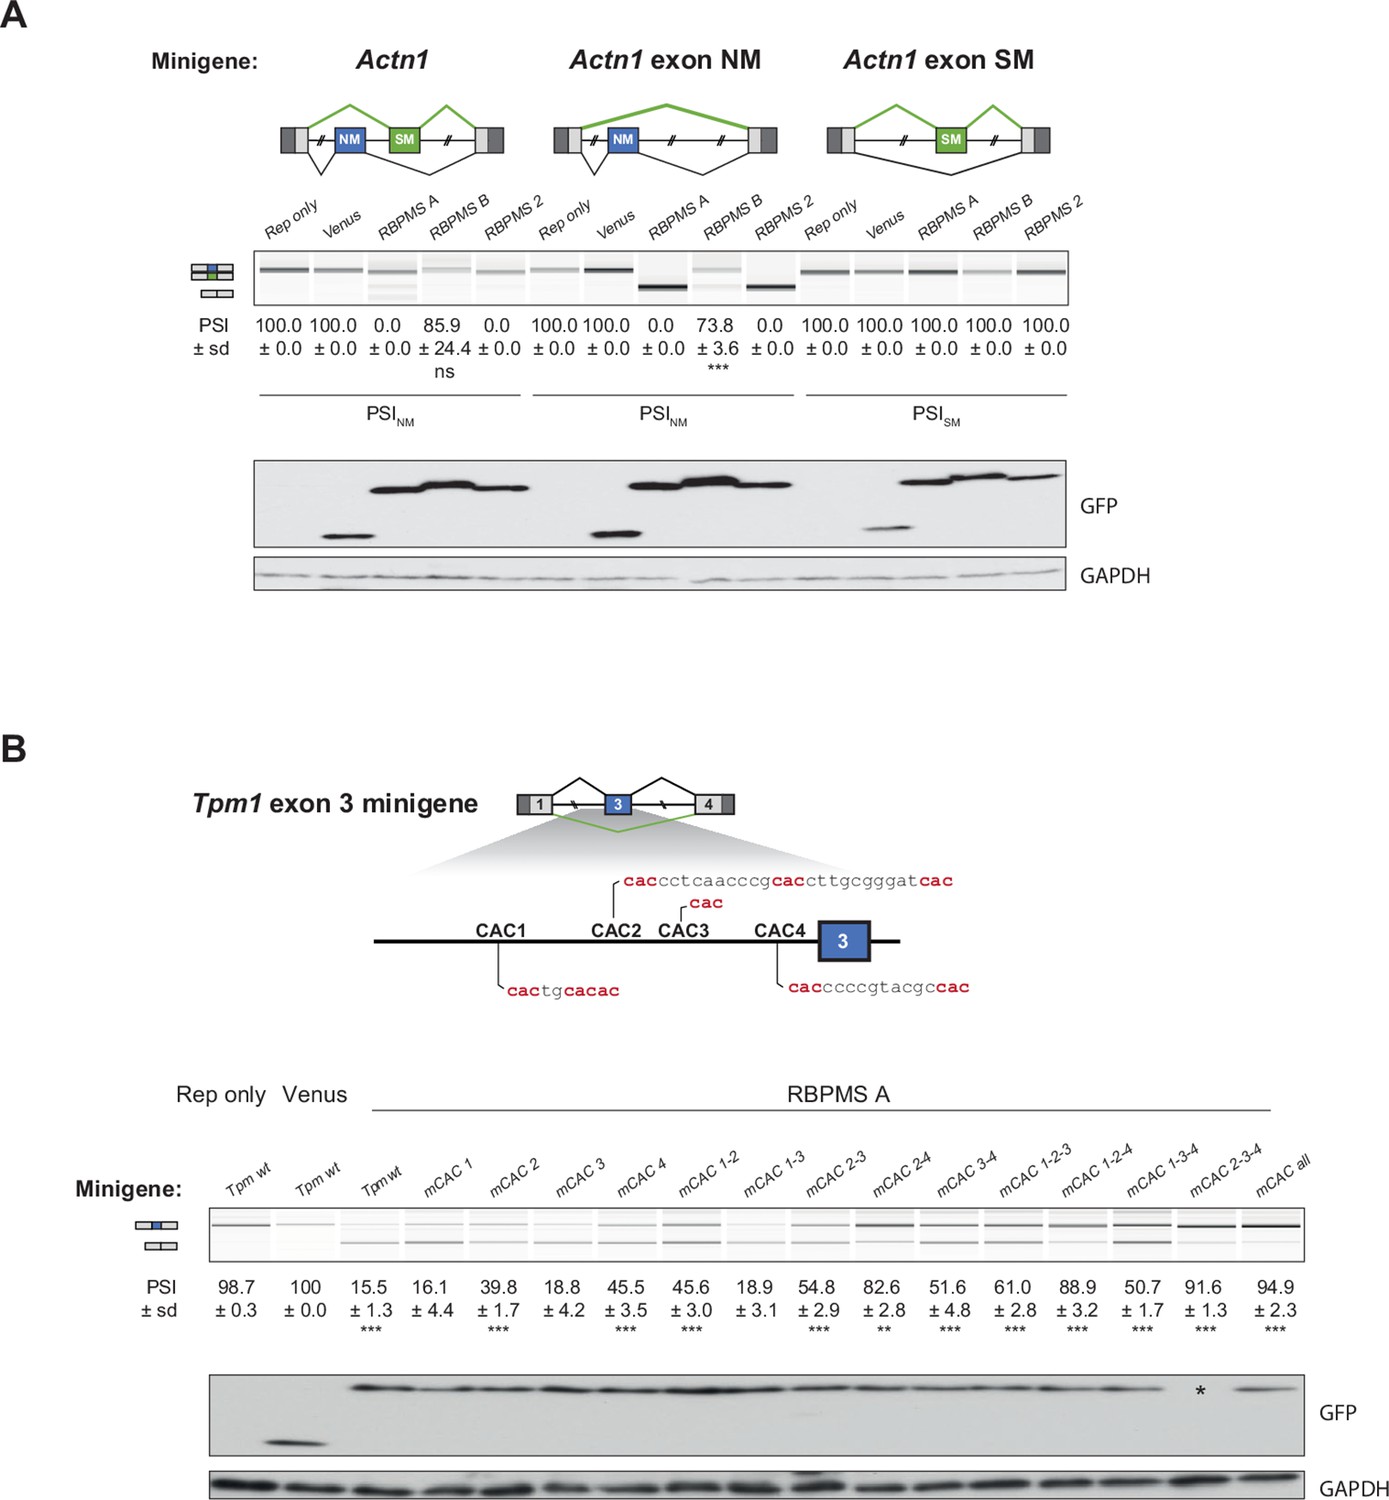
(A) RBPMS motif (CACN1-12CAC) enrichment in differentially alternatively spliced cassette exons in the PAC1 dedifferentiation (D Ctr - P Ctr), RBPMS knockdown (D Ctr - D KD) and RBPMS overexpression (P OE - P Ctr) comparisons. Values indicate degree of motif enrichment (black) or depletion (red). Statistical significance: *p<0.05, **p<0.01,***p<0.001. (B) RBPMS motif (CACN1-12CAC) map from RBPMS overexpression (P OE - P Ctr). Upregulated (green), downregulated (blue) and unregulated (gray) cassette exons are shown. Statistical significance: p<0.05, 1000 permutations is indicated by thicker line width. (C) RBPMS overexpression in HEK293 cells and RT-PCR of endogenous FLNB exon H1 splicing. Schematic of Flnb exon H1 as a differentiated cassette exon activated by RBPMS. The splicing pattern of FLNB was tested upon overexpression of Venus tagged RBPMS A, B and 2. A mock and a Venus control were also tested in parallel. (D) Effect of RBPMS overexpression on rat Flnb splicing reporter in HEK293 cells. Schematic of the Flnb reporter and RT-PCR for the splicing patterns of Flnb reporter upon coexpression of RBPMS isoforms and RBPMS2. (E) Flnb reporter with point mutations disrupting RBPMS motifs (CAC to CCC) were tested for RBPMS A regulation. Left, wild-type reporter and right, mutant CAC reporter (mCAC) RT-PCRs. (F) Electric mobility shift assay (EMSA) for in vitro binding of recombinant RBPMS A and B to in vitro transcribed wild-type and mCAC RNAs of Flnb exon H1 downstream intron sequence (top left and right). Lower panel: UV-crosslinking of same samples. (G) RBPMS overexpression in HEK293 cells and RT-PCR of endogenous TPM1 MXE exon 2 and 3 splicing. The splicing pattern of TPM1 was tested upon overexpression of Venus tagged RBPMS A, B and 2. A mock and a Venus control were also tested in parallel. (H) Effect of RBPMS overexpression on rat Tpm1 splicing reporter in HEK293 cells. Schematic of the Tpm1 reporter and RT-PCR for the splicing patterns of Tpm1 reporter upon RBPMS isoforms and paralog. (I) Tpm1 reporter with point mutations disrupting RBPMS motifs (CAC to CCC) was tested for RBPMS A regulation. Left, wild-type reporter and right, mutant CAC reporter (mCAC) RT-PCRs. (J) In vitro binding of recombinant RBPMS A and B to in vitro transcribed wild-type and mCAC RNAs of Tpm1 exon three upstream intron sequence. EMSA, top and UV crosslinking, bottom. In (F) and (J), in vitro binding assays were carried out using recombinant protein in a serial dilution (1:4) in a range of 0.125 to 2 μM. In panels (C–E) and (G–I), values are the mean PSI ± sd (n = 3). For Flnb cassette exon, the PSI is the sum of both short and long isoforms generated by a A5SS event. For Tpm1 MXE, the SM exon PSI is shown (PSI-SM). Schematics of the splicing isoforms indicate the PCR products, differentiated (green) and proliferative (blue). Statistical significance was calculated using Student’s t-test (*p<0.05, **p<0.01, ***p<0.001). Western blot anti-GFP and GAPDH, loading control, were carried out to assess RBPMS isoform overexpression in HEK293 (panels (C-E, H, I). The western blot in (C) is also a representative of (G), since both RT-PCRs (FLNB and TPM1) are from the same overexpression experiment.
Figure 4—figure supplement 1
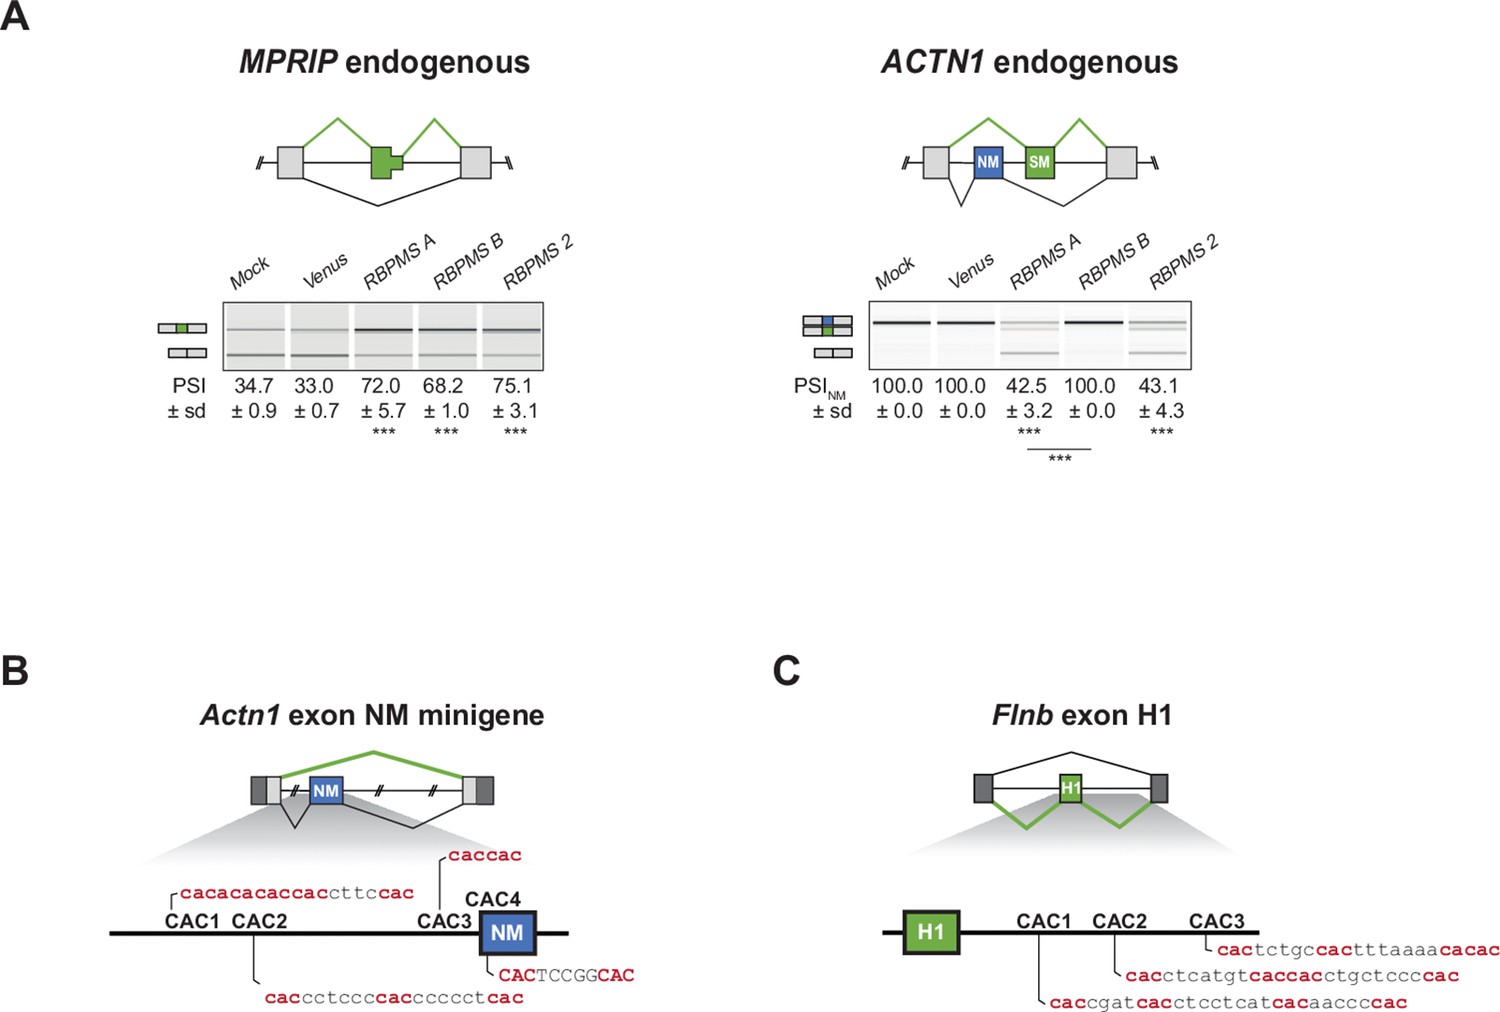
RBPMS promotes the SM splicing of MPRIP and ACTN1 in HEK293 cells.
(A) RT-PCR validation of endogenous MPRIP and ACTN1 ASEs upon RBPMS isoform and RBPMS2 overexpression in HEK293 cells. Schematics of MPRIP SE and ACTN1 MXE are found at the top. (B) Schematic of potential RBPMS CAC motifs upstream of Actn1 exon NM and (C) downstream of Flnb exon H1.
Figure 4—figure supplement 2
RBPMS represses the splicing of the NM exon of Actn1 and Tpm1.
(A) Actn1 splicing upon RBPMS overexpression in HEK293 cells. Actn1 reporters containing both the SM and NM exons or only the SM or NM exon were tested upon RBPMS overexpression. Schematics of the different Actn1 splicing reporters tested are shown at the top. Western blot to verify RBPMS overexpression were probed for GFP and GAPDH as a loading control. (B) Mapping RBPMS cis elements in the Tpm1 exon three splicing reporter. Potential RBPMS CAC motifs upstream of exon three are highlighted in the schematic at the top. Combinations of different CAC mutations were tested for RBPMS A overexpression in HEK293 cells. Overexpression was assessed by western blot probing for GFP (Venus) and GAPDH as a loading control. No overexpression was detected in the lane marked ‘*’ although the PSI differs from the reporter only lane. In (A) and (B), schematics of the splicing isoforms identify the PCR products and values shown are mean ± sd (n = 3) of PSI. In case of MXE the SM exon inclusion is shown. Statistical significance was calculated using Student’s t-test (*p<0.05, **p<0.01, ***p<0.001).
Figure 4—figure supplement 3
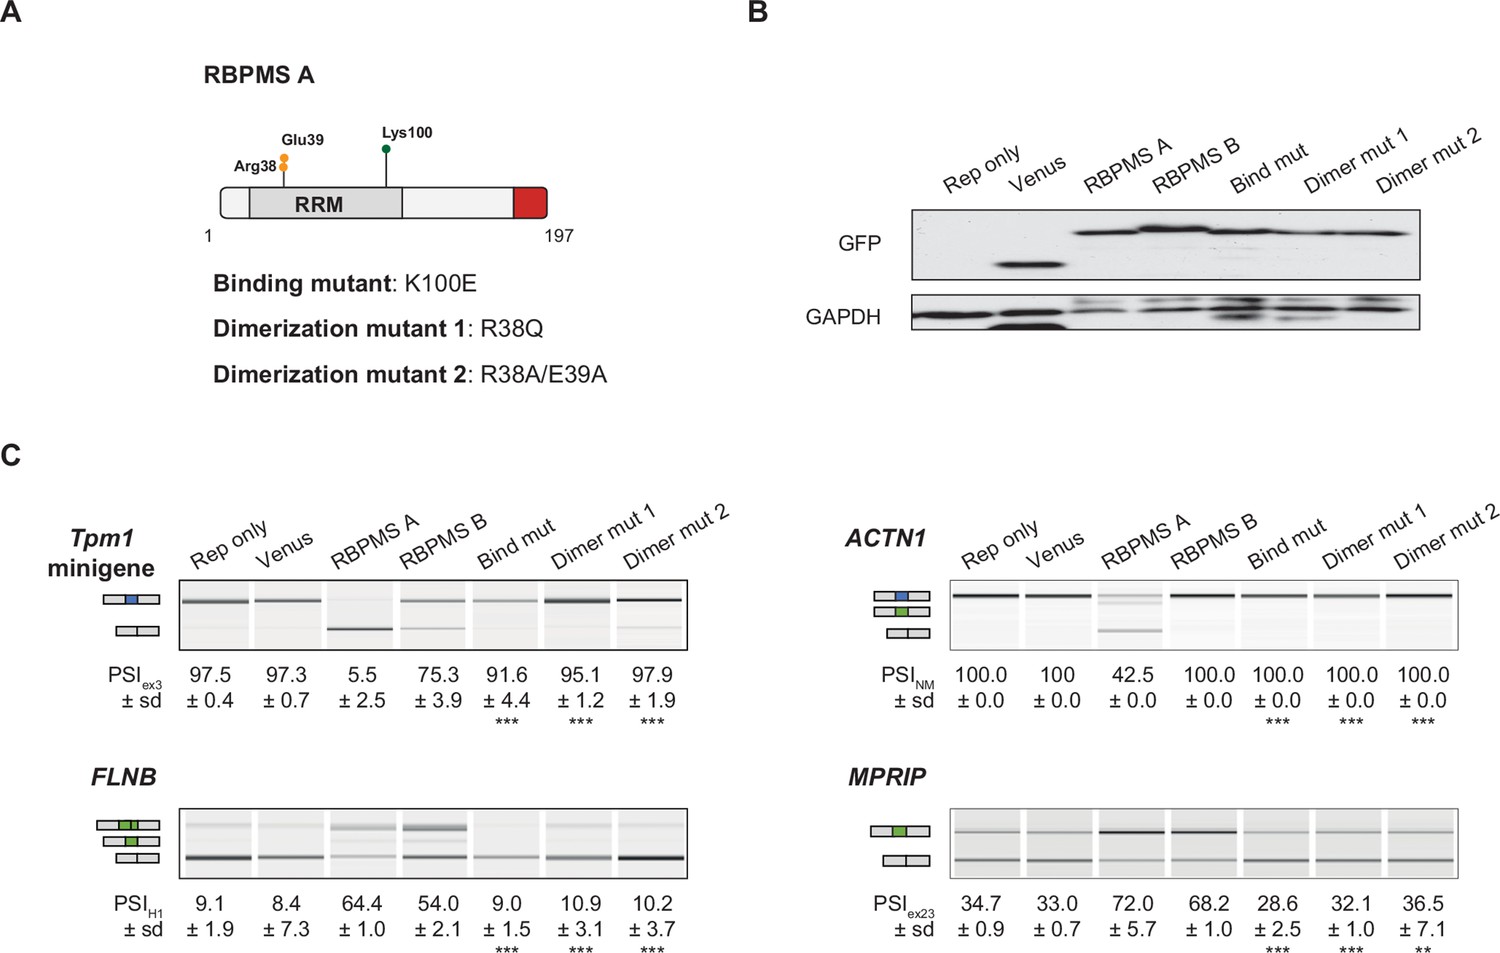
RBPMS splicing activity requires RNA binding and dimerization.
(A) Schematic of RBPMS isoform A with residues mutated in the binding and dimerization mutants highlighted. (B) Western blot probing for GFP to assess overexpression of RBPMS isoforms and mutants in HEK293 cells. GAPDH was used as a loading control. (C) RT-PCR of RBPMS splicing targets (Tpm1 minigene and endogenous FLNB, ACTN1 and MPRIP) upon overexpression of wild type RBPMS isoforms and RBPMS A mutants in HEK293 cells. Schematics indicate the splicing isoform corresponding to the PCR product. Values shown are the mean ± sd of PSI (n = 3). Statistical significance was calculated using Student’s t-test (*p<0.05, **p<0.01, ***p<0.001).
Figure 4—figure supplement 4
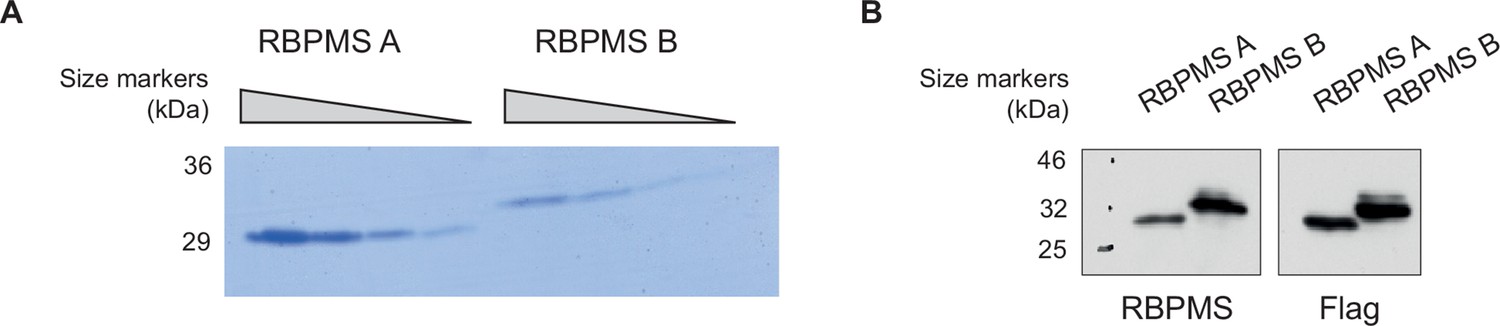
RBPMS recombinant proteins.
(A) RBPMS A and B recombinant proteins. Purified recombinant RBPMS A and B were analyzed in a 20% denaturing polyacrylamide gel. A BSA titration was run in parallel for quantification of the recombinant protein. (B) Recombinant protein sequences were confirmed by western blot probing for RBPMS and FLAG.
Figure 5 with 3 supplements
RBPMS regulates functionally important targets in SMCs.
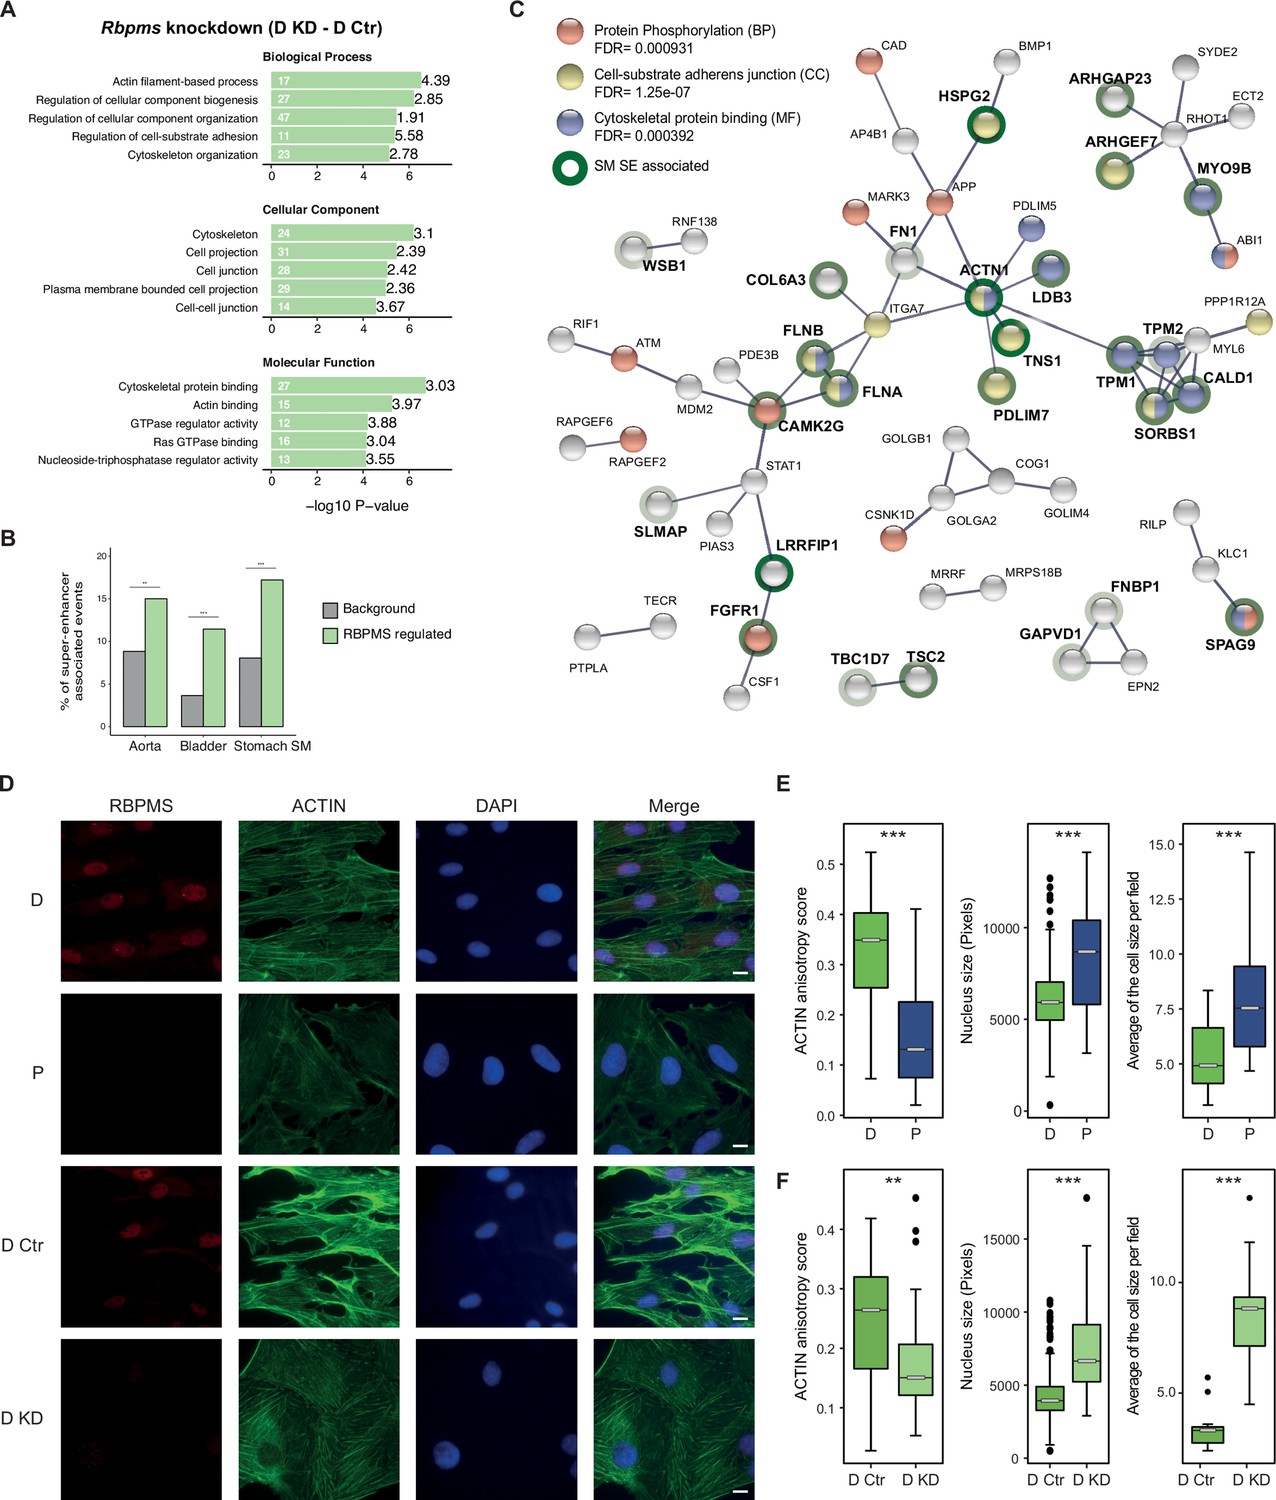
(A) GO analysis of genes with cassette exons regulated in RBPMS knockdown. The top five enriched GO terms in the three categories (biological process, molecular function and cellular component) are shown. Values within and in front of the bars indicate the number of genes in the enriched term and the enrichment relative to the background list. (B) Enrichment of exons regulated by RBPMS knockdown within genes associated with super-enhancers in smooth muscle tissues. Background set is all cassette exon events (regulated and unregulated) detected by rMATS in the same experiment. Significance determined by hypergeometic P-value. (C) PPI network of genes showing concordant splicing regulation upon RBPMS knockdown and PAC1 differentiation status, combined with genes concordantly regulated by RBPMS overexpression and in aorta tissue datasets. PPI network was generated in STRING using experiments and database as the sources of interactions. Network edges represent the interaction confidence. Enriched GO terms (BP, biological process, MF, molecular function and CC, cellular component) were also included in the analysis and are indicated in red, blue and yellow. Super-enhancer associated gene names are in bold and are highlighted gray, light green or dark green shading according to whether they were super-enhancer associated in 1, 2 or 3 SMC tissues. (D) Immunofluorescence of RBPMS and actin (Phalloidin) in differentiated and proliferative PAC1 cells (D and P) and upon prolonged (120 hr) RBPMS knockdown in differentiated PAC1 cells (D Ctr and D KD). DAPI staining for cell nuclei. Scale bars 10 μm. (E) Left, anisotropy measurement of actin fibers in PAC1 cells D (differentiated) and P (proliferative) using the FibrilTool ImageJ macro (n = 44 and 52). Middle, nucleus size measurement shown in pixels (n = 182 and 130). Right, average of the cell size quantified per field (n = 11 and 15). (F) Left, anisotropy measurement of actin fibers in RBPMS knockdown (D Ctr and D KD) using the FibrilTool ImageJ macro (n = 56 and 33). Middle, nucleus size measurement shown in pixels (n = 363 and 75). Right, average of the cell size quantified per field (n = 14 and 10). In (E) and (F), statistical significance was obtained from a Mann-Whitney-Wilcoxon Test (*p<0.05, **p<0.01, ***p<0.001). Data shown are from one representative experiment carried out in triplicate.
Figure 5—figure supplement 1
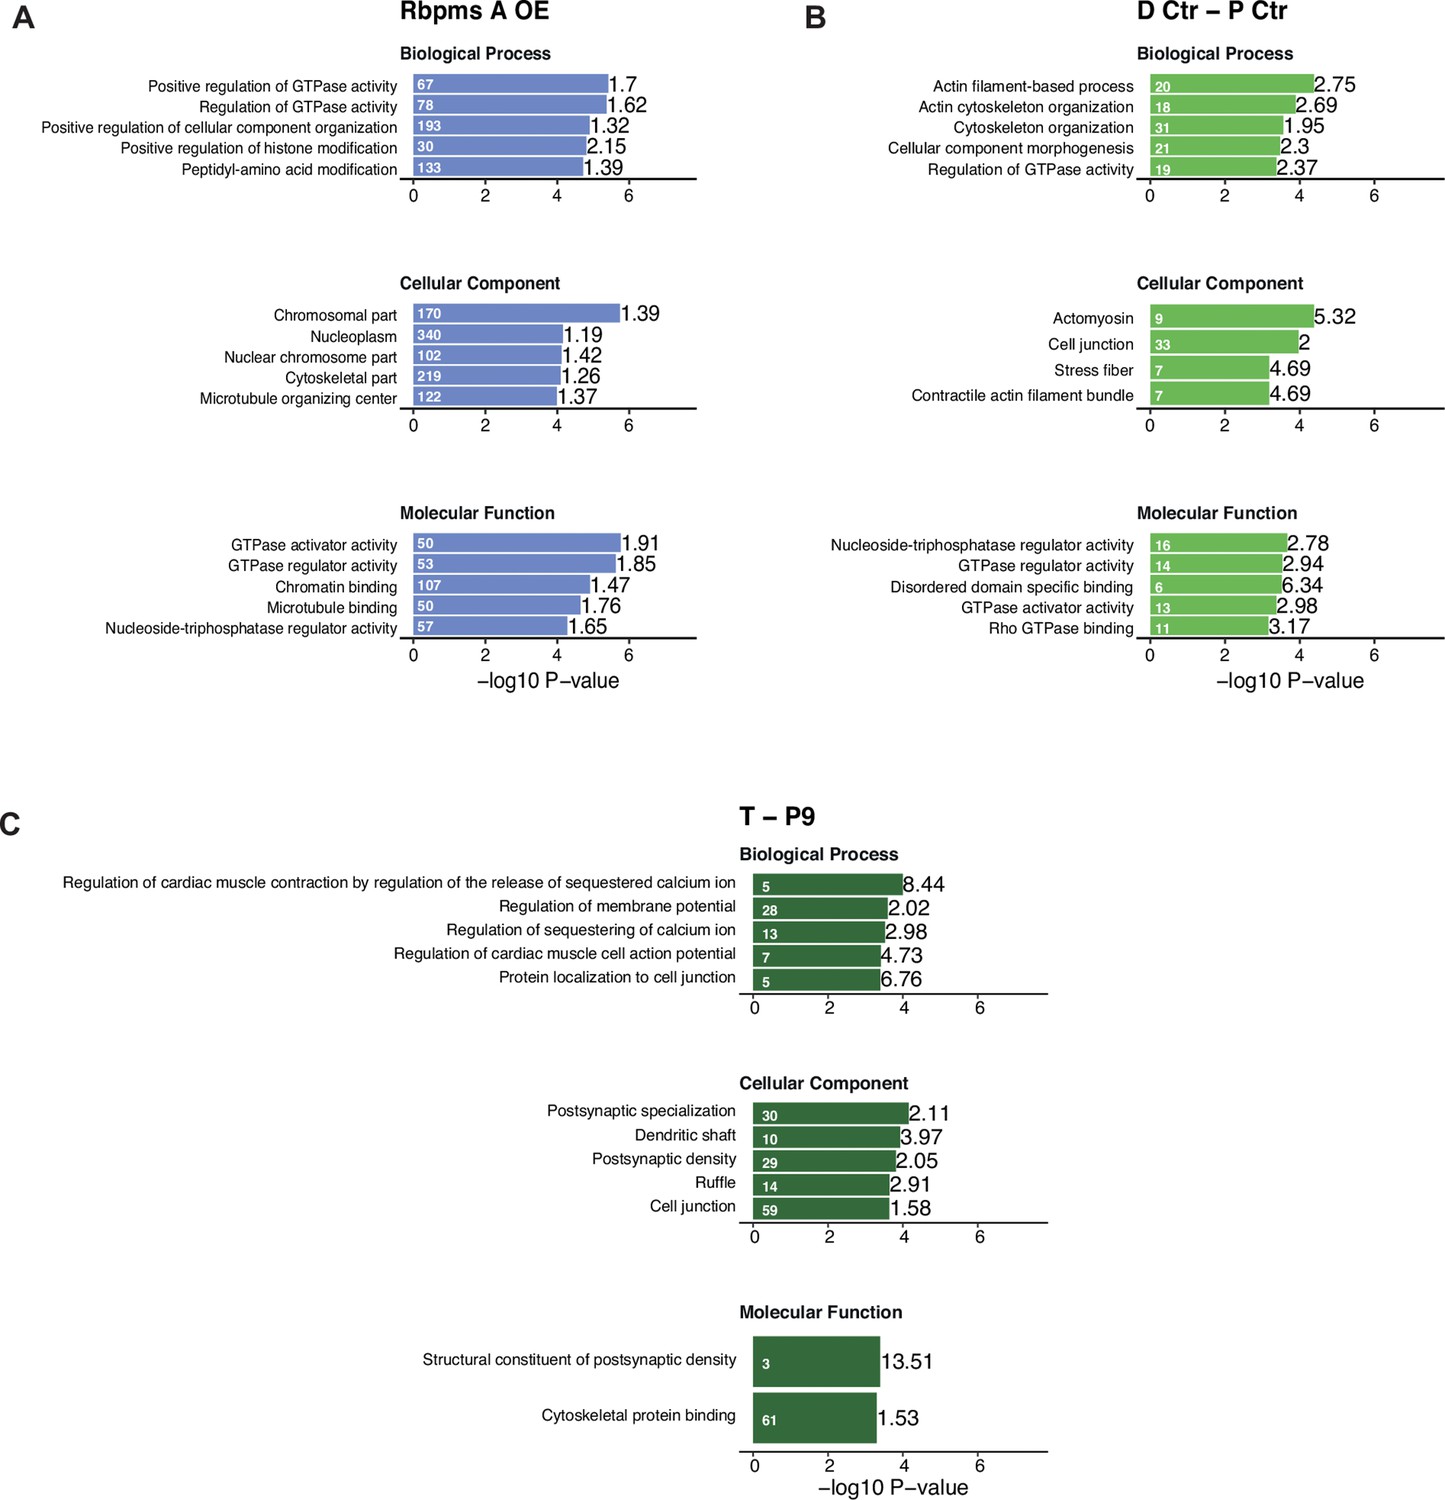
GO analysis of genes differentially spliced upon RBPMS overexpression and PAC1 and aorta dedifferentiation.
Top five enriched GO terms from Gorilla GO analysis of differentially spliced genes. (A) RBPMS overexpression in proliferative PAC1 cells. (B) PAC1 dedifferentiation. (C) Rat aorta tissue dedifferentiation. Values within and in front of the bars indicate the number of genes in the enriched term and the enrichment relative to the background list.
Figure 5—figure supplement 2

Morphological changes in PAC1 cells are specific to RBPMS knockdown.
(A) Immunofluorescence of RBPMS and ACTIN (Phalloidin) in PAC1 cells treated with a second siRNA only (KD3, Stealth siRNAs, Thermo Fisher Scientific (RSS363830): CAG UAC UCC UCU GCC CAA CAC UGU A) and combined with siRNA1 (KD1 and 3–45 pmols of each) after 120 hr siRNA treatment. DAPI staining for cell nuclei. Scale bars 10 μm. (B) Left, anisotropy measurement of ACTIN fibers in RBPMS knockdown (C, K1, K3 and K1 and 3) using the FibrilTool ImageJ macro (n = 56, 33, 26, 33, respectively). Middle, nucleus size measurement shown in pixels (n = 363, 75, 82, 93, respectively). Right, average of the cell size quantified per field (n = 14, 10, 7, 10). Statistical significance was obtained from a Mann-Whitney-Wilcoxon Test (*p<0.05, **p<0.01, ***p<0.001). Data shown are from one representative experiment carried out in triplicate.
Figure 5—figure supplement 3
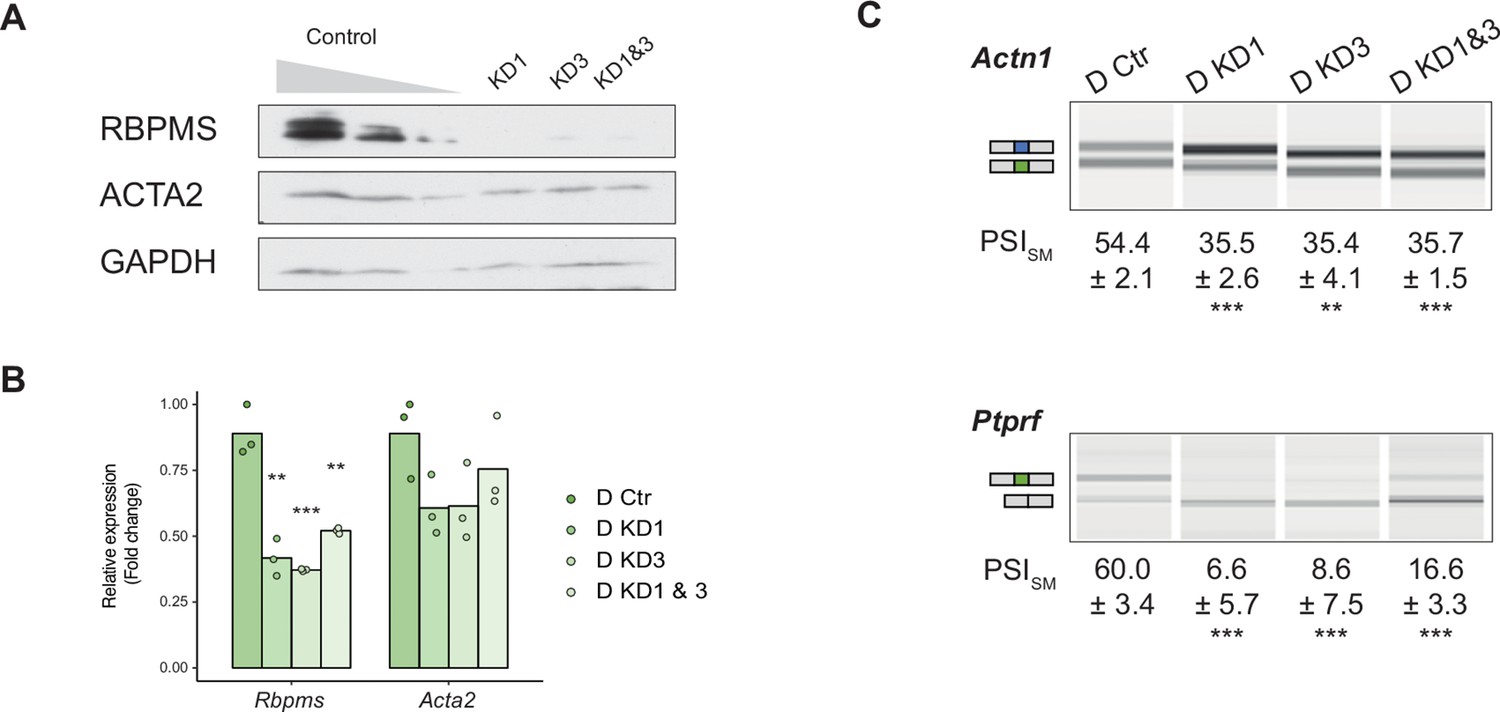
Sustained RBPMS knockdown in PAC1 cells.
(A) Western blots showing RBPMS knockdown in PAC1 cells after 120 hr siRNA treatment (control (C), siRNA1 (KD1), siRNA3 (KD3), siRNA1 and 3 (KD1 and 3)). Antibody targeting ACTA2, a SMC differentiation marker, and GAPDH was used as loading control. (B) qRT-PCR analysis of Rbpms (all isoforms), and the SMC differentiation marker Acta2, in knockdown (control (C), siRNA1 (KD1), siRNA3 (KD3), siRNA1 and 3 (KD1 and 3)). Relative expression was normalized to the average of two housekeepers (Gapdh and Rpl32) and the mean of the relative expression is shown (n = 3). Each point shows data from an individual sample. Changes in Acta2 were not significant. (C) RT-PCR analysis of RBPMS splicing targets Actn1 and Ptprf, in PAC1 cells after 120 hr RBPMS KD. Schematic of the regulated isoform products on the left. Values shown are the quantified PSI (percent spliced in) of the smooth muscle isoforms (SM). Data are from one representative experiment performed in triplicate. Statistical significance was assessed using Student’s t-test (*p<0.05, **p<0.01, ***p<0.001).
Figure 6

RBPMS regulates splicing of post-transcriptional regulators.
(A) Sashimi plot of Mbnl1 regulated exons. The numbers on top of the arches indicate the number of reads mapping to the exon-exon junctions. Mean of the PSI values calculated for each exon (exon 7–36 bp and exon 8–95 bp) are indicated for each condition (PSI-ex7 and PSI-ex8). Schematic of the different mRNA isoforms are found at the bottom. (B) RT-PCR validation of Mbnl1 exons 7 and 8 and (C) Mbnl2. Values shown are the mean of the PSI ± standard deviation (n = 3). The PSI values for each exon of Mbnl1 are shown. For Mbnl2, exon seven isoforms were not detected in the RT-PCRs. Schematics of the splicing isoforms identify the PCR products. (D) Western blot probing for MBNL1 and 2 in RBPMS knockdown and overexpression shows the MBNL1 isoform switch at the protein level. (E) Schematic of the different MBNL1 protein isoforms, left. Different MBNL1 and MBNL2 isoforms were overexpressed in HEK293T cells and their effect on an A5SS event in the NCOR2 gene assessed. Schematics of NCOR2 splicing isoforms indicates the PCR products. Western blot were probed against FLAG to verify isoform overexpression. PSI indicates use of the downstream A5SS to generate the longer isoform. (F) MBNL1 and 2 knockdown in inducible RBPMS A or in lentiviral control (P LV) proliferative PAC1 cells to assess the dependency of the Ncor2 A5SS event to the MBNL1 isoform switch. Western blot for MBNL1 and 2 and FLAG to confirm MBNL knockdown and RBPMS A overexpression. In all the western blots TUBULIN was used as a loading control. Statistical significance was calculated using Student’s t-test (*p<0.05, **p<0.01, ***p<0.001). (G) Sashimi plot of the Lsm14b cassette exon regulated by RBPMS. PSI values represent the mean of the PSI values calculated by rMATS analysis. (H) RT-PCR validation of Lsm14b in the RBPMS knockdown and overexpression in PAC1 cells. Schematic of the Lsm14b event at the top and schematic of its isoforms at the left. Peptide sequence coded by the exon is shown below the schematic. (I) Western blot of LSM14B in RBPMS knockdown and overexpression cells. GAPDH was used for loading control.
Figure 7
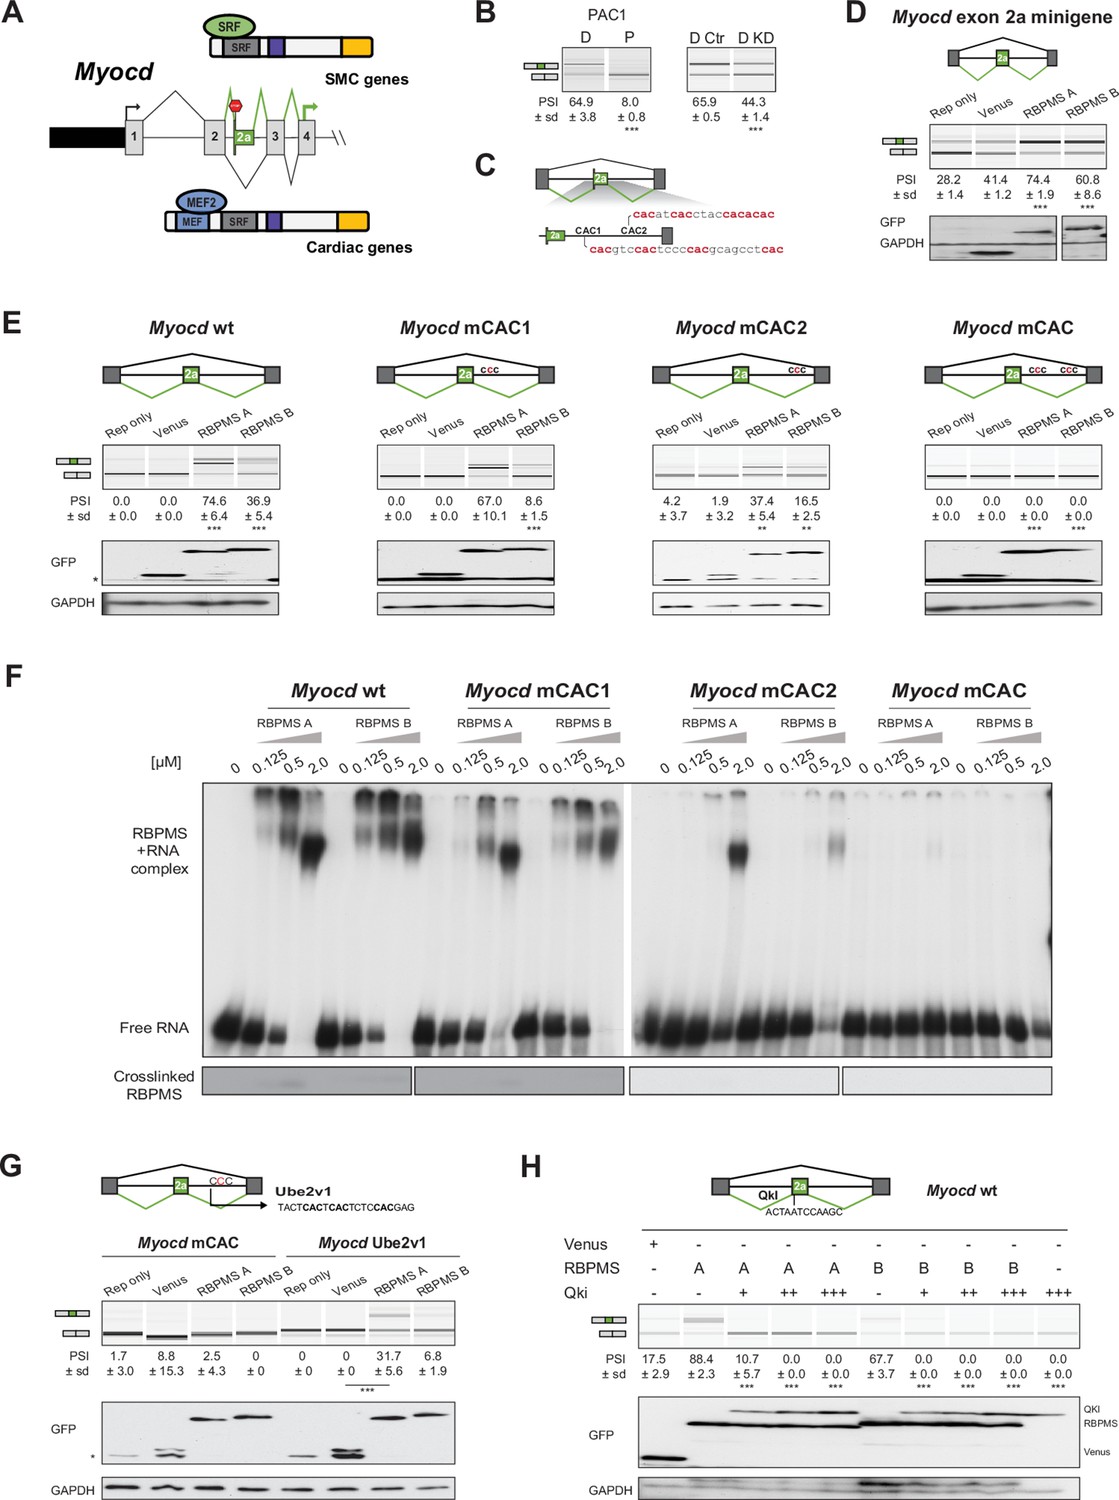
RBPMS controls splicing of the SMC transcription factor Myocd exon 2a.
(A) Schematic of Myocd exon 2a ASE and its functional consequences upon MYOCD protein domains. (B) RT-PCR of Myocd exon 2a splicing in the PAC1 Differentiated (D) and Proliferative (P) PAC1 cells, left) and in differentiated PAC1 cells treated with control (D Ctr) or RBPMS siRNAs (D KD), right. (C) Schematic of the Myocd exon 2a splicing reporter. The two main clusters of CAC motifs, found downstream of exon 2a, are highlighted in red. (D) RT-PCRs of the effects of RBPMS A and B overexpression on Myocd exon 2a in PAC1 cells. Reporter only and Venus controls were tested alongside. Protein expression levels are shown in the western blot probing for GFP and GAPDH as a loading control. (E) RT-PCR of the effects of RBPMS A and B overexpression on Myocd exon 2a splicing reporter in HEK293. RBPMS CAC sites were mutated and response to RBPMS validated by RT-PCR. Schematic of the different mutant Myocd exon 2a splicing reporters are found at the top. RBPMS overexpression was confirmed by western blot using GAPDH as a loading control. (F) In vitro binding of RBPMS A and B to Myocd exon 2a downstream intron sequence in EMSA, top, and in UV-crosslink, bottom. In vitro transcribed wild-type and different mCAC RNAs were incubated with recombinant RBPMS (0.125 to 2 μM). (G) The UBE2V1 sequence identified to bind to RBPMS by PAR-CLIP (Farazi et al., 2014) was inserted into the mCAC Myocd reporter. Schematic of the mCAC Myocd exon 2a splicing reporter and the UBE2V1 sequence. RT-PCR of the effects of RBPMS A and B overexpression on Myocd reporter in HEK293 cells. Western blot probing for GFP and GAPDH as a loading control. (H) Effects of the co-expression of RBPMS and QKI, a Myocd exon 2a repressor, on Myocd exon 2a reporter in HEK293. Myocd 2a reporter schematic with QKI and potential RBPMS-binding sites indicated. RBPMS and QKI overexpression was confirmed by western blot against GFP and GAPDH as a loading control. In GFP western blots, ‘*’ indicates the GFP product from the splicing reporter.
Tables
Key resources table
| Reagent type (species) or resource | Designation | Source or reference | Identifiers | Additional information |
|---|---|---|---|---|
| Gene (R. norvegicus) | RBPMSA | NCBI: XM_006253240.2; XP_006253302.1 | See Material and methods | |
| Gene (R. norvegicus) | RBPMSB | NCBI: NM_001271244.1; NP_001258173.1 | See Material and methods | |
| Gene (R. norvegicus) | RBPMS2 | NCBI: NM_001173426.1; NP_001166897.1 | See Material and methods | |
| Cell line (R. norvegicus) | Rat PAC1 pulmonary artery SMCs | Rothman et al., 1992 PMID: 1333373 | PAC1 | Cells from the original derivation of the line |
| Cell line (H. sapiens) | HEK293 | Lab stock | HEK293 | |
| Cell line (H. sapiens) | HEK293T | Lab stock | HEK293T | |
| Transfected construct (R. norvegicus) | effectors and minigenes | this study | See Material and methods and Supplementary file 6 | |
| Biological sample (R. norvegicus) | Aorta tissue | this study | T | See Material and methods |
| Biological sample (R. norvegicus) | Dispersed VSMC | this study | SC | See Material and methods |
| Biological sample (R. norvegicus) | Passage 0 | this study | P0 | See Material and methods |
| Biological sample (R. norvegicus) | Passage 9 | this study | P9 | See Material and methods |
| Antibody | Mouse monoclonal anti-ACTA2 | Agilent/Dako | Agilent/Dako: M0851 | See Supplementary file 6 |
| Antibody | Rabbit monoclonal anti-CALD1 | Abcam | Abcam: 32330 | See Supplementary file 6 |
| Antibody | Rabbit polyclonal ani-GAPDH | Santa Cruz | Santa Cruz: sc-25778 | See Supplementary file 6 |
| Antibody | Rabbit polyclonal anti-LSM14b | Sigma Aldrich | Sigma Aldrich: HPA041274 | SeeSupplementary file 6 |
| Antibody | Rabbit polyclonal anti-MBNL1 | in-house antibody | NA | See Supplementary file 6 |
| Antibody | Rabbit polyclonal anti-MBNL2 | Santa Cruz | Santa Cruz: sc-134813 | See Supplementary file 6 |
| Antibody | Rabbit polyclonal anti-RBPMS | Sigma Aldrich | Sigma Aldrich: HPA056999 | See Supplementary file 6 |
| Antibody | Rat monoclonal anti-TUBULIN | Abcam | Abcam: ab6160 | SeeSupplementary file 6 |
| Antibody | Mouse monoclonal anti-FLAG | Sigma Aldrich | Sigma Aldrich: F-1804 | See Supplementary file 6 |
| Antibody | Rabbit polyclonal anti-GFP | Invitrogen | Invitrogen: A-11122 | See Supplementary file 6 |
| Recombinant DNA reagent | pEGFP-C1 | Clontech | GenBank Accession: U55763 | in vivotransfection |
| Recombinant DNA reagent | pCI-neo-3x-FLAG | Rideau et al., 2006 PMID: 16936729 | in vivotransfection | |
| Recombinant DNA reagent | pET21d | Novagen | Novagen: 69743-3 | protein expression in E. coli |
| Recombinant DNA reagent | pCAGGs-EGFP | this lab | Wollerton et al., 2004 | minigene reporter; see Material and methods |
| Recombinant DNA reagent | pT2 | this lab | Gooding et al., 2013 | minigene reporter; see Material and methods |
| Recombinant DNA reagent | ACTN1 reporter | this lab | Gromak et al., 2003 | minigene reporter; seeMaterial and methods |
| Recombinant DNA reagent | pDONR221 | Invitrogen | Invitrogen: 12536017 | GATEWAY cloning |
| Recombinant DNA reagent | pINDUCER 22 | Meerbrey et al., 2011 PMID: 21307310 | pINDUCER 22 | lentivirus production; see Material and methods |
| Recombinant DNA reagent | pINDUCER 22-RBPMSA | This study | pInducer22-RBPMSA | See Materialsand methods |
| Recombinant DNA reagent | pGEM4Z | Promega | Promega: P2161 | in vitrotranscription templates; see Material and methods |
| Sequence-based reagent | oligonucleotides | Sigma Aldrich | See Supplementary file 6 | |
| Sequence-based reagent | Control siRNA | Dharmacon | C2 custom siRNA | See Material and methods |
| Sequence-based reagent | RBPMS siRNA | Stealth siRNAs Thermo Fisher Scientific | RSS363828; KD1 | See Material and methods |
| Sequence-based reagent | RBPMS siRNA | Stealth siRNAs Thermo Fisher Scientific | RSS363829; KD2 | See Material and methods |
| Sequence-based reagent | RBPMS siRNA | Stealth siRNAs Thermo Fisher Scientific | RSS363830; KD3 | See Material and methods |
| Sequence-based reagent | MBNL1 siRNA | Dharmacon | THH2 siRNA; Gooding et al., 2013 | See Materialand methods |
| Sequence-based reagent | MBNL2 siRNA | Dharmacon | Gooding et al., 2013 | See Material and methods |
| Peptide, recombinant protein | T7-FLAG-RBPMSA-H6 | this paper | See Material and methods and Supplementary file 6 | |
| Peptide, recombinant protein | T7-FLAG-RBPMSB-H6 | this paper | See Material and methods and Supplementary file 6 | |
| Chemical compound, drug | Phalloidin | Invitrogen | Alexa Fluor 488phalloidin; A12379 | See Material and methods |
| Software, algorithm | ImageJ | https://imagej.nih.gov/ij/download.html | 1.8.0_172 | See Material and methods |
| Software, algorithm | FibrilTool plugin | Boudaoud et al., 2014 PMID: 24481272 | See Material and methods | |
| Software, algorithm | AxioVision | Zeiss | v4.8.2 | See Material and methods |
| Software, algorithm | Rstudio | http://www.rstudio.com/ | R version 3.3.3 | See Material and methods |
| Other | DAPI staining | Thermo Fisher Scientific | ProLongDiamond Antifade Mountant with DAPI; P36966 | See Material and methods |
Additional files
-
Supplementary file 1
RBP genes associated with super-enhancers in human tissues.
- https://cdn.elifesciences.org/articles/46327/elife-46327-supp1-v2.xlsx
-
Supplementary file 2
Genes with significant changes in mRNA abundance in aorta dedifferentiation (T vs P9), PAC1 dedifferentiation (D Ctr vs P Ctr), RBPMS knockdown (D KD vs D Ctr) and RBPMS overexpression (P OE vs P Ctr).
- https://cdn.elifesciences.org/articles/46327/elife-46327-supp2-v2.xlsx
-
Supplementary file 3
Genes with significant changes in mRNA splicing in aorta dedifferentiation (T - P9), PAC1 dedifferentiation (D Ctr - P Ctr), RBPMS knockdown (D KD - D Ctr) and RBPMS overexpression (P OE - P Ctr).
- https://cdn.elifesciences.org/articles/46327/elife-46327-supp3-v2.xlsx
-
Supplementary file 4
GO terms significantly enriched in the genes differentially spliced in aorta dedifferentiation (T - P9), PAC1 dedifferentiation (D Ctr - P Ctr), RBPMS knockdown (D KD - D Ctr) and RBPMS overexpression (P OE - P Ctr).
- https://cdn.elifesciences.org/articles/46327/elife-46327-supp4-v2.xlsx
-
Supplementary file 5
GO terms significantly enriched in the genes with differential mRNA abundance.
- https://cdn.elifesciences.org/articles/46327/elife-46327-supp5-v2.xlsx
-
Supplementary file 6
Oligonucleotides and antibodies used in this study.
- https://cdn.elifesciences.org/articles/46327/elife-46327-supp6-v2.xlsx
-
Transparent reporting form
- https://cdn.elifesciences.org/articles/46327/elife-46327-transrepform-v2.docx
Download links
A two-part list of links to download the article, or parts of the article, in various formats.
Downloads (link to download the article as PDF)
Open citations (links to open the citations from this article in various online reference manager services)
Cite this article (links to download the citations from this article in formats compatible with various reference manager tools)
Identification of RBPMS as a mammalian smooth muscle master splicing regulator via proximity of its gene with super-enhancers
eLife 8:e46327.
https://doi.org/10.7554/eLife.46327


