Single-cell sequencing of neonatal uterus reveals an Misr2+ endometrial progenitor indispensable for fertility
- Massachusetts General Hospital, United States
- Harvard Medical School, United States
- Broad Institute of MIT and Harvard, United States
- Massachussets General Hospital, United States
- University of Massachusetts Medical School, United States
Figures
Figure 1 with 1 supplement

Subluminal mesenchymal cells of postnatal uteri retain expression of Misr2.
(A) RNAish (RNA scope) analysis of Misr2 in transverse sections of male urogenital ridges at E 17.5, and in a time series of the developing uteri including E 18.5, E 19.5, PND 0, 2, and 6 in mice). Scale bars = 50 µm (n = 8 for<PND6; n = 4 for>PND6). Number of mice analyzed per time point is presented in Figure 1—source data 1. Black arrows demarcate to the myometrial layer at PND 20. (B) Representative scheme of the Misr2 expression pattern in the developing uterus. Subluminal mesenchymal cells continue to express Misr2 in the postnally until around PND 6. We sought to investigate the fate of these postnatal Misr2+ subluminal cells, and their possible role as progenitor cells of the endometrial stroma.
-
Figure 1—source data 1
Number of replicates per time point for the Misr2 in situ analysis in mice (Figure 1A) and in rats (Figure 1—figure supplement 1D–E).
Related to Figure 1A, Figure 1—figure supplement 1D–E.
- https://doi.org/10.7554/eLife.46349.005
Figure 1—figure supplement 1
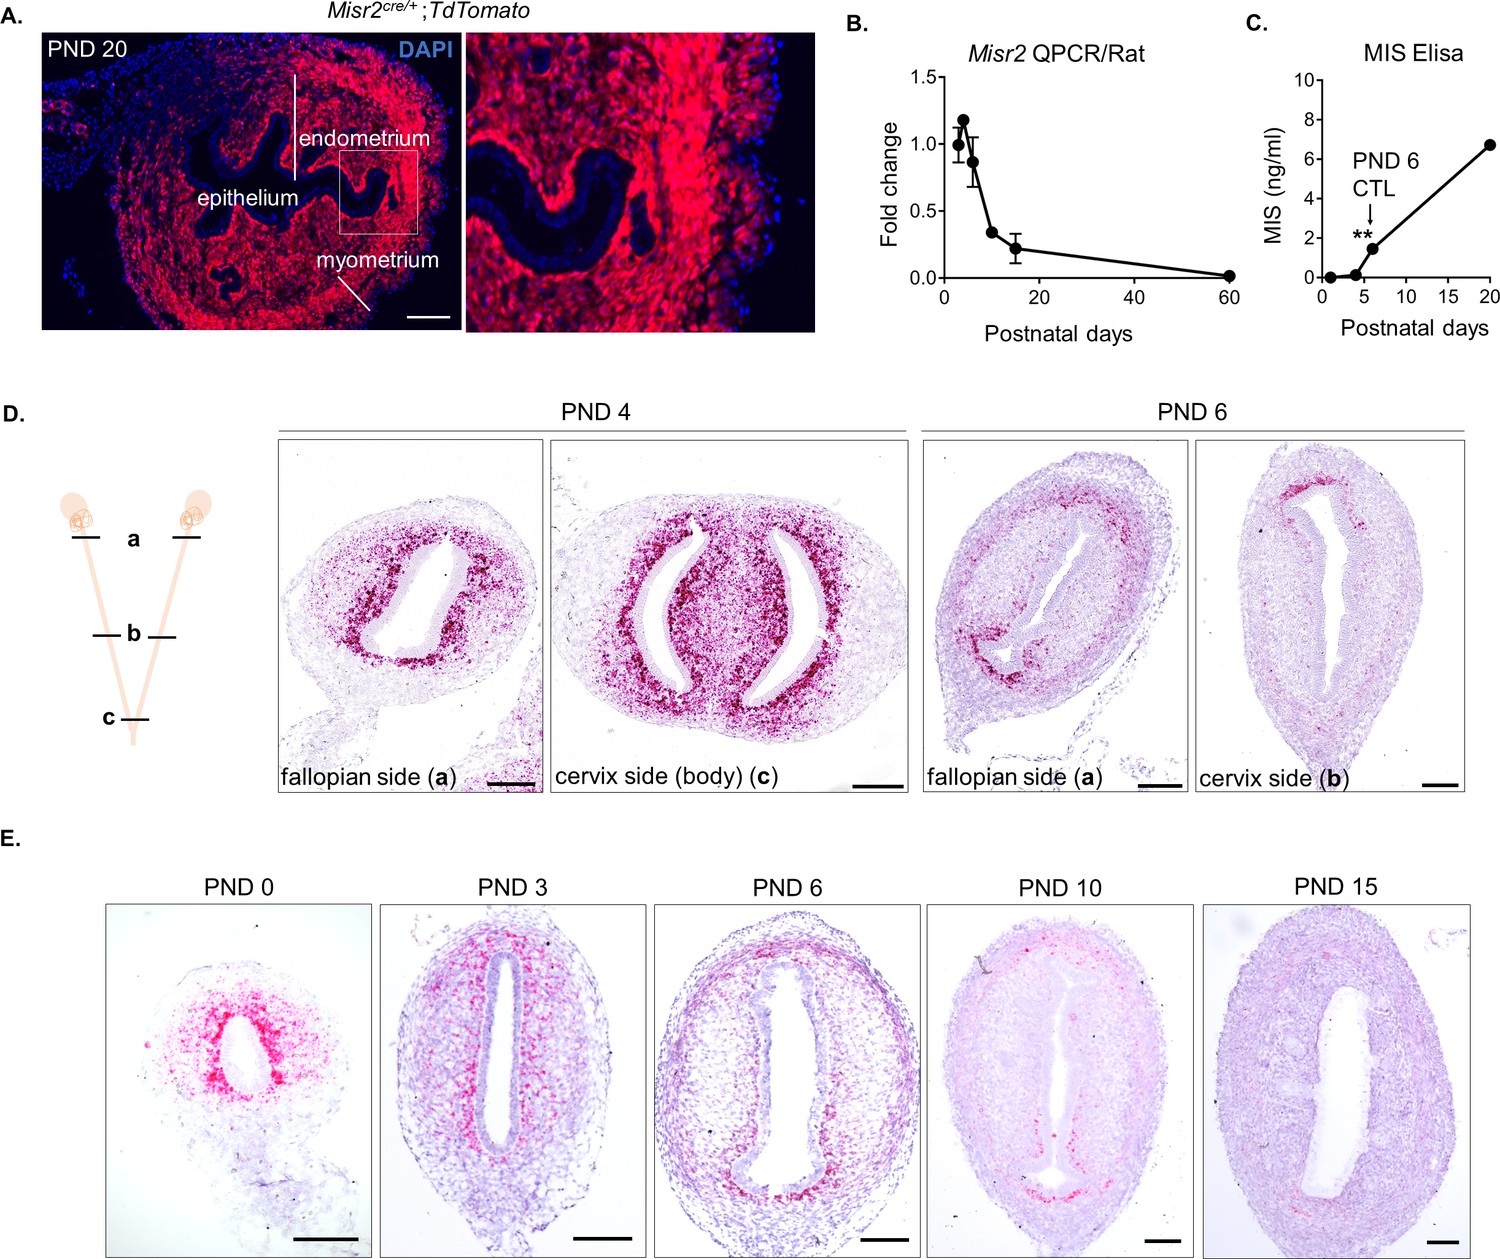
Misr2 expression is gradually attenuated in the PND 1-6 period, coinciding with the timing of the rise in secretion of MIS.
(A) Uteri from Misr2-cre-tdtomato mice were analyzed on PND 20. Scale bar = 50 µm. Note that all the layers of the adult uterus except the epithelium are derived from Misr2+ cells during early embryonic development. (B) Misr2 QPCR analysis of the developing rat uteri at PND 3, 4, 6, 10, 15, and 60. (C) Endogenous MIS (MISR2 ligand) levels were measured in the serum of wild-type rats at PND 1, 4, 6 and 20 by ELISA (left) (n > 2), mean ± SEM, statistical significance indicated by ** (p<0.01) by one-way ANOVA followed by Tukey Multiple comparison test. (D) Misr2 expression pattern from the fallopian side (a) and the cervix side (b) of the developing uteri (PND 4 and PND 6) in rats. Note that the Misr2 expression pattern is consistently subluminal in proximal and distal transverse locations of the uterine horn. Scale bars = 50 µm. E. RNAish (RNA scope) of Misr2 in middle transverse sections in a time series of the developing rat uteri including PND 0, 2, 3 and 6 in rats. Scale bars = 50 µm (n = 8 for<PND 6; n = 5 for>PND 6). Number of replicates per time point is presented in Figure 1—source data 1. Rats were used as the model organism to replicate the findings observed in mice tissue sections in Figure 1A.
Figure 2 with 1 supplement
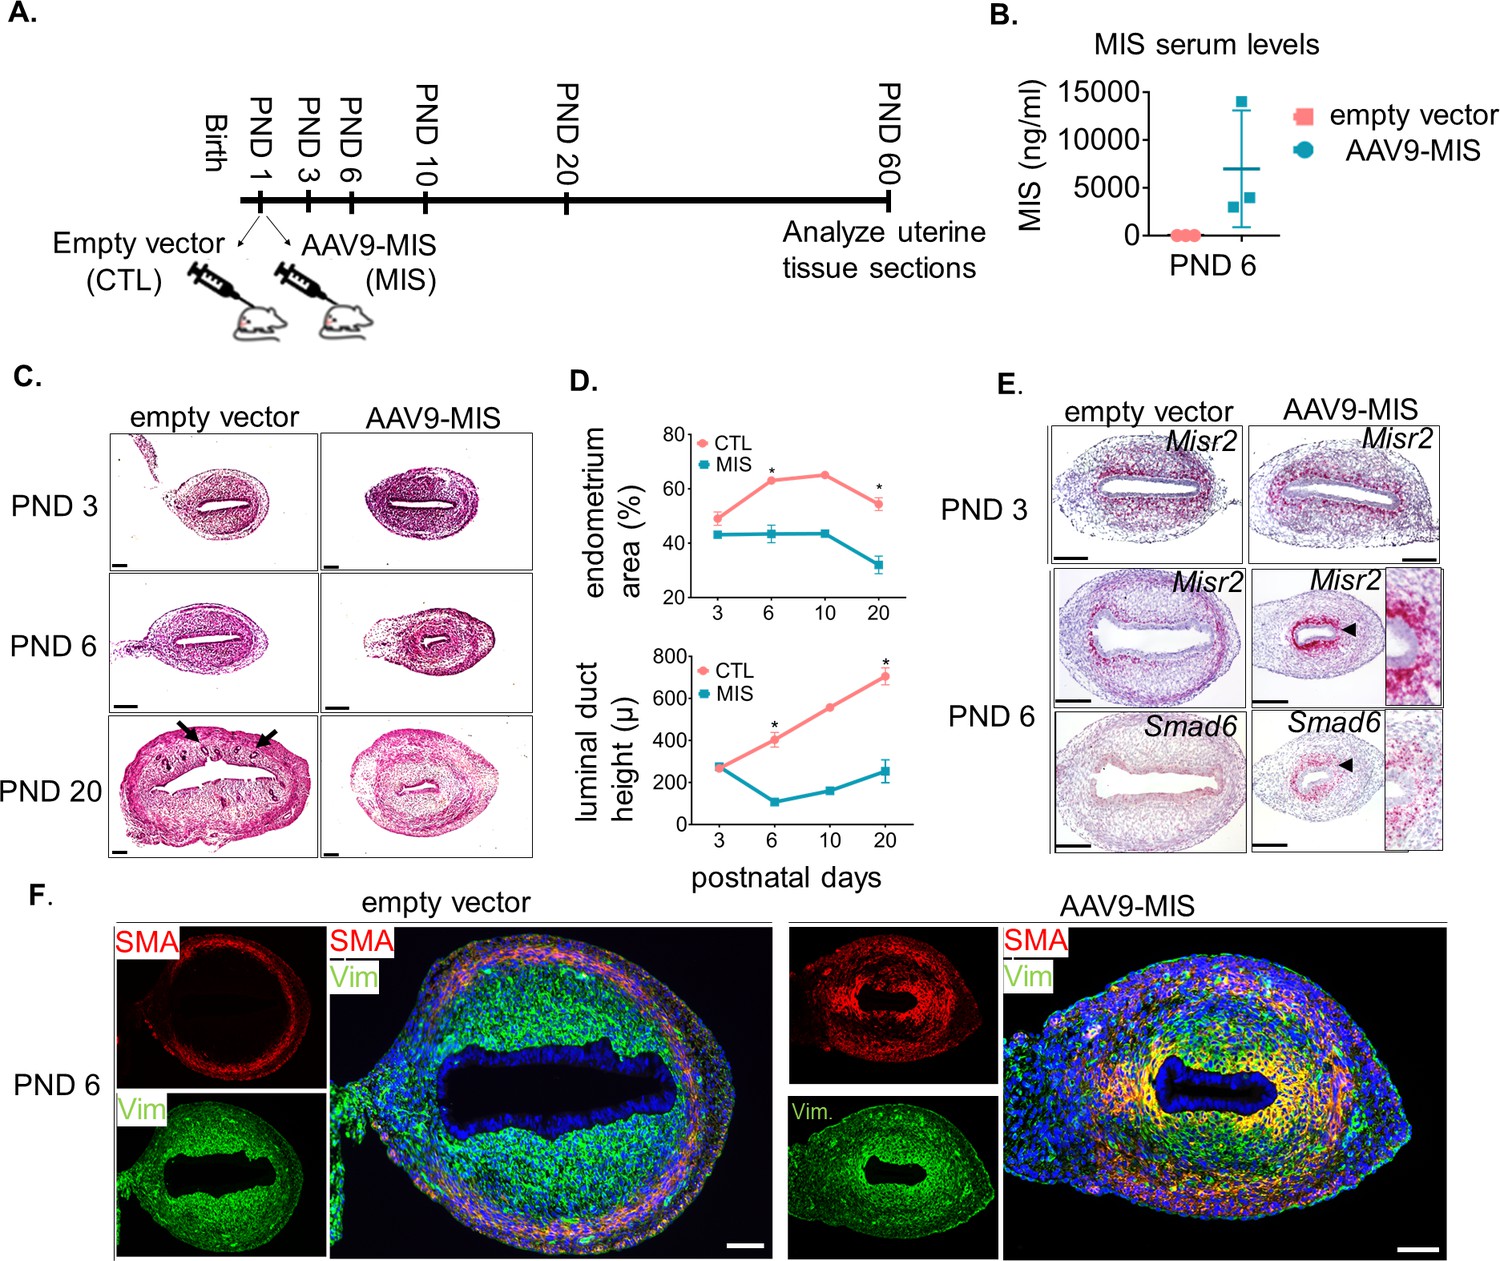
Misr2+ subluminal mesenchymal cells are susceptible to inhibition by MIS.
(A) Rat pups were treated with AAV9-MIS (MIS) or empty vector control (CTL) on postnatal day1 (PND 1) and euthanized at different developmental time points (B–F). Rats were used as the initial model organism since their litter sizes are bigger than mice. (B) MIS serum levels from control and AAV9-MIS treated rats on day 6 (n = 3 for both). (C) H& E sections from CTL and AAV9- MIS treated uteri on PND 3, 6, and 20. Endometrial glands are demarcated by black arrows on day 20. Scale bars = 100 µm. (D) Percentage of the endometrial stroma area (%), and luminal duct height of the CTL and MIS-treated uteri (Figure 2—source data 1). (E) Misr2 and Smad6 expression pattern by RNAish. Scale bars = 100 µm. (F) Smooth muscle α-actin (SMA) in red, and Vimentin (Vim) in green on CTL and AAV9-MIS treated uterine sections (PND 6, scale bars = 100 µm).
-
Figure 2—source data 1
Data, number of replicates and p values of significance between the control and AAV9-MIS treated uterine samples for histomorphological analysis.
Related to Figure 2B–E.
- https://doi.org/10.7554/eLife.46349.008
Figure 2—figure supplement 1
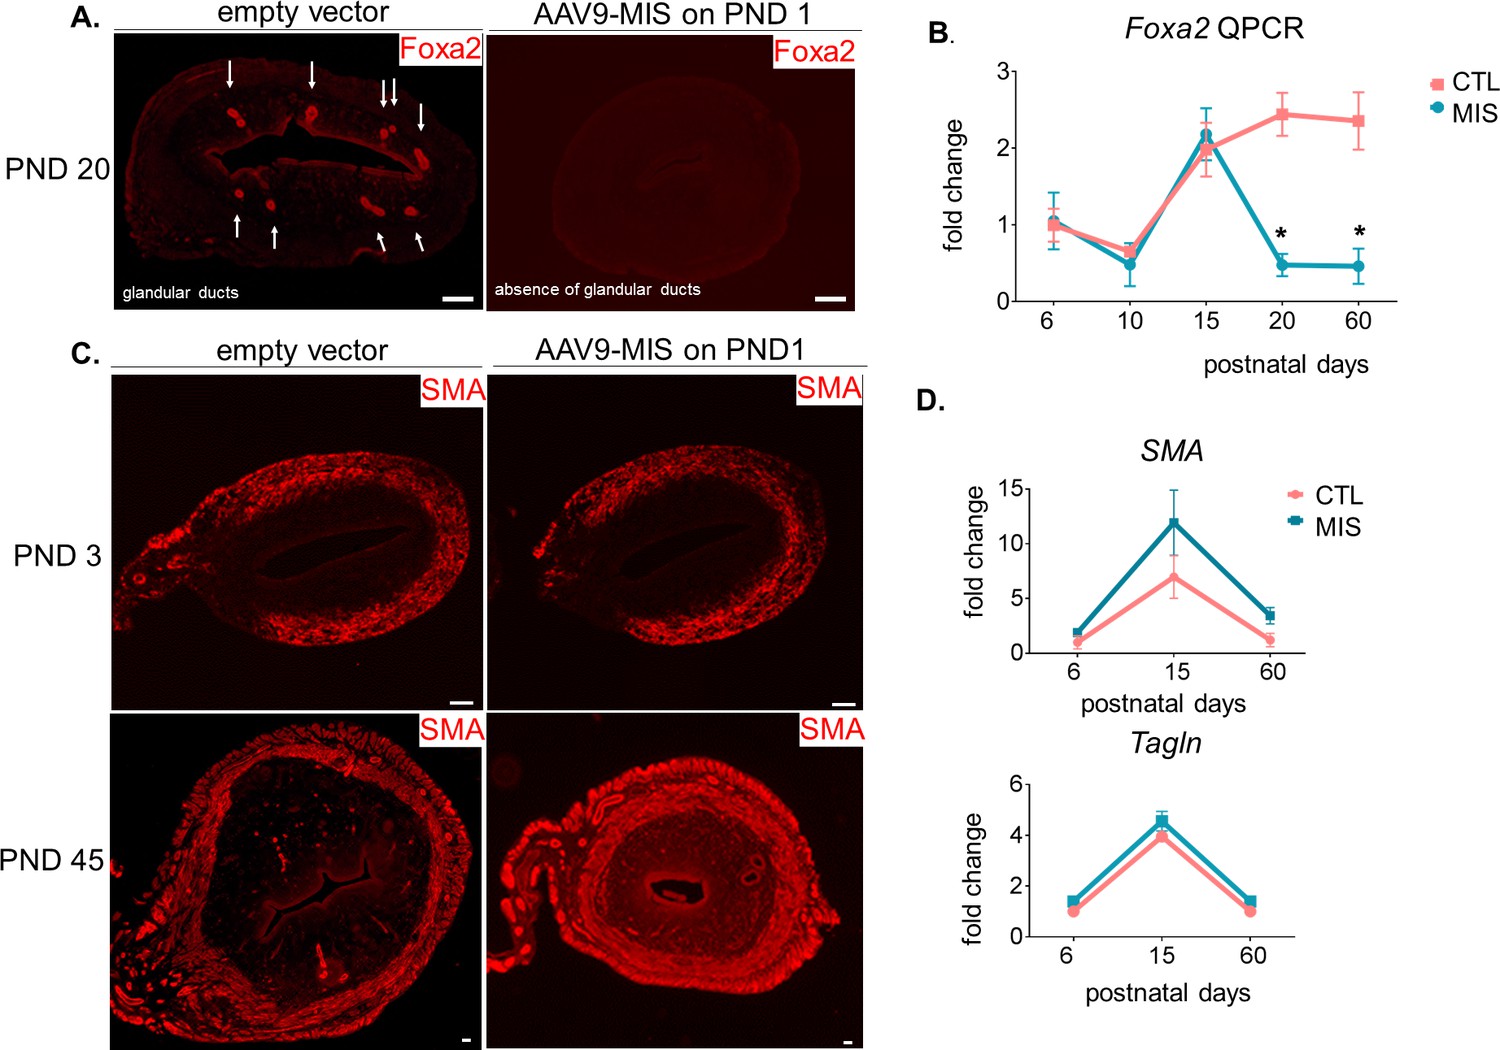
MIS treatment inhibits endometrial gland formation but not myometrial development.
(A) Foxa2 immunofluorescence (red) in CTL and MIS-treated rat uteri sections at postnatal day 20. Note that the glandular ducts were missing in the treated uteri. Scale bars = 50 µm. (B) Foxa2 QPCR analysis of control and treated rats at various time points (n > 2, unpaired Student t-test, mean ± SEM, * (p<0.05)). (C) Smooth muscle α actin (SMA) immunofluorescence (red) on CTL and MIS-treated uteri at PND 3 and 45. Scale bars = 50 µm (D) SMA and Transgelin (Tagln) expression levels by qPCR on PND 6, 15, and 60.
Figure 3 with 4 supplements
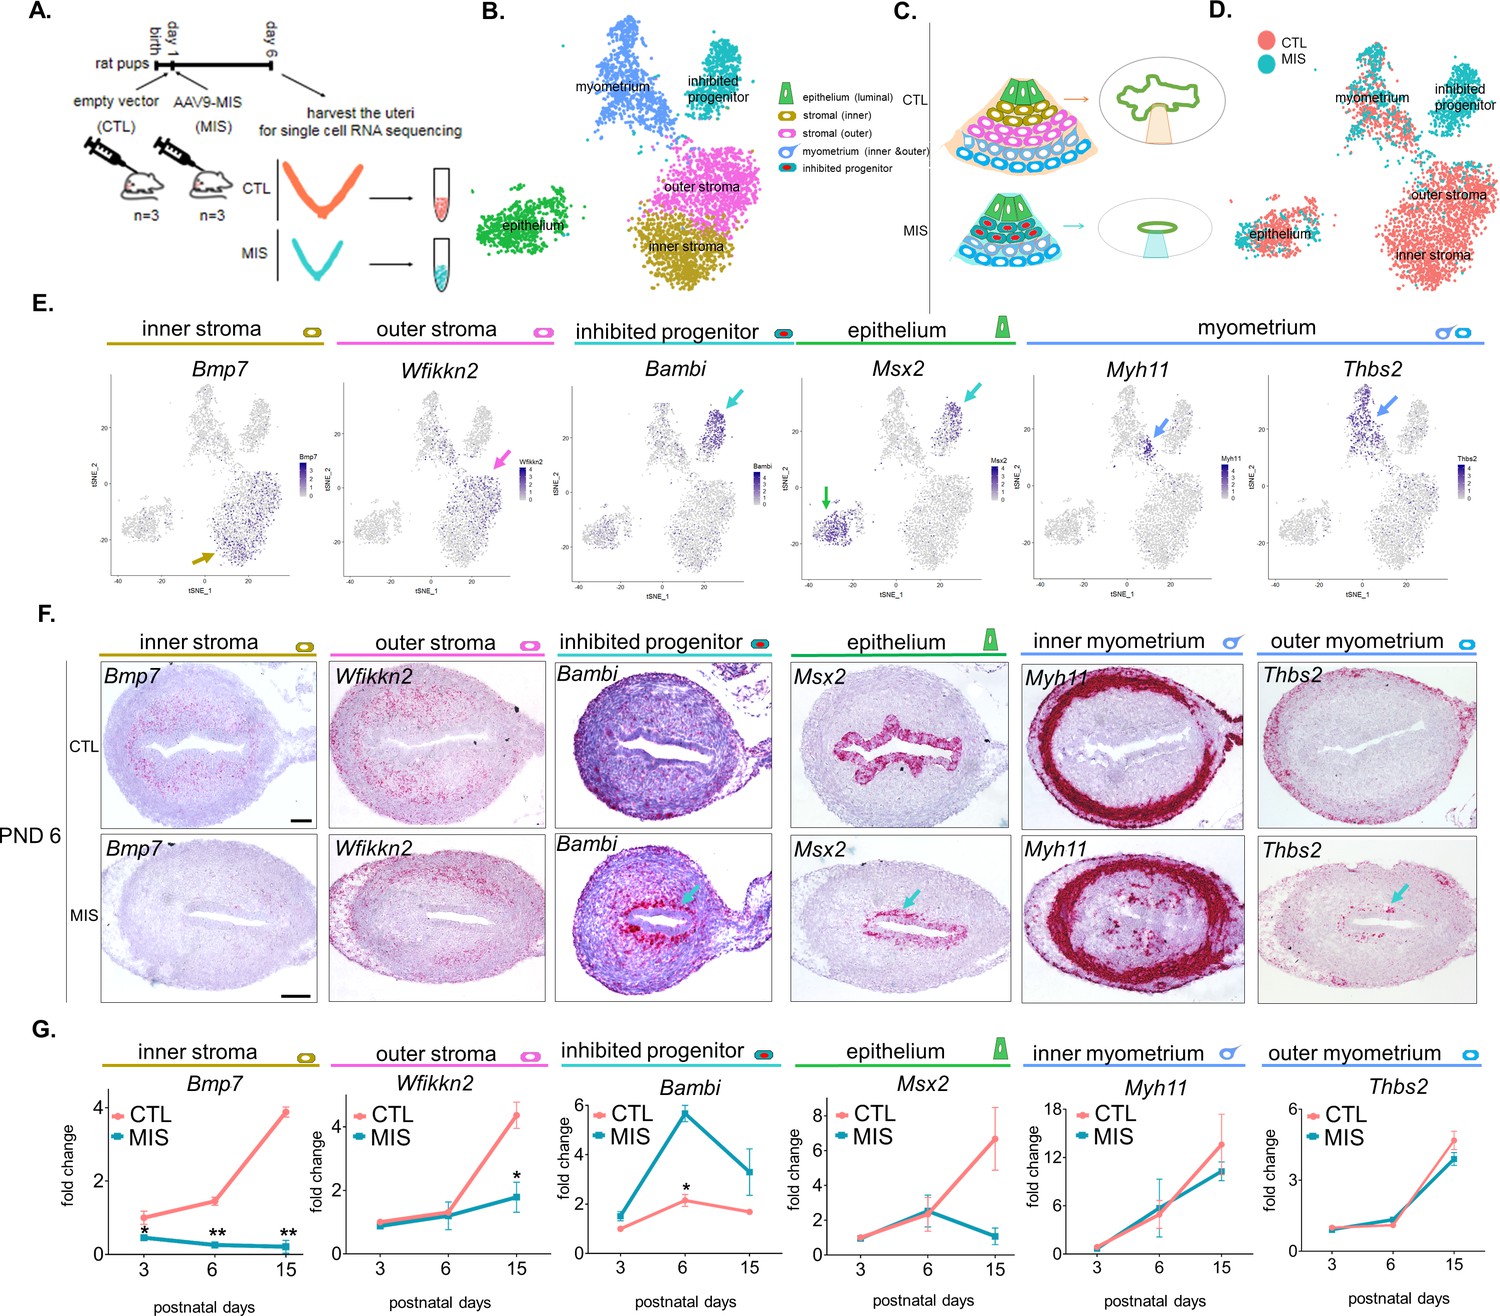
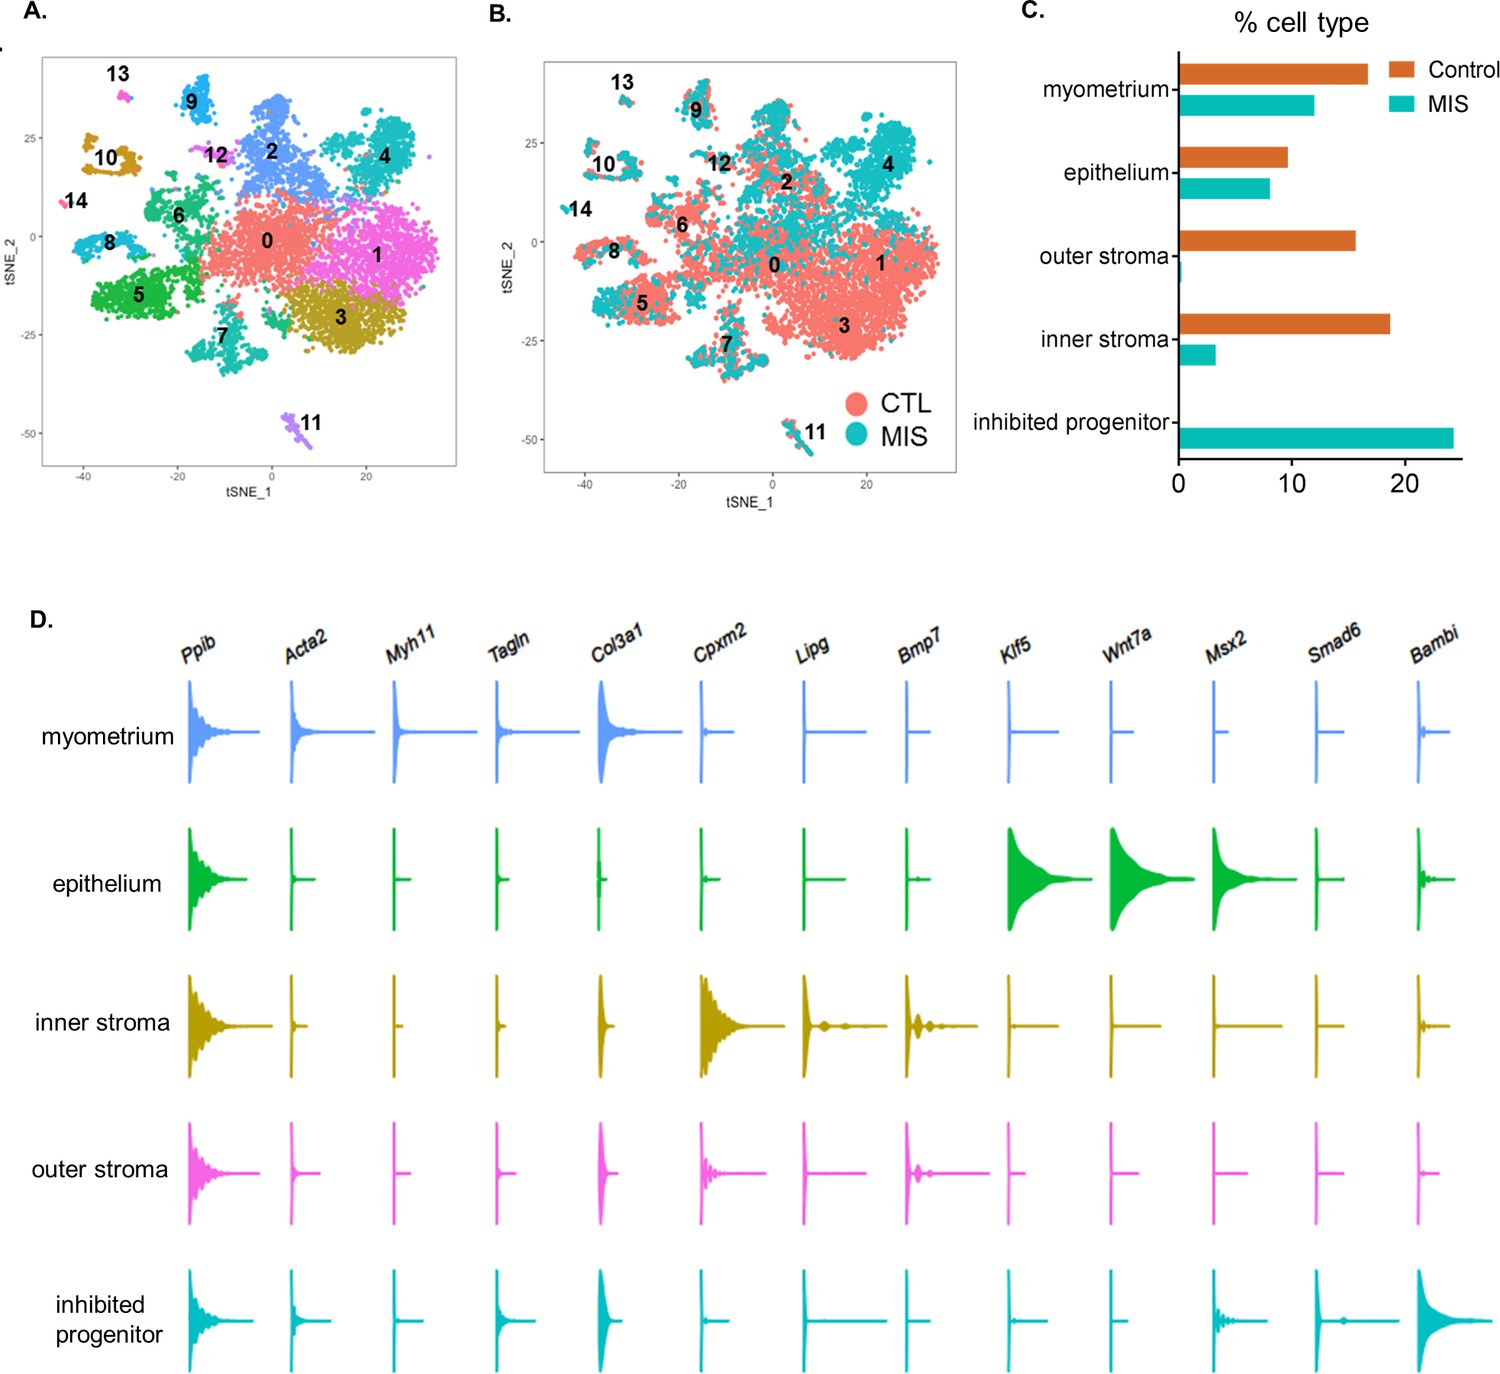
Single cell RNA sequencing of PND 6 uteri reveals distinct cell types and unique gene signatures in response to MIS treatment.
(A) Rat pups were treated with empty vector control (CTL) or AAV9-MIS (MIS) on PND 1, and euthanized on PND 6 (n = 3 for both). Following whole-tissue dissociation, RNA isolated from single uterine cells, were barcoded and sequenced using inDROP. (B) t-SNE plot of unbiased clustering of uterine cells, where each color-coded cluster represents one cell type/state (only the main uterine parenchymal clusters are represented) (Figure 3—source data 1). (C) Schematic representation of the differential cellular composition of control and MIS-treated uteri. (D) t-SNE plot of unbiased clustering of uterine cells (dots) color-coded by treatment with CTL (orange) and MIS (blue) (Figure 3—source data 1). (E) Gene expression levels of representative cell-type-specific markers for each cluster overlaid on t-SNE plots (featureplot, color-coded arrow refers to cell type). (F) RNAish stains of representative cell-type markers in transverse uterine sections of empty vector control (CTL) and AAV9-MIS (MIS) treated mice at PND 6. Scale bars = 100 µm, same for all sections. Mouse tissues were used for validation purposes as the RNA in situ probes were readily available for mice and the effect of MIS was conserved among mice and rats. (G) Rat pups treated with AAV9-MIS (MIS) or empty vector (CTL) on PND 1 were euthanized at different developmental time points (PND3, 6, and 15), and their uteri were harvested for QPCR analysis of one representative marker for each cluster (n > 2, unpaired Student’s t test, mean ± SEM, *(p<0.05), **(p<0.01)) (Figure 3—source data 3).
-
Figure 3—source data 1
Related to Figure 3; Figure 3—figure supplements 1, 2, 3 and 4; Figure 4, Figure 4—figure supplements 1, 2 and 3 and Table 1.
- https://doi.org/10.7554/eLife.46349.014
-
Figure 3—source data 2
Differentially expressed genes (MIS vs Control) in the myometrium of the developing rat uteri.
Related to Figure 3—figure supplement 4C.
- https://doi.org/10.7554/eLife.46349.015
-
Figure 3—source data 3
Related to Figure 3G, Figure 4—figure supplements 1D,3D,4E.
First worksheet presents the sets of primers used in this study. Second worksheet presents the statistics for the QPCRs experiments: Number of replicates and p values of significance between the control and treated uterine samples for the Quantitative PCR experiments.
- https://doi.org/10.7554/eLife.46349.016
Figure 3—figure supplement 1
Single-cell RNA sequencing analysis of the control and AAV9-MIS treated rat uterine cells.
(A) Rat pups were treated with empty vector control (CTL) or AAV9-MIS (MIS) on PND1, and euthanized on PND 6 (n = 3 for both). t-SNE plot displaying the results of unbiased clustering of single uterine cells, where each color-coded cluster represents one cell type/state (all clusters included). Labels are as follows: 0: censored, 1: outer stroma, 2: myometrium, 3: inner stroma, 4: inhibited cluster, 5: luminal epithelium, 6: dividing cells, 7: vascular endothelium, 8: dividing epithelium, 9: mesothelium, 10: myeloid, 11: erythroid, 12: pericyte, 13: lymphatic endothelium, 14: neurons (Figure 3—source data 1). (B) t-SNE plot displaying the clustering of single uterine cells where each dot/cell is color-coded according to treatment, either CTL (orange) or MIS (blue) (all clusters included) (Figure 3—source data 1). (C) Relative percentage of representation of cells by clusters based on treatment (CTL, orange and MIS, blue) in the main parenchymal uterine cell types (only the main uterine cell types are shown in Figure 3B). (D) Gene expression levels of selected markers in the main parenchymal uterine cell types.
Figure 3—figure supplement 2
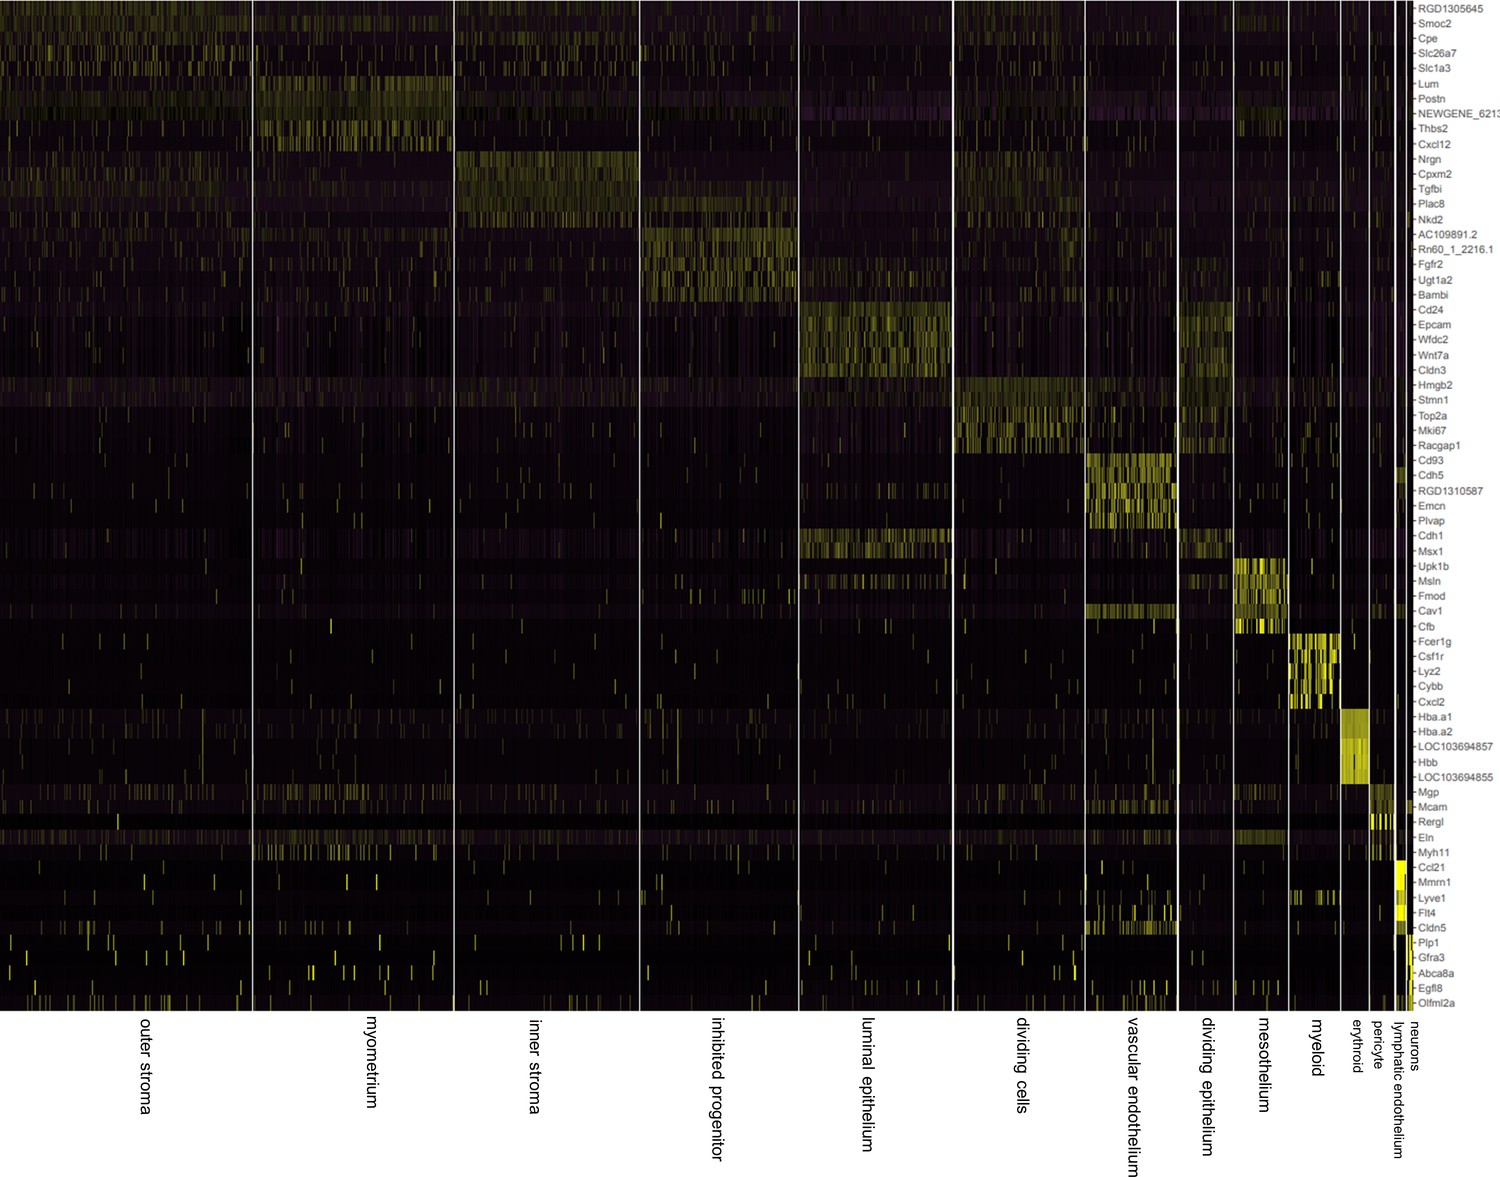
Single-cell RNA-seq reveals the cell atlas of the developing PND6 uterus.
Heatmap of top five markers (showing top five genes by fold expression over average) amongst 14 different clusters (Figure 3—source data 1).
Figure 3—figure supplement 3
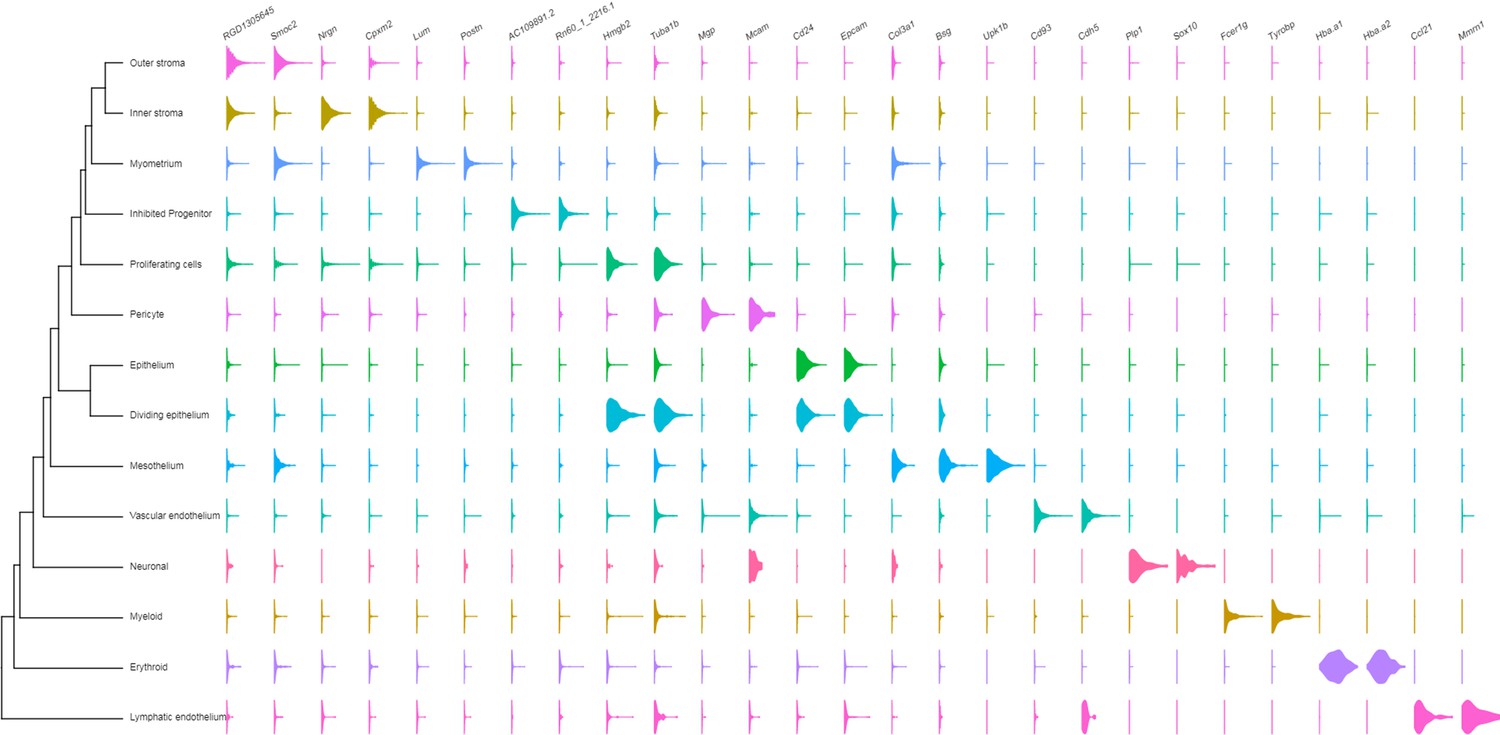
Single-cell RNA-seq reveals the cell atlas of the developing PND 6 uterus.
Violin plots of the top two marker genes revealed by highest p values (Figure 3—source data 1 and Table 1).
Figure 3—figure supplement 4
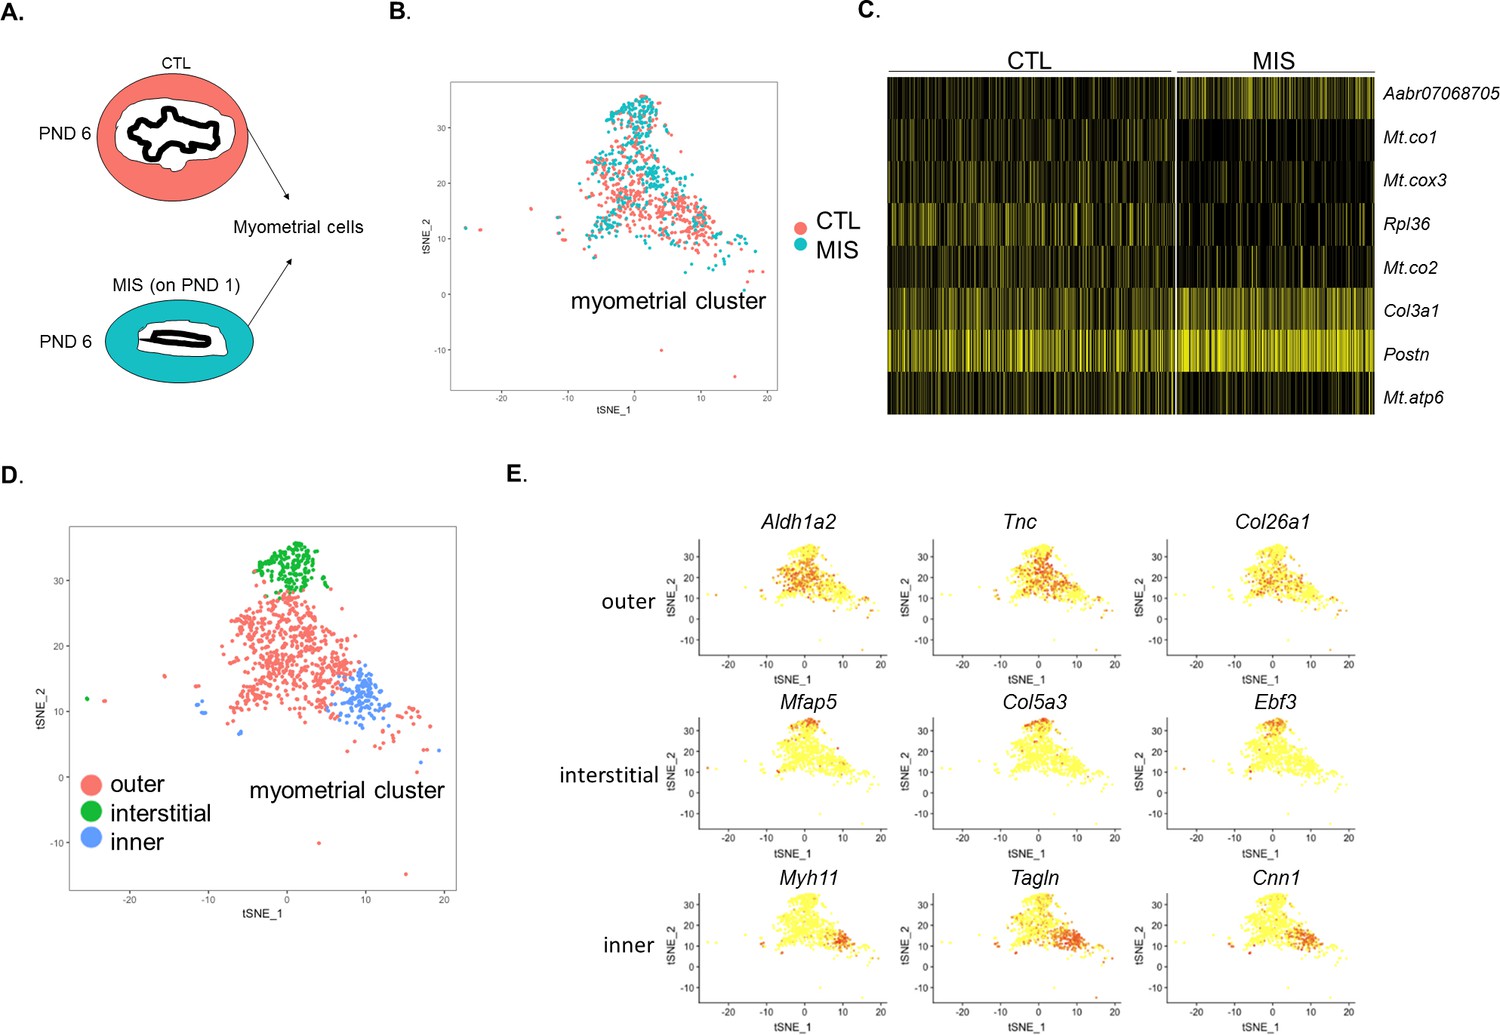
The myometrium cluster can be sub-divided into three different cell types whose gene signatures are only weakly affected by MIS treatment.
Rat pups were injected with empty vector control (CTL) or AAV9-MIS (MIS) on PND 1 and analyzed by scRNAseq at PND 6 (A–E). (A) Representative schema of the myometrial layer composition in control (orange) and MIS-treated (blue) uteri. (B) t-SNE plot of the myometrial cluster with cells labeled according to treatment. Note that both the CTL and the MIS-treated cells are numerically and spatially similarly represented in the t-SNE plot. (C) Heatmap of differentially expressed genes in CTL and MIS-treated myometrium (Figure 3—source data 2). (D) Sub-clustering of the myometrium cluster revealed three distinct myometrial sub-populations in the developing PND 6 rat uteri. (E) Specific markers for the three cell subtypes (outer, interstitial (microfibril enriched), and inner) of the developing rat myometrium.
Figure 4 with 4 supplements
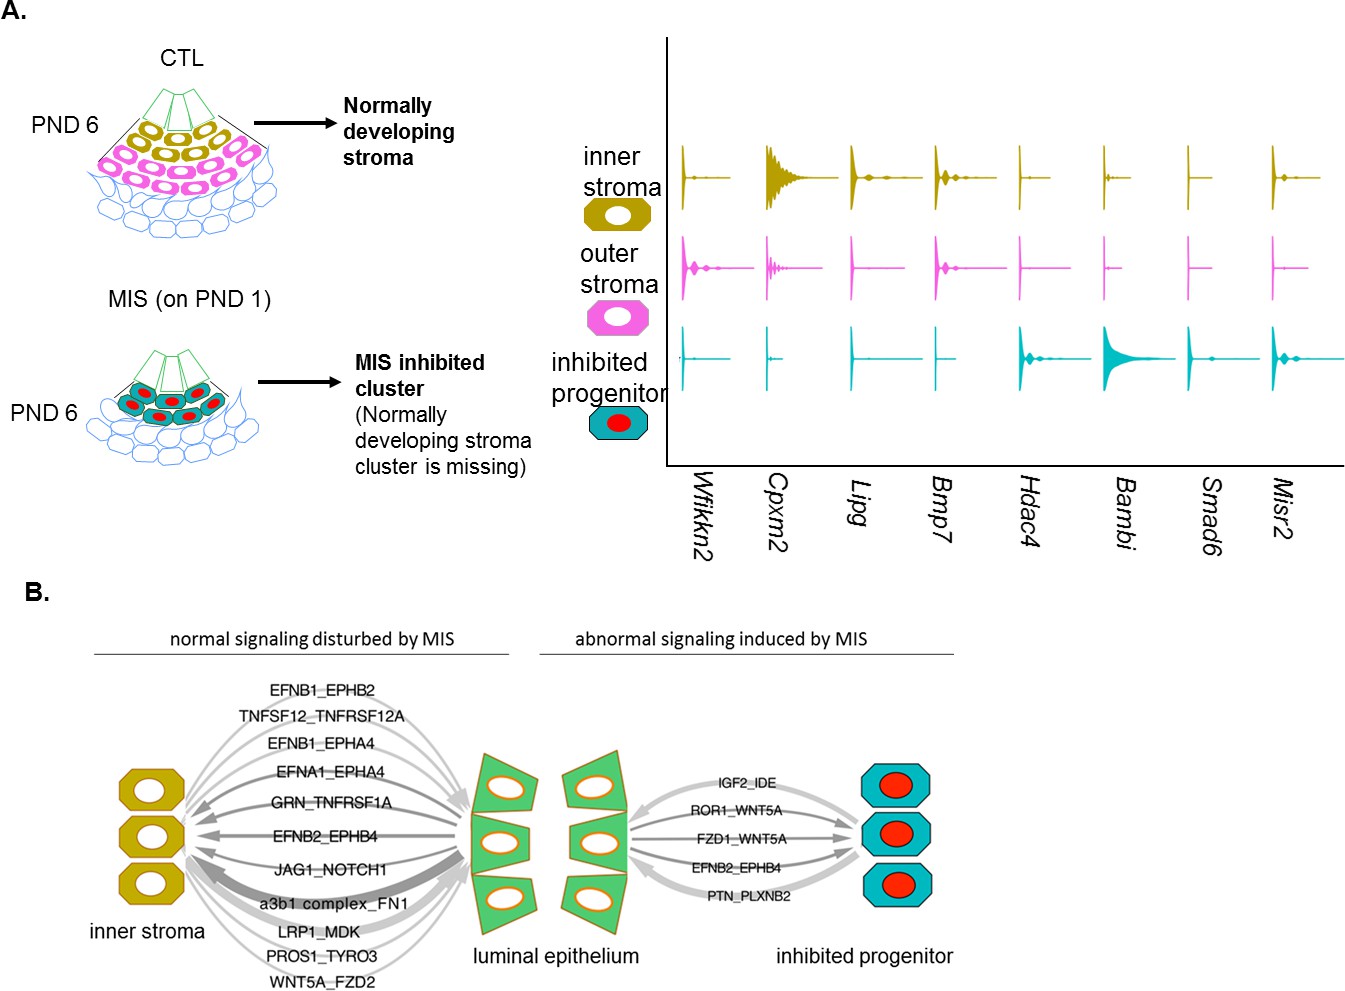
MIS treatment blocks the differentiation of a putative progenitor cell, preventing endometrial stroma formation, which indirectly dysregulates epithelial cell development.
(A) When treated with MIS, a unique population of Misr2+ subluminal putative progenitor cells are retained (inhibited progenitors), while the inner and the outer endometrial stromal layers fail to develop (representative scheme on the left). Note the differential expression pattern of stromal markers in the violin plots of the control and the MIS-treated uterine cells. See Figure 3 and Figure 4—figure supplements 1–3 for validation of these markers on tissue sections. (B) Diagrams of the unique receptor-ligand pairs present 1) between luminal epithelial cells and inner stromal cells (which are absent in MIS-treated uteri) (left), and 2) between the epithelial cells and the inhibited progenitor cells, (which are only present in the MIS-treated group).
-
Figure 4—source data 1
Cell phone DB analysis.
First worksheet shows the filtered gene names depending on clusters (shown in the figures). Second worksheet includes all the gene names. Related to Figure 4B, Figure 4—figure supplement 4.
- https://doi.org/10.7554/eLife.46349.022
-
Figure 4—source data 2
Differentially expressed genes (MIS vs Control) in the luminal epithelium of the developing rat uteri.
Related to Figure 4—figure supplement 4F.
- https://doi.org/10.7554/eLife.46349.023
Figure 4—figure supplement 1
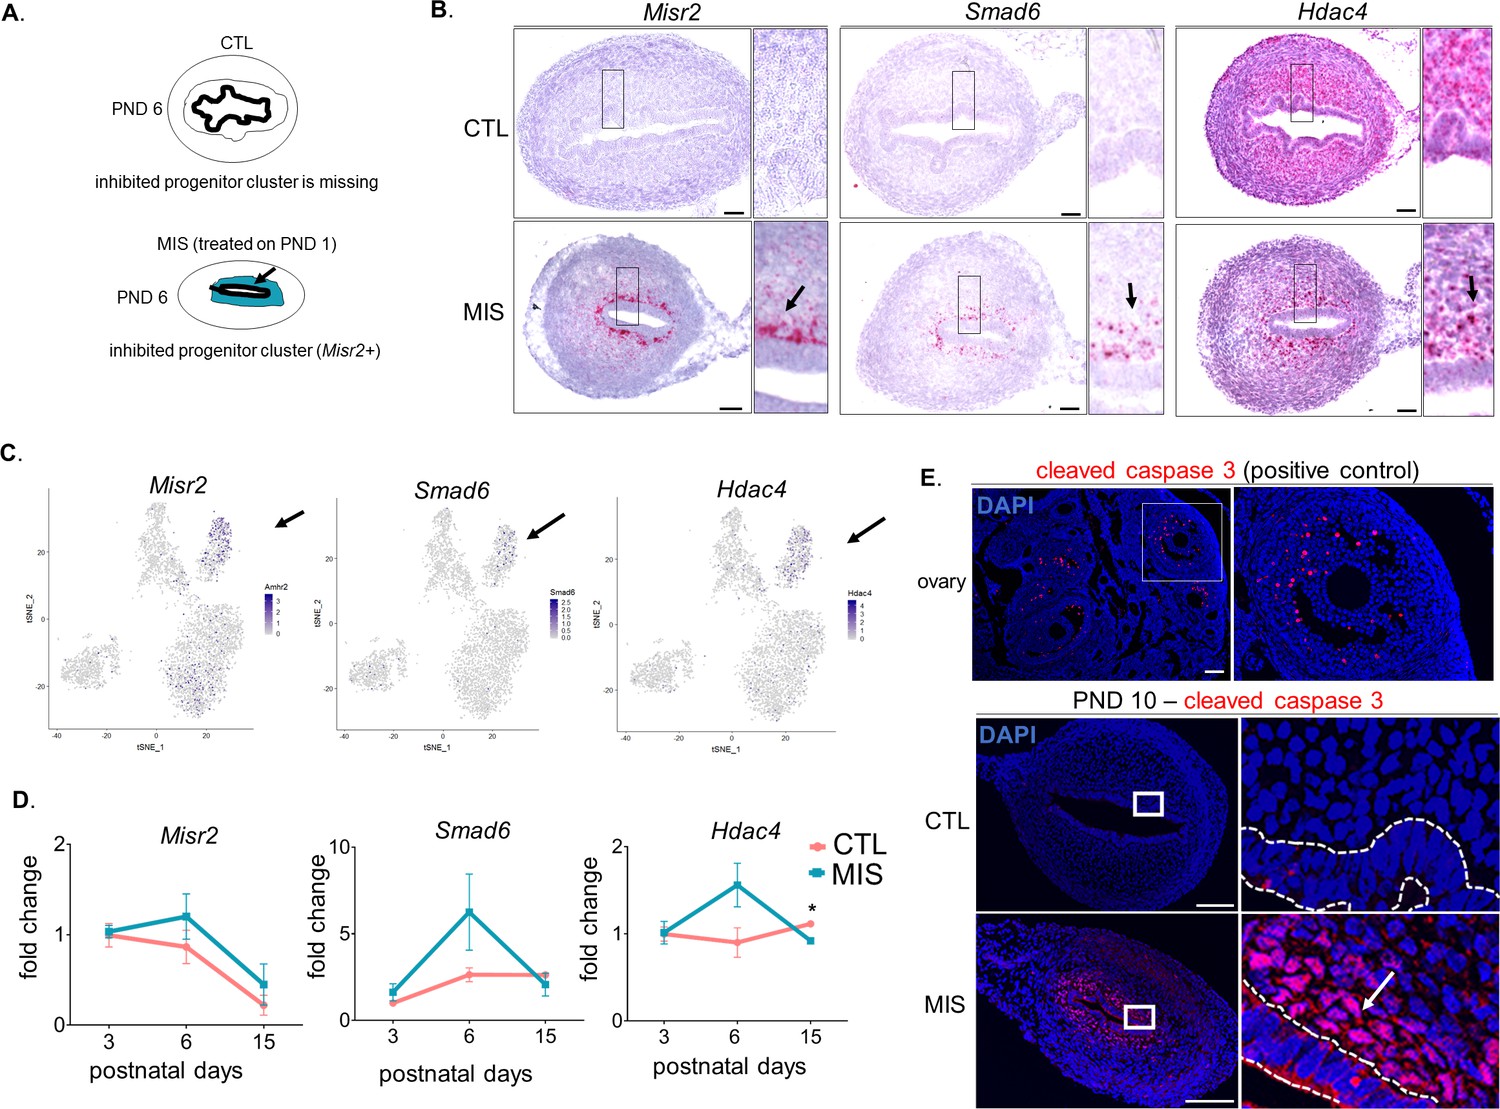
The inhibited progenitor cluster is only present in the MIS-treated uterus and corresponds to a subluminal mesenchymal cell.
Rat or mouse pups were injected with empty vector control (CTL) or with AAV9-MIS (MIS) on PND 1 and analyzed at different developmental time points (A–E). (A) Representative schema of the CTL and MIS-treated uteri at PND6. Note that the MIS-inhibited subluminal mesenchymal cell cluster (blue) is missing in the control uterus. (B) Control and MIS-treated mice uteri probed by RNAish using specific inhibited progenitor cluster markers at PND 6 (Misr2, Smad6, and Hdac4). Note that the Misr2+ cells reside in the subluminal space and express the anticipated markers identified by scRNAseq (shown by arrows in small inserts). Scale bars = 50 µm. (C) Expression pattern of Misr2, Smad6, and Hdac4 (markers for the MIS-inhibited cluster) in CTL and MIS treated cells on the t-SNE plots (FeaturePlot). Black arrows indicate the inhibited progenitor cells' cluster. (D) QPCR analysis of Misr2, Smad6, and Hdac4 in CTL (orange) and MIS-treated (blue) rat uteri at different developmental time points. (n > 2 for all time points, unpaired Student’s t test, mean ± SEM), *(p<0.05), **(p<0.01), (Figure 3—source data 3). (E) Cleaved-caspase-3 immunofluorescence (red) on ovarian (positive control), and MIS-treated rat uteri at PND 10. Note that only the MIS-treated subluminal cells (white arrows) are positive for cleaved caspase-3 on uterine sections. Scale bars = 50 µm.
Figure 4—figure supplement 2
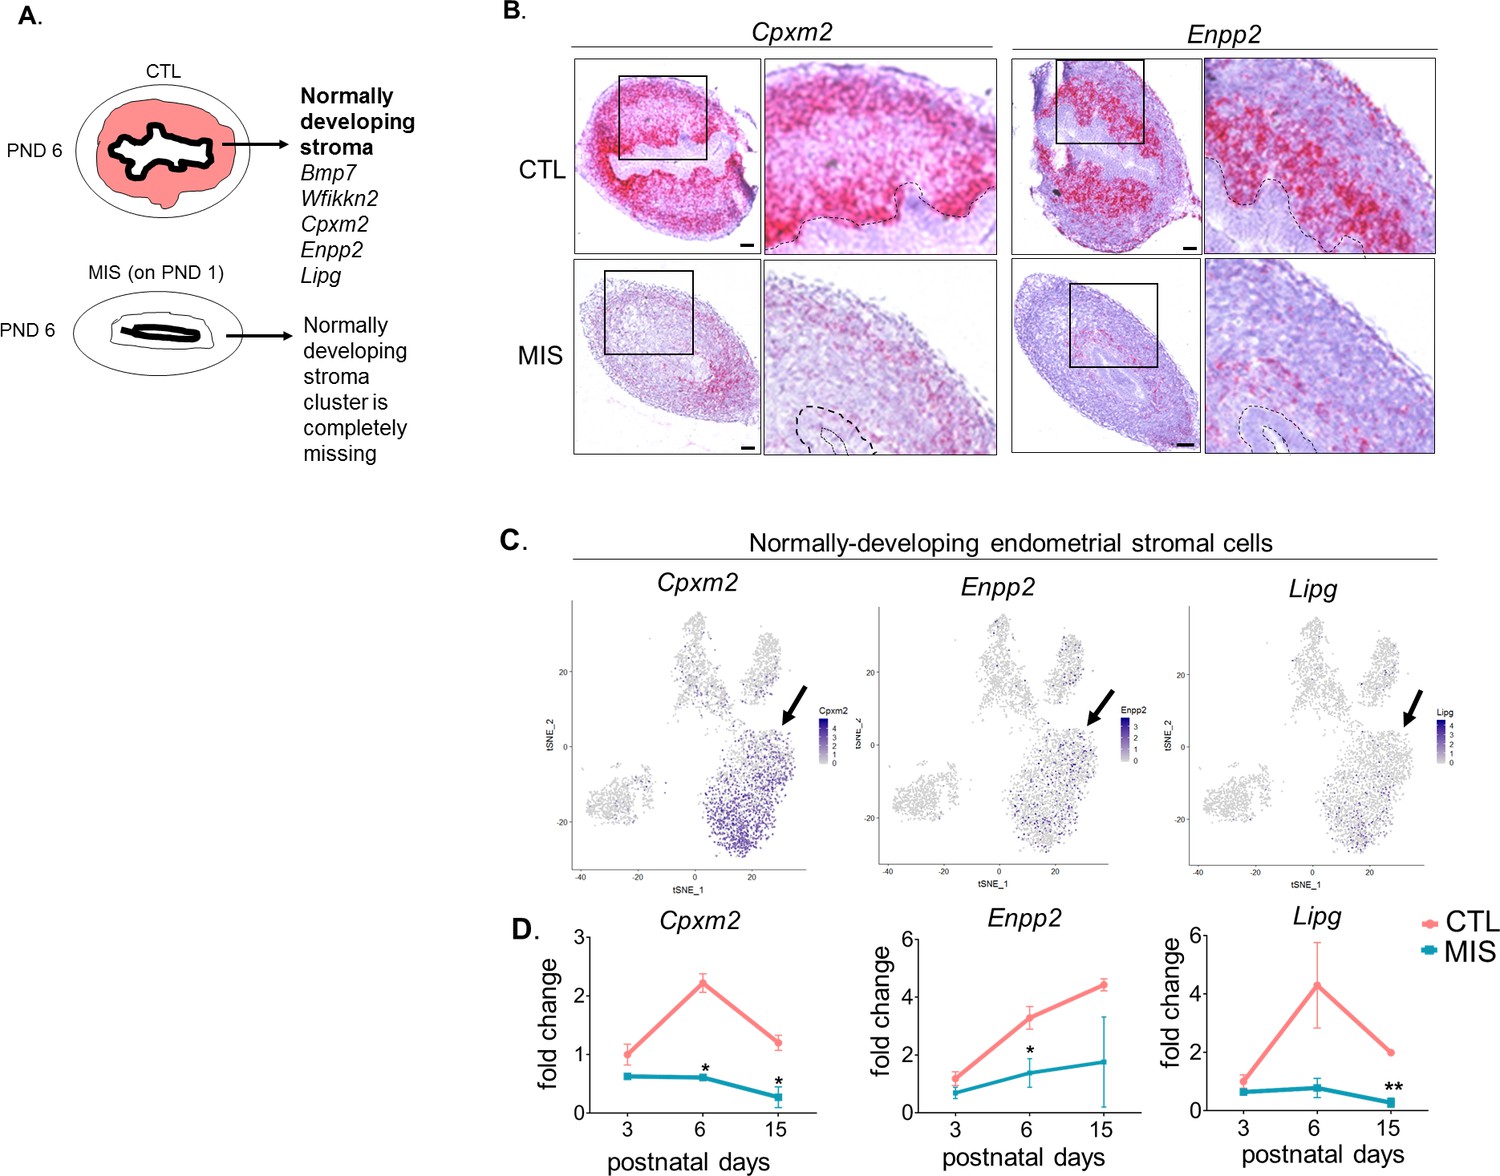
Endometrial stromal layers fail to form when the putative progenitor cells are inhibited by MIS.
Rat or mouse pups were injected with empty AAV9 vector control (CTL) or with AAV9-MIS (MIS) on PND 1 and analyzed at different time points (A–D). (A) Representative schema of the CTL and MIS-treated uteri at PND6. Note the absence of the endometrial stroma (orange) in the MIS-treated uteri. (B) Control and MIS-treated mice uteri probed by RNAish using specific endometrial stromal cluster markers at PND 6 (Cpxm2, Enpp2). Scale bars = 50 µm. (C) Expression pattern of Cpxm2, Enpp2, and Lipg (markers of endometrial stroma) in the uterine t-SNE plots (FeaturePlot). (D) QPCR analysis of Cpxm2, Enpp2 and Lipg in CTL and MIS-treated rat uteri at different developmental time points (PND3, 6, 15). (n > 2 for all time points, unpaired Student’s t test, mean ± SEM, *(p<0.05), **(p<0.01)) (Figure 3—source data 3). Note the endometrial stromal markers are significantly down-regulated in the MIS-treated uteri.
Figure 4—figure supplement 3
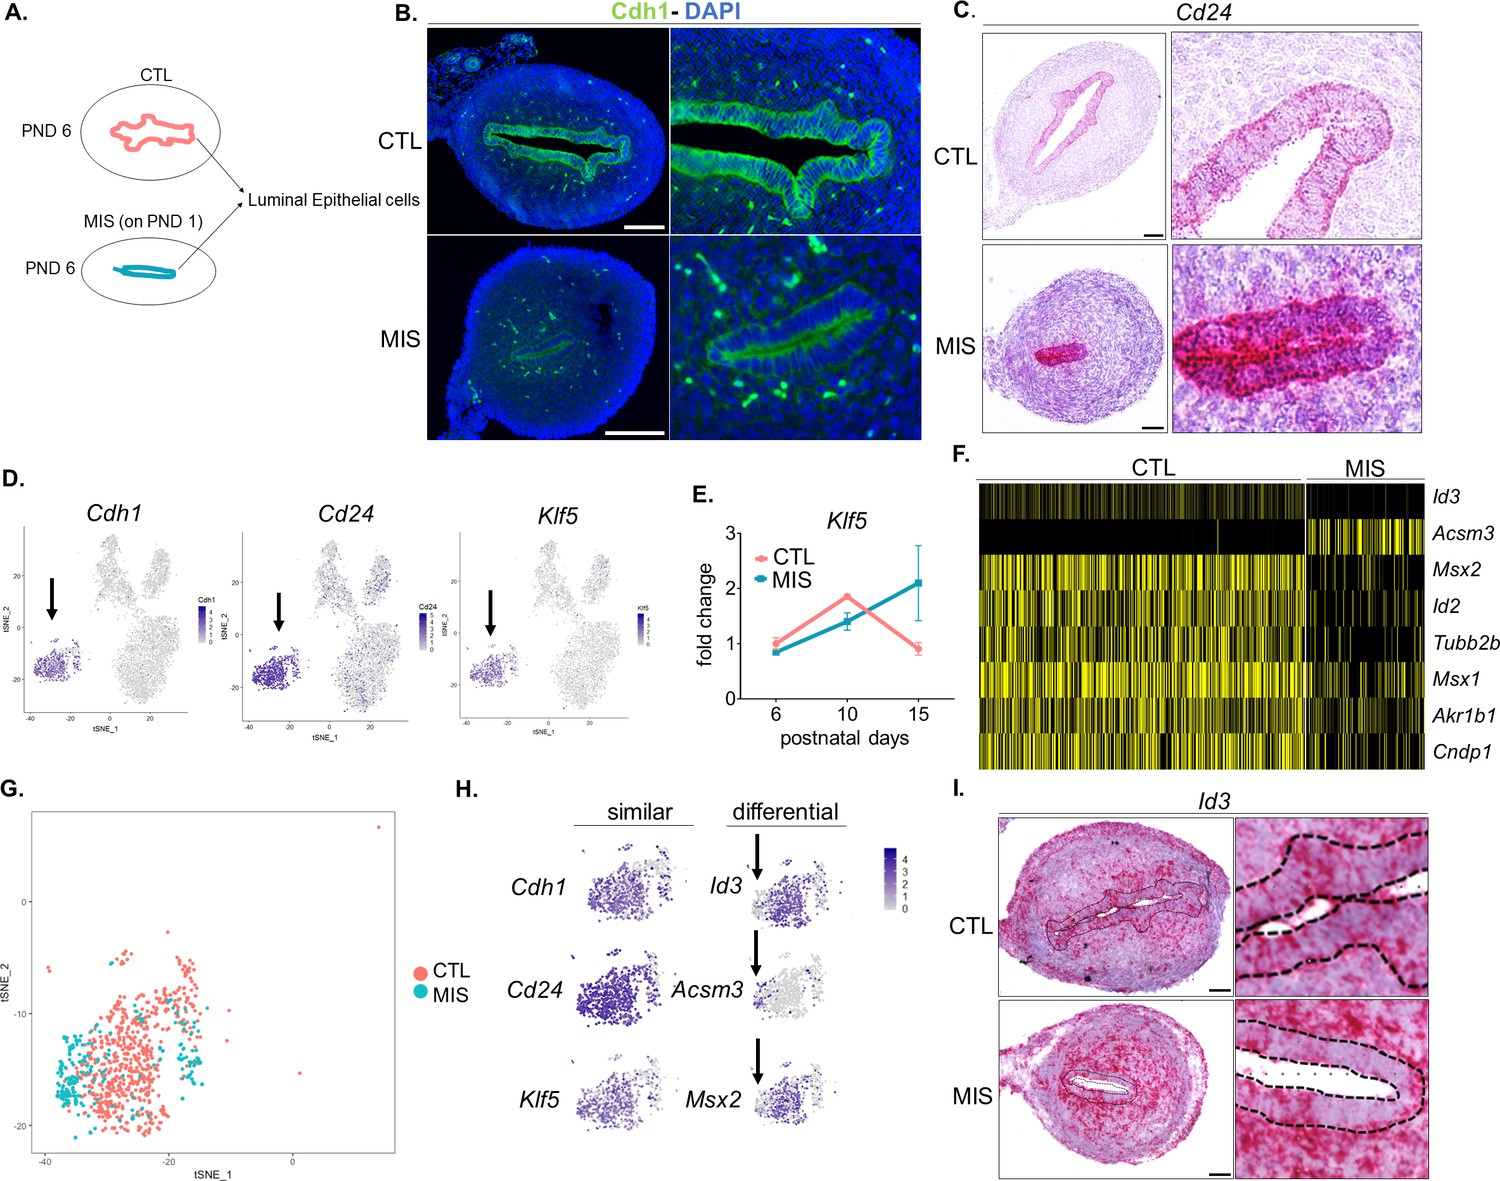
Single-cell RNA sequencing reveals the gene signature of uterine epithelial cells and a non-cell autonomous response to MIS.
Rat or mouse pups were injected with empty vector control (CTL) or with AAV9-MIS (MIS) on PND 1 and analyzed at different time points (A–D). (A) Representative schema of the CTL (orange) and MIS-treated (blue) rat uteri at PND 6. (B) Immunofluorescence of Cdh1 on control and MIS-treated mouse uteri at PND6. Scale bars = 50 µm. (C) RNAish analysis of Cd24 (one of the top epithelial markers of Table 1) in control and MIS-treated rat uteri at PND6. Scale bars = 50 µm. (D) Cdh1, Cd24, and Klf5 expression pattern in t-SNE plots. Black arrows indicate the luminal epithelial cell cluster. (E) QPCR analysis of Klf5 in control and MIS-treated tissue. CTL (orange), MIS (blue). (F) Heatmap of differentially expressed genes in CTL and MIS-treated luminal epithelium (Figure 4—source data 2). (G) T-SNE plot of unbiased clustering of uterine luminal epithelial cells (dots) color-coded by treatment with CTL (orange) and MIS (blue). Note that the CTL and MIS-treated cells have distinctive sub-clustering pattern. (H) Further analysis of the commonly (Cdh1, Cd24, and Klf5) and differentially (Id3, Acsm3, and Msx2) expressed luminal epithelial genes from the T-SNE plots. (I) Id3 expression pattern by RNAish in control and MIS-treated uteri. Dotted lines demarcate the luminal epithelium. Scale bars = 50 µm.
Figure 4—figure supplement 4
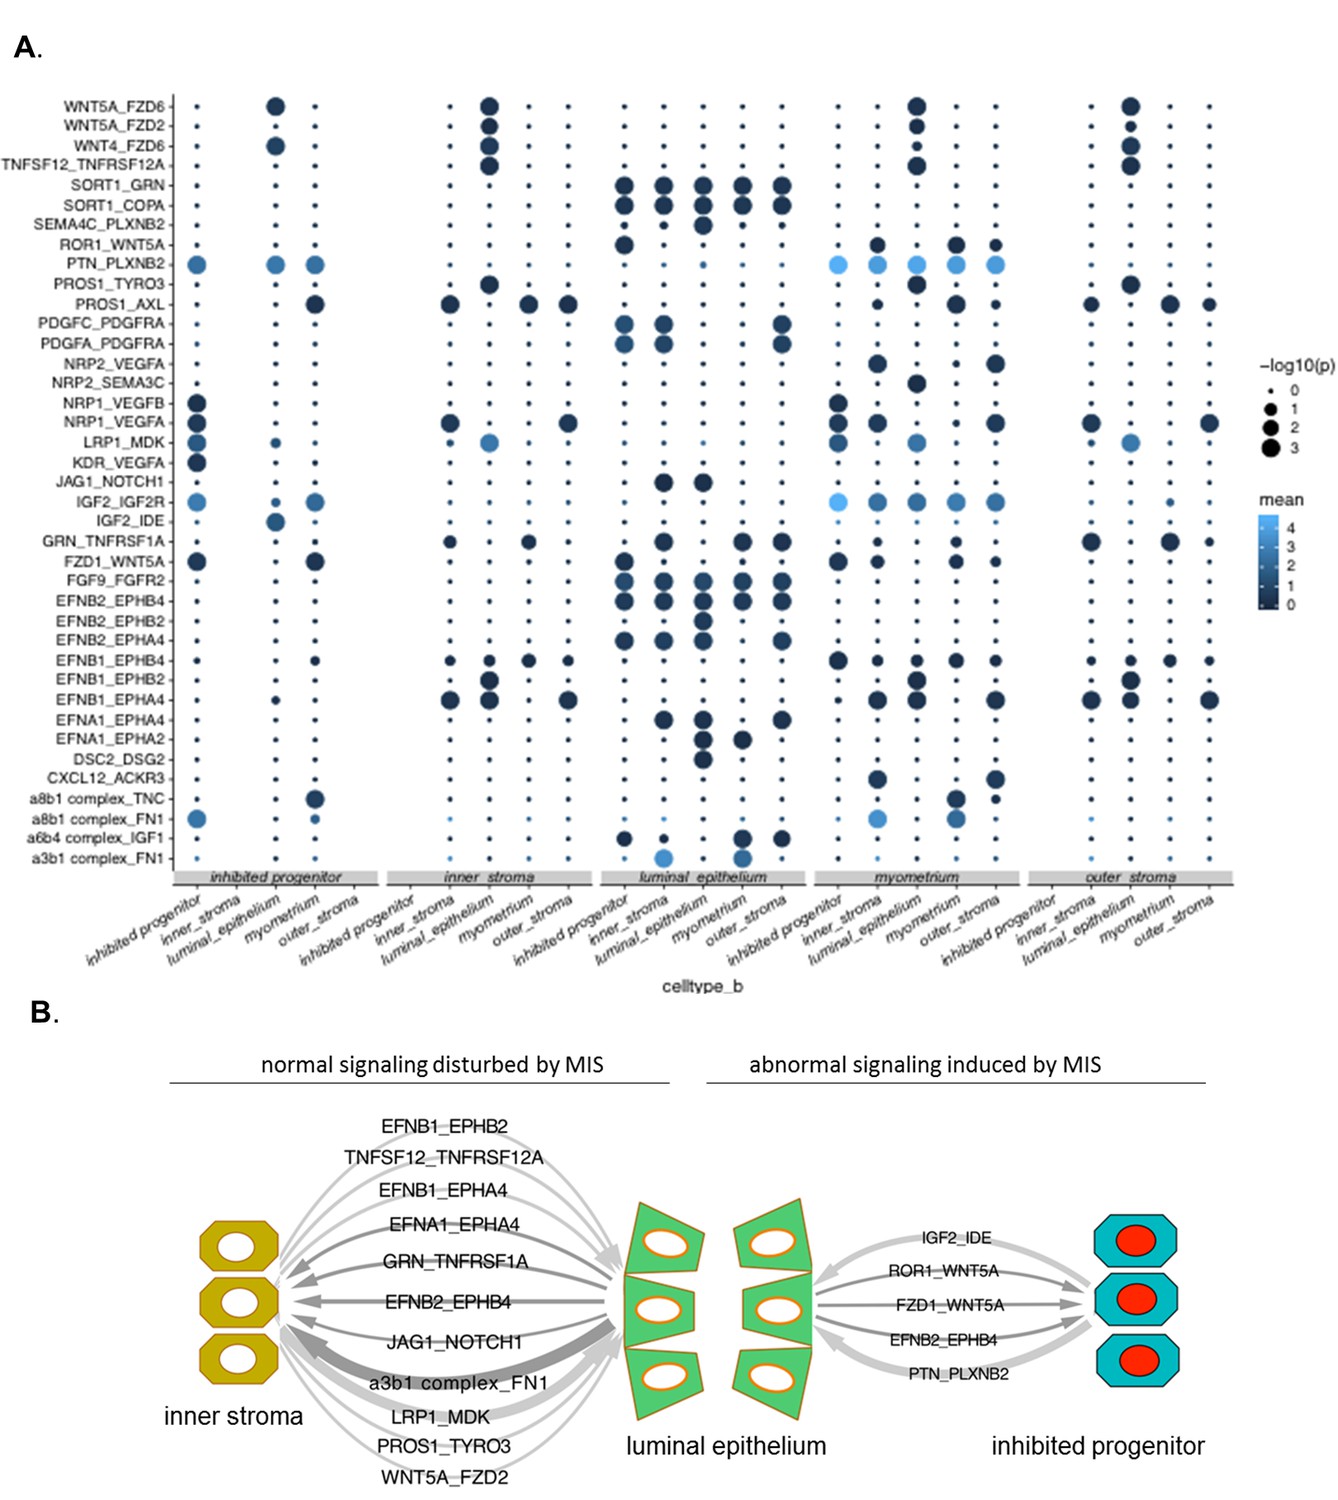
Receptor-ligand interactions in the control and MIS-treated uterine atlases.
(A) Overview of ligand–receptor interactions in the PDN6 rat uteri was generated using scRNAseq data, which was extrapolated to protein-protein interactions using the CellPhoneDB algorithm. P-values indicated by circle size (see legend on right) and average gene expression values are indicated by blue color (see legend on right) (Figure 4—source data 1).
Figure 5 with 2 supplements
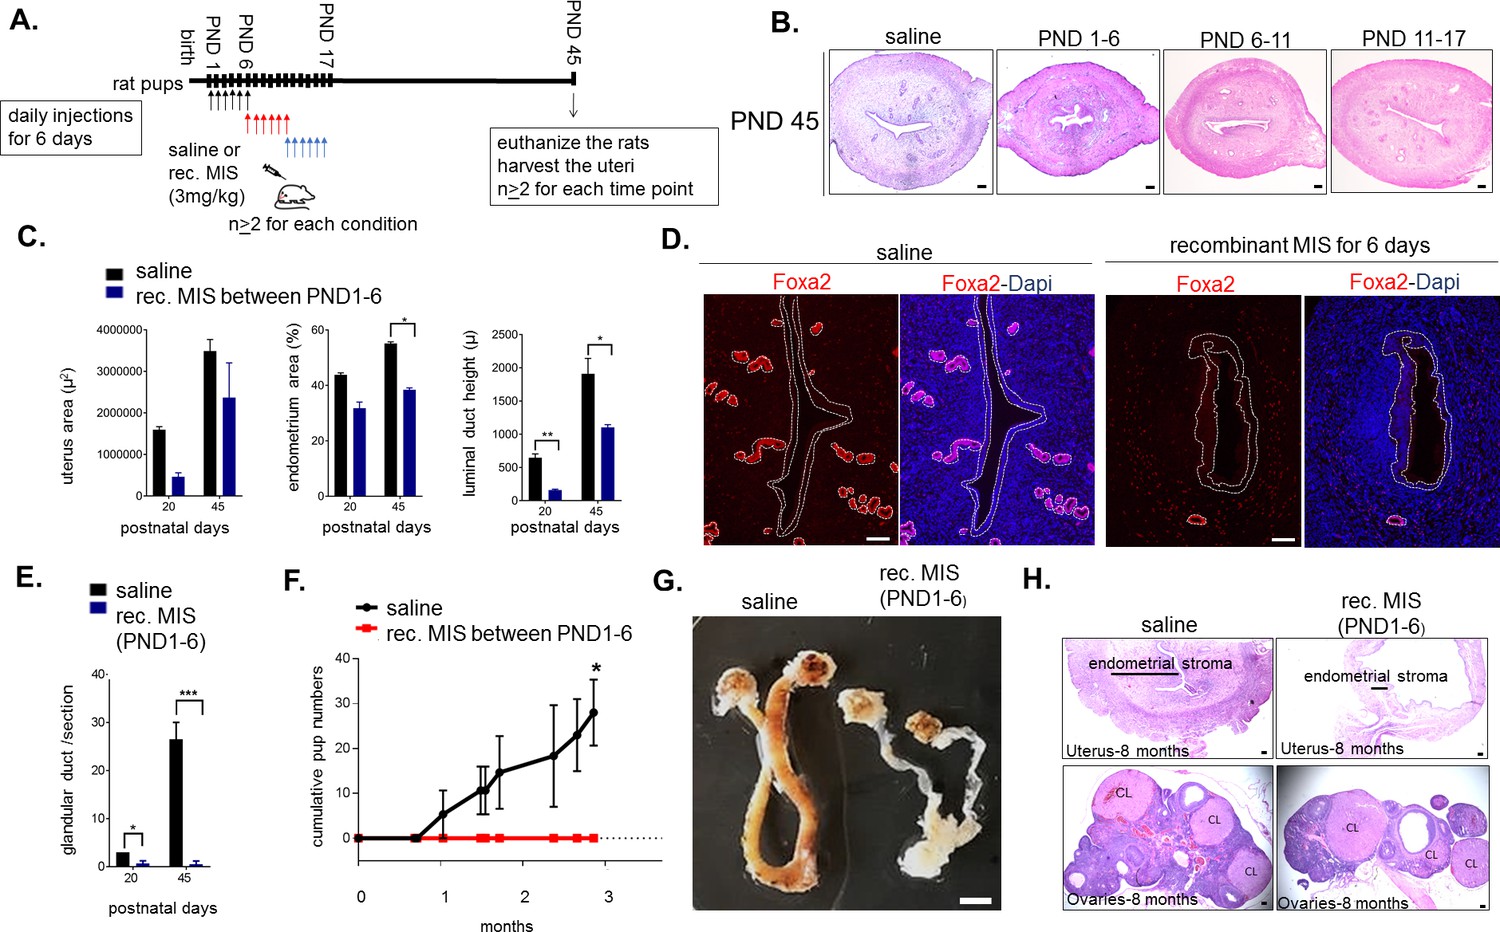
Temporary treatment with MIS during only for the first 6 days of uterine developmental is sufficient to cause complete infertility in adulthood.
(A) Rat pups were injected daily with recombinant MIS protein (3 mg/kg) (MIS), or saline control (CTL), from PND1-6, PND6-11, or PND11-17. (B) Uterine morphology was analyzed on PND45 with H and E stained transverse sections (n > 2). Scale bars are 100 µm. (C) Total uterus area, the percentage of the endometrial area, and the luminal duct height in CTL and MIS-treated (from PND1-6) were compared at PND20 and 45. (D) Foxa2 immunofluorescence (red) on CTL and MIS-treated uteri (from PND1-6) was analyzed at PND20. Scale bars = 50 µm. (for C and D: for PND20, n = 2 for control, n = 3 for MIS; for PND45, n = 2 both for control and MIS, mean ± SEM, unpaired Student’s t test * (p<0.05), ** (p<0.01)). (E) Endometrial gland counts were compared in CTL and MIS-treated uteri (from PND1-6) at PND20 and 45 from H and E sections. (F) Cumulative pups per females in 3 months continuous mating studies of the control and MIS-treated rat uteri. (n = 3 both for the control and the treated, unpaired Student’s t test mean ± SEM, * (p<0.05), *** (p<0.001)). (G) Gross morphology of the CTL and the MIS-treated (PND1-6) uteri at 8 months of age. Scale bar = 0.5 cm. (H) Uterine transverse sections (top) and ovaries (bottom) of the control and MIS-treated rats at 8 months of age. CL stands for corpus luteum. Scale bars = 100 µm.
-
Figure 5—source data 1
Data, number of replicates and p values of significance between the control and recombinant MIS-treated uterine samples for histomorphological analysis.
Related to Figure 5B and C.
- https://doi.org/10.7554/eLife.46349.028
Figure 5—figure supplement 1

Neonatal exposure to MIS causes uterine hypoplasia but does not affect sex steroid levels or ovarian function.
(A) Rat pups were treated with recombinant MIS protein daily from PND1-6 and their uteri were analyzed on PND20, showing evidence of hypoplasia and absence of endometrial glands. (B) Rat pups were treated with empty vector control (CTL) or with AAV9-MIS (MIS) on PND1. Estradiol (left) and progesterone (right) serum levels from CTL and MIS-treated rats at different developmental time points (PND3, 5, 6, 10, 15, 30) (n > 2 both for the control and treated serum). (C) Rat pups were treated with recombinant MIS protein (or vehicle control) from PND1-6, to examine gross ovarian morphology, and (D) ovarian histology from H and E sections at PND 20 and PND45. Scale bars = 50 µm.
Figure 5—figure supplement 2

Uterine hypoplasia in response to treatment with exogenous MIS does not require ovaries and is dependent on MISR2.
(A) Rat pups were gonadectomized on PND 2, and treated with empty vector (CTL) or AAV9-MIS (MIS) 6 hr after surgery. Gonadectomized (GDX) rats were sacrificed on PND 10 (n = 2 for each). (B) Representative transverse uterine section stained by H&E (left column) and Misr2 expression pattern by RNAish (right column) from GDX animals subsequently treated with CTL or MIS and analyzed at PND10. Scale bars = 100 µm. (C) Misr2cre/+ knock in cre recombinase bearing males and females were crossed to generate Misr2cre/cre mice, which are deficient in MISR2 (Misr2-/-). Mouse pups were injected with AAV9-MIS on PND 1, and euthanized on PND 20, and genotype was confirmed. (D) Transverse sections of the uteri of AAV9-MIS treated Mirs2+/-(Mirs2+/cre) heterozygous and Misr2-/- (Misr2cre/cre) homozygous mice were analyzed by H&E on PND 20. Note that the AAV9-MIS treated-Misr2-/- uteri do not present with hypoplasia. Scale bars = 100 µm.
Figure 6
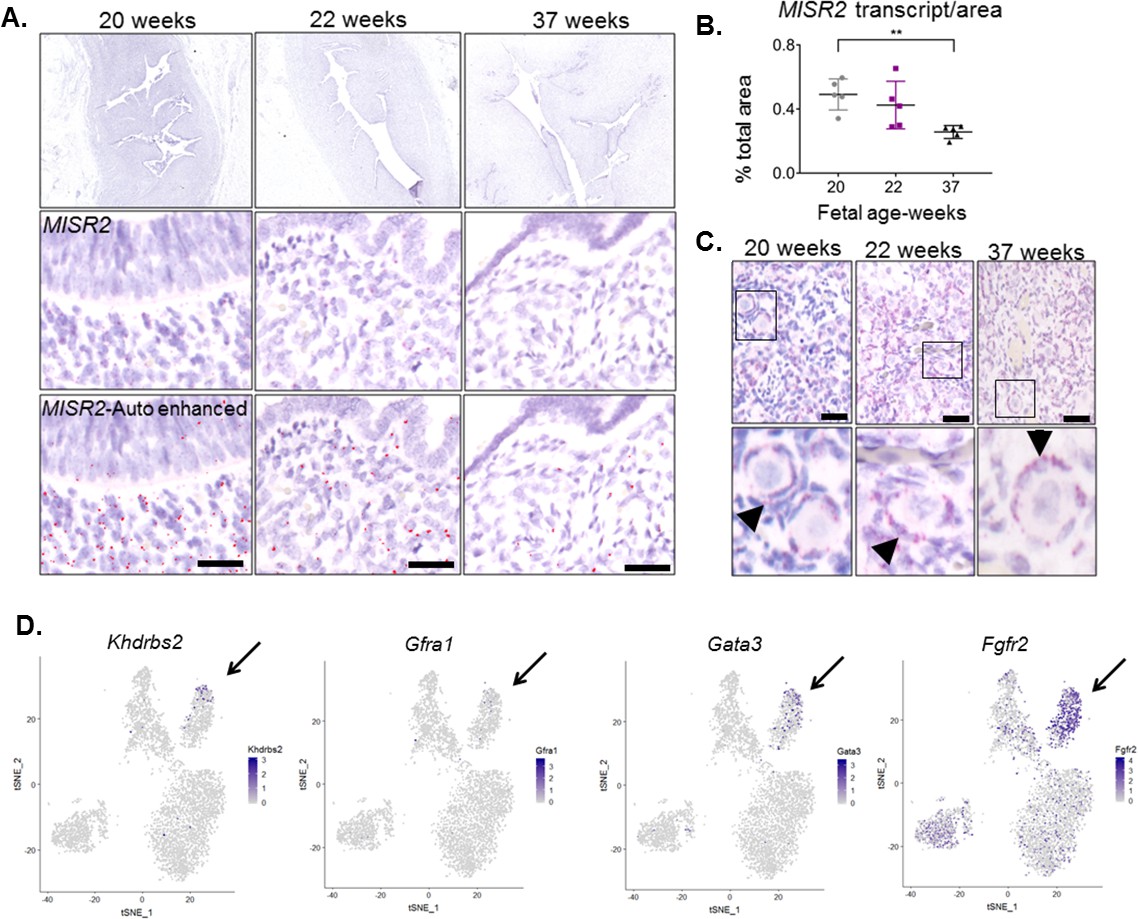
MISR2 is expressed in the subluminal mesenchymal cells of the developing human fetus, and progenitor genes may be implicated in Mullerian aplasia in humans.
(A) The MISR2 expression pattern in human fetal uteri was analyzed by RNAish in fixed tissue sections. First row consists of stitched images of human fetal uteri at embryonic weeks 20, 22, and 37 (approximately 60 images (20x objective) per developmental time point were used for stitching). Middle-row panels show a higher magnification image for each subsequent time point. Red dots (MISR2 transcripts) were quantified using the Keyence BZ-X800 analysis software. Software-enhanced red dots in the bottom-row panels show the quantified region by the automated system. Scale bars = 25 µm (B) MISR2 transcripts were quantified per cell area from five random sections of 20, 22 weeks, and 37 weeks fetal tissue. (unpaired Student t-test, five section per one sample, per time point, **(p<0.01)). (C) Adjacent human fetal ovaries were used as internal positive controls for the MISR2 RNAish analysis. Black arrowheads indicate granulosa cells from primordial follicles positive for MISR2 transcripts. Scale bars = 25 µm. (D) Candidate genes of Mullerian aplasia in humans have enriched expression in the ‘inhibited progenitor’ cluster (black arrows) from the t-SNE plots of scRNAseq in rats.
Figure 7
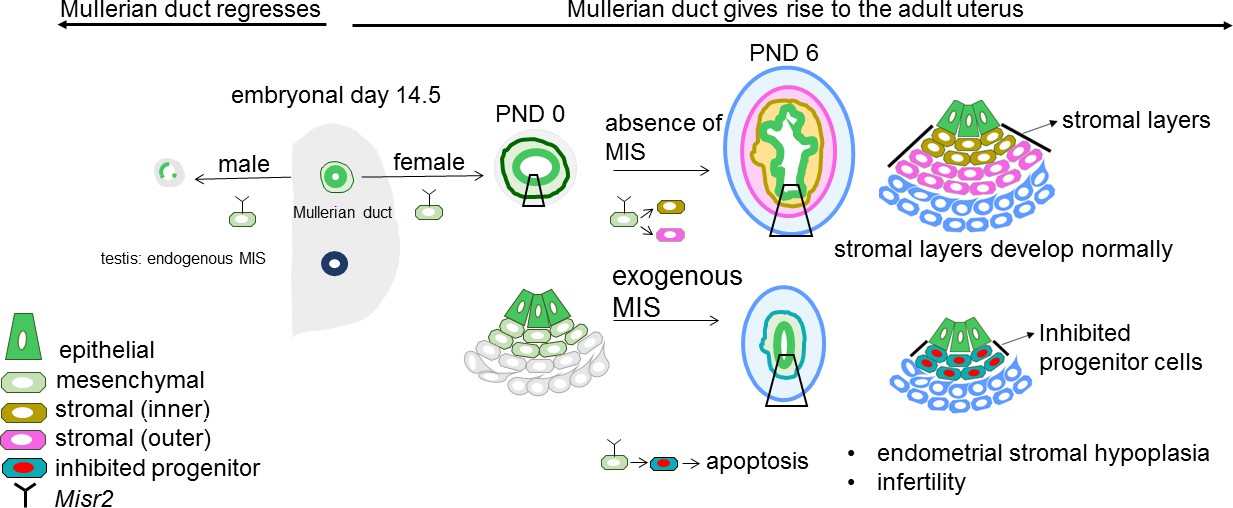
Representative schema of the Misr2+ subluminal mesenchyme development.
Mullerian inhibiting substance receptor-2 is expressed in a specific subluminal mesenchymal cell type surrounding the Mullerian duct epithelium during early fetal urogenital ridge development of both sexes. In male embryos, secretion of MIS, the ligand of Misr2, by the embryonic testes causes the Misr2+ mesenchymal cell to trigger regression of the Mullerian duct epithelium. In the female, the Misr2+ mesenchymal cells persist postnatally, and give rise to the endometrial stromal layers of the adult uterus. If females are exposed to MIS during the first week of uterus development, these subluminal progenitor cells can be reprogrammed to undergo apoptosis instead of developing into the endometrial stromal layers, resulting in uterine hypoplasia and future infertility.
Tables
Table 1
Unique gene signatures of the 14 different cell types (clusters) from the developing rat uteri on PND 6.
Gene markers revealed by single cell RNA sequencing, sorted by highest adjusted p-value with positive LogFc (Figure 3—source data 1). Clusters identities were assigned to different cell types by RNAish validation and/or manual literature review. Top 15 markers, citations, and associations are listed in the table. Selected markers were further validated in Figure 3.
| Outer stroma (1) | Myometrium (2) | Inner stroma (3) | Inhibited Progenitor (4) | Epithelium (5) | Proliferating cells (6) | Vascular endothelium (7) | Dividing epithelium (8) | Mesothelium (9) | Myeloid (10) | Erythroid (11) | Pericyte (12) | Lymphatic endothelium (13) | Neuronal (14) |
|---|---|---|---|---|---|---|---|---|---|---|---|---|---|
| RGD1305645 | Lum | Nrgn | AC109891.2 | Cd24 ** | Hmgb2 | Cd93 * | Epcam * (Litvinov et al., 1997) | Bsg | Fcer1g * | Hba.a1 * | Mgp * | Ccl21 | Plp1 * |
| Smoc2 * (Mucenski et al., 2019) | Postn | Cpxm2 ** | Rn60_1_221 6.1 | Epcam * (Litvinov et al., 1997) | Stmn1 * | Cdh5 ** (Bhasin et al., 2010) | Cldn3 | Upk1b * | Tyrobp * | Hba.a2 * | Mcam ** (Barron et al., 2016) | Mmrn1 ** | Sox10 * (Nonaka et al., 2008) |
| Dpt * | NEWGENE_ 621351 | Tgfbi * | AABR070687 05.1 | Wfdc2 * (Mucenski et al., 2019) | Top2a * (Whitfield et al., 2006) | RGD1310587 | Cd24 * | Msln ** (Chang and Pastan, 1996) | Csf1r ** (MacDonald et al., 2010) | LOC1036948 57 | Rergl * | Lyve1** (Hirakawa et al., 2003) | Gfra3 * |
| Cpe | Col1a1 | Plac8 | Fgfr2 | Wnt7a * (Miller and Sassoon, 1998) | Mki67 * (Whitfield et al., 2006) | Emcn * | Cdh1 * | Fmod | Lyz2 * | Hbb * | Eln * | Flt4 ** (Hirakawa et al., 2003) | Abca8a |
| Vcan * | Ptn * (Mucenski et al., 2019) | Vcan * | Unc5b * (Mullen et al., 2018) | Cldn3 | Tubb5 * | Tie1 * | Klf5 | Cav1 | Ftl1 | LOC1036948 55 | Col4a1 * | Cldn5 * | Egfl8 |
| Dcn * | Thbs2 ** | Fn1 * | Ugt1a2 | Krt8 * | LOC1003595 39 | Plvap | Krt8 * | Dpp4 * | Cybb * | Alas2 * (Kaneko et al., 2014) | Igfbp7 * | Fgl2 * | Cdh19 |
| Col4a5 * | Col3a1 | Apcdd1 | Bambi ** (Mullen et al., 2018) | Cdh1 * | Racgap1 | Cav1 | Mt1 | Anxa3 | Laptm5 * | Ybx3 * | Cspg4 ** | Klhl4 * | Afap1l2 |
| Apoe | Ogn (Mucenski et al., 2019) | Cdh11 * | Srgn | Tacstd2 | LOC1003603 16 | Adgrl4 | Wnt7a * (Miller and Sassoon, 1998) | Igfbp6 | Tmsb4x | Hba.a3 * | Abcc9 * | Cdh5 * | L1cam * |
| Osr2 | Sparc | Col6a3 * | Kcnk3 | Cldn4 * | Prc1 * | Plxnd1 | Mt2A | Cfb | Ctsb * | Alox15 | Epas1 | Tbx1 | Col5a3 |
| Tnfrsf21 | Cxcl12 | Tnfrsf21 | Igfbp5 | Msx1 | Cdk1 * | Epas1 * | Msx1 | Lox | Lcp1 * | Car2 | Rgs5 | Slc45a3 | Olfml2a |
| Adamts7 | Igfbp5 | Nkd2 | Igf2r | Klf5 | Depdc1 | Esam * | Wfdc2 | Muc16 * | Ptprc * | Ahsp * | Foxs1 * | Adgrg3 | Metrn |
| Slc26a7 | Ccdc80 | Axin2 | Plac8 | Elf3 * | Smc2 | Cyyr1 | Dlx5 | Itm2a | C1qa * | Rbm38 | Myl9 | Sdpr | Mpz * |
| Wfikkn2 ** | Gpc3 | Vim * | Prrx2 | Dlx5 | Kif11 * | Clec14a | Sbspon | Sema3c | C1qc * | Lgals5 | RGD1564664 | LOC1009120 34 | Plekha4 |
| Col6a3 * | Igsf10 | Col6a2 * | Alpl | Aldh2 | Cenpf * | Adgrf5 | Hmgb2 ** (Stros et al., 2009) | Fbln2 * | Aif1 * | Slc4a1 | Acta2 * | Rn50_1_043 5.2 | Dbi |
| Islr | Itm2a * | AABR070253 16.1 | Mt2 | Tmpo * | Col3a1 | Tacstd2 | Eln | Cxcl2 | Slc25a39 | Cald1 * | Il2rg | Col20a1 | |
| * extracellular matrix, collagen or cytoskeleton related **validated new marker (in uterus) | * muscle related **validated new marker (in uterus) | *extracellular matrix, collagen or cytoskeleton related **validated new marker (in uterus) | *implicated during Mullerian duct regression in males ** validated new marker (in uterus) | *epithelium associated **validated new marker (in uterus) | *cell cycle or proliferation associated | *endothelial related **implicated higher expression in vascular tissues | *epithelium associated **cell proliferation associated | *mesothelium associated or enriched **mesothelium specific | * myeloid associated (Zilionis et al., 2019) **myeloid specific | *hemoglobin associated | * fibroblast associated **pericyte marker | *endothelial related ** lymphatic endothelium associated | *neuronal related (Zeisel et al., 2018) |
Key resources table
| Reagent type (species) or resource | Designation | Source or reference | Identifiers | Additional information |
|---|---|---|---|---|
| Genetic reagent (M. muculus) | B6;129S7-Amhr2tm3(cre)Bhr/Mmnc | PMID: 12368913 | RRID_MGI:3042214 | Dr. Richard R Behringer, MD Anderson Cancer Center |
| Genetic reagent (M. muculus) | C57BL/6-Tg(UBC-GFP)30Scha/J | Jackson Laboratory | stock #004353 | Hongkui Zeng, Allen Institute for Brain Science |
| Genetic reagent (M. muculus) | FVB/NCrl | Charles River | #207 | |
| Genetic reagent (Rat) | Sprague Dawley | Envigo | ||
| Peptide, recombinant protein | LR-MIS | (Pépin et al., 2013) | ||
| Recombinant DNA reagent | AAV9-LRMIS | (Pépin et al., 2015) | ||
| Antibody | Smooth muscle alpha action (SMA) (Rabbit polyclonal) | Abcam | #5694 | (1:300), IF |
| Antibody | Vimentin (rabbit monoclonal) | Abcam | #92547 | (1:300), IF |
| Antibody | Foxa2 (rabbit polyclonal) | LifeSpan Biosciences | #138006 | (1:500), IF |
| Antibody | Cleaved caspase-3 (rabbit polyclonal) | Cell signaling | #9661S | (1:200), IF; (1:500) IHC |
| Antibody | E-cadherin (Cdh1) (rat monoclonal) | Invitrogen | #13–1900 | (1:200), IF |
| Antibody | Alexa flour 488 donkey anti rat IgG | Invitrogen | #A21208 | (1:500) |
| Antibody | Alexa flour 555 donkey anti rabbit IgG | Invitrogen | #A31572 | (1:500) |
| Antibody | Alexa flour 568 anti rabbit IgG | Invitrogen | #A10042 | (1:500) |
| Commercial assay or kit | RNA scope 2.5 HD red detection kit | ACD bio | #322360 | |
| Commercial assay or kit | the target retrieval and protease plus reagents | ACD bio | #322330 | |
| Commercial assay or kit | MIS commercial ELISA | Beckmen | #A73818 | |
| Commercial assay or kit | REDExtract-N-Amp Tissue PCR Kit | Sigma | #SLBT8193 | |
| Other | Bambi (M. muculus) (NM_026505.2) | ACD bio | #523071 | commercial probe |
| Other | Bmp7 (M. muculus) (NM_007557.3) | ACD bio | #407901 | commercial probe |
| Other | CD24a (M. muculus) (NM_009846.2) | ACD bio | # 432691 | commercial probe |
| Other | Cpxm2 (M. muculus) (NM_018867.5) | ACD bio | # 559759 | commercial probe |
| Other | Enpp2 (M. muculus) (NM_001136077.1) | ACD bio | # 402441 | commercial probe |
| Other | Hdac4 (M. muculus) (NM_207225.1) | ACD bio | # 416591 | commercial probe |
| Other | Misr2 (Amhr2) (M. muculus) (NM_144547.2) | ACD bio | # 489821 | commercial probe |
| Other | Misr2 (Amhr2) (Rat) (NM_030998.1) | ACD bio | # 517791 | commercial probe |
| Other | Misr2 (Amhr2) (Human) (NM_020547.2) | ACD bio | # 490241 | commercial probe |
| Other | Msx2 (M. muculus) (NM_013601.2) | ACD bio | # 421851 | commercial probe |
| Other | Myh 11 (M. muculus) (NM_001161775.1) | ACD bio | # 316101 | commercial probe |
| Other | Smad6 (M. muculus and Rat) (NM_001109002.2) | ACD bio | # 517781 | commercial probe |
| Other | Thbs2 (M. muculus) (NM_011581.3) | ACD bio | # 492681 | commercial probe |
| Other | Wfikkn2 (M. muculus) | ACD bio | # 531321 | commercial probe |
| Software, algoritm | R | R Project for Statistical Computing | https://scicrunch.org/resolver/SCR_001905 | |
| Software, algoritm | BZ-X800 analysis software | Keyence | https://www.keyence.com/landing/microscope/lp_fluorescence.jsp | |
| Software, algoritm | GraphPad Prism, version 7 | Graphpah |
Additional files
-
Transparent reporting form
- https://doi.org/10.7554/eLife.46349.031
Download links
A two-part list of links to download the article, or parts of the article, in various formats.
Downloads (link to download the article as PDF)
Open citations (links to open the citations from this article in various online reference manager services)
Cite this article (links to download the citations from this article in formats compatible with various reference manager tools)
Single-cell sequencing of neonatal uterus reveals an Misr2+ endometrial progenitor indispensable for fertility
eLife 8:e46349.
https://doi.org/10.7554/eLife.46349


