Voluntary and involuntary contributions to perceptually guided saccadic choices resolved with millisecond precision
- Wake Forest School of Medicine, United States
Figures
Figure 1
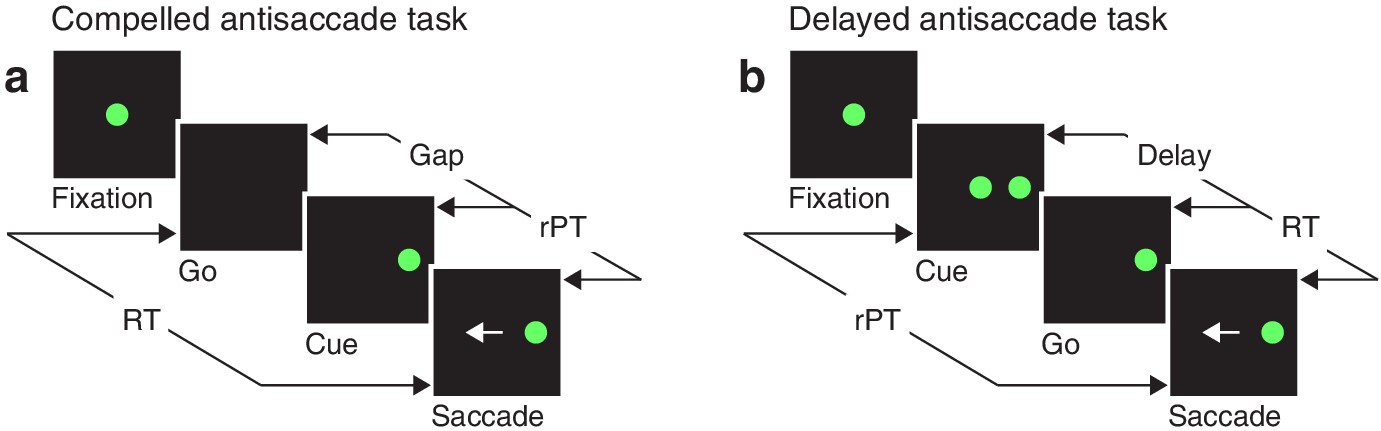
Urgent and non-urgent variants of the antisaccade task.
(a) The compelled antisaccade task. After a fixation period (150, 250, or 350 ms), the central fixation point disappears (Go), instructing the participant to make an eye movement to the left or to the right (±10°) within 450 ms. The cue is revealed (Cue) after a time gap that varies unpredictably across trials (Gap, 0–350 ms). The correct response is an eye movement (Saccade, white arrow) away from the cue, to the diametrically opposite, or anti, location. (b) The delayed antisaccade task. In this case, the cue is shown before the go signal, during fixation. The interval between cue onset and fixation offset varies across trials (Delay, 100 or 200 ms). In all trials, the reaction time (RT) is measured between the onset of the go signal and the onset of the saccade, whereas the raw processing time (rPT) is measured between cue onset and saccade onset.
Figure 2 with 1 supplement
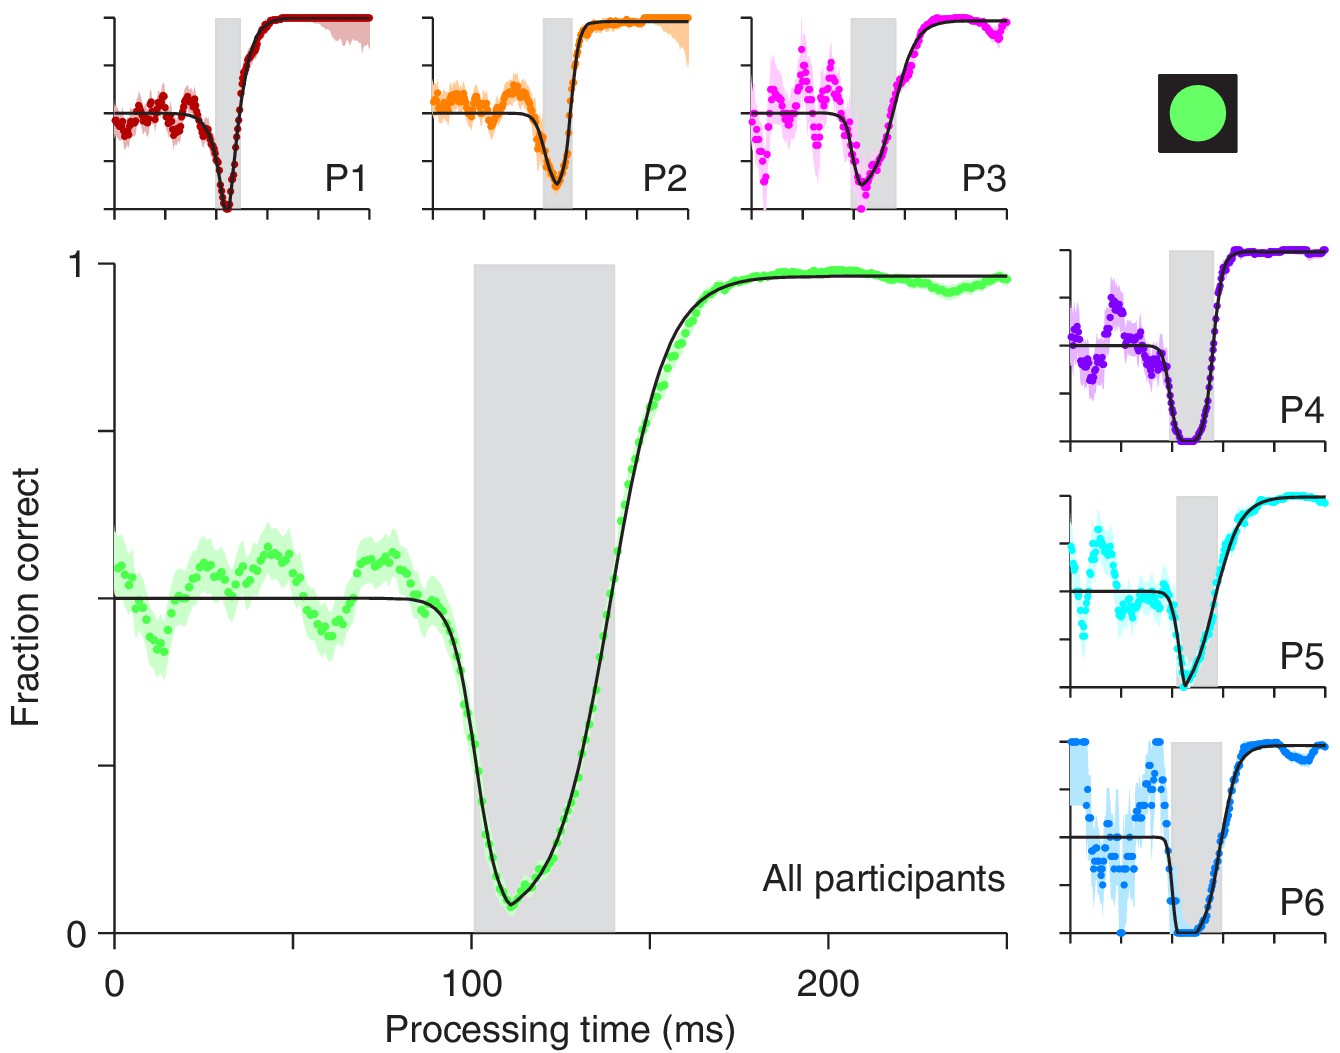
Perceptual performance in the compelled antisaccade task demonstrates a vortex.
Each panel shows a tachometric curve, that is, a plot of the probability of making a correct response as a function of rPT, or cue-viewing time. Colored points are experimental results in overlapping time bins (bin width = 15 ms); light shades indicate ± 1 SE from binomial statistics; black lines are continuous, analytical functions fitted to the data. The vortex is the part of the curve for which saccades are highly likely to be captured and performance drops below chance. It is demarcated by gray shades for individual participants (small panels, P1 – P6) and for the aggregate data set (large panel, All participants). Results are from trials (between 1366 and 1534 per participant) in which the high-luminance cue (icon) was shown.
Figure 2—figure supplement 1
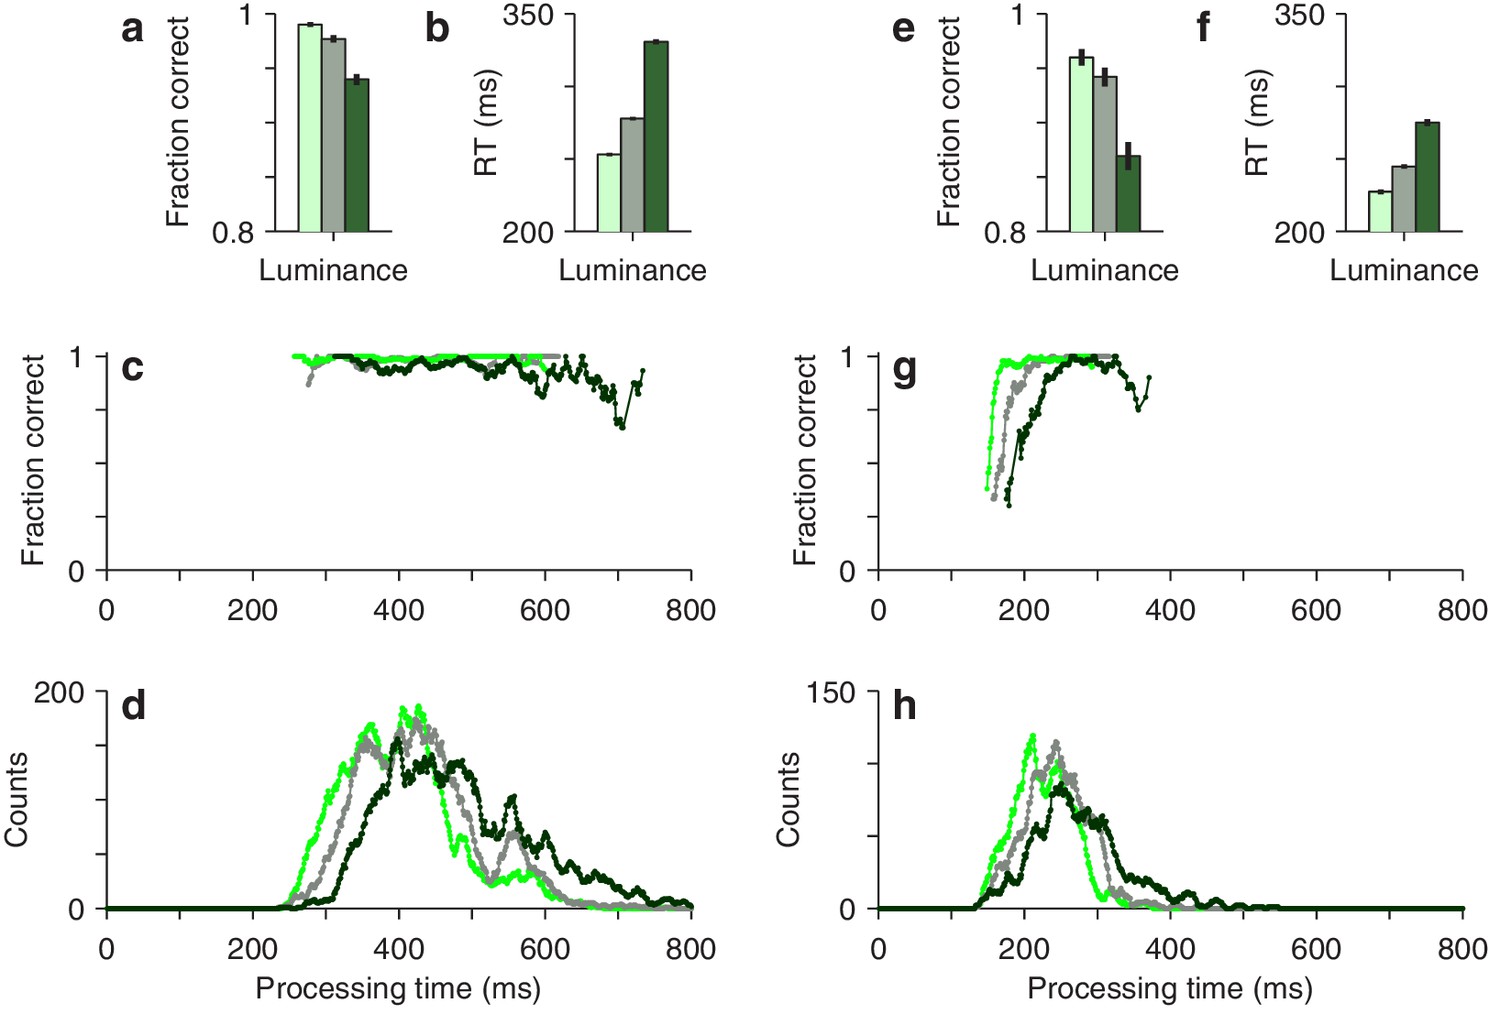
Performance in non-urgent antisaccade trials.
All data are pooled across participants and sorted by luminance level, high (bright green), medium (grayish green), and low (dark green). Results are shown separately for easy trials (left side), in which the delay between cue and go onset was 100 or 200 ms, and zero-gap trials (right side), in which cue and go onset were simultaneous. (a) Mean fraction correct in easy trials (± 1 SE, from binomial proportion). (b) Mean RT in easy trials (± 1 SE across trials). (c) Tachometric curves from easy trials. (d) Processing time distributions in easy trials. Both correct and incorrect responses are included. (e–h) As in (a–d) except for zero-gap trials. In easy trials, essentially all rPTs correspond to asymptotic performance. In zero-gap trials, the late rise in the tachometric curve becomes partially observable, but the majority of rPTs still correspond to asymptotic performance.
Figure 3
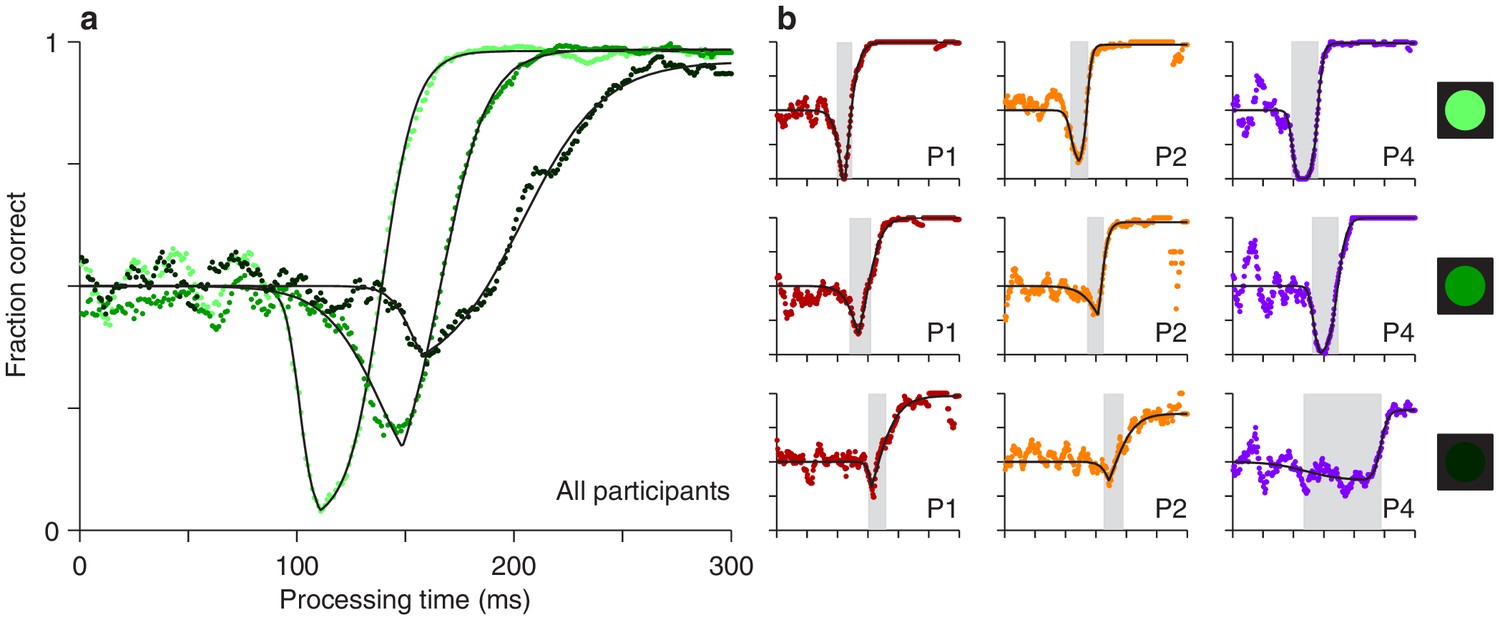
Perceptual performance varies as a function of cue luminance.
(a) Tachometric curves for trials in which the cue had high, medium, and low luminance (indicated by bright, grayish, and dark green points, respectively). Results are for the pooled data from all participants. The vortex shifts to the right and becomes less deep as luminance decreases. (b) Tachometric curves from three individual participants at each cue luminance level, high, medium and low, as indicated by the icons. Gray shades demarcate the vortex of each curve. In each panel, colored points are experimental results and black lines are continuous fits to the data.
Figure 4 with 2 supplements

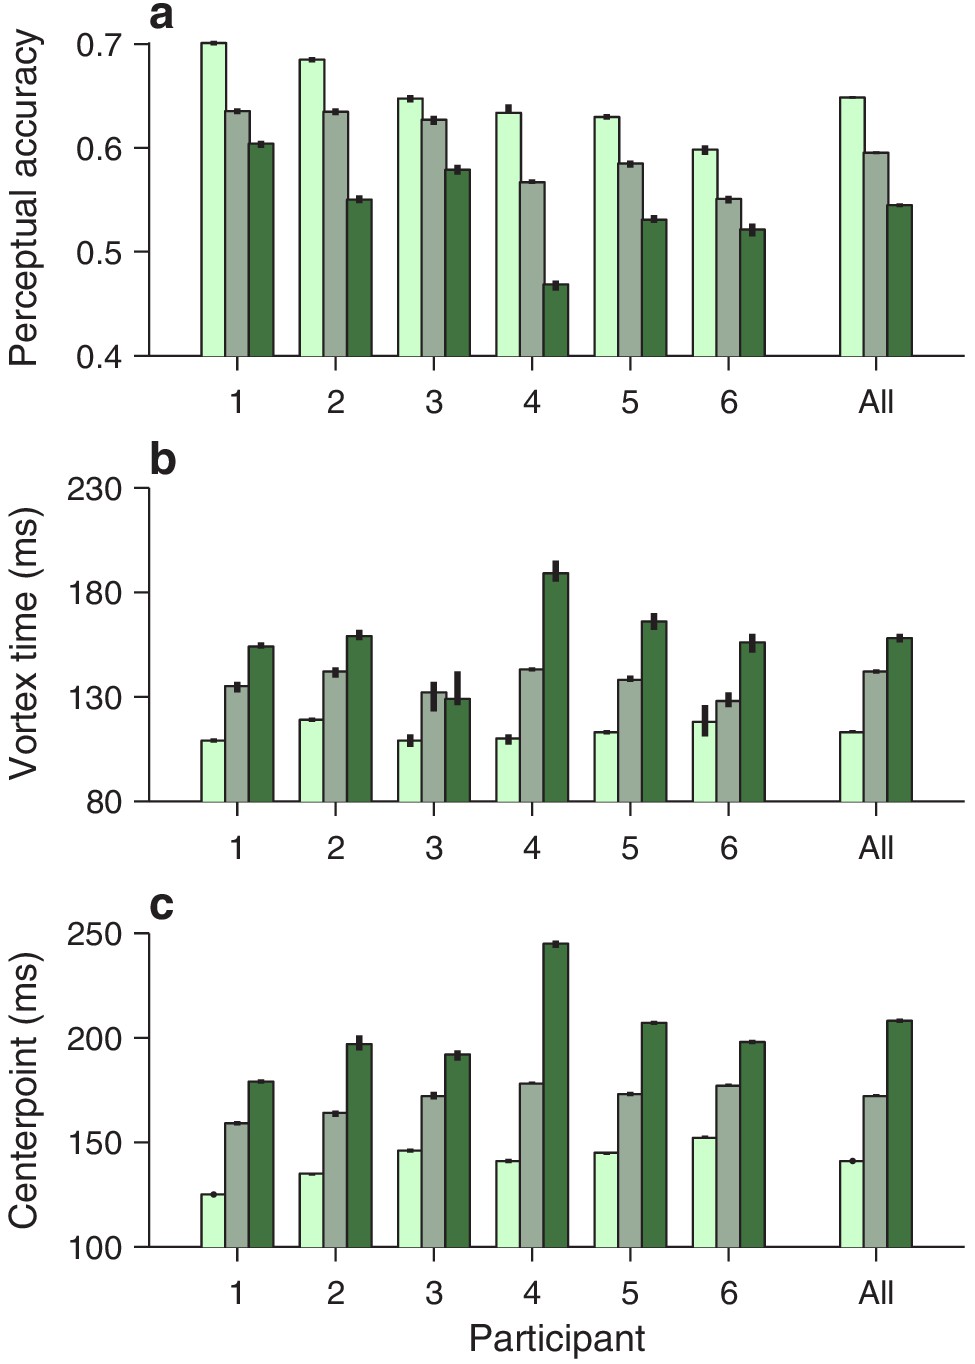
Perceptual performance quantified across participants and luminance conditions.
Each panel shows one particular quantity derived from the fitted tachometric curves, with results sorted by participant (x axes) and luminance level, high (bright green), medium (grayish green), and low (dark green). Error bars indicate 95% confidence intervals obtained by bootstrapping. (a) Mean perceptual accuracy, calculated as the average value of the fitted tachometric curve for rPTs between 0 and 250 ms. (b) Vortex time, calculated as the rPT at which the minimum of the fitted tachometric curve is found. (c) Endogenous response centerpoint, equal to the rPT at which the rise of the fitted tachometric curve is halfway between its minimum and maximum values.
Figure 4—figure supplement 1
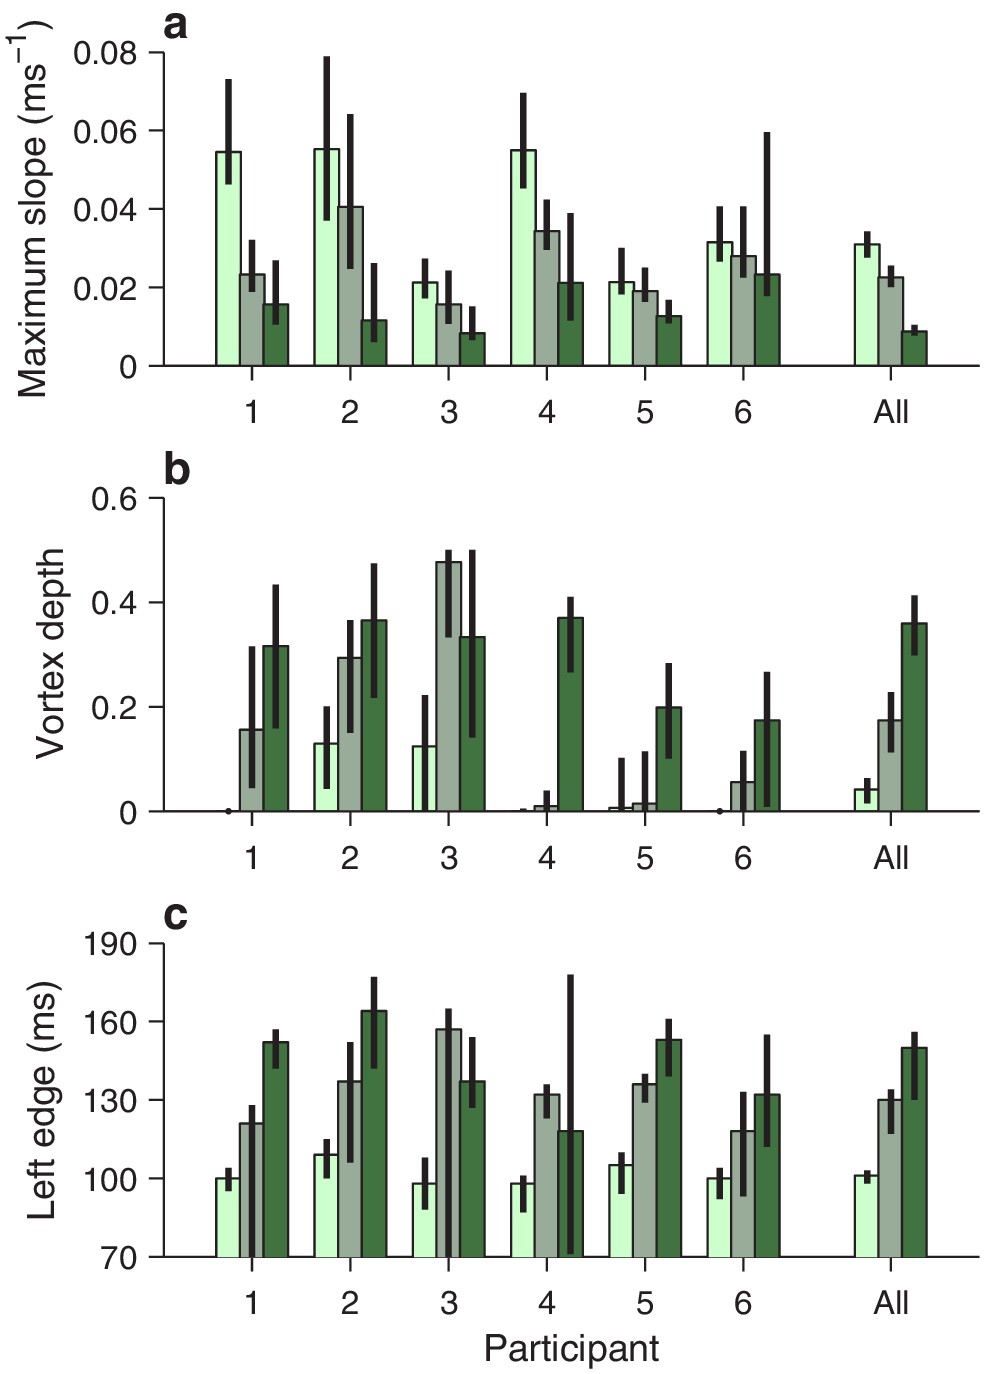
Additional quantities that characterize perceptual performance across participants and cue conditions.
Each panel shows one particular feature derived from the fitted tachometric curves, with results sorted by participant (x axes) and luminance level, high (bright green), medium (grayish green), and low (dark green). Error bars indicate 95% confidence intervals obtained by bootstrapping. Same format as in Figure 4. (a) Maximum slope attained during the rising phase of the tachometric curve. (b) Vortex depth, equal to the minimum fraction correct. Note that, for participants 1, 4, and 6, the depth is zero for the high-luminance cue. (c) Left edge of the vortex, equal to the rPT at which the dip of the tachometric curve is halfway between chance (0.5) and its minimum value. Although these metrics are somewhat noisier than those shown in Figure 4, the effects of luminance are again highly consistent across participants, albeit with significant quantitative differences.
Figure 4—figure supplement 2
Simulated perceptual performance quantified in the same way as the experimental data.
Results were obtained with the exact same analyses as those in Figure 4 (Materials and methods), except that they were based on simulated trials. The model data were generated using the best-fitting model parameters for each individual participant. Same format as in Figure 4.
Figure 5 with 4 supplements
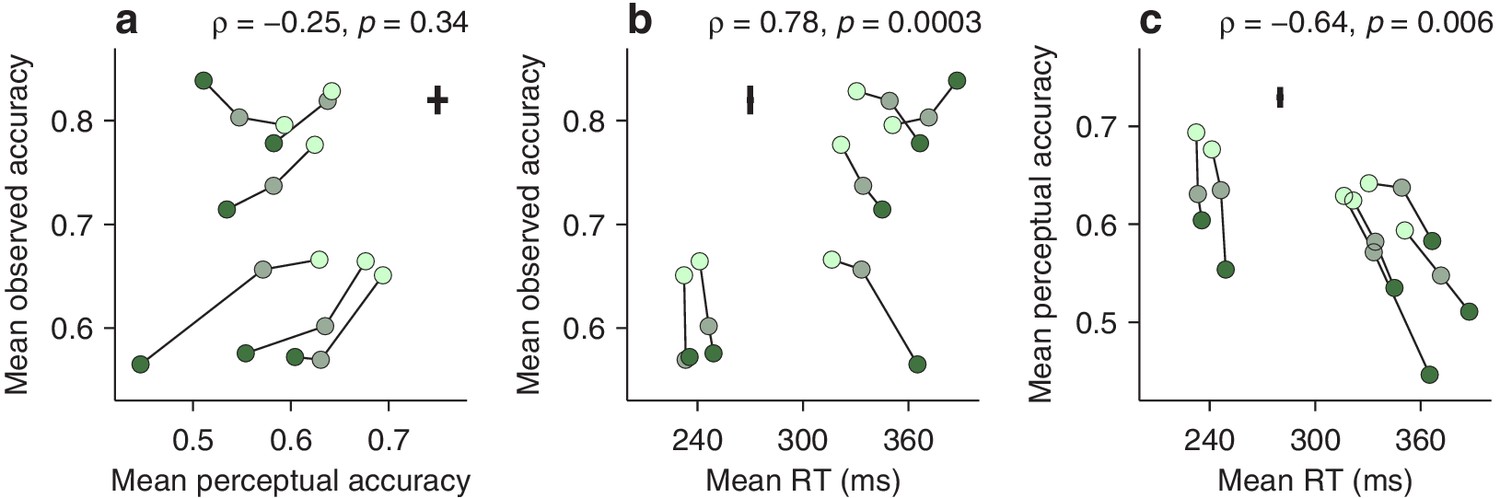
Dissociation between perceptual capacity and overall task performance.
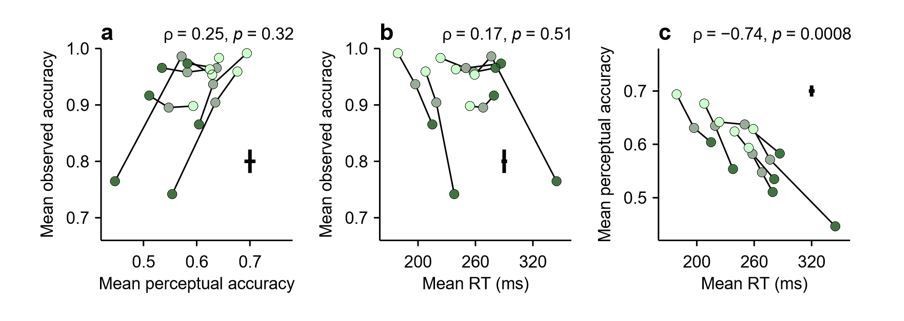
In each panel, the data from each participant (joined by lines) are shown for trials of high, medium, and low luminance cues (bright, grayish, and dark green points, respectively). Crosses indicate the typical (median) uncertainty (2 SEs) associated with the measurement in each direction. Partial Spearman correlations between values on the x and y axes are indicated, along with significance (Materials and methods). The partial correlation eliminates the association due exclusively to luminance. (a) Mean observed accuracy versus mean perceptual accuracy. (b) Mean observed accuracy versus mean RT. Average RT data include both correct and incorrect trials. (c) Mean perceptual accuracy versus mean RT.
Figure 5—figure supplement 1
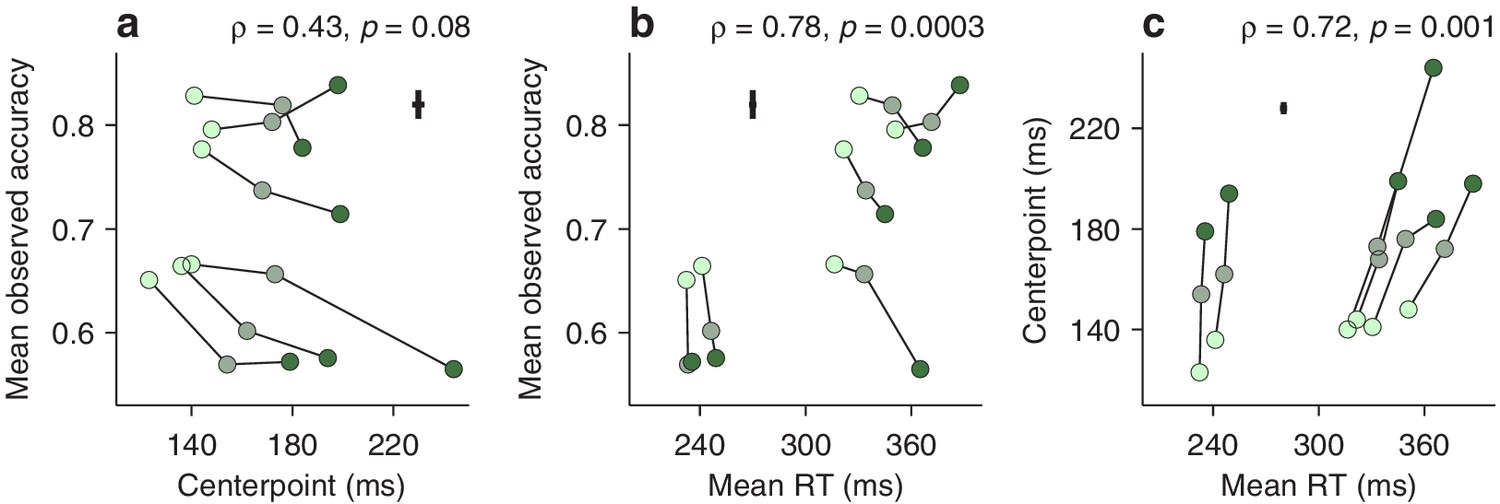
Dissociation between perceptual capacity and overall task performance based on the curve centerpoint.
Same format as in Figure 5, except that the endogenous response centerpoint is plotted instead of the mean perceptual accuracy. (a) Mean observed accuracy as a function of the centerpoint. (b) Mean observed accuracy as a function of mean RT. (c) Centerpoint as a function of mean RT. The centerpoint relates to the mean observed accuracy and the mean RT (this figure) in nearly identical ways as the mean perceptual accuracy (Figure 5), if one takes into account that a lower centerpoint corresponds to better perceptual performance.
Figure 5—figure supplement 2
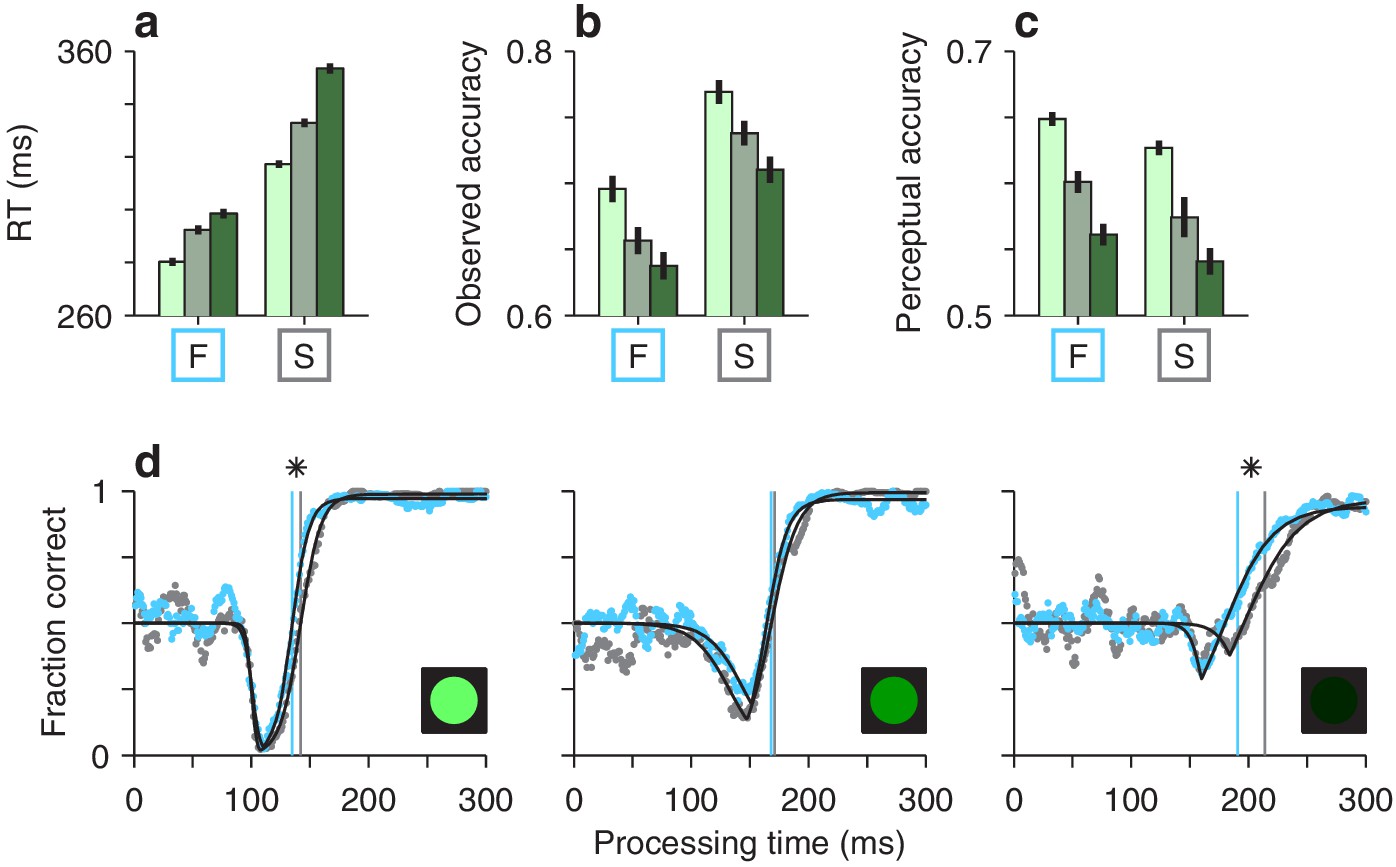
Decoupling perceptual and motor performance.
All results are based on data aggregated across participants. Each panel compares results in fast (F) versus slow (S) blocks of trials, which were sorted as follows. First, the 30 blocks of trials performed by each participant were ranked, post hoc, according to mean RT. Then the 10 blocks at the top and the 10 at the bottom were designated as the fast and slow blocks, respectively. Finally, the fast and slow blocks were separately pooled across participants to yield two corresponding groups of trials. (a) Mean RT (± 1 SE) in compelled antisaccade trials. Bar colors, bright, grayish, and dark green, correspond to cue luminance, high, medium, and low, respectively. (b) Mean observed accuracy, equal to the measured fraction of correct responses (± 1 SE from binomial proportion), in compelled antisaccade trials. Note that, for a given luminance, the observed accuracy was higher in the slow than in the fast blocks. (c) Mean perceptual accuracy, equal to the mean value of the fitted tachometric curve over the 0–250 ms rPT range (± 1 SE from bootstrap). Note that perceptual accuracy was slightly lower in the slow than in the fast blocks. (d) Tachometric curves for fast (cyan dots) and slow blocks (gray dots). Each panel shows data for a specific cue luminance level, as indicated by the icons. Vertical lines mark the centerpoints of the fitted curves. In the high- and low-luminance cases, the blue curve is slightly shifted to the left relative to the gray (asterisks indicate p < 0.0005 for the difference in centerpoints, from bootstrap). This implies slightly better perceptual performance in the fast than in the slow blocks.
Figure 5—figure supplement 3

Dissociation between perceptual capacity and overall task performance as seen with the accelerated race-to-threshold model.
Results were obtained in the exact same way as those in Figure 5, except that they were based on simulated trials. The model data were generated using the best-fitting model parameters for each individual participant. Same format as in Figure 5.
Figure 5—figure supplement 4
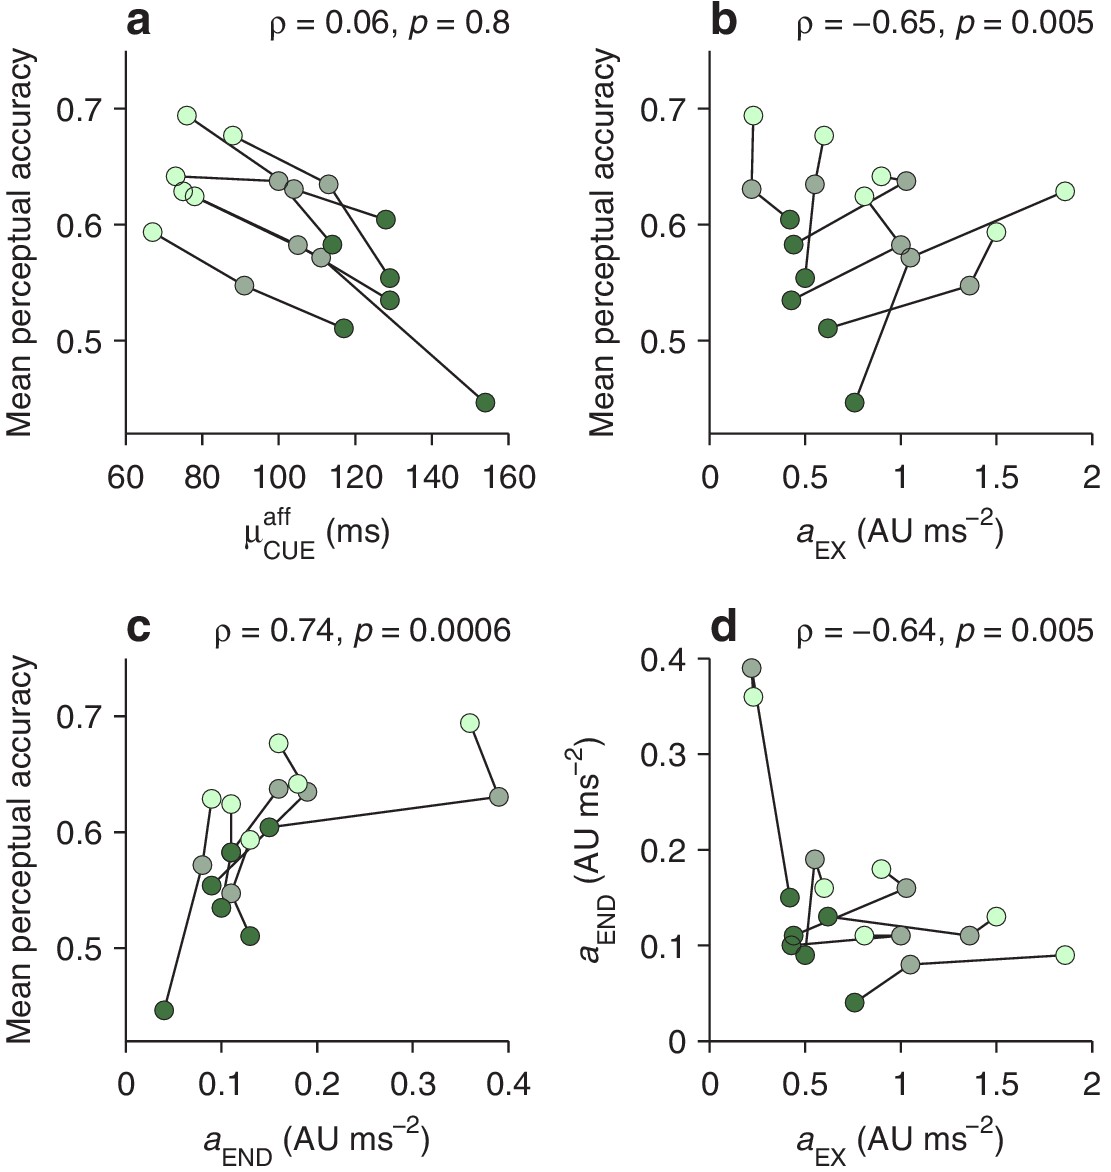
Model parameters that characterize individual perceptual performance.
In each panel, the data from each participant (joined by lines) are shown for trials of high, medium, and low luminance cues (bright, grayish, and dark green points, respectively). Parameter values are as listed in Supplementary file 1. Partial Spearman correlations between values on the x and y axes are indicated, along with significance (Materials and methods). The partial correlation eliminates the association due to luminance. (a) Mean perceptual accuracy as a function of the mean afferent delay of the cue (parameter , or mean cue latency). There seems to be a strong, negative association, but it is all due to mutual dependencies on luminance; within each luminance level, cue latency does not predict perceptual accuracy. This is an example of Simpson’s paradox, a statistical effect whereby a trend between two variables disappears or reverses when the data are conditioned on a third variable. (b) Mean perceptual accuracy as a function of the exogenous acceleration (parameter ). (c) Mean perceptual accuracy as a function of the endogenous acceleration (parameter ). (d) Correlation between endogenous and exogenous acceleration. The negative relationship indicates that participants whose attention is captured strongly by the cue also tend to endogenously shift their visuospatial attention more slowly. Other model parameters showed weaker relationships to perceptual accuracy.
Figure 6

Three representative single trials of the race-to-threshold model.
Traces show motor plans toward the left (red) and toward the right (black) as functions of time. Because in these examples the cue is assumed to be on the left, these variables also correspond to motor plans toward the cue (red) and the anti location (black), respectively. After the exogenous response interval (ERI, pink shade), the former (incorrect) plan decelerates and the latter (correct) plan accelerates. A saccade is triggered a short efferent delay after activity reaches threshold (dashed lines). (a) A correct, long-rPT trial; that is, an informed choice (RT = 369 ms, rPT = 219 ms). (b) An incorrect trial with rPT within the vortex; that is, a captured saccade (RT = 283 ms, rPT = 133 ms). (c) A correct, short-rPT trial; that is, a correct guess (RT = 206 ms, rPT = 56 ms). In all examples, the gap is 150 ms. The influence of the cue depends on its timing relative to the ongoing motor activity.
Figure 7
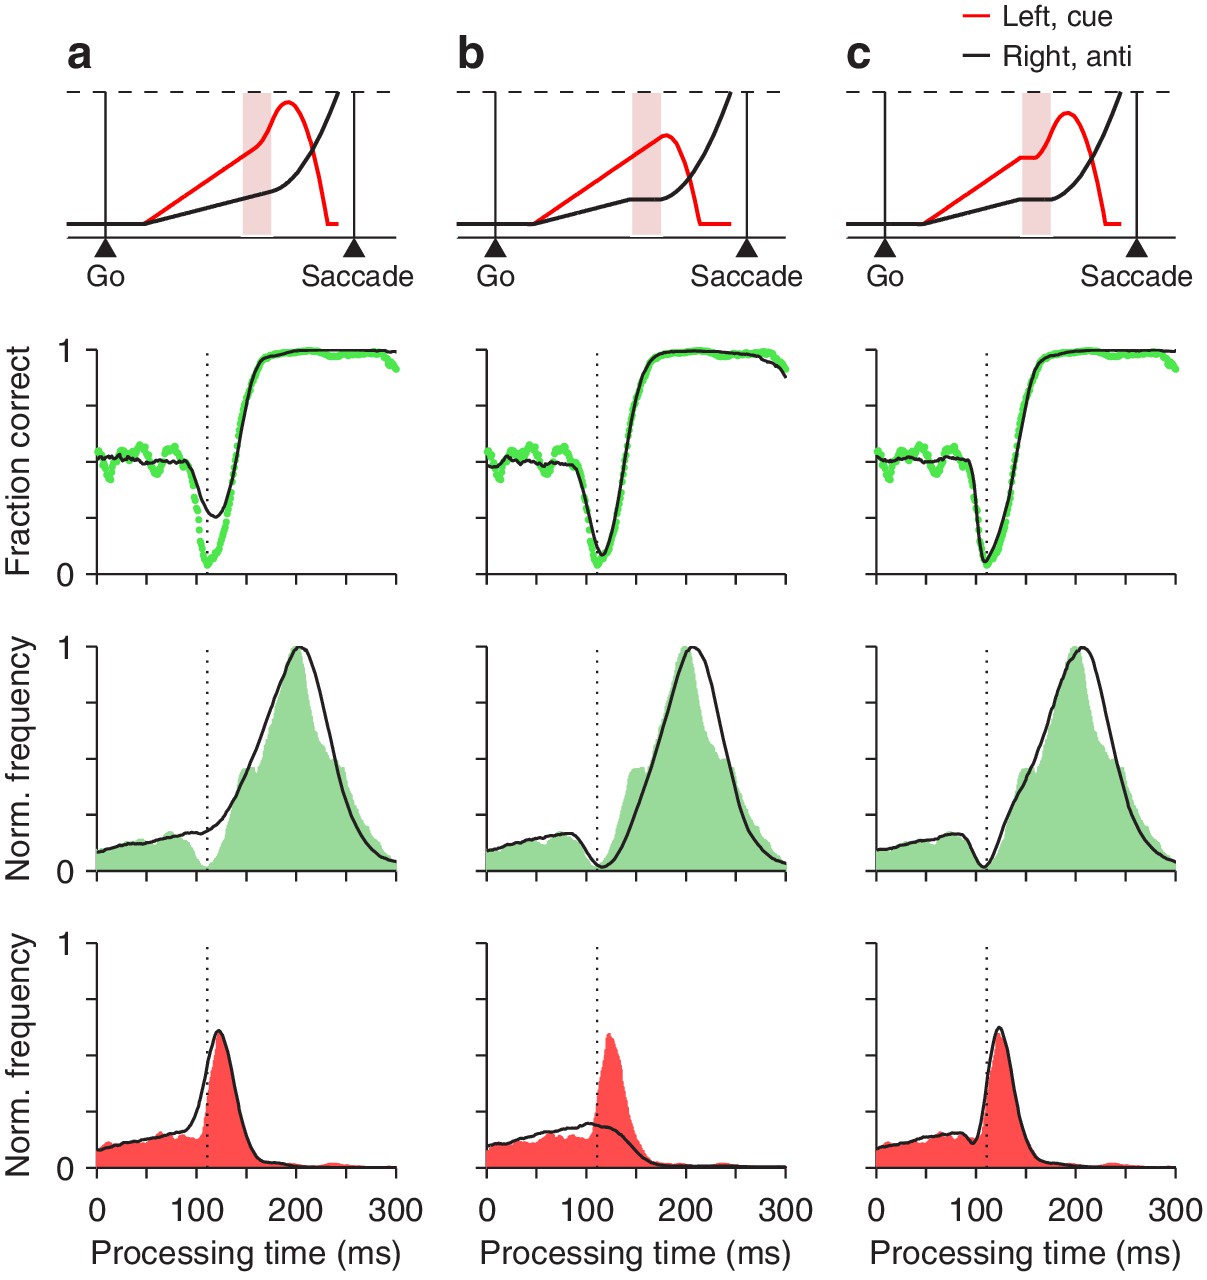
Contributions of two distinct neural mechanisms to attentional/oculomotor capture.
Top row: representative single, long-rPT trials from the model. Second row: tachometric curves, simulated (black traces) and experimental (green dots). Third row: rPT distributions for correct trials (), simulated (black traces) and experimental (green shades). Bottom row: rPT distributions for incorrect trials (), simulated (black traces) and experimental (red shades). (a) Results from a restricted version of the model in which, during the ERI, the motor plan toward the cue accelerates but the plan toward the anti location keeps advancing, unperturbed. (b) Results from another restricted version of the model in which, during the ERI, the motor plan toward the anti location halts but that toward the cue keeps advancing, unperturbed. (c) Results from the full-blown model, in which, during the ERI, the cue plan accelerates and the anti plan halts. For each model variant, results were obtained with the parameter values that minimized the error between the model and the pooled experimental data in the high luminance condition (Materials and methods).
Figure 8 with 3 supplements
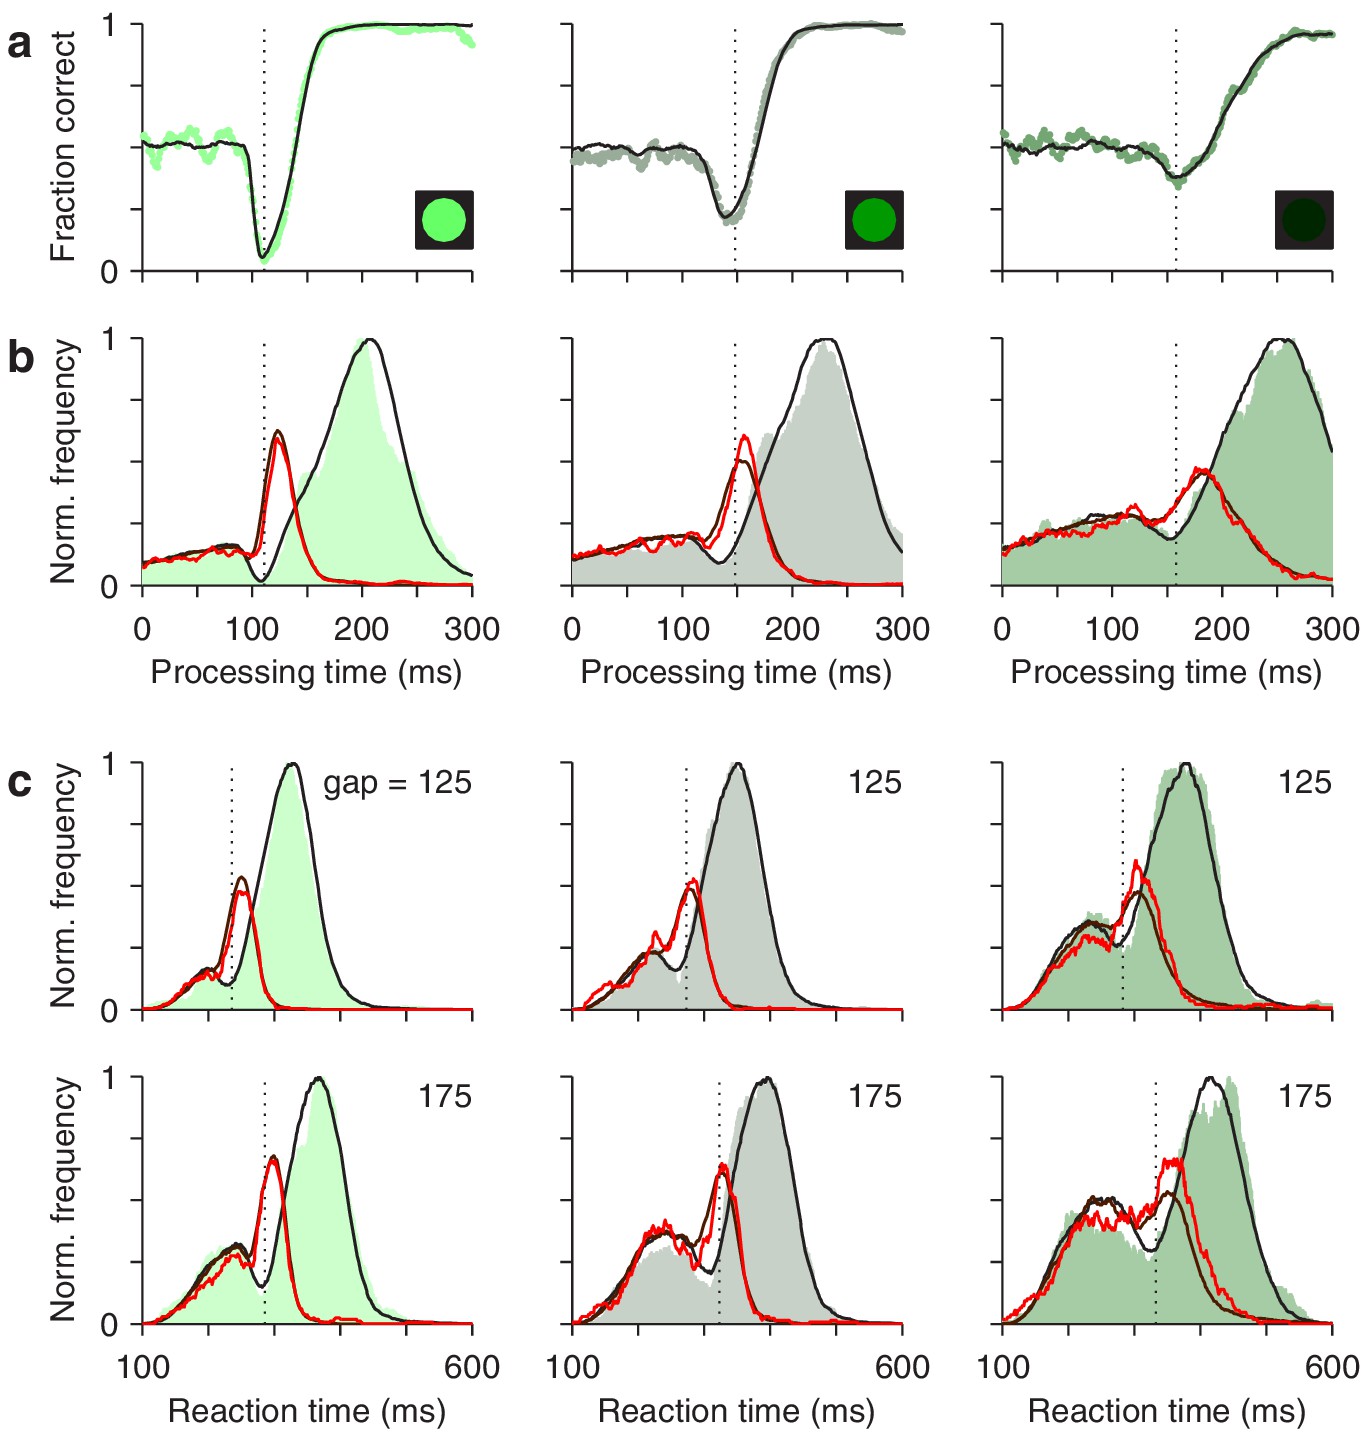
The race-to-threshold model accounts for antisaccade performance.
(a) Tachometric curves for high (left), medium (middle), and low (right) luminance cues. Continuous lines are model results. (b) Processing time distributions for correct (shades) and incorrect trials (red traces) at each luminance level. Overlaid traces (black and dark red) are corresponding model results. (c) RT distributions for correct (shades) and incorrect trials (red traces) at individual gap values (125 and 175 ms) for each luminance level. Overlaid traces (black and dark red) are model results. Dotted vertical lines mark the rPT at which the vortex reaches its minimum point (vortex time). All empirical data are pooled across participants.
Figure 8—figure supplement 1
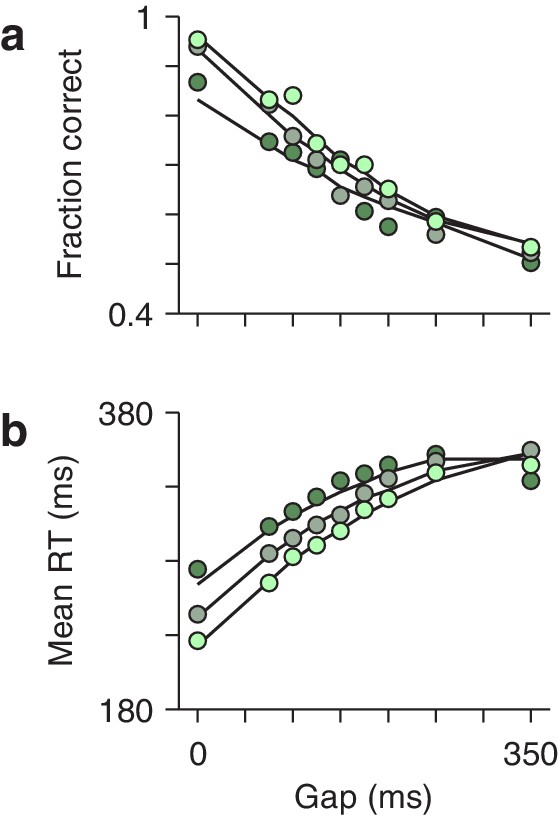
The race-to-threshold model reproduces average performance in individual gap conditions.
(a) Mean fraction of correct choices as a function of gap. Circles are experimental results for high (bright green), medium (grayish green), and low luminance (dark green) conditions; continuous lines are model results. (b) Mean RT as a function of gap. Same conventions as above. All experimental points represent data pooled across participants.
Figure 8—figure supplement 2
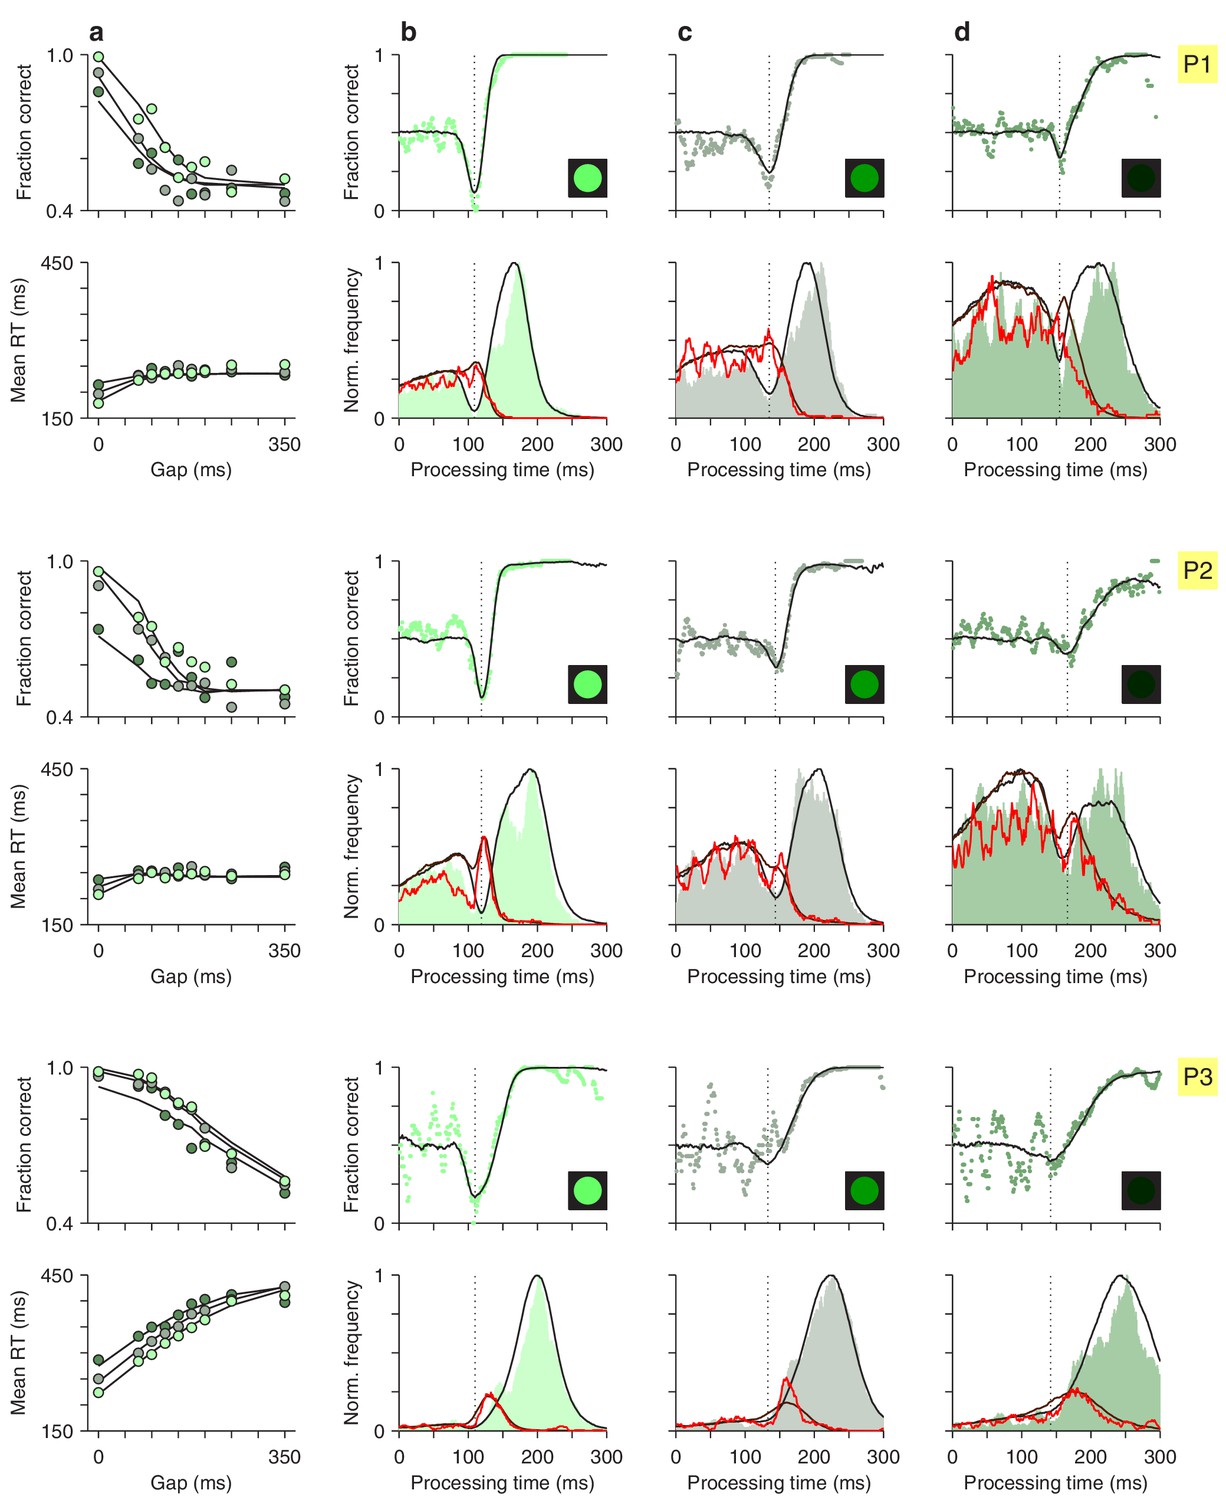
The accelerated race-to-threshold model individually fitted to the data of participants 1 (top two rows), 2 (middle rows), and 3 (bottom two rows), as indicated on the right.
(a) Mean fraction of correct choices (top) and mean RT (bottom) as functions of gap. Circles are experimental results for high (bright green), medium (grayish green), and low luminance (dark green) conditions. Continuous lines are model results. (b–d), Tachometric curves for high (b), medium (c), and low luminance cues (d) are shown in the top panels. Corresponding rPT distributions for correct (shades) and incorrect trials (red traces) are shown in the bottom panels. Black and dark-red continuous lines are model results. For each luminance, the dotted vertical line marks the vortex time.
Figure 8—figure supplement 3

The accelerated race-to-threshold model individually fitted to the data of participants 4 (top two rows), 5 (middle rows), and 6 (bottom two rows).
Same format as in Figure 8—figure supplement 2.
Author response image 1
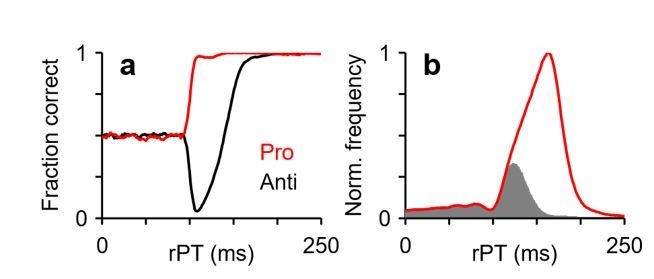
Predictions for an experiment in which urgent prosaccades and antisaccades are interleaved.
All results are from model simulations.
Author response image 2
Same format as in Figure 5 of the main text, except that the mean observed accuracy and the mean RT were computed using zero-gap trials only.
Perceptual accuracy values are the same as in Figure 5.
Tables
Table 1
Parameters of the race-to-threshold model for the pooled data.
Build-up rates are in AU ms-1, times are in ms, and acceleration and deceleration are in AU ms-2.
| Lum | |||||||||||||||
|---|---|---|---|---|---|---|---|---|---|---|---|---|---|---|---|
| High | 1.4 | 3.74 | −0.95 | 51 | 36 | 76 | 5 | 24 | 4 | 0 | 10 | 0.96 | −0.7 | 0.17 | 0.02 |
| Medium | 1.4 | 3.74 | −0.95 | 51 | 36 | 104 | 13 | 24 | 3 | 0 | 14 | 1.15 | −0.54 | 0.17 | 0.02 |
| Low | 1.4 | 3.74 | −0.95 | 51 | 36 | 126 | 19 | 24 | 10 | 0 | 14 | 0.58 | −0.29 | 0.14 | 0.1 |
Additional files
-
Source code 1
Matlab scripts and functions (.m) for running the accelerated race-to-threshold model as described in the article.
It includes an example of the model output, a license agreement, and detailed instructions (README file).
- https://doi.org/10.7554/eLife.46359.022
-
Source data 1
Psychophysical data analyzed in this article.
- https://doi.org/10.7554/eLife.46359.023
-
Supplementary file 1
Parameters of the race-to-threshold model for individual participants.
- https://doi.org/10.7554/eLife.46359.024
-
Transparent reporting form
- https://doi.org/10.7554/eLife.46359.025
Download links
A two-part list of links to download the article, or parts of the article, in various formats.
Downloads (link to download the article as PDF)
Open citations (links to open the citations from this article in various online reference manager services)
Cite this article (links to download the citations from this article in formats compatible with various reference manager tools)
Voluntary and involuntary contributions to perceptually guided saccadic choices resolved with millisecond precision
eLife 8:e46359.
https://doi.org/10.7554/eLife.46359


