Improved characterisation of MRSA transmission using within-host bacterial sequence diversity
- University of Oxford, United Kingdom
- University of St Andrews, United Kingdom
- Sunpasitthiprasong Hospital, Thailand
- Mahidol University, Thailand
- University of Bath, United Kingdom
- University of Cambridge, United Kingdom
- Cambridge University Hospitals NHS Foundation, United Kingdom
Figures
Figure 1
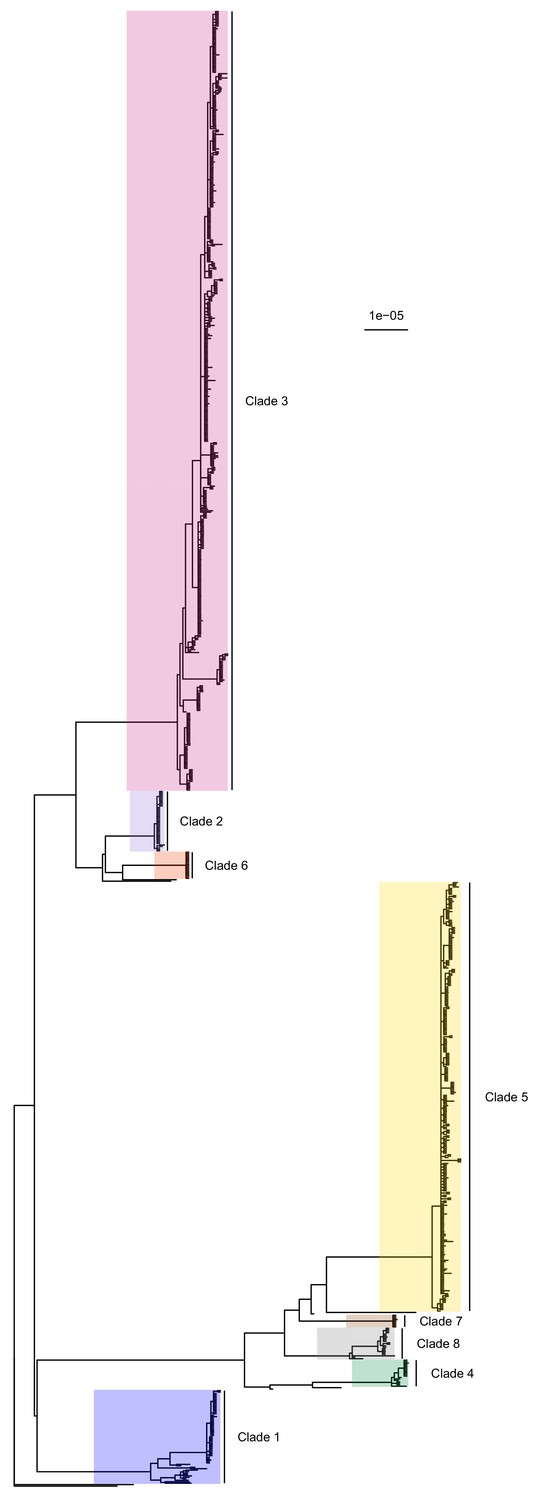
50% majority-rule consensus tree of the posterior distribution of ExaBayes phylogenies.
Branch lengths are in substitutions per site. Eight clades are highlighted. Clades 1 to 5 correspond to those identified by Tong et al. (2015), while the additional three are newly designated.
-
Figure 1—source data 1
ExaBayes consensus tree in Newick format.
- https://cdn.elifesciences.org/articles/46402/elife-46402-fig1-data1-v4.zip
Figure 2 with 1 supplement

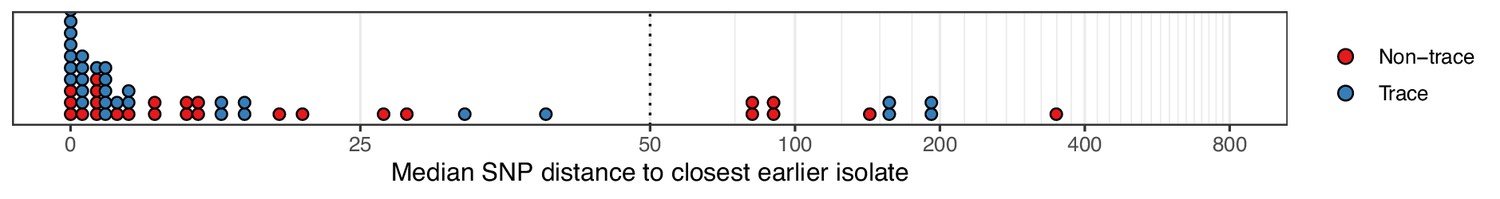
The median number of SNPs separating sequences from each colonisation from the most similar sequence from an isolate acquired before the date of the first positive sample from that colonisation.
Blue dots are colonisations isolated from a single swab only (trace colonisations), while red were acquired from colonisations where multiple swabs were isolated. For three colonisations (two trace) the first collection date was the commencement of the study and hence there was no such earlier isolate. The x-axis transfers to a log scale on the right of the dotted line.
-
Figure 2—source data 1
Source data and R script for creation of Figure 2 and Figure 2—figure supplement 1.
- https://cdn.elifesciences.org/articles/46402/elife-46402-fig2-data1-v4.zip
Figure 2—figure supplement 1
The median number of SNPs separating sequences from each colonisation, restricted to those obtained at the time of the first positive swab, from the most similar sequence from an isolate acquired before the date of the first positive sample from that colonisation.
Blue dots are colonisations isolated from a single swab only (trace colonisations), while red were acquired from colonisations where multiple swabs were isolated. For three colonisations (two trace) the first collection date was the commencement of the study and hence there was no such earlier isolate. The x-axis transfers to a log scale on the right of the dotted line.
Figure 3
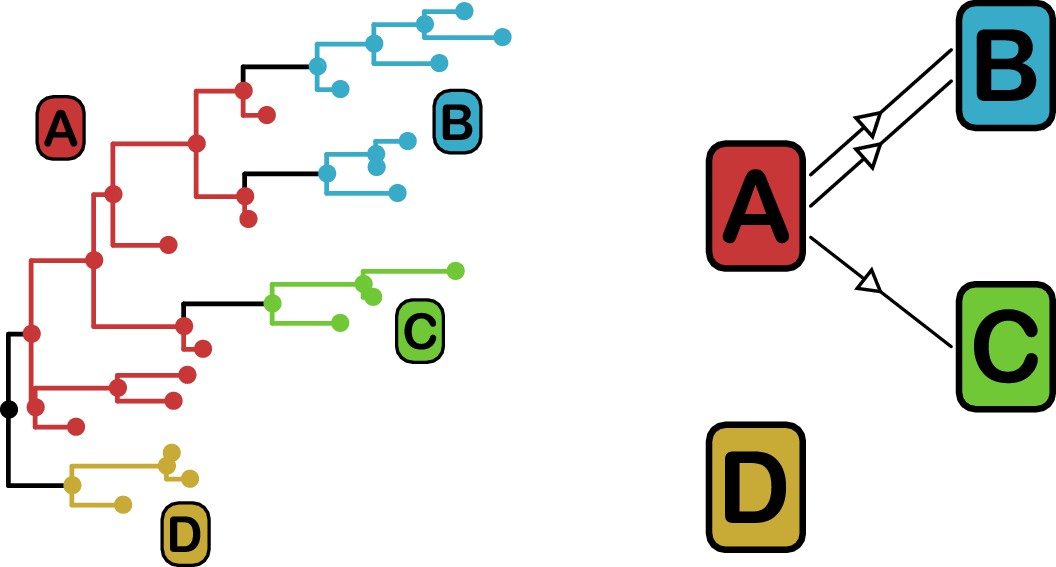
phyloscanner identifies transmission pairs by ancestral state reconstruction of hosts (left) and subsequent classification of the topological relationships between the subgraphs reconstructed to each host (right).
In this example the hosts are designated (A to D). Here host A is inferred to be the infector of hosts (B and C). The transmission from (A to C) was of only a single pathogen lineage, while that from A to B was of two, with the result that host B has two subgraphs. The subgraph from host D forms a sibling clade to the rest of the phylogeny and, as a result, no inference is made about transmission.
Figure 4 with 1 supplement

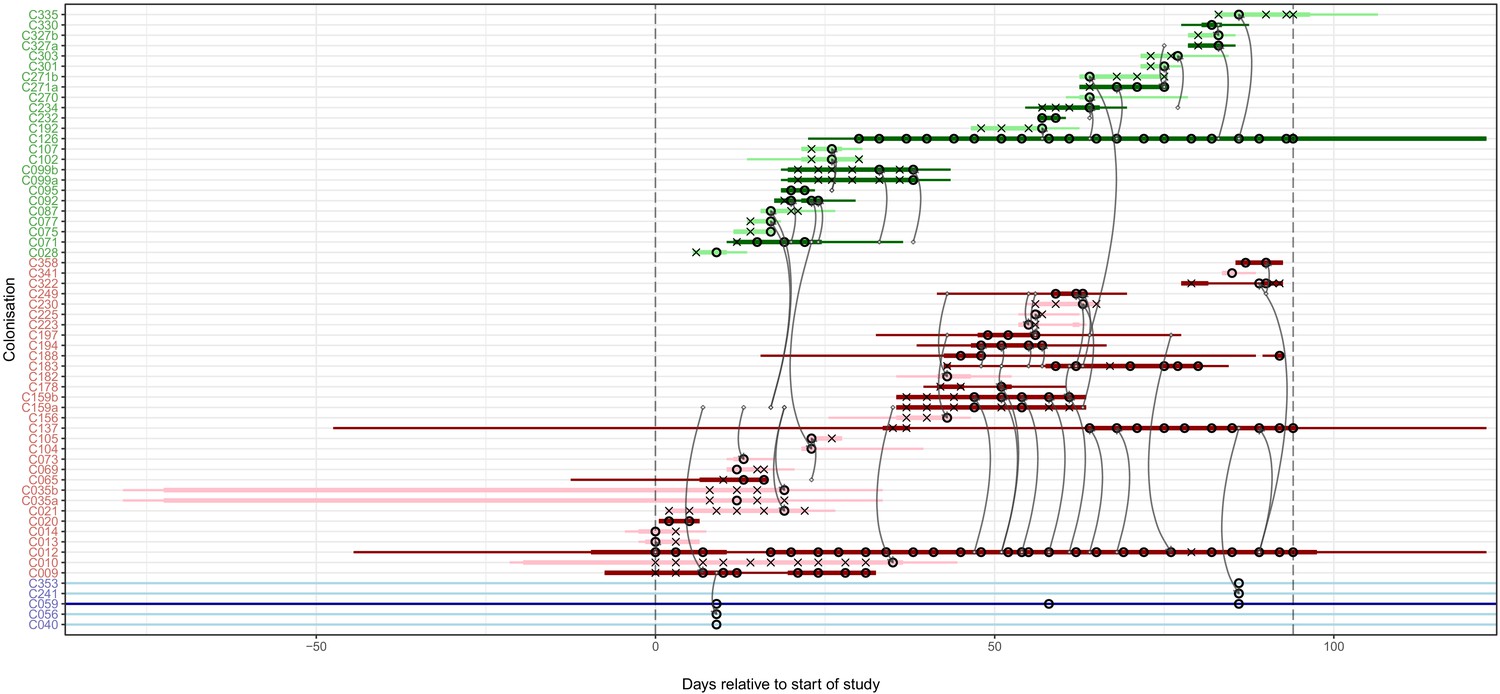
The reconstruction of the transmission process using the consensus tree overlaid on a timeline of hospital and ICU stays and sampling events.
Each row represents a colonisation, with thin lines representing the colonised subject’s presence in the hospital and thick lines their presence as a patient in an ICU. Colours of the lines and the y-axis labels indicate surgical ICU patients (green), paediatric ICU patients (red) and HCWs (blue). Crosses represent times of screens that were negative for MRSA, while circles those that returned positive swabs and sequenced isolates. The grey arrows represent reconstructed transmission events. These appear when at least one subgraph from the recipient is descended from an adjacent subgraph from the infector. Such a transmission may also involve unsampled intermediaries or the environment. The timings of these arrows represent the upper bound for the time at which they could have occurred rather than an exact estimate. The dotted vertical lines demarcate the period of sampling.
-
Figure 4—source data 1
Source data and R script for creation of Figure 4 and Figure 4—figure supplement 1.
- https://cdn.elifesciences.org/articles/46402/elife-46402-fig4-data1-v4.zip
Figure 4—figure supplement 1
The reconstruction of the transmission process using the consensus tree overlaid on a timeline of hospital and ICU stays and sampling events, with trace colonisations included.
Each row represents a colonisation, with thin lines representing the colonised subject’s presence in the hospital and thick lines their presence as a patient in an ICU. Colours of the lines and the y-axis labels indicate surgical ICU patients (green), paediatric ICU patients (red) and HCWs (blue). Light colours are colonisations providing only trace isolates, whereas dark lines were identified on multiple dates or at different body sites. Crosses represent times of screens that were negative for MRSA, while circles those that returned positive swabs and sequenced isolates. The grey arrows represent reconstructed transmission events. These appear when at least one subgraph from the recipient is descended from an adjacent subgraph from the infector. Such a transmission may also involve unsampled intermediaries or the environment. The timings represent the last possible time at which these could have occurred, which is the earliest time of sampling of all the sequences involved in the recipient subgraphs. The dotted vertical lines demarcate the period of sampling.
Figure 5 with 2 supplements
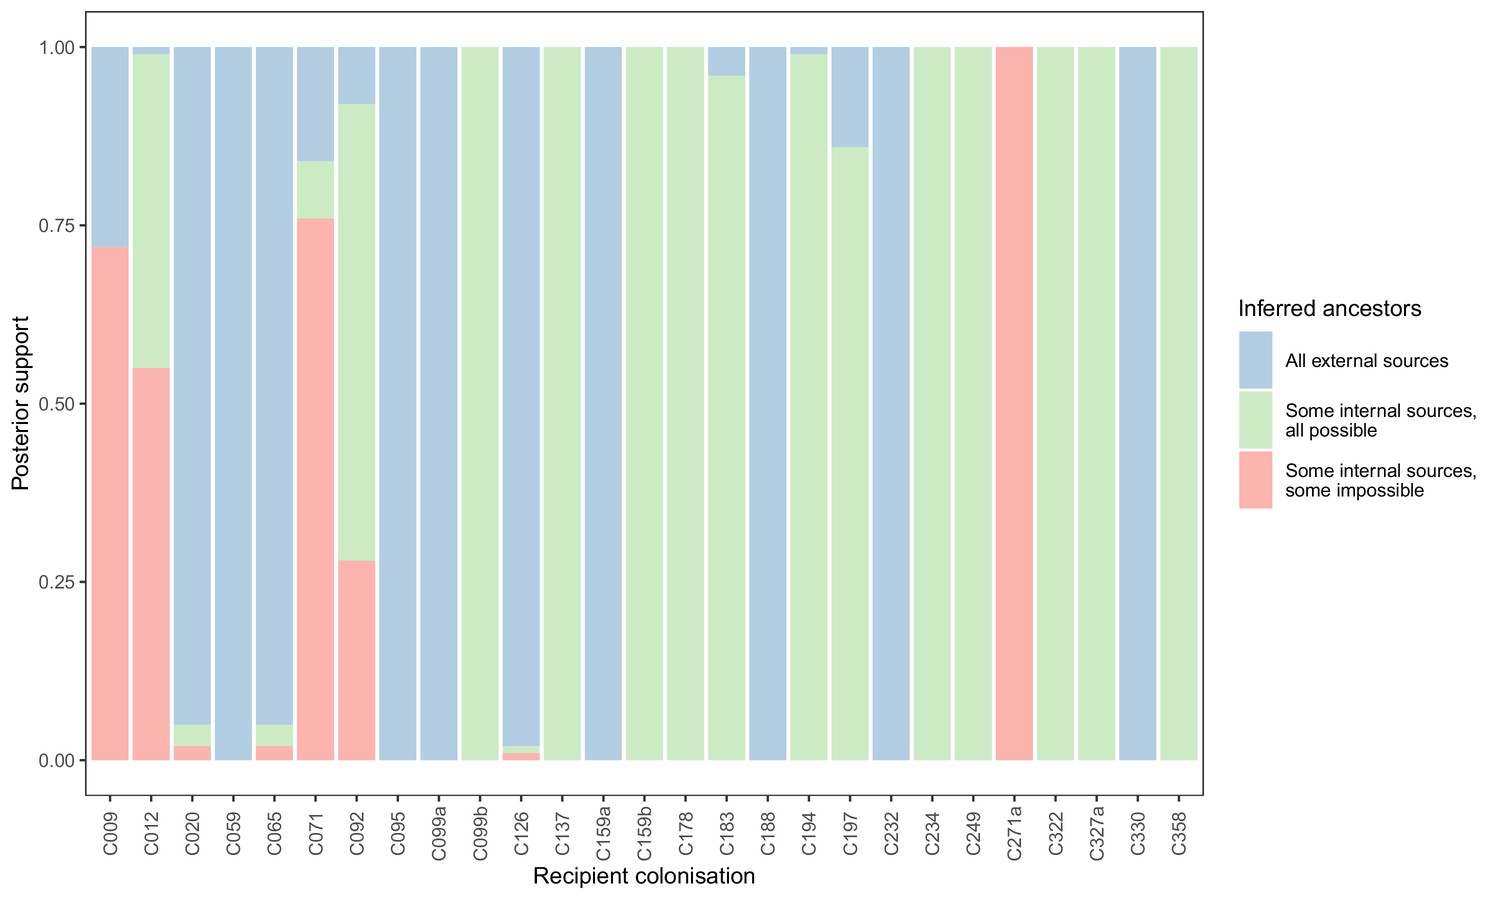
Concordance of inferred infectors for each colonisation with recorded timings of hospital stays and sampling dates.
Each bar represents a colonisation, and the colours represent the proportions of the posterior set of trees where the transmission chain prior to that host involves no sampled subjects (blue), involves one or more sampled subjects all of which are possible given known timings of entry and departure to the hospital and sampling of isolates (green) and at least one sampled subject where the timings are in conflict, with the infector entering the hospital after isolates from the recipient were acquired (red).
-
Figure 5—source data 1
Source data and R scripts for creation of Figure 5, Figure 5—figure supplement 1 and Figure 5—figure supplement 2.
- https://cdn.elifesciences.org/articles/46402/elife-46402-fig5-data1-v4.zip
Figure 5—figure supplement 1
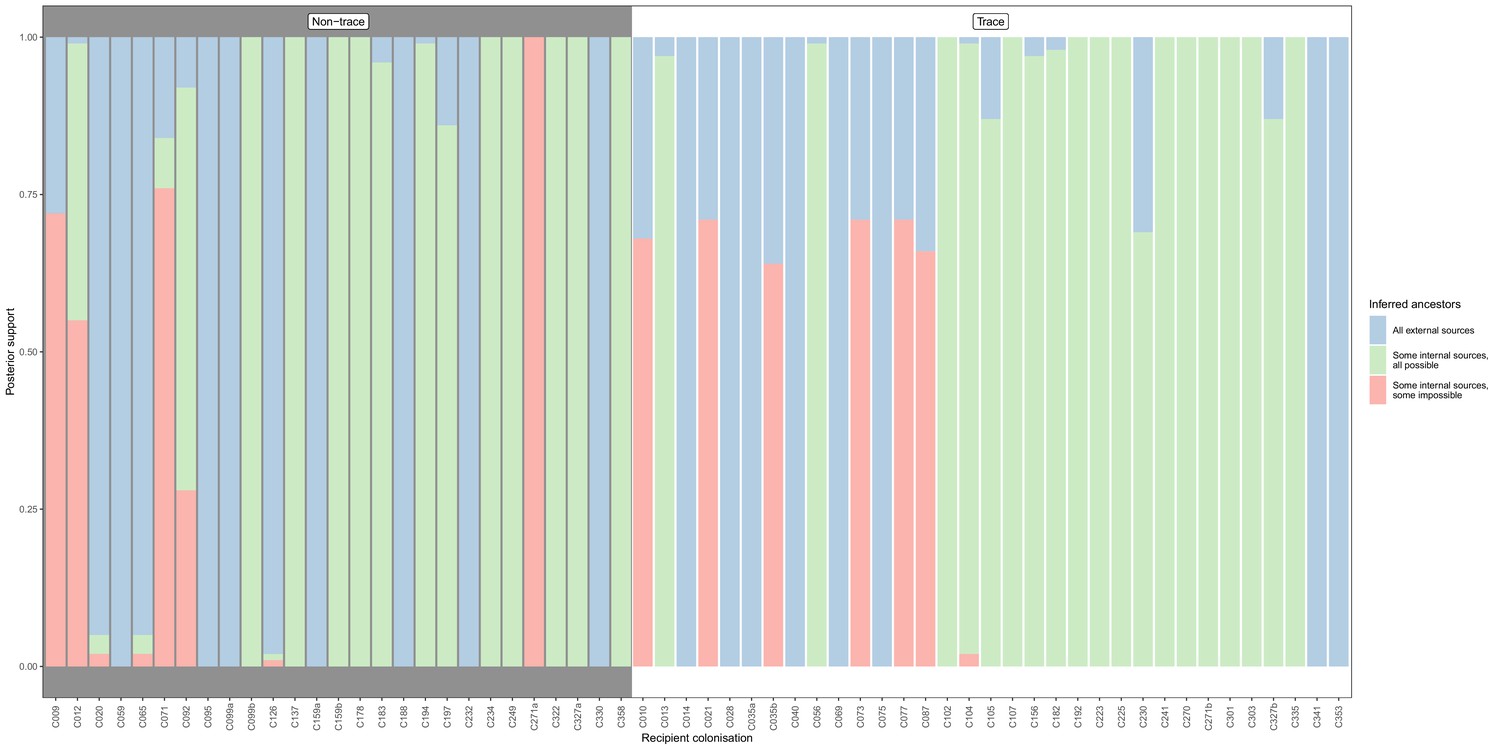
Concordance of inferred infectors for each colonisation with recorded timings of hospital stays and sampling dates, with trace colonisations included.
Each bar represents a colonisation, and the colours represent the proportions of the posterior set of trees where the transmission chain prior to that host involves no sampled subjects (blue), involves one or more sampled subjects all of which are possible given known timings of entry and departure to the hospital and sampling of isolates (green) and at least one sampled subject where the timings are in conflict, with the infector entering the hospital after isolates from the recipient were acquired (red). The graph is divided into non-trace (left) and trace (right) colonisations.
Figure 5—figure supplement 2
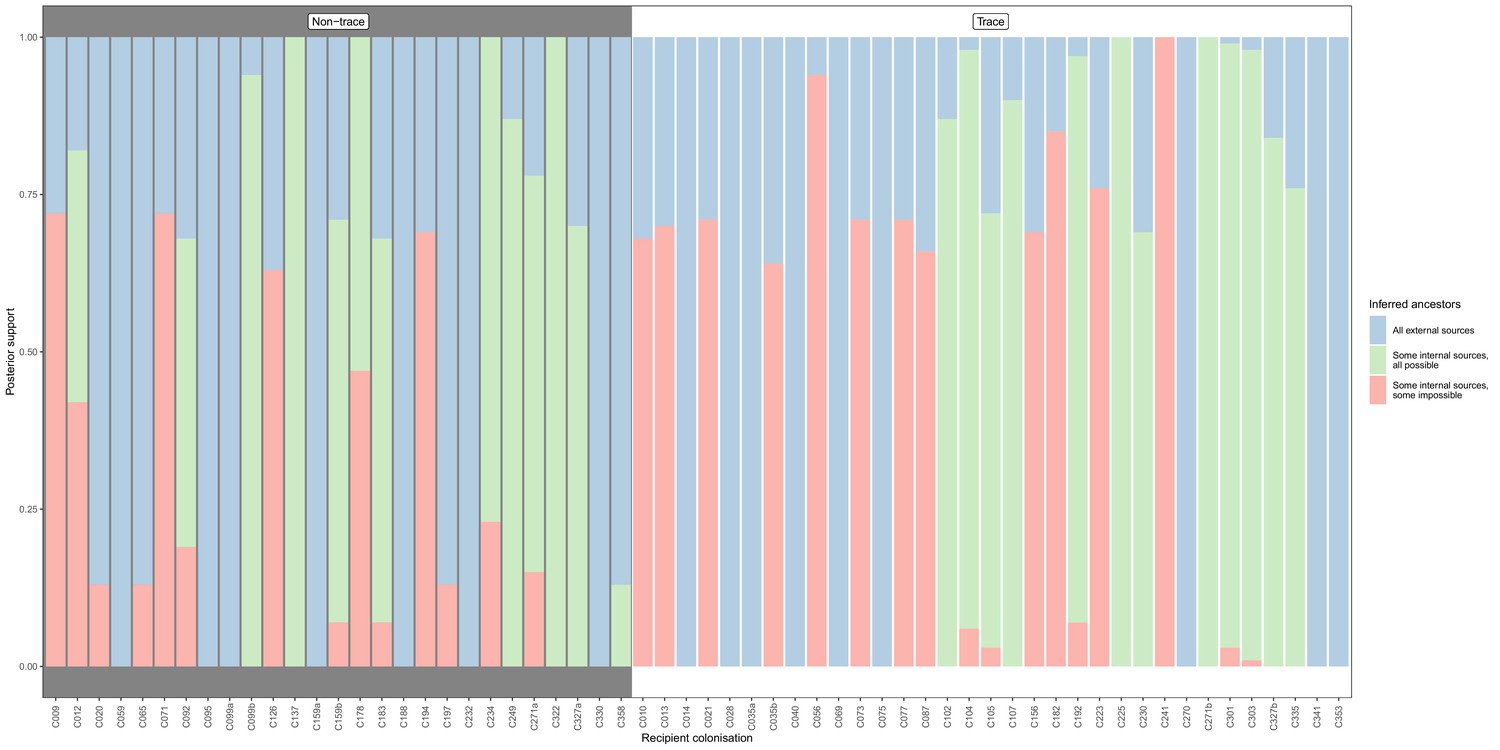
Concordance of inferred infectors for each colonisation with recorded timings of hospital stays and sampling dates, from a secondary phyloscanner analysis in which the tip set from each subject was randomly downsampled until a maximum of five remained.
Each bar represents a colonisation, and the colours represent the proportions of the posterior set of trees where the transmission chain prior to that host involves no sampled subjects (blue), involves one or more sampled subjects all of which are possible given known timings of entry and departure to the hospital and sampling of isolates (green) and at least one sampled subject where the timings are in conflict, with the infector entering the hospital after isolates from the recipient were acquired (red). The graph is divided into non-trace (left) and trace (right) colonisations.
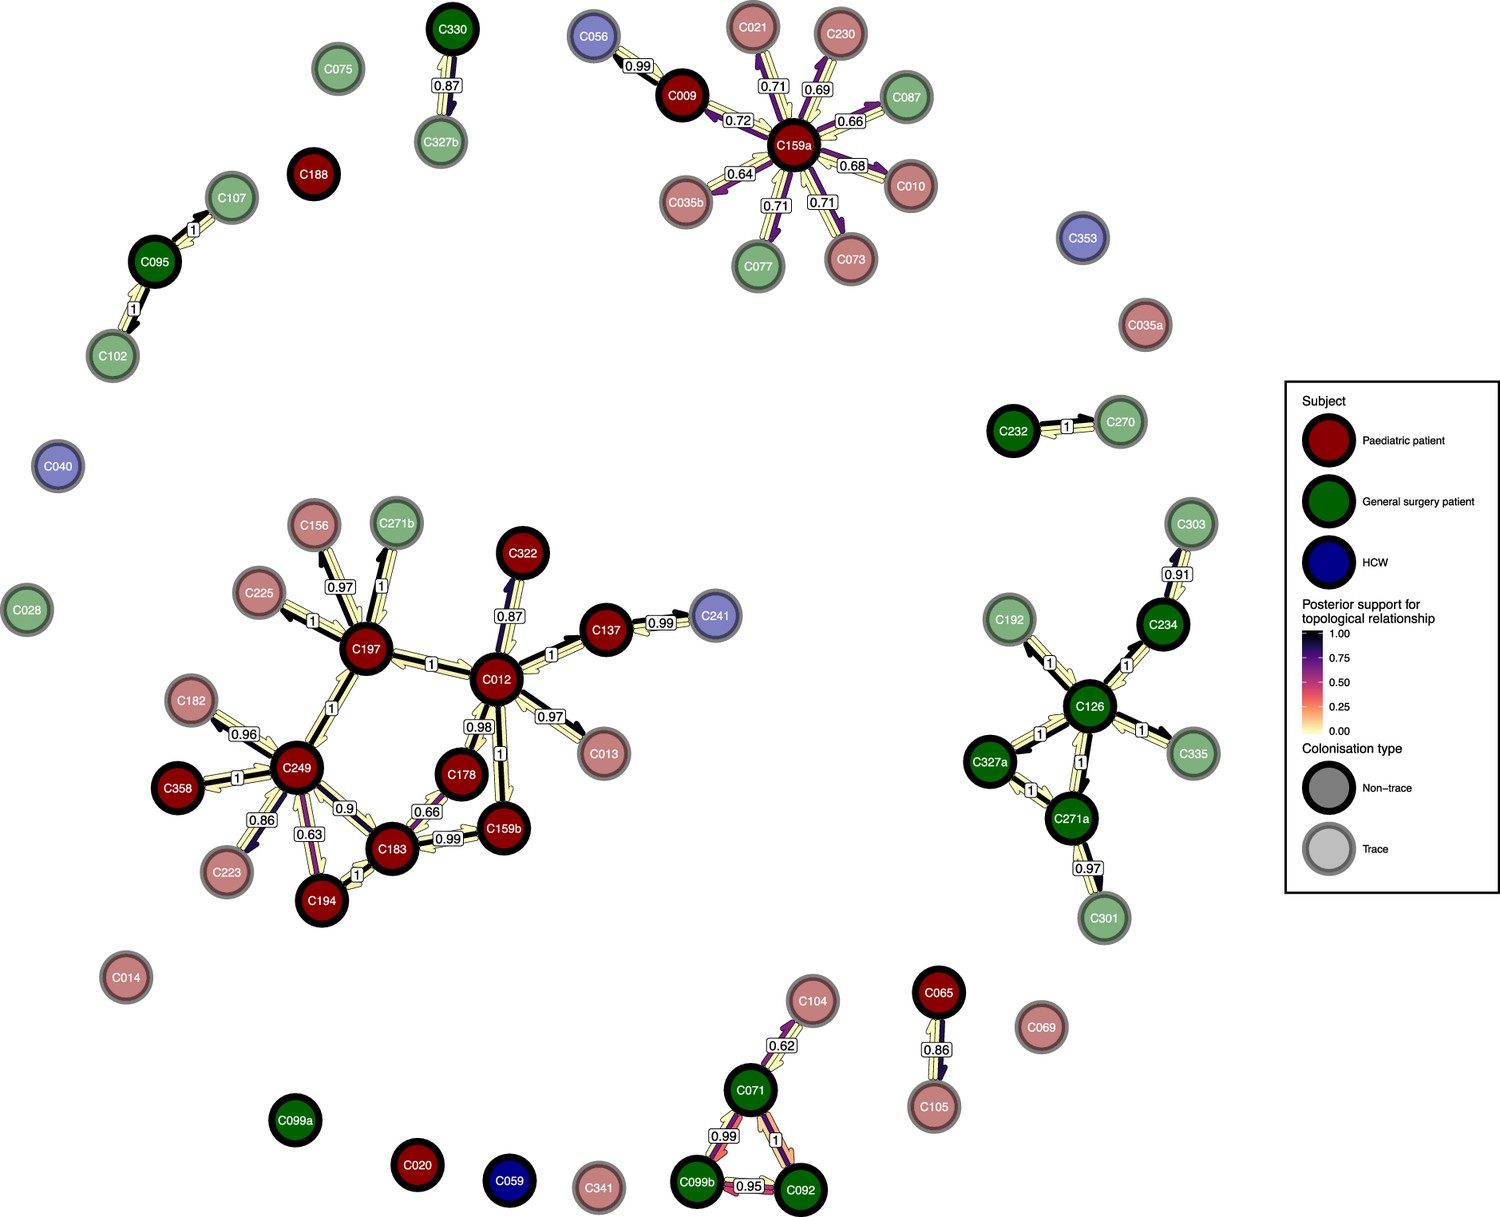
Figure 6 with 1 supplement
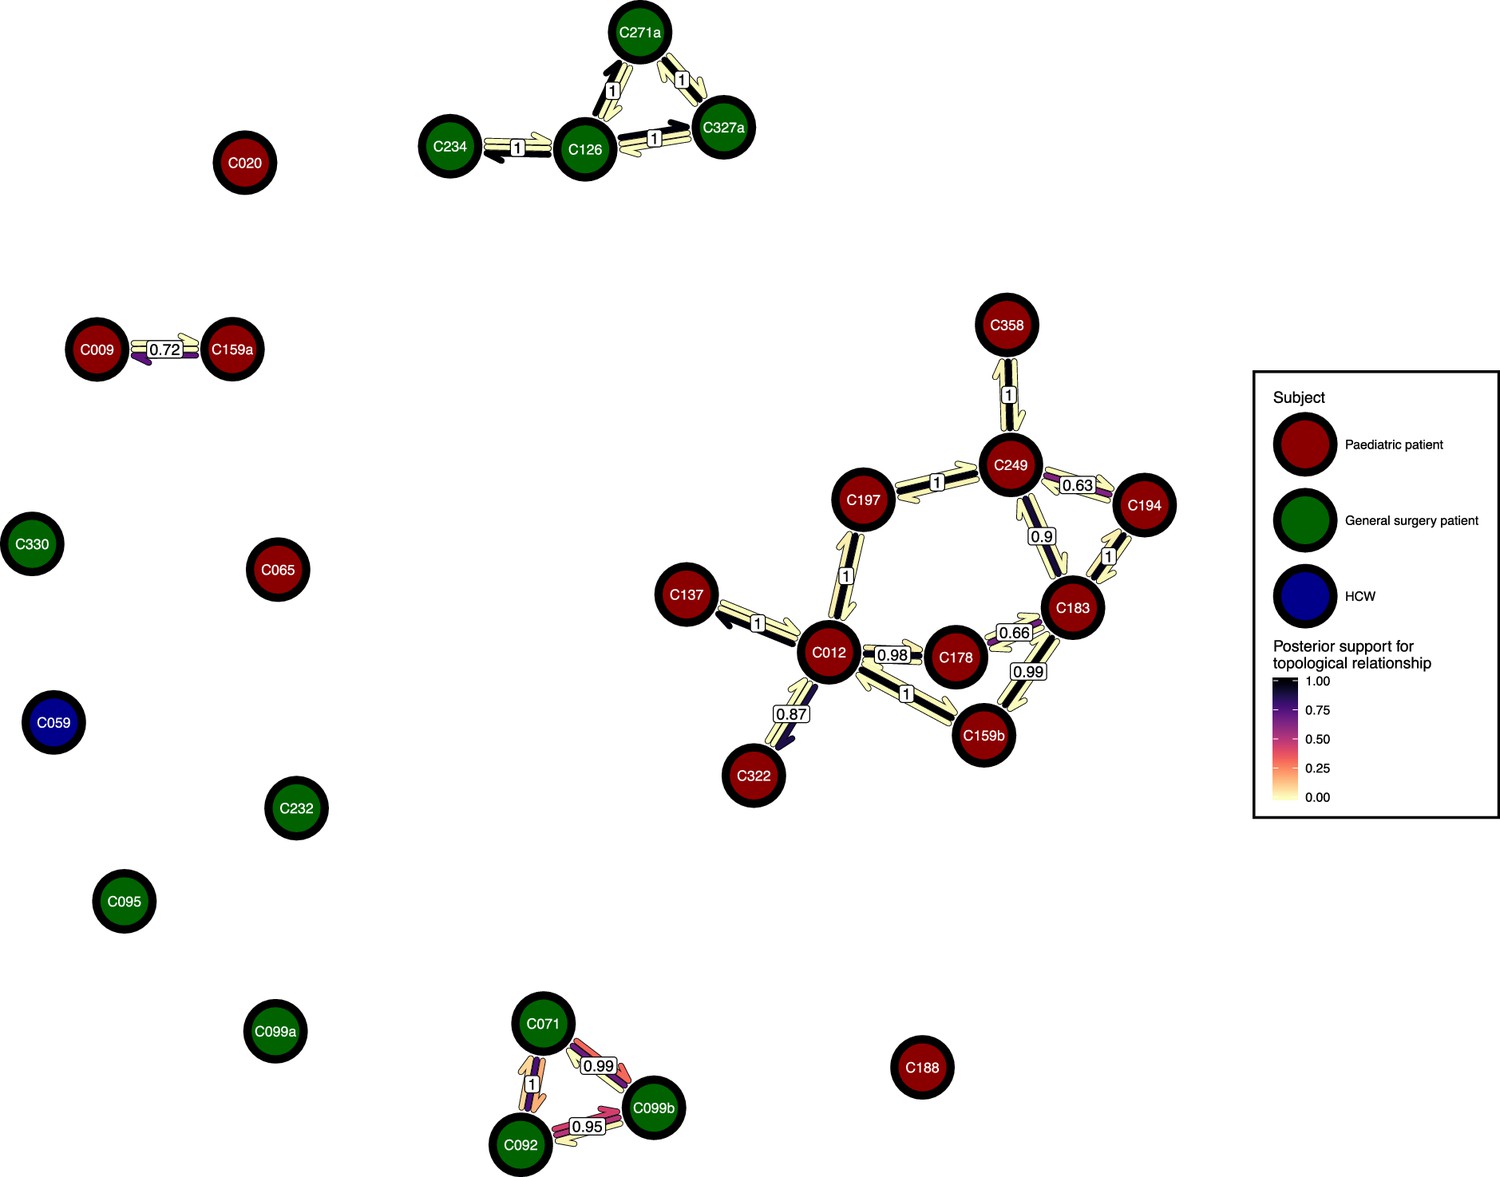
The phyloscanner host relationship diagram.
Each node represents all the sequences for one colonisation. Node fill colours designate patients in the two hospital ICUs and the HCWs. Edges appear where colonisations share a relationship with posterior support of at least 0.5 and consist of three elements: arrows representing transmission in either direction and a central line segment representing the ‘complex’ topological relationship, which is indicative of transmission but the direction is ambiguous. Each of these is coloured according to the proportion of posterior trees showing the corresponding relationship. Edges are also labelled with the overall posterior support for any topology suggesting transmission.
-
Figure 6—source data 1
Source data and R script for creation of Figure 6 and Figure 6—figure supplement 1.
- https://cdn.elifesciences.org/articles/46402/elife-46402-fig6-data1-v4.zip
Figure 6—figure supplement 1
The phyloscanner host relationship diagram, with trace colonisations included.
Each node represents all the sequences for one colonisation. Node fill colours designate patients in the two hospital ICUs and the HCWs and nodes with faded colours representing trace colonisations. Edges appear where colonisations share a relationship with posterior support of at least 0.5 and consist of three elements: arrows representing transmission in either direction and a central line segment representing the ‘complex’ topological relationship, which is indicative of transmission but the direction is ambiguous. Each of these is coloured according to the proportion of posterior trees showing the corresponding relationship. Edges are also labelled with the overall posterior support for any topology suggesting transmission.
Figure 7 with 1 supplement
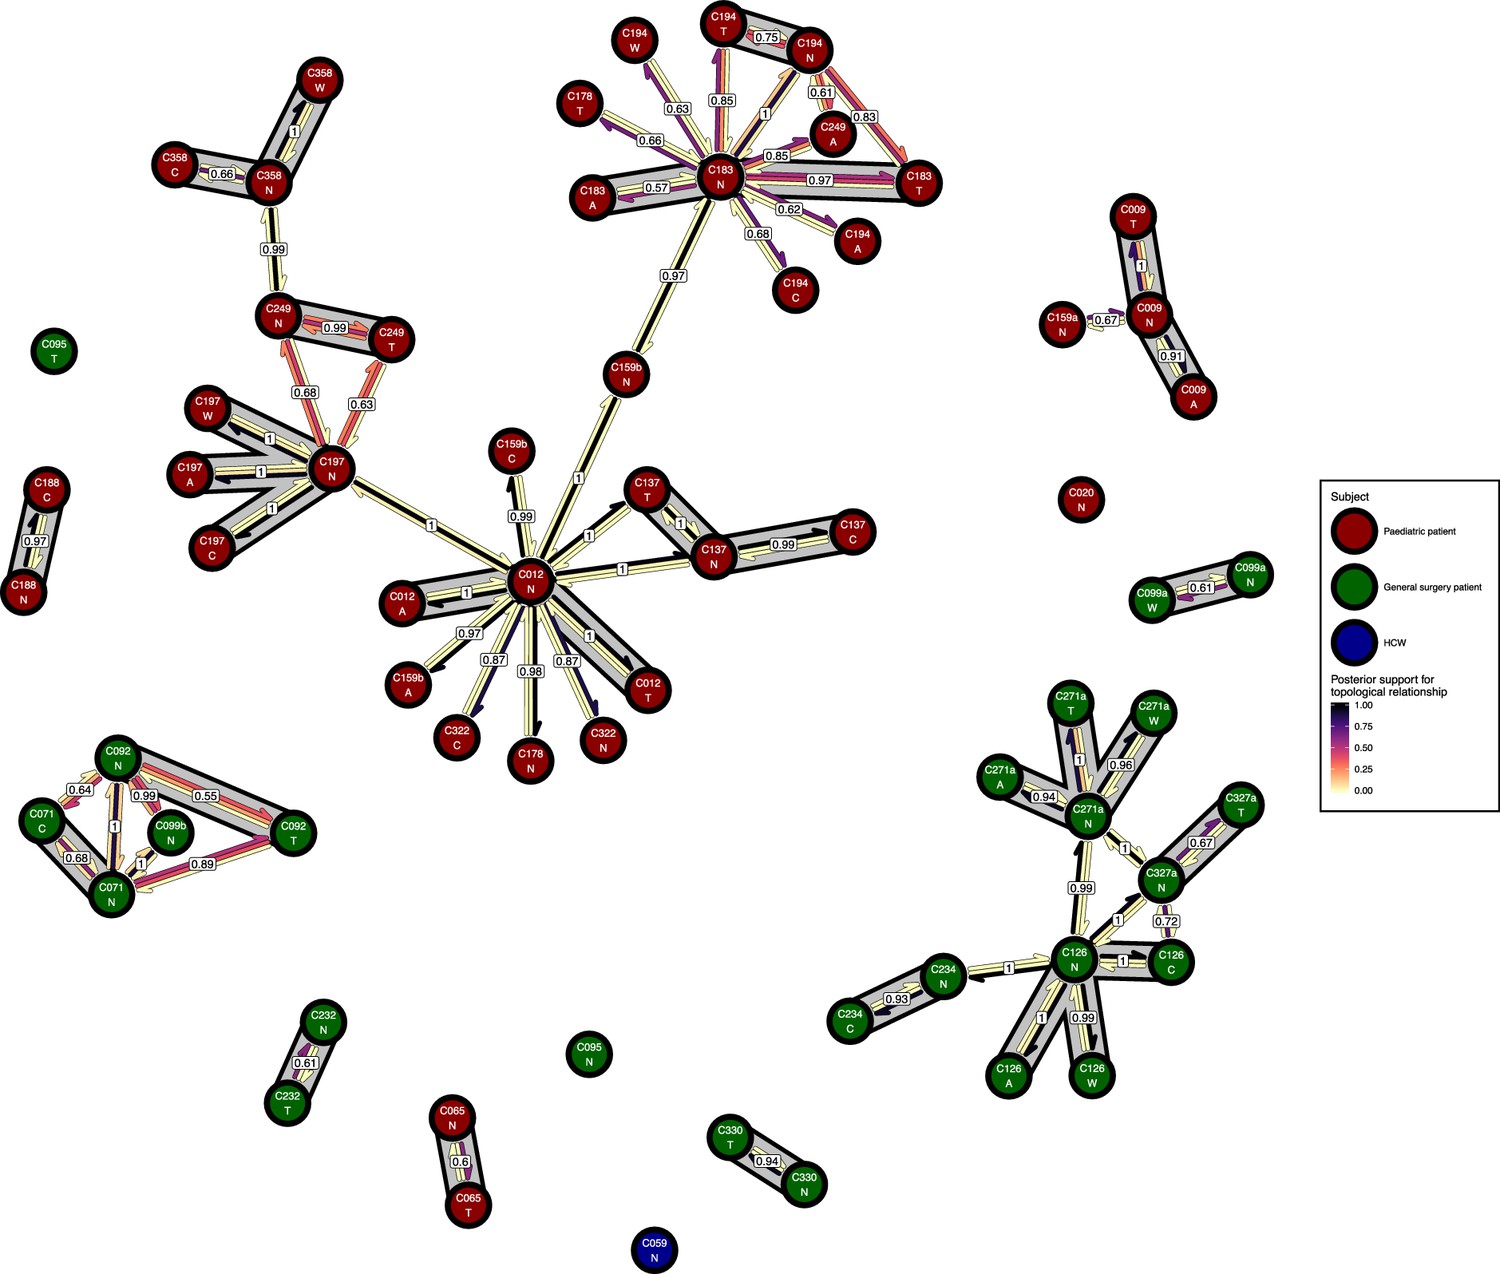
The phyloscanner host relationship diagram for a separate analysis where samples taken from distinct body sites on the same subject were treated as separate ‘hosts’.
Each node represents all the sequences for one colonisation of one body site. Node fill colours designate patients in the two hospital ICUs and the HCWs. Edges appear where colonisations share a relationship with posterior support of at least 0.5 and consist of three elements: arrows representing transmission in either direction and a central line segment representing the ‘complex’ topological relationship, which is indicative of transmission but the direction is ambiguous. Each of these is coloured according to the proportion of posterior trees showing the corresponding relationship. Edges are also labelled with the overall posterior support for any topology suggesting transmission, and edges connecting colonisations from sites from the same subject have a grey background. Nodes are annotated with colonisation IDs and a code for body site: A = axilla, C = endotracheal suction, N = nose, T = throat, W = wound.
-
Figure 7—source data 1
Source data and R script for creation of Figure 7 and Figure 7—figure supplement 1.
- https://cdn.elifesciences.org/articles/46402/elife-46402-fig7-data1-v4.zip
Figure 7—figure supplement 1
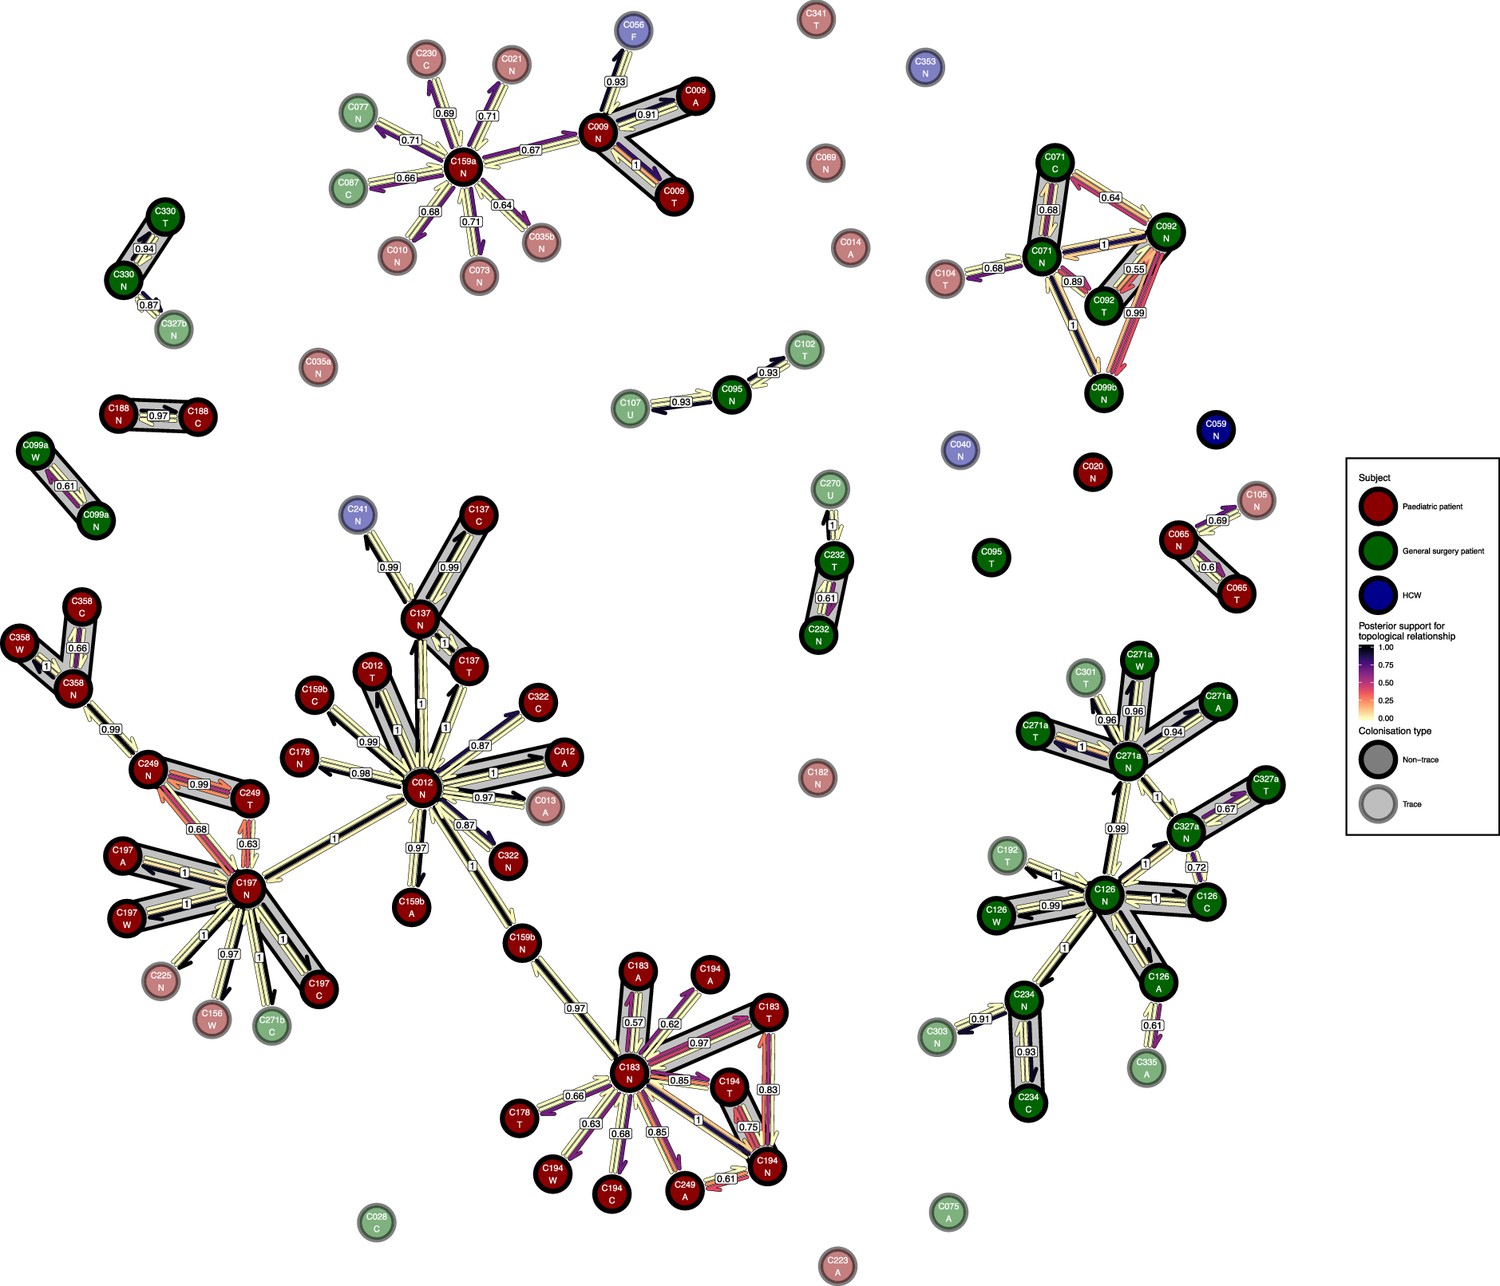
The phyloscanner host relationship diagram for the body site analysis, with trace colonisations included.
Each node represents all the sequences for one colonisation of one body site. Node fill colours designate patients in the two hospital ICUs and the HCWs and nodes with faded colours representing trace colonisations. Edges appear where colonisations share a relationship with posterior support of at least 0.5 and consist of three elements: arrows representing transmission in either direction and a central line segment representing the ‘complex’ topological relationship, which is indicative of transmission but the direction is ambiguous. Each of these is coloured according to the proportion of posterior trees showing the corresponding relationship. Edges are also labelled with the overall posterior support for any topology suggesting transmission, and edges connecting colonisations from sites from the same subject have a grey background. Nodes are annotated with colonisation IDs and a code for body site: A = axilla, C = endotracheal suction, F = fingertips, N = nose, T = throat, U = urine, W = wound.
Figure 8
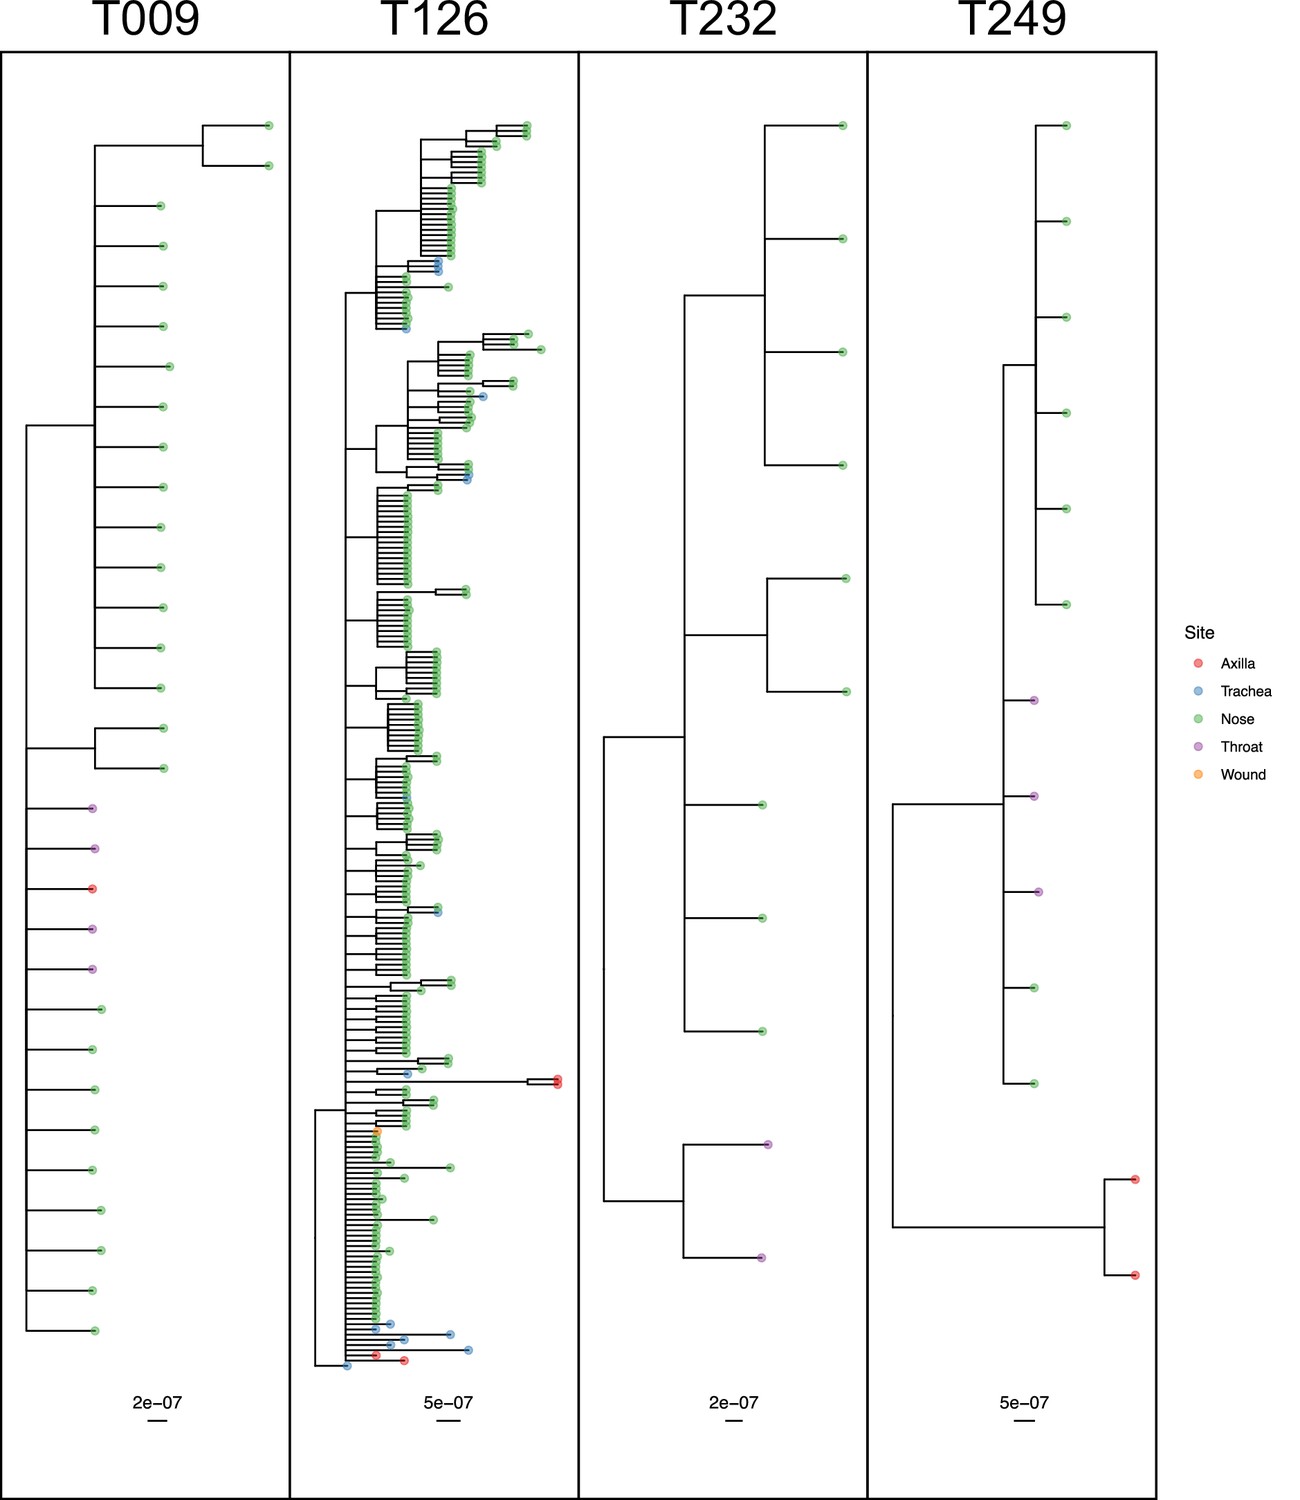
50% majority-rule consensus phylogenies for the ExaBayes phylogenetic analyses of the sequences from patients T009, T126, T232 and T249.
Tips are coloured by body site of origin. Branch lengths are in substitutions per site. Trees were rooted using the TW20 outgroup (not shown).
-
Figure 8—source data 1
ExaBayes consensus trees for all subjects analysed in the phyloanatomy analysis.
- https://cdn.elifesciences.org/articles/46402/elife-46402-fig8-data1-v4.zip
Figure 9 with 1 supplement
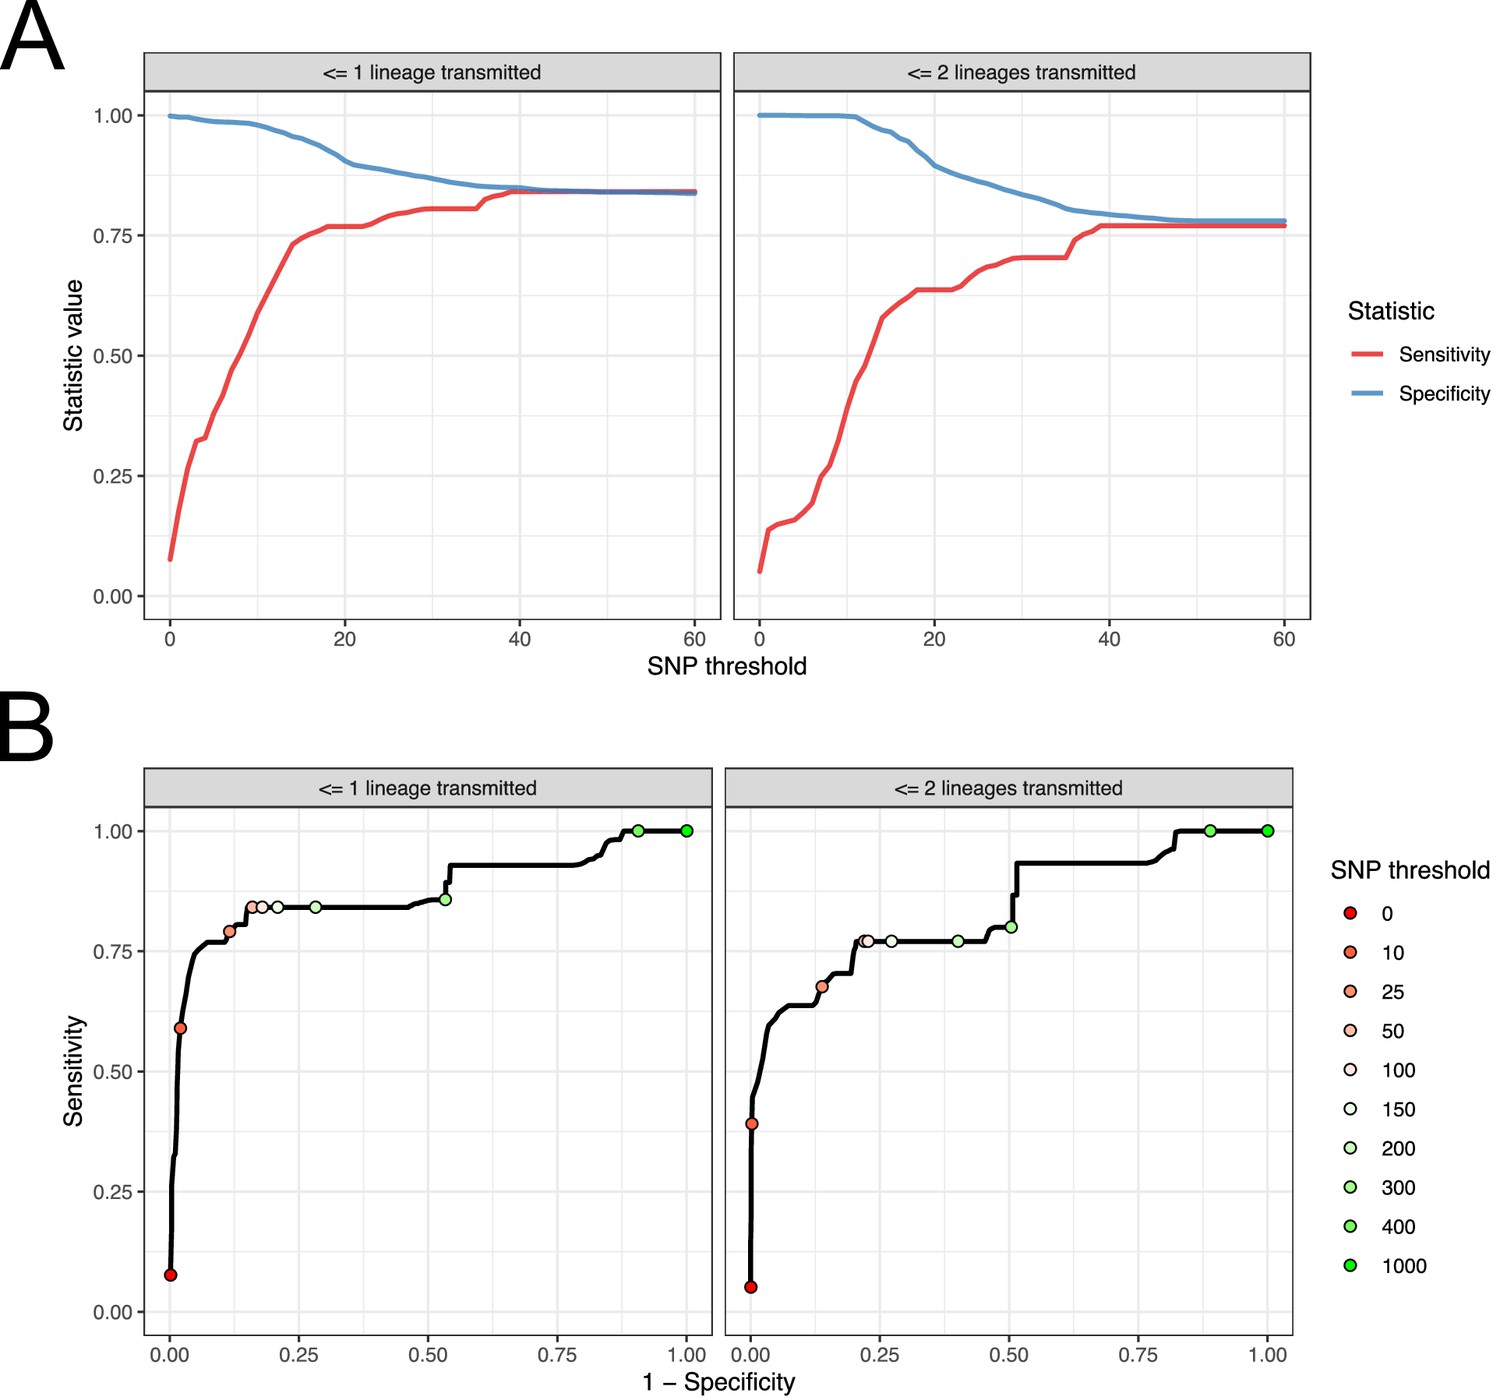
Performance of SNP distance as a method for identifying transmission pairs.
(A) Plots of the sensitivity and specificity of using the number of SNPs to identify transmission pairs, for different distance thresholds. (B) ROC curves plotting true positive rate (sensitivity) against false positive rate (1-specificity) for different thresholds. The curve is annotated with selected threshold values. The gold standard for identifying transmission pairs in the version on the left is a topological relationship suggesting at least one transmitted lineage, while on the right at least two are required, a criterion which will occur much less often if there is a missing intermediary in transmission.
-
Figure 9—source data 1
Source data and R script for creation of Figure 9 and Figure 9—figure supplement 1.
- https://cdn.elifesciences.org/articles/46402/elife-46402-fig9-data1-v4.zip
Figure 9—figure supplement 1
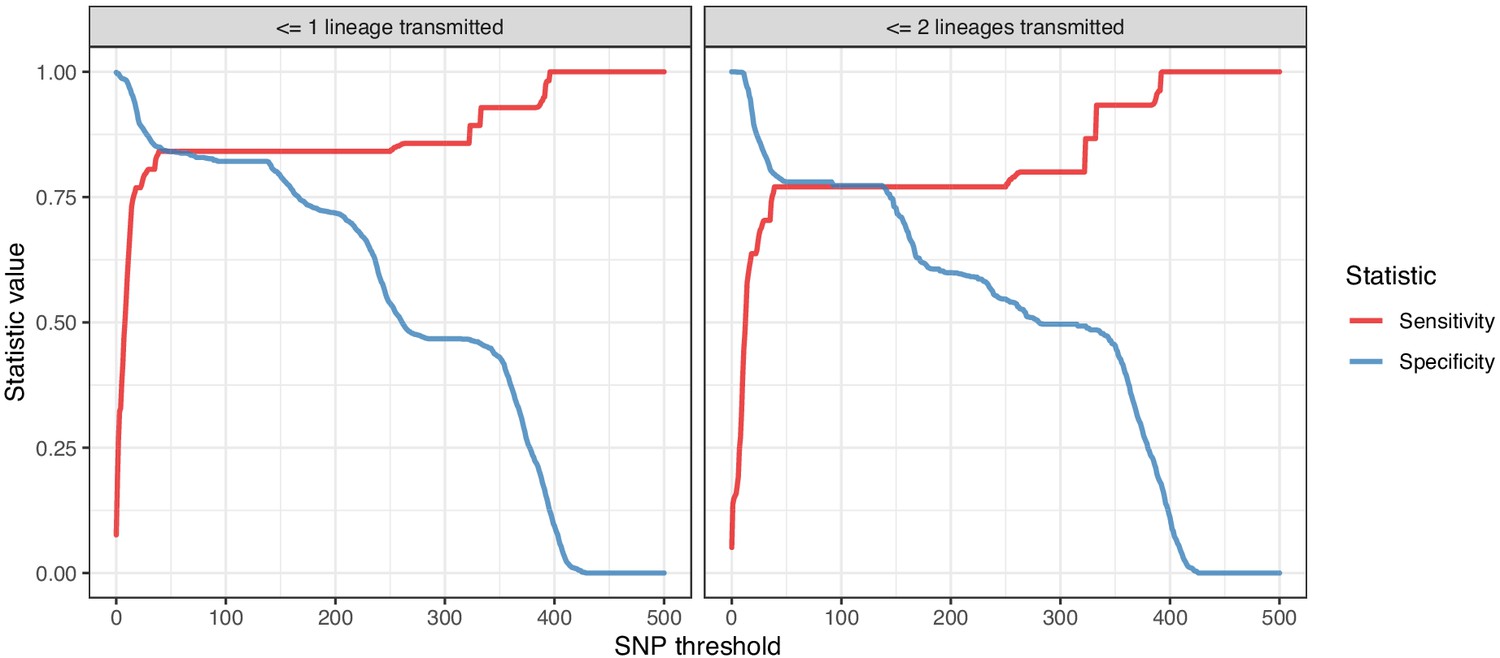
Plots of the sensitivity and specificity of using the number of SNPs to identify transmission pairs, for different distance thresholds.
The gold standard for identifying transmission pairs in the version on the left is a topological relationship suggesting at least one transmitted lineage, while on the right at least two are required, a criterion which will occur much less often if there is a missing intermediary in transmission.
Tables
Table 1
Six pairs of colonisations for whom transmission was reconstructed with a posterior score of at least 0.95 and, for those reconstructed transmissions, a posterior median of at least five tips were in the recipient subgraphs.
Each row gives the posterior median and the limits of the 95% highest posterior density (HPD) interval for the number of reconstructed transmissions between the subjects, in either direction. The posterior median number of tips in the recipient subgraphs, and the nucleotide diversity amongst those tips, are also given. In five cases the inferred direction of transmission is clear, but for C183 and C194 it is not.
| Colonisation A | Colonisation B | Number of A to B transitions 95 % HPD | Tips in descendant B subgraphs (median) | Nucleotide diversity transmitted to B (median) | Number of B to A transitions 95% HPD | Tips in descendant A subgraphs (median) | Nucleotide diversity transmitted to A (median) | Direction | ||||
|---|---|---|---|---|---|---|---|---|---|---|---|---|
| Median | Lower | Upper | Median | Lower | Upper | |||||||
| C012 | C137 | 3 | 2 | 3 | 79 | 1.46E-06 | 0 | 0 | 0 | 0 | NA | A to B |
| C012 | C159b | 34 | 25 | 38 | 39 | 2.20E-06 | 1 | 0 | 6 | 1 | 1.40E-06 | A to B |
| C126 | C234 | 3 | 3 | 3 | 10 | 1.92E-06 | 0 | 0 | 0 | 0 | NA | A to B |
| C126 | C271a | 1 | 1 | 1 | 21 | 3.11E-07 | 0 | 0 | 0 | 0 | NA | A to B |
| C126 | C327a | 5 | 4 | 5 | 9 | 2.68E-06 | 0 | 0 | 0 | 0 | NA | A to B |
| C183 | C194 | 15 | 1 | 23 | 31 | 3.41E-07 | 5 | 0 | 19 | 12 | 7.08E-07 | Unclear |
Table 2
Results of the investigation of body site/phylogeny associations.
Each row corresponds to a single BATS analysis on a posterior set of phylogenies consisting just of the sequences from that subject. The p-values are given for the association index (AI), parsimony score (PS) and largest monophyletic clade (MC) size for all body sites present in the dataset. Values with an asterisk (*) correspond to statistics whose values are identical under both hypotheses due to singleton sequences from some sites.
| Subject | Number of Sequences | p-value | ||||||
|---|---|---|---|---|---|---|---|---|
| AI | PS | MC | ||||||
| Axilla | Nose | Throat | Trachea | Wound | ||||
| T009 | 31 | 0.026 | 1 | 1* | 0.031 | 1 | ||
| T012 | 223 | 0.24 | 0.18 | 1 | 1 | 0.14 | ||
| T065 | 11 | <0.001 | 1* | 0.29 | 1* | |||
| T071 | 13 | 0.16 | 1 | 0.16 | 1 | |||
| T092 | 12 | 0.035 | 1 | 1 | 1 | |||
| T095 | 11 | 0.099 | 1* | 0.1 | 1* | |||
| T099 | 19 | 1 | 1* | 0.16 | 1* | |||
| T126 | 239 | <0.001 | <0.001 | 0.004 | 0.1 | 0.004 | 1* | |
| T137 | 79 | 0.004 | 1 | 0.12 | 1 | 1* | ||
| T159 | 46 | 0.7 | 1 | 1* | 1 | 1 | ||
| T183 | 48 | 0.04 | 1 | 1* | 0.22 | 1 | ||
| T188 | 19 | 1 | 1* | 1 | 1* | |||
| T194 | 32 | 0.13 | 1 | 1* | 1 | 0.37 | 1* | 1* |
| T197 | 35 | 0.74 | 1 | 1 | 1 | 1 | 1 | |
| T232 | 11 | <0.001 | <0.001 | 0.001 | 0.001 | |||
| T234 | 10 | 1 | 1* | 1 | 1* | |||
| T249 | 14 | 0.002 | <0.001 | 0.017 | 0.016 | 1 | ||
| T271 | 23 | 0.043 | 1 | 1* | 0.49 | 1 | 1* | 1* |
| T327 | 10 | 1 | 1* | 0.51 | 1* | |||
| T330 | 8 | 1 | 1* | 0.26 | 1* | |||
| T358 | 22 | 0.004 | 1 | 0.06 | 1 | |||
Additional files
-
Supplementary file 1
Examples of arrangements of tips with two states (red and blue) on a phylogeny and the corresponding values of the AI, PS, and MC statistics.
Given are the values of the statistic and p-values estimated by permuting the tip states 1000 times. (A) Blue tips occur only in one clade but that clade is not exclusively blue. The AI statistic shows significant deviation from the null hypothesis of no phylogeny-state association, but the others do not. (B) Blue tips form a single clade. All statistics other than the MC for the red state show significant deviation from the null. (C) Blue tips appear randomly in the phylogeny. There is no evidence of any association using any statistic. (D) A single blue tip is basal to the remainder of the tree. The AI statistic and the MC for the red state suggest an association. (E/F) A single blue tip occurs amongst the red tips. Some evidence of association may still be identified using the AI statistic and further investigation is warranted. In cases D-F the PS and MC (blue) statistics are always equal to 1.
- https://cdn.elifesciences.org/articles/46402/elife-46402-supp1-v4.docx
-
Supplementary file 2
Coordinates of the accessory regions of the TW20 chromosome.
- https://cdn.elifesciences.org/articles/46402/elife-46402-supp2-v4.docx
-
Supplementary file 3
Coordinates of regions of the MRSA genome in which recombination was identified by Gubbins.
Positions are with respect to the TW20 reference strain.
- https://cdn.elifesciences.org/articles/46402/elife-46402-supp3-v4.docx
-
Transparent reporting form
- https://cdn.elifesciences.org/articles/46402/elife-46402-transrepform-v4.docx
Download links
A two-part list of links to download the article, or parts of the article, in various formats.
Downloads (link to download the article as PDF)
Open citations (links to open the citations from this article in various online reference manager services)
Cite this article (links to download the citations from this article in formats compatible with various reference manager tools)
Improved characterisation of MRSA transmission using within-host bacterial sequence diversity
eLife 8:e46402.
https://doi.org/10.7554/eLife.46402


