Birds land reliably on complex surfaces by adapting their foot-surface interactions upon contact
- Stanford University, United States
Figures
Figure 1
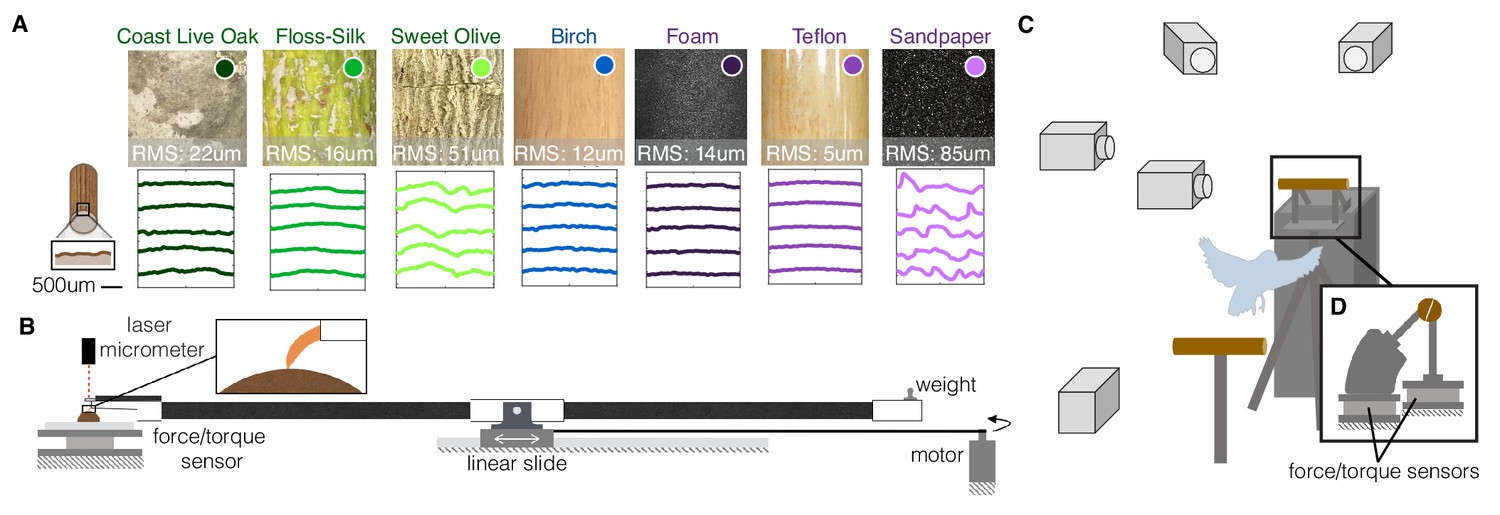
Experimental setups to measure the dynamics, kinematics, and surface interactions that birds use to land on a wide range of surfaces.
(A) Perches of 7 different natural or human-made surfaces were tested. RMS roughness values and circumferential surface profiles (five representative profile segments are shown for each perch) were derived from 3D scans of each surface. (B) To quantify foot-surface interactions, sections of each perch surface were affixed to a force sensor for measuring friction forces during claw and toe drag tests. A laser micrometer was used to measure the depth of surface deformations during claw indentation tests. (C) To understand how birds adapt to these variable substrates, high-speed recordings were made during voluntary landings of Pacific parrotlets (Forpus coelestis) on a custom-built split perch (D). The front and back halves of each perch were mechanically isolated and instrumented by separate force/torque sensors. The split was oriented at 20 degrees from the vertical to best align with the center of the parrotlets’ feet and therefore isolate front and rear toe forces. This design enabled us to recover squeeze forces exerted by the feet in addition to the total landing forces (see Materials and methods). (B) and (D) are drawn proportionally to scale.
Figure 2
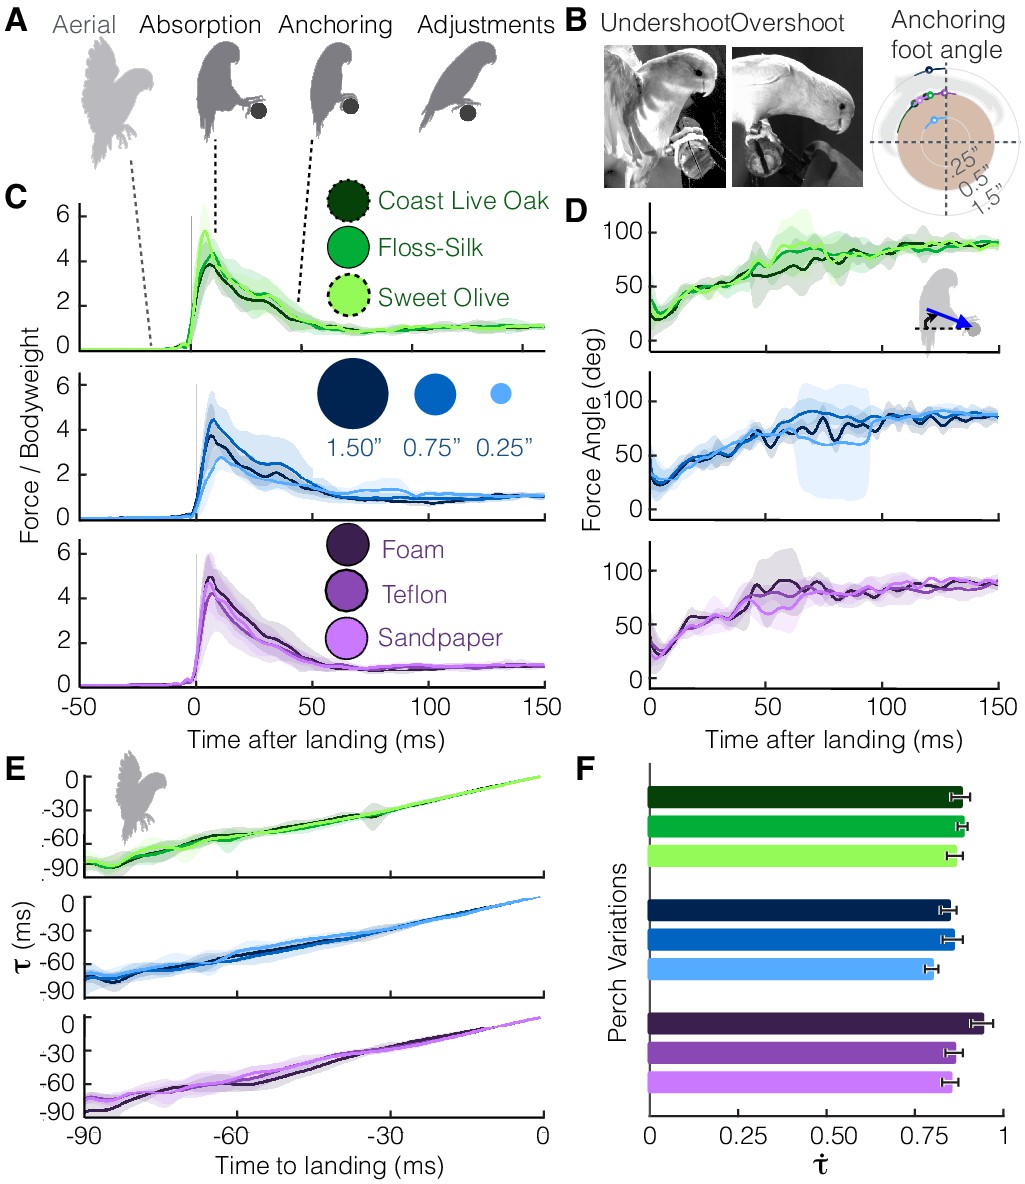
Despite differences in perches, parrotlets exhibit stereotyped landing behavior in their leg and wing dynamics.
(A) Phases of landing (aerial, absorption, anchoring, adjustments) exhibited during each flight. (B) The parrotlets sometimes overshoot or undershoot the perch during landing. This may have increased the variance of the anchoring foot angles at which a bird stops slipping. The diagram illustrates the mean anchoring foot angles for the different surfaces along with their variance. Net force magnitudes (normalized by bodyweight) (C) and directions (D) also show variance, but average trends remain similar despite perch differences. The little variation in landing dynamics may be explained by how parrotlets control their landings; (E) the wings brake only enough to maintain a nearly constant change in rate of (estimated time to collision), (F) which is consistent with that of a controlled collision ( > 0.5). (B-E) show mean ± SD for N = 3 birds, n = 3 flights per bird. (F) shows mean ± SEM for the same flights.
Figure 3 with 3 supplements
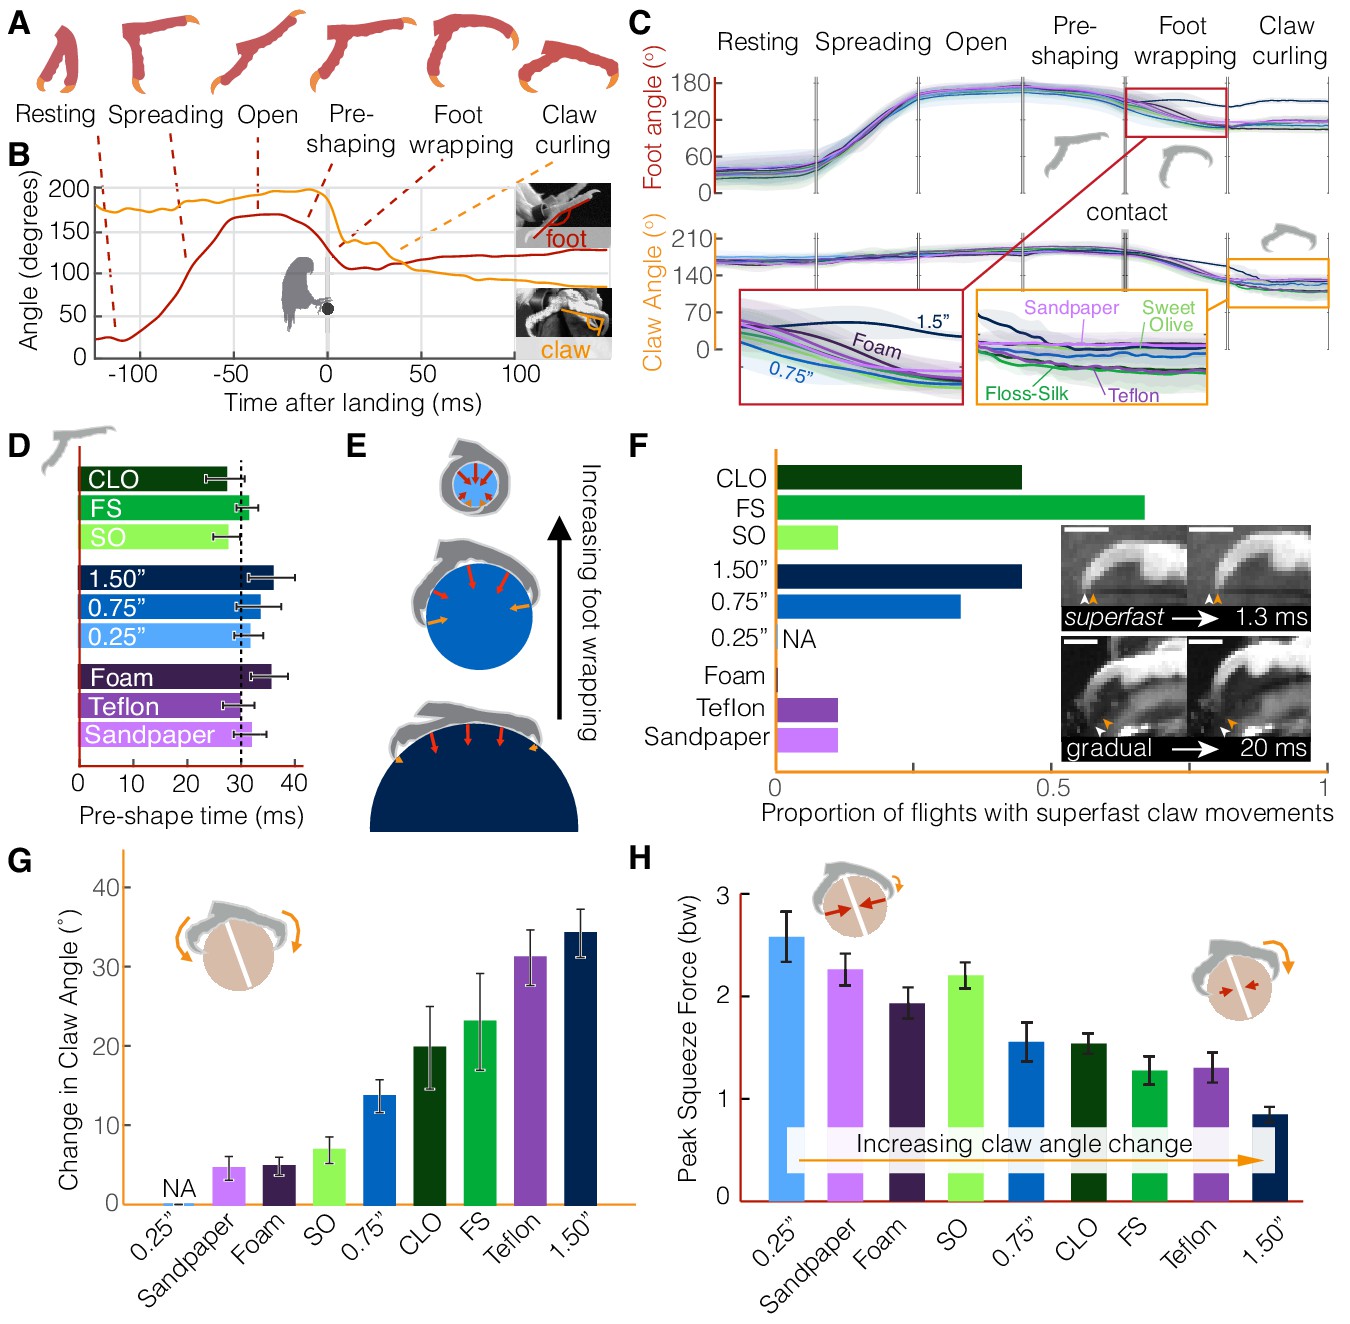
Parrotlets exhibit a stereotyped set of landing stages with their feet, yielding similar kinematics while in the air but surface-specific kinematics upon touchdown.
(A) Avatars illustrate the phases of the feet during landing. The beginning and end of each phase are determined from (B) traces of the foot and claw angles (shown here for a representative flight). (C) Mean ± SD (N = 3 birds, n = 3 flights per bird) traces for each perch variation show how foot and claw kinematics are not surface dependent before touchdown but diverge after contact. Specifically, the insets illustrate how there is less foot wrapping on the large perch and more claw curling on the perches that are harder to grasp. Phase durations varied between flights, so the horizontal time axis is normalized for each phase. Traces for the 0.25" perch are not shown after contact, when the distal toepads and claws became obscured. (D) The time over which birds pre-shape their feet before touchdown suggests that parrotlets have predictive control resolution within approximately 30 ms. (E) After contact, the small 0.25" diameter perch enables more foot wrapping (>110% perch circumference) than the 0.75" perch (~50% perch circumference). The increased surface coverage enables birds to leverage normal forces in a larger range of directions around the perch. In contrast, the birds’ feet reach less than 25% around the perch circumference on the larger 1.5" diameter perch. The diagrams show speculated gripping force vectors to illustrate how perch diameter may affect foot anchoring. (F) Claw curling motions can be gradual (on the order of 10–100 ms) or superfast (on the order of 1 ms), which suggests that potential energy stored in tendon elasticity may drive high speed claw movements. Superfast claw movements occur less frequently on rougher and smoother surfaces and did not occur on foam. Insets show superfast claw curling on the large diameter perch (upper) and gradual claw curling on the Teflon perch (lower). Arrows indicate the claw position before (white) and after (orange) claw tip motion and the scale bars are approximately 3.0 mm. (G) Parrotlets curl their claws most on the large diameter and Teflon covered perches and least on the sandpaper, Sweet Olive Tree, and foam-covered perches (NA: not applicable). These claw curling trends, taken together with (H) the peak squeeze forces from both feet, suggest that parrotlets curl their claws more on surfaces that are harder to squeeze. Bars show mean ± SEM for N = 3 birds, n = 3 flights per bird.
Figure 3—figure supplement 1

Superfast claw movements by bird.
While there was variation between birds in the number of landings during which superfast claw movements occurred, the superfast claw movements did occur for all of the birds.
Figure 3—figure supplement 2

Time to minimum claw angle in the curl stage.
The time to minimum claw angle during the claw curl stage was highly variable, ranging from just a few milliseconds to hundreds of milliseconds. Colors indicate the different surfaces.
Figure 3—figure supplement 3
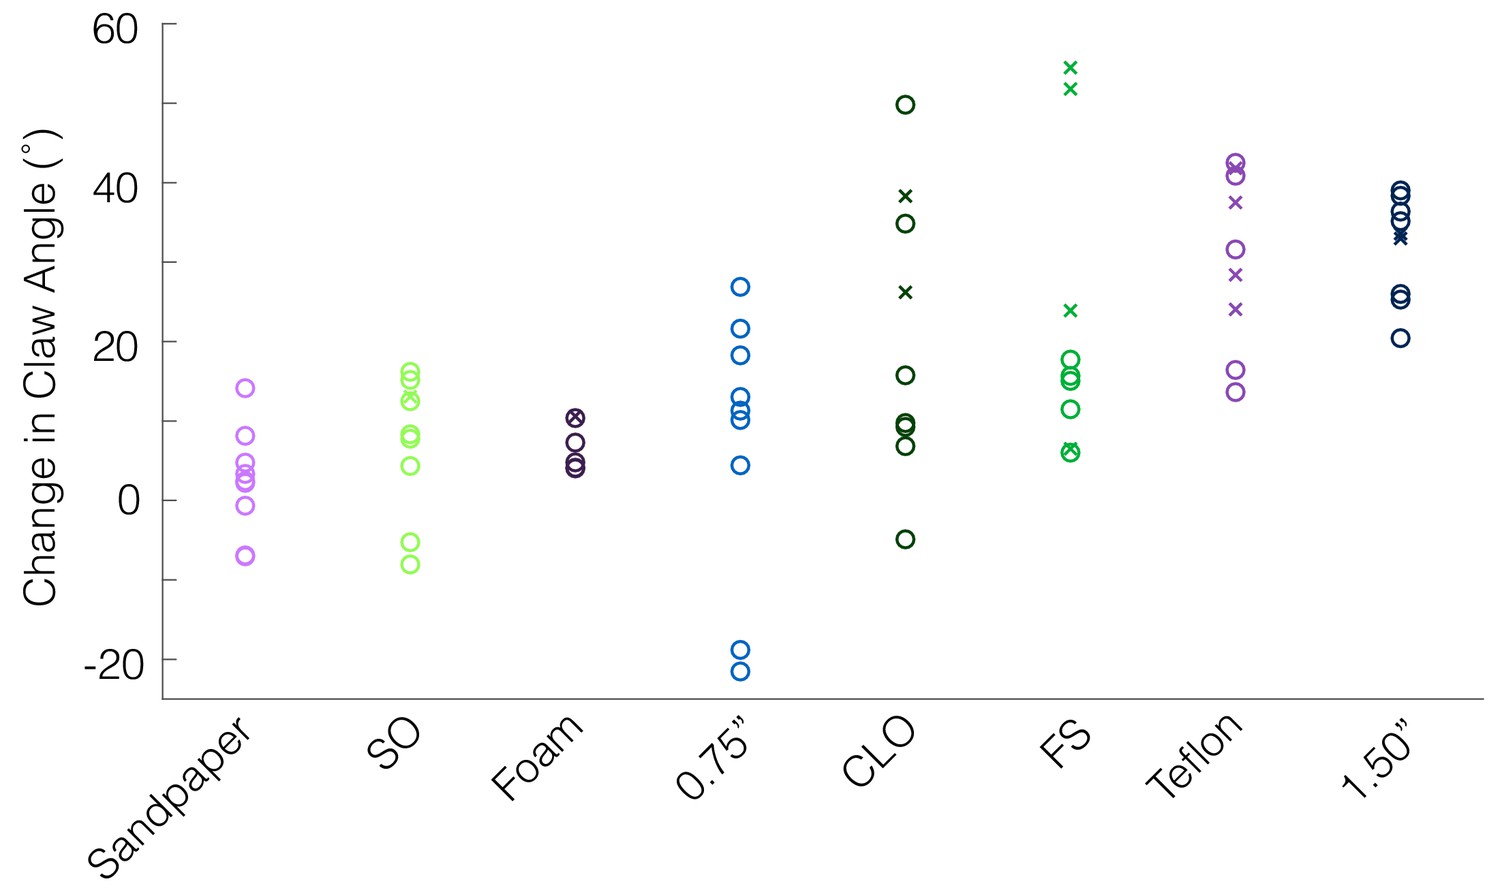
Claw curling in the front vs. rear claws.
As described in the Materials and methods, if a bird overshot the perch during landing, the rear claw was selected for tracking claw kinematics, and if the bird undershot the perch, the front claw was selected. If there was no clear overshoot or undershoot, the front claw was selected. Plotting claw angle changes on each surface according to which claw was tracked (front claw = ‘o’, rear claw = ‘x’), we observe no consistent differences between the two claws.
Figure 4
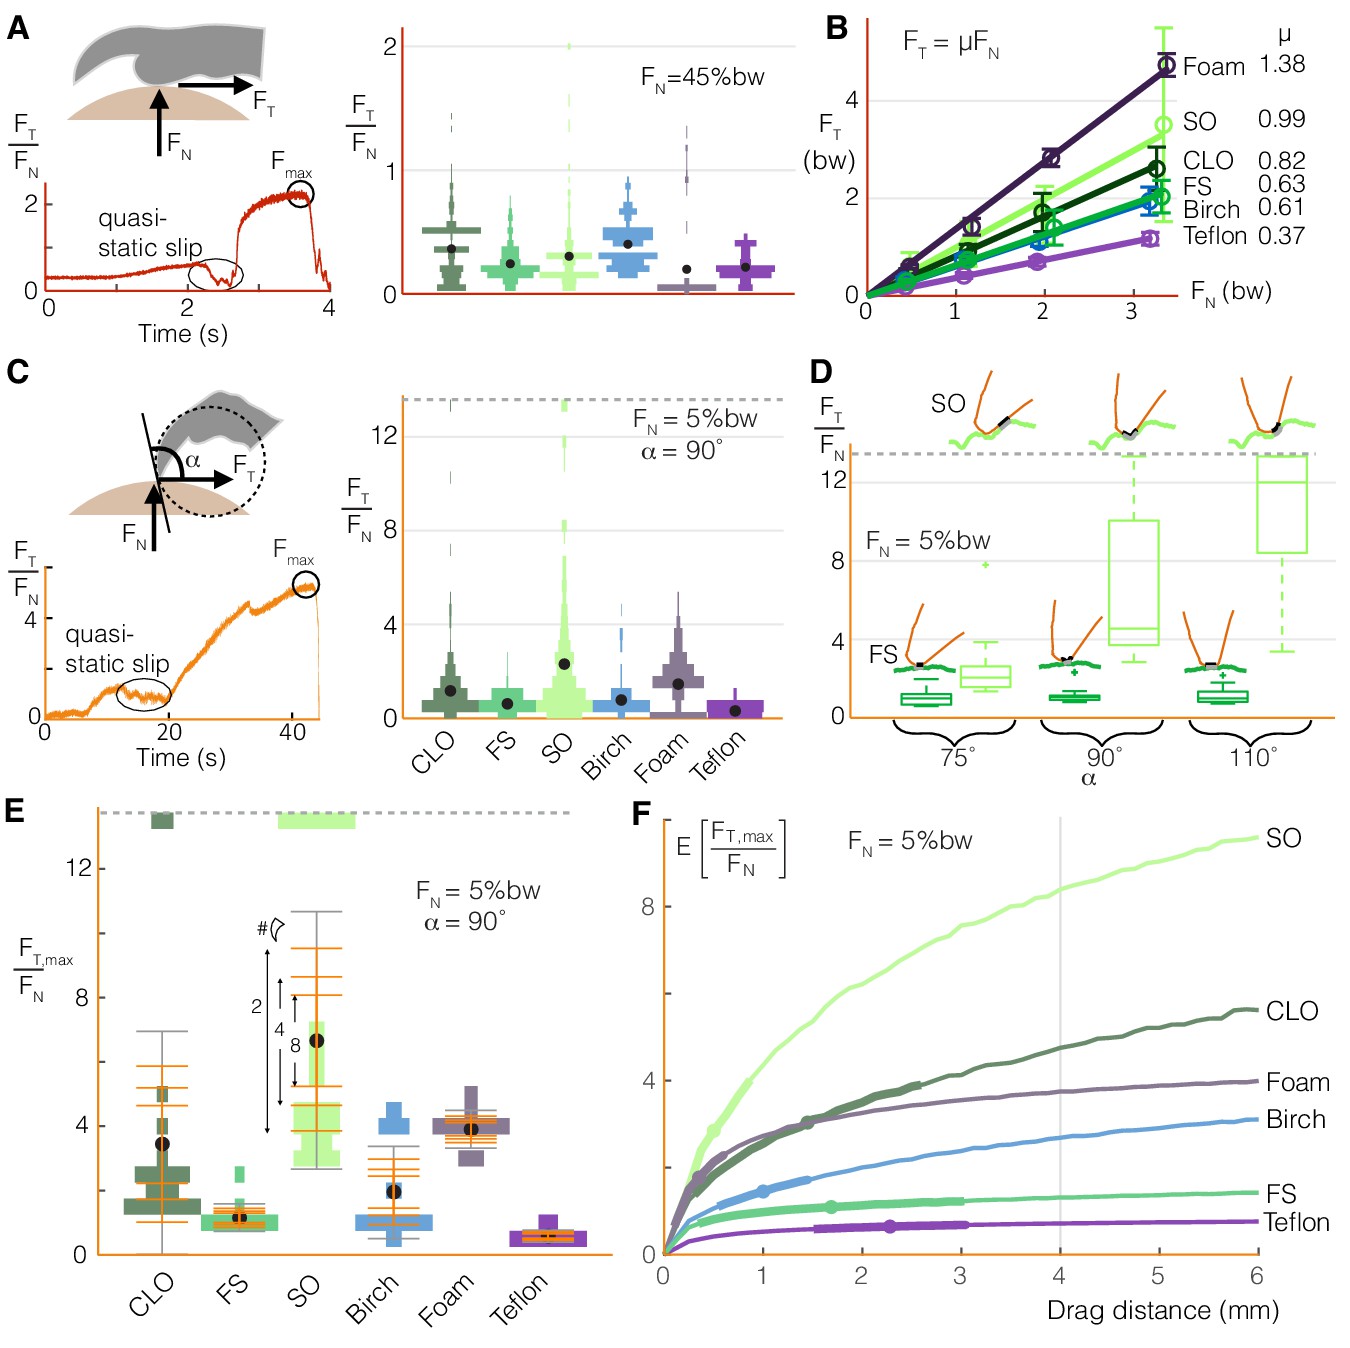
Birds can stably grasp different surfaces by modulating normal force on toe pads to generate predictable friction, and by dragging multiple claws to compensate for the variable nature of claw friction.
(A) Toe pads slip and stick when dragged along a surface, as shown by the tangential force (friction) to normal force ratio, FT/FN, over time for a representative test. The violin plot illustrates the distribution of FT/FN values immediately before slip events (bw = bodyweight, ddrag = 5 mm) for Coast Live Oak (CLO), Floss Silk (FS), Sweet Olive (SO), birch, foam, and Teflon. Sandpaper, which yielded unnaturally high wear on claws and toe pads during pilot tests, was omitted from this testing. The number of peaks gives an estimate of the number of usable asperities, and the force before slip indicates how much friction those asperities provide. (B) Maximum friction values sustained at different normal forces demonstrate that toe pad friction is surface dependent and well described by a Coulomb friction model. Circles and error bars show mean ± SD for nnatural = 10 (trials for natural surfaces), nartificial = 5 (trials for artificial surfaces). (C) Claws also slip and stick, as shown for a representative quasi-static drag test (see Materials and methods), but reach higher FT/FN ratios with greater variance than toe pads (nnatural = 20, nartificial = 10). (D) Max FT/FN values, which approximate the friction a bird can expect from claw curling, increase with the angle between the claw and surface (α) on the roughest natural surface (SO), but remain relatively constant on the smoothest (FS). Diagrams in D show claws at the microscopic level to illustrate how α (defined at the macroscopic level shown in C) affects interactions with surface asperities. (E) To compensate for variability in max claw friction, birds may leverage load sharing over multiple claws. Standard deviation bars based on sampling more claws from the single claw distributions, and averaging the force they produce, show that (as expected) the spread of the average claw force gets smaller as more claws contribute to generating force. Gray error bars show SD for the single claw distributions. Dashed lines in (C-E) show the max FT/FN cutoff used to avoid claw damage during testing. (F) Birds can further improve available claw friction by increasing drag distance. The expected value of the maximum tangential to normal force ratio is denoted as E[FT,max/FN]. Dots and bolded segments of the curves denote estimated mean ± SD parrotlet claw drag distances, respectively, for each surface if the foot did not slip (see Materials and methods). The gray line indicates the estimated average drag length when landing, which was used for friction testing.
Figure 5 with 4 supplements
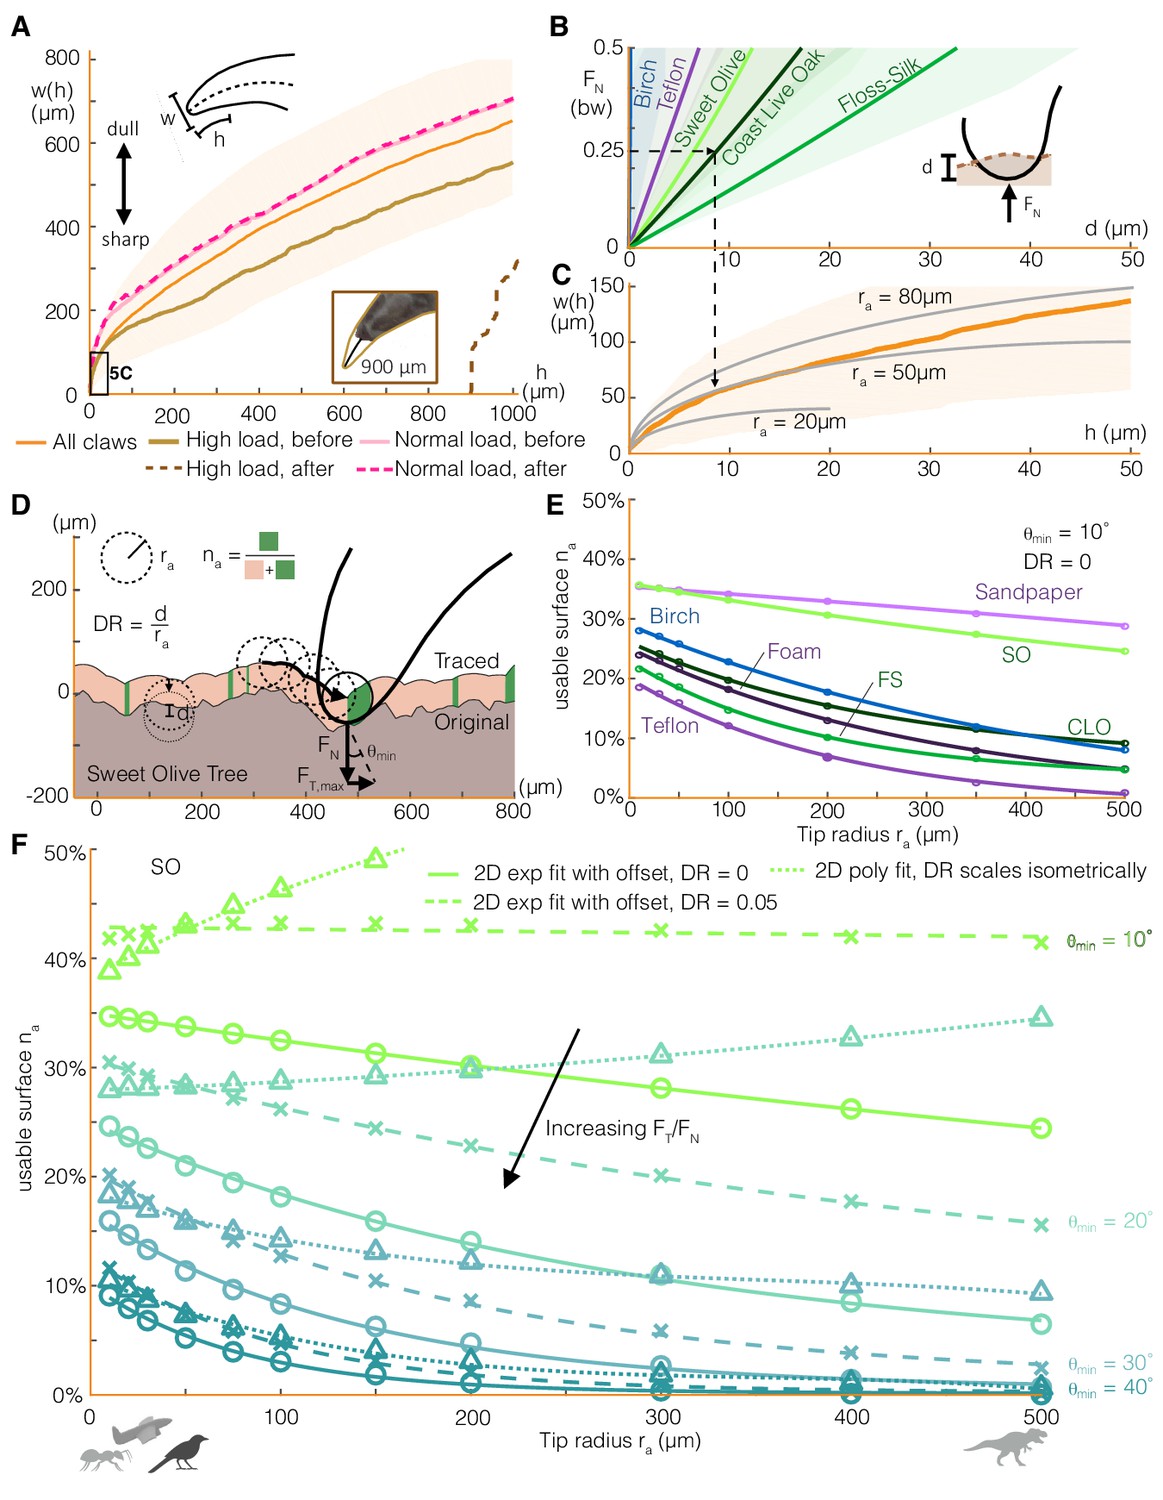
Claw-surface interactions can be modeled using a spherical claw tip, the size and depth of which relates nonlinearly to the number of usable surface asperities.
(A) We characterize parrotlet claw geometry using width (w) as a function of height from the claw tip (h) in the sagittal plane. Testing within force limits expected during normal use (normal force FN = 25% bw) yielded no noticeable wear. In contrast, higher loads significantly altered claw geometry (see inset photo, FN = 300% bw). (B) The depth of surface deformation due to claw penetration is small compared to claw geometry (see Surface deformation tests in Materials and methods). This enables us to model claw-surface interaction geometry using a spherical claw tip (C). For example, the dashed arrows show that at FN = 25% bw on Coast Live Oak, the claw tip is well approximated by a tip radius ra of 50 μm. Bold lines and shading show mean ± SD for nnatural = 20, nartificial = 10 tests in (B) and n = 32 claws in (A) and (C). (D) We simulate claws with different ra dragging along measured 2D surface profiles. Surface engagement is quantified by the usable surface (na), the proportion of the surface profile where static friction can be maintained. We also vary the depth ratio (DR, surface deformation depth divided by ra) and the minimum contact angle (θmin) required to maintain static friction. (E) Rougher surfaces (Figure 1A) tend to have more usable surface (DR = 0, θmin = 10°). The relationship between ra and na for all surfaces is well approximated by an exponential fit with an offset. (F) Smaller θmin amplify the effect of surface penetration, which increases usable surface, as shown by the growing discrepancy between the curves that account for surface penetration versus those that do not (DR = 0) for the Sweet Olive surface. Circles denote simulation results for DR = 0, and X’s show DR = 0.05, which was estimated to be a reasonable value for a parrotlet landing (see Materials and methods). When depth ratio scales isometrically (triangles), the trends are flattened or even reverse for low θmin. Thus when steeper surface features are required, smaller animals and perching robots with lower claw tip radii tend to have more usable surface than larger animals (silhouettes show approximate tip radii scale for associated animals and a perching aerial robot), but the trend reverses when shallow asperities are sufficient.
Figure 5—figure supplement 1
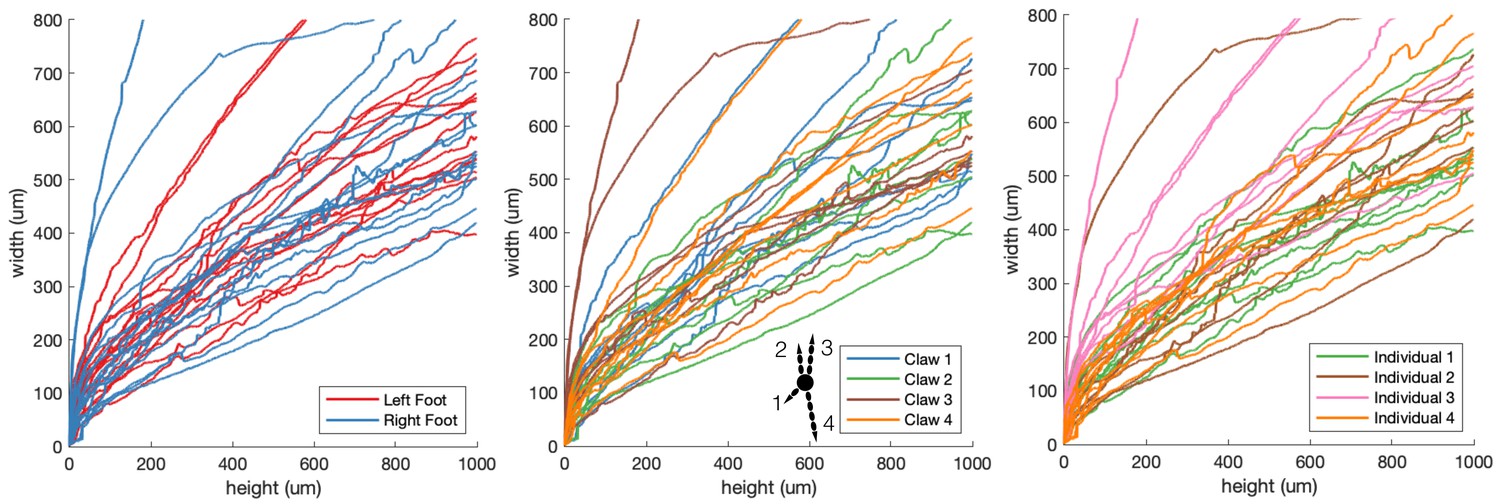
Claw shape trends.
Claw width vs. height curves are colored based on (A) the originating individual, (B) the originating foot (red = right foot, blue = left foot), (C) claw number. There were no noticeable trends across individuals, claws on different feet, or claws on toes of different length.
Figure 5—figure supplement 2

Surface deformation analysis.
(A) Surface deformation data for all surfaces including foam and sandpaper. As described in the Materials and methods, to limit the effect of sensor noise on our measurements, we tested at higher normal force levels (0.5–3 bw), and then (B) applied a cubic fit constrained at the origin to estimate penetration at low force levels (0–0.5 bw, see Figure 4B).
Figure 5—figure supplement 3
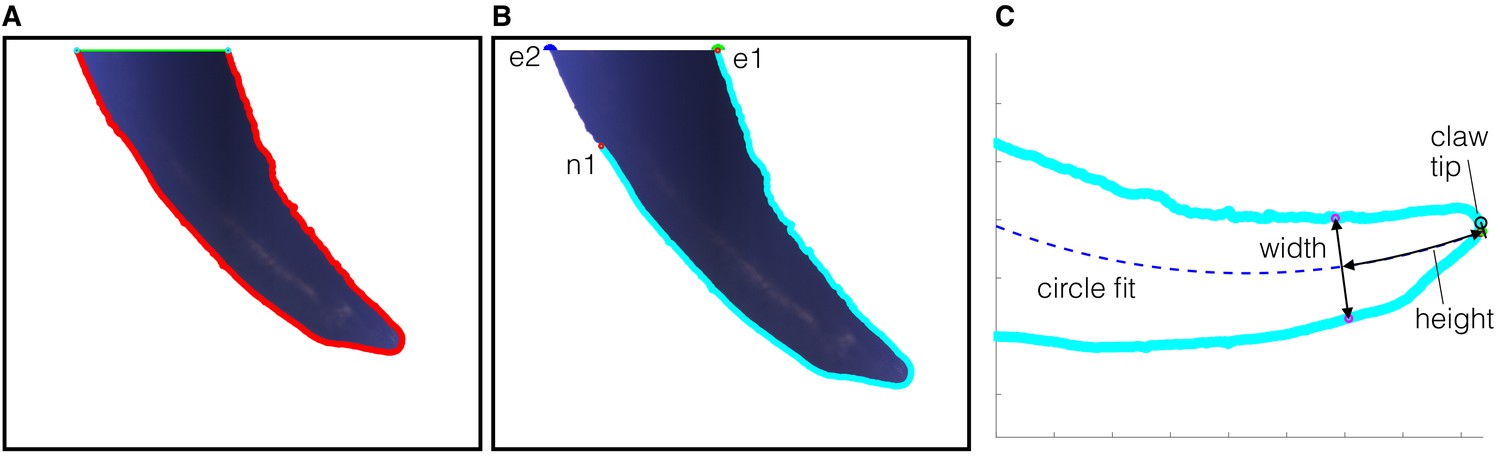
Claw morphological measurement steps.
After the photo of a claw was taken (see Materials and methods), the resulting image was processed in MATLAB using the following steps. (A) A claw boundary is identified through image processing, and the segment of the boundary that falls on the edge of the image is automatically removed. (B) We next trim the boundary further to obtain a portion of the claw that can undergo function fitting without being affected by how the claw was originally cropped during imaging. We start by assuming both sides of the claw follow a circular arc, which is an established technique for describing claws (Pike and Maitland, 1999; Feduccia, 1993). The center of the claw is also a circular arc, which traces the midpoints of the shortest distance line segments between both sides. We select the portion of the claw from the tip to the most proximal point (relative to the foot) on the claw where this center arc is still defined. Specifically, for both endpoints where the claw was cropped, we found the distance to the nearest point on the opposite side. The endpoint with the shorter distance to the nearest point was selected to be the anchor (e1) with nearest point (n1). The other edge was trimmed from the other endpoint (e2) up to n1. (C) Next, a circular arc is fit through the center of the cropped claw. The tip of the claw is defined to be the most distal point of the claw that intersects the perpendicular to the tangent of the circle fit. The measurement algorithm starts at the tip of the claw and makes incremental steps along the circle fit toward the base of the claw. At each step, the height is the path length along the circle fit from the tip to the current location. The width is determined by the length of a line with endpoints on both sides of the claw that is perpendicular to the tangent of the circle fit at the current location.
Figure 5—figure supplement 4
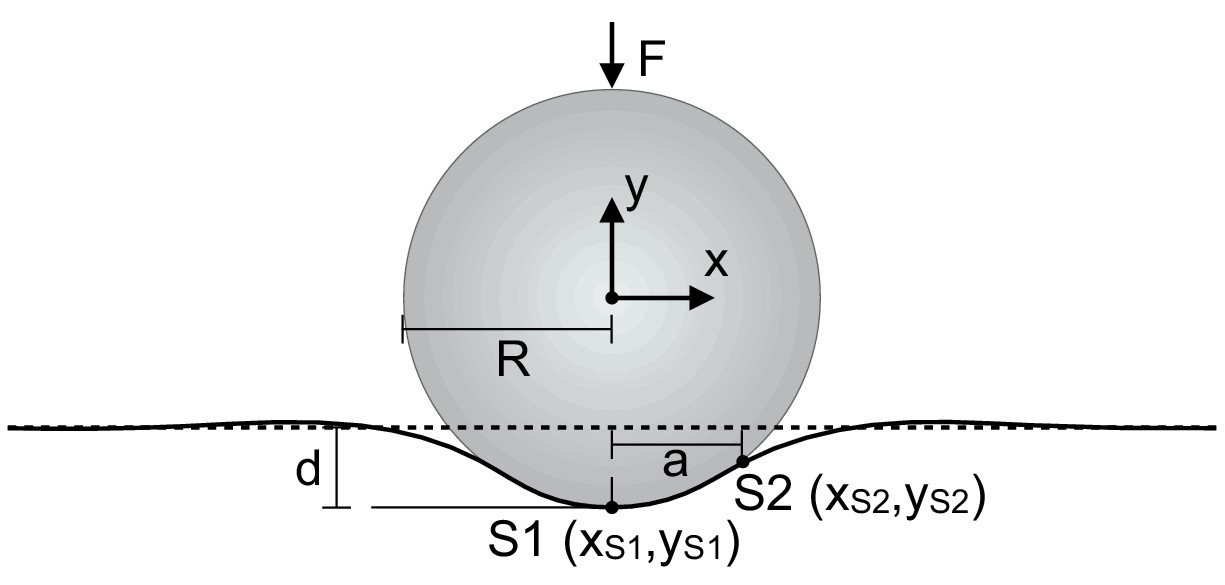
Claw-surface contact model.
To model the effect of surface deformation on usable surface, we modeled the claw-surface interaction as a rigid circle (the claw tip) with radius R, contacting an elastic half-space (the surface). We then found the slope from the end of the claw tip (S1) to the highest contact point with the surface (S2). As described above, the angle of this slope was used to adjust the requirement for the minimum angle necessary to maintain static friction. Figure adapted from Contact of an elastic sphere with an elastic half-space by Bricolux and licensed under CC BY-SA 4.0.
Figure 6
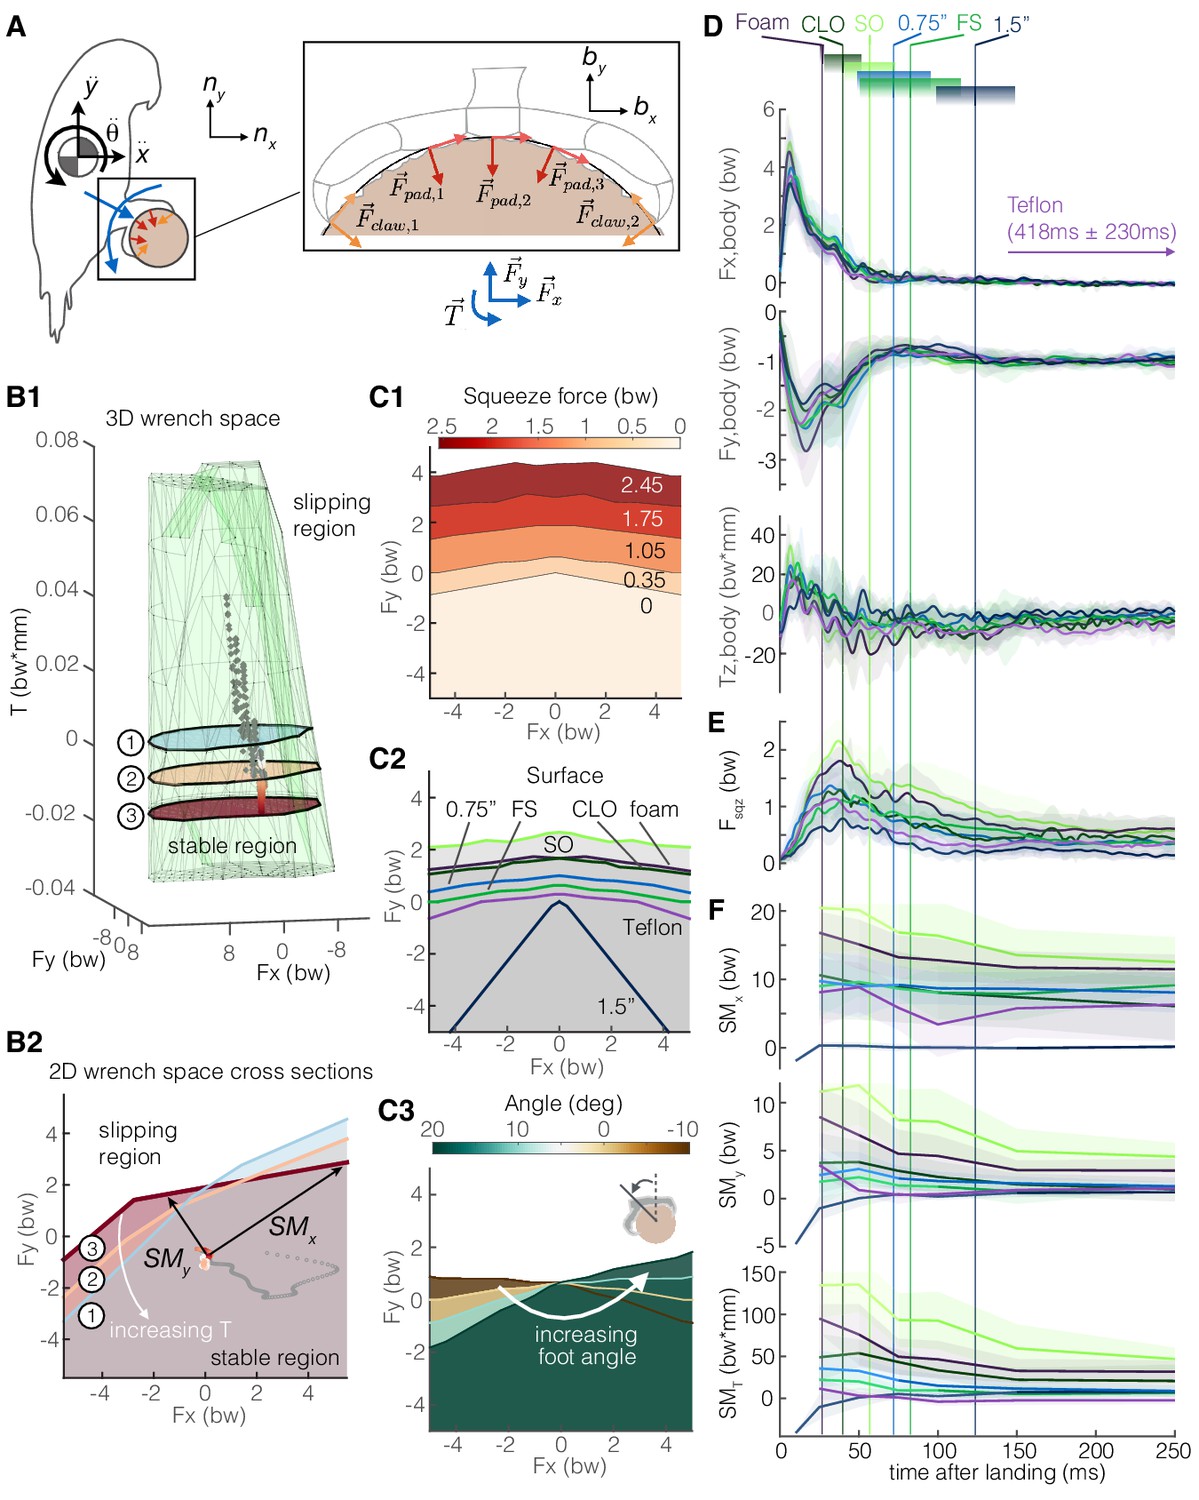
Adaptive grasping strategies that balance safety margin and required muscular squeeze force enable parrotlets to land reliably on variable surfaces.
(A) We model the parrotlet as a 2D rigid body, where forces (Fx, Fy) and torques (Tz) on the body must be matched by friction forces between the perch surface and the feet and claws. (B1) By integrating our experimental data on the foot-surface contact mechanics (Figures 3–5), we use constrained optimization to generate a 3D wrench space in which birds can maintain a static grasp. (B2) 2D force plane cross-sections show how torque twists the wrench space. Forces from a single representative parrotlet flight are overlaid on the 3D (B1) and 2D (B2) plots, where colored points indicate static grasping and gray indicates slipping. We define safety margins (SMx, SMy, SMT) in each direction of the foot reference frame (bx, by, bz) as the distance from the experimental data to the nearest static grasp region boundary in that direction (SMT, not shown, extends out of plane). The stable region expands with more squeeze force (C1) and available friction on different surfaces (C2). (C3) The stable region also rotates with the foot’s position on the perch. Aligning the stereotyped body force data (D), surface-dependent squeeze force data (E), and safety margins (F), we find that birds employ a landing strategy that balances safety margin and muscular squeeze force. The slow decay in the safety margins for most of the surfaces indicate that birds initially overcompensate after touchdown (prioritizing safety), and then slowly relax to equilibrium (prioritizing low muscular squeeze effort). Vertical lines and gradient blocks denote the average ± SD time at which birds stopped slipping on each surface. The safety margin (F) is plotted only when all claws were in contact with the surface.
Videos
Video 1
Representative landings on the nine tested perches.
https://doi.org/10.7554/eLife.46415.004
Video 2
Stereotyped landing phases (aerial, absorption, anchoring, adjustments) exhibited on each perch.
https://doi.org/10.7554/eLife.46415.006Additional files
-
Supplementary file 1
Supplementary tables.
(A) Surface roughness parameters. Roughness parameters are based on processing 3D scans of each surface (see Materials and methods). (B) Individual foot preferences and adjustments during landing. Just as humans exhibit hand preference, birds appear to employ a dominant foot when carrying out different tasks. A previous study considered foot dominance in the context of manipulating food and found that approximately 50% of the parrots studied were left-footed, 25% were right-footed, and the remaining were ambidextrous (Magat and Brown, 2009). In our study, based on which foot contacted the perch first, we found that one bird was right footed (100% of flights) while the other two were left footed (83% and 85% of flights). We also looked at how the birds adjusted their feet after making initial contact. The first foot to move was the dominant foot for two individuals, but not for the third. In addition, we found that the first foot adjustment was primarily in the forward direction (92%, 83%, and 72%). (C) Parrotlet foot adjustments on each perch. Parrotlets made, on average, about two adjustments after landing. The birds adjusted their feet the most on teflon (2.78 adjustments), and the least on the 0.25" diameter birch dowel (1.33 adjustments). (D) Foot kinematics parameters. The average foot spread angle while in the resting stage was approximately 36°. When approaching the perch, the birds began to open their feet approximately 90 ms before making contact with the surface. During this time, the foot angle reached a maximum of 172° on average, and this peak typically occurred approximately 31 ms before making contact with the surface. While pre-shaping, the foot angle decreased approximately 24° on average. Before making contact with the perch, the average claw angle was 177°. After having made contact, while wrapping the perch, the foot angle dropped another 30° on average. The claw angle, on the other hand, dropped an average of 42° during this stage. The claw reached a maximum curl angle typically 85 ms after contacting the perch, though with a high standard deviation of 80 ms.
- https://doi.org/10.7554/eLife.46415.018
-
Transparent reporting form
- https://doi.org/10.7554/eLife.46415.019
Download links
A two-part list of links to download the article, or parts of the article, in various formats.
Downloads (link to download the article as PDF)
Open citations (links to open the citations from this article in various online reference manager services)
Cite this article (links to download the citations from this article in formats compatible with various reference manager tools)
Birds land reliably on complex surfaces by adapting their foot-surface interactions upon contact
eLife 8:e46415.
https://doi.org/10.7554/eLife.46415


