Antagonistic interaction between Ezh2 and Arid1a coordinates root patterning and development via Cdkn2a in mouse molars
- University of Southern California, United States
- West China Hospital of Stomatology, Sichuan University, China
Figures
Figure 1
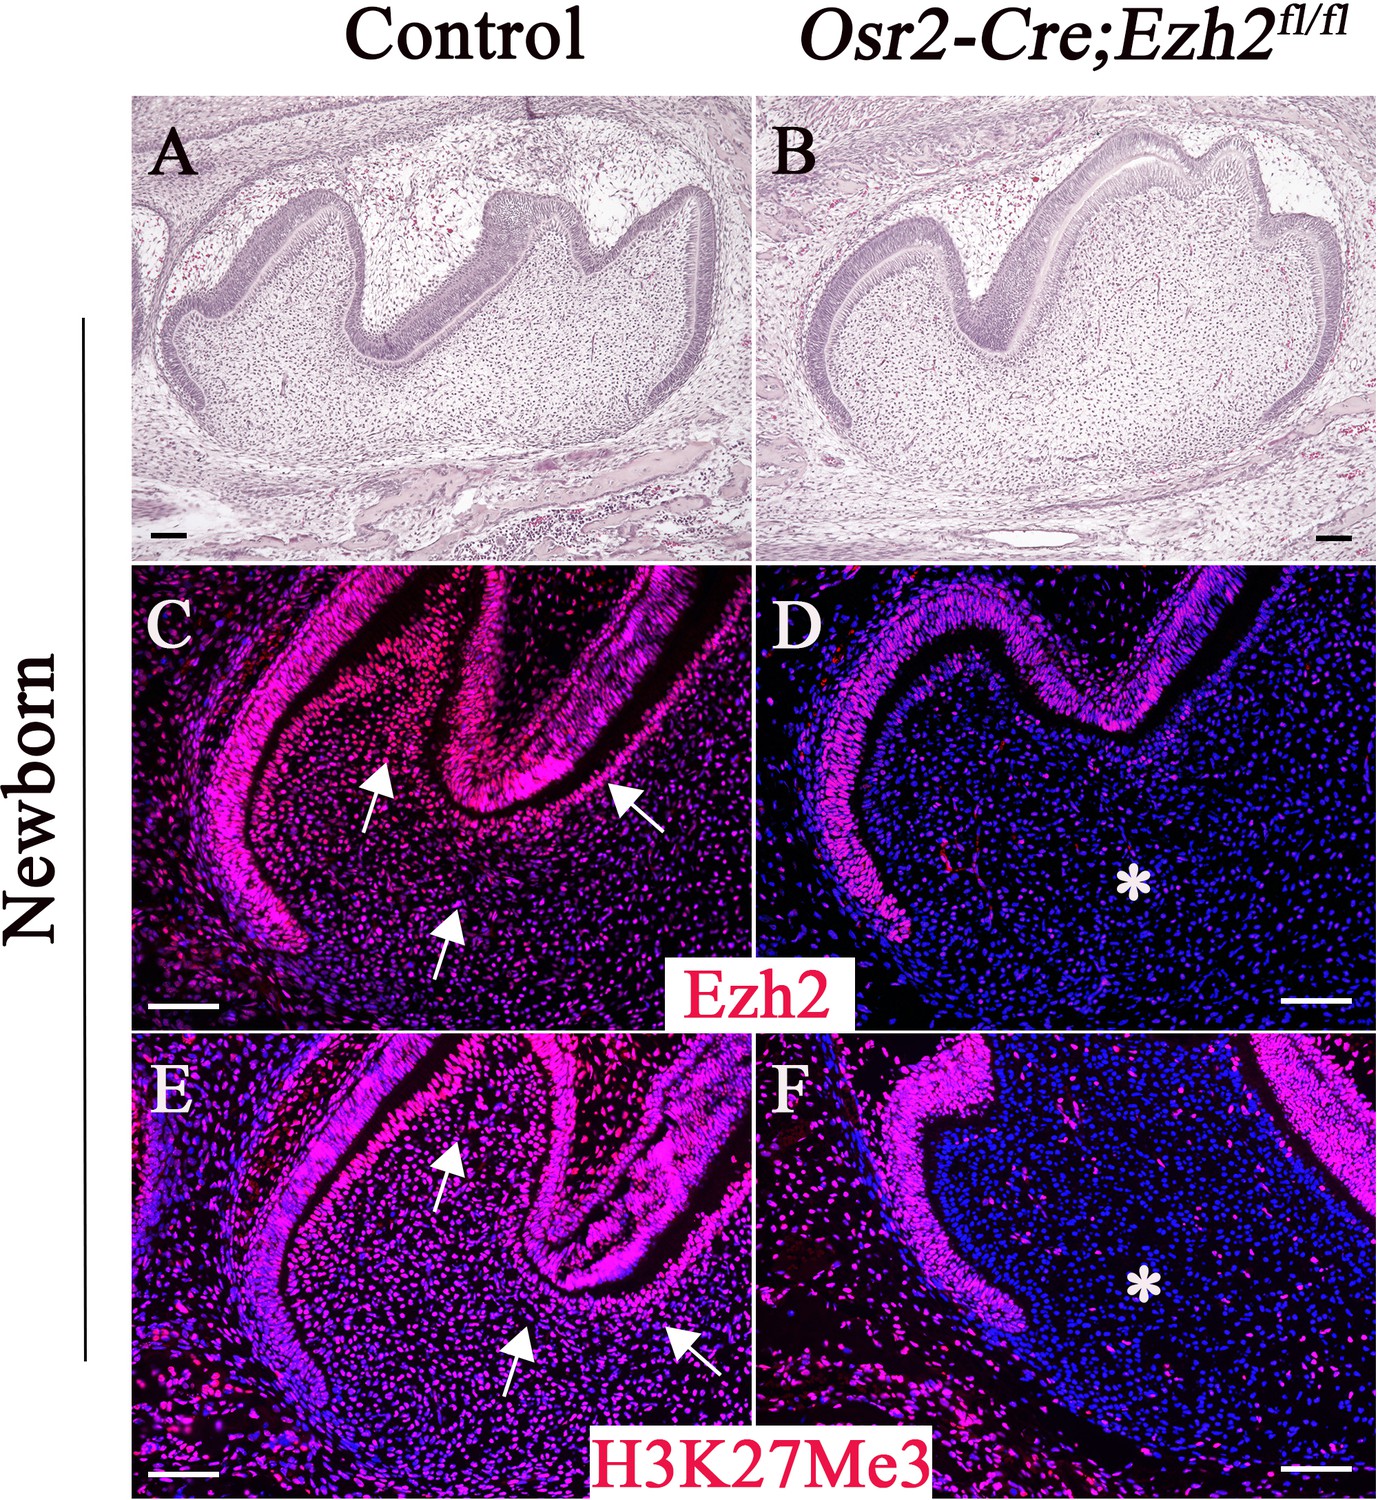
Loss of Ezh2 in the dental mesenchyme results in decreased H3K27Me3 histone methylation.
H&E staining (A–B), Ezh2 immunofluorescence (C–D), and H3K27Me3 immunofluorescence (E–F) of newborn control and Osr2-Cre;Ezh2fl/fl molars. Arrows indicate positive signal and asterisks indicate absence of signal. n ≥ 3 histological sections were examined from multiple littermate mice per group. Scale bars, 100 μm.
Figure 2 with 2 supplements
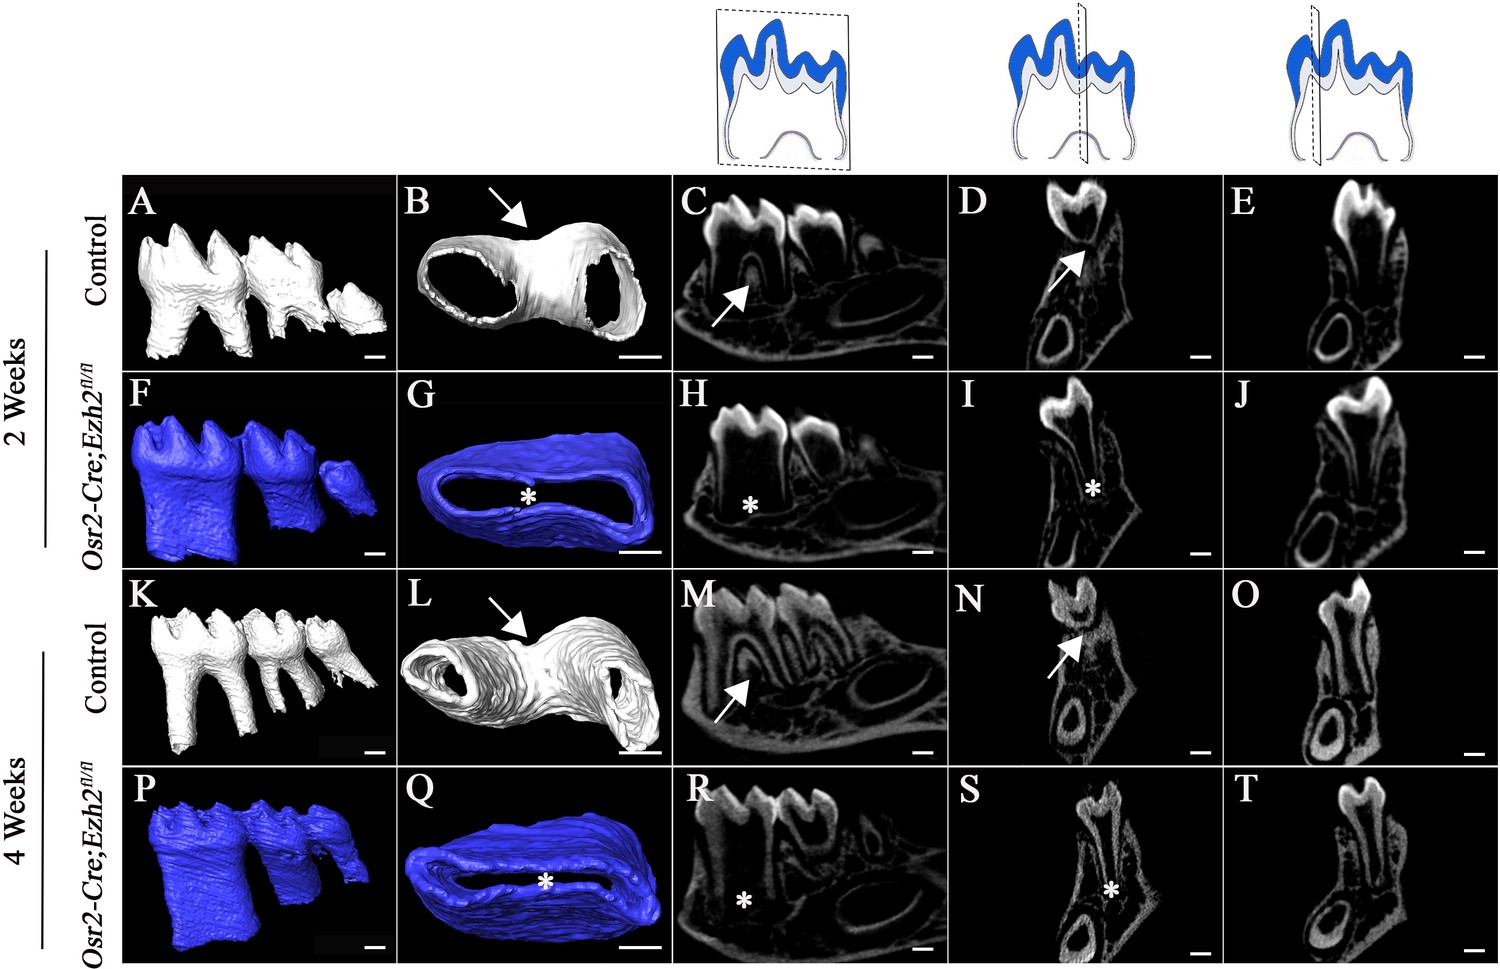
Loss of Ezh2 in the dental mesenchyme leads to single-rooted molars.
MicroCT images of control (white) and Osr2-Cre;Ezh2fl/fl (blue) molars at postnatal (PN) 2 and 4 weeks of age. A, F, K, P, lateral view of mandibular molars; B, G, L, Q, apical view of mandibular first molars; C, H, M, R, sagittal sections of mandibular molars; D, I, N, S, coronal sections of mandibular molars in the furcation region; E, J, O, T, coronal sections of mandibular molars in the root forming region. The schematic drawings indicate where the CT section were taken. Arrows indicate furcation and asterisks indicate absence of furcation. Scale bars, 200 μm.
Figure 2—figure supplement 1
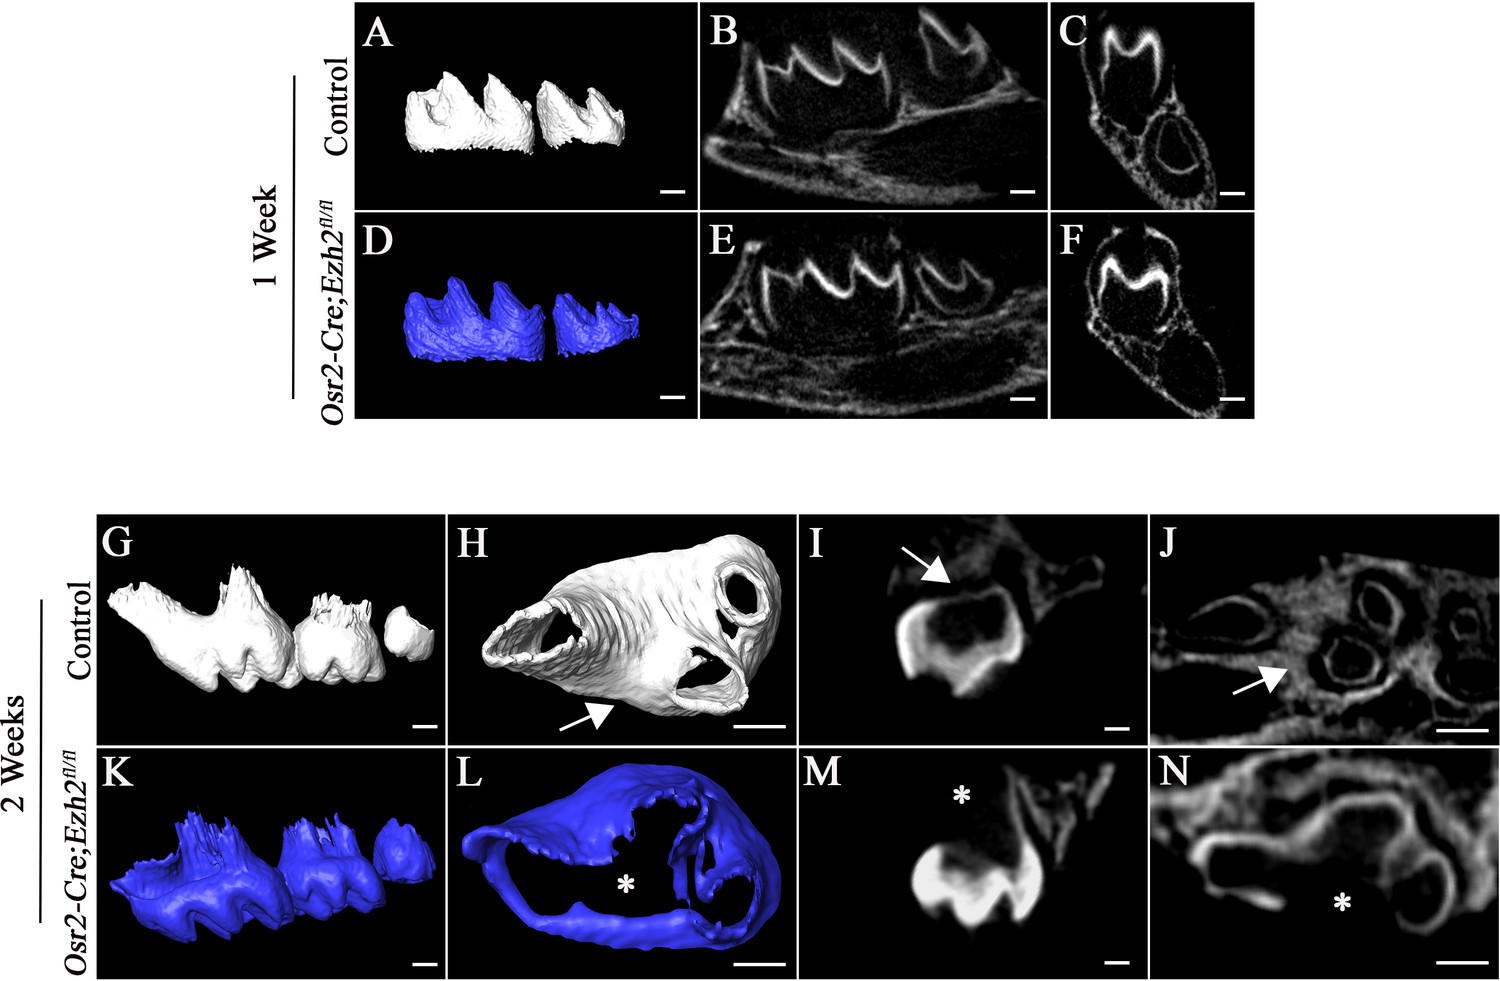
Loss of Ezh2 in the dental mesenchyme leads to single-rooted molars in the upper jaw.
(A-F) MicroCT images of control (white) and Osr2-Cre;Ezh2fl/fl (blue) mandibular molars at 1 week of age. A, D, lateral view of mandibular molars; B, E, sagittal sections of mandibular molars; C, F, coronal sections of mandibular molars; (G-N) MicroCT images of control (white) and Osr2-Cre;Ezh2fl/fl (blue) maxillary molars at 2 weeks of age. G, K, lateral view of maxillary molars; H, L, apical view of maxillary first molars; I, M, sagittal sections of maxillary molars; J, N, transverse sections of maxillary molars. Arrows indicate furcation and asterisks indicate absence of furcation. Scale bars, 200 μm.
Figure 2—figure supplement 2
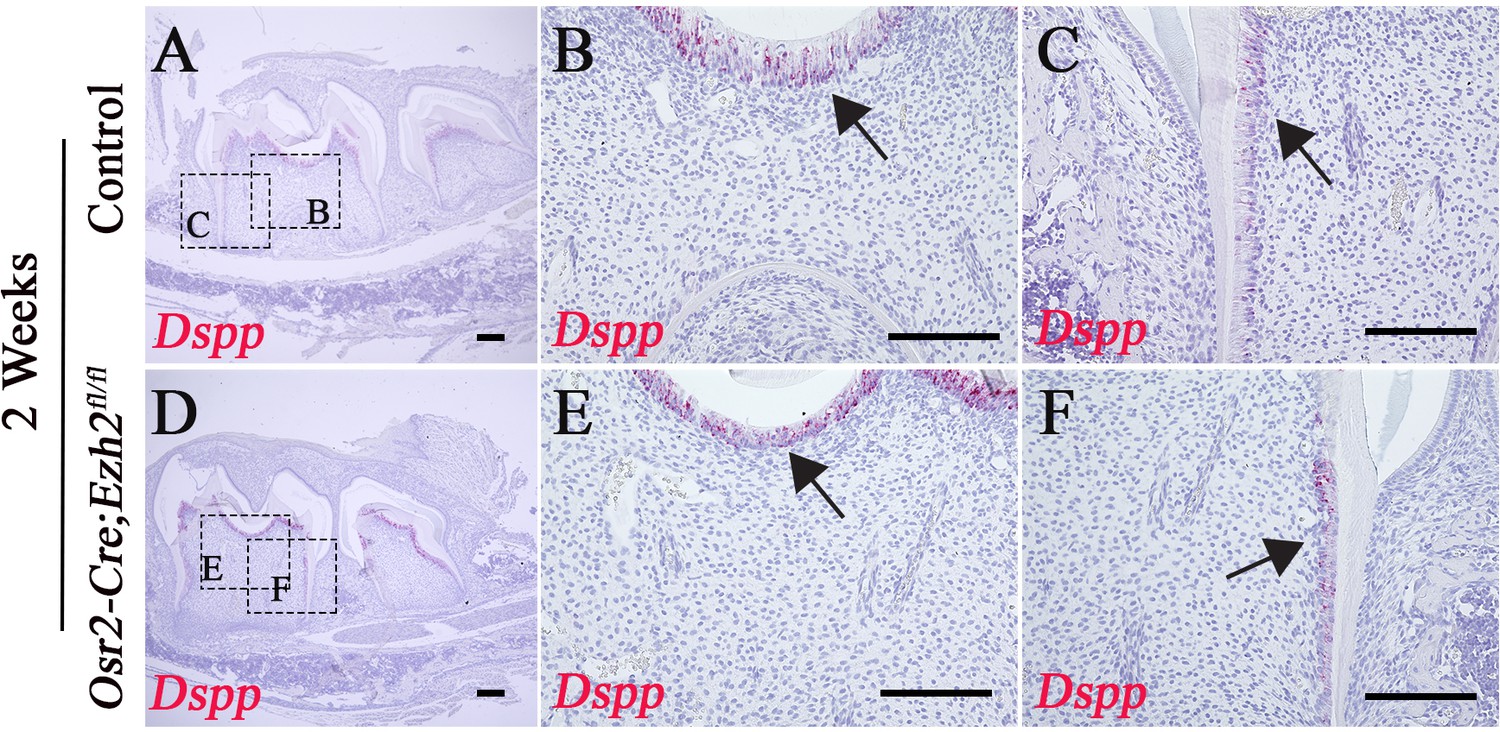
Loss of Ezh2 in the dental mesenchyme has no effect on odontoblast differentiation.
(A-F) Dspp staining of control and Osr2-Cre;Ezh2fl/fl at 2 weeks of age. Boxes in A and D are shown magnified in B, C, E, and F. Arrows indicate odontoblasts. n ≥ 3 histological sections were examined from multiple littermate mice per group. Scale bars, 100 μm.
Figure 3 with 1 supplement
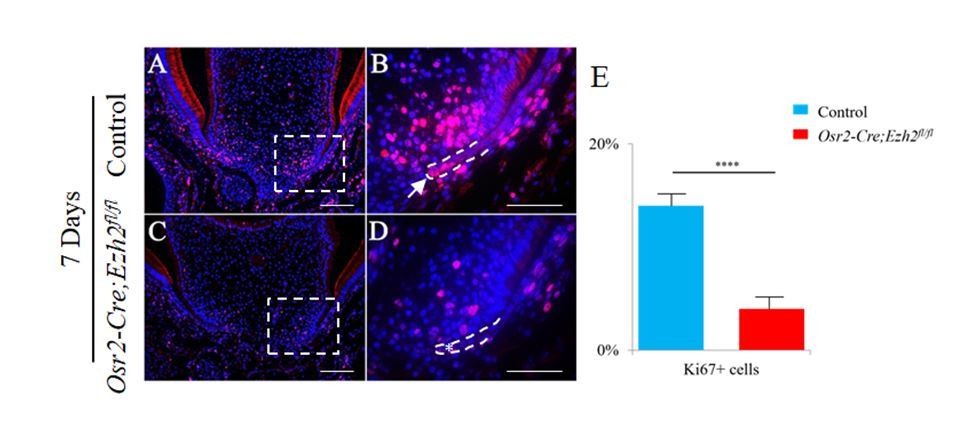
Loss of Ezh2 in the dental mesenchyme affects epithelial diaphragm formation.
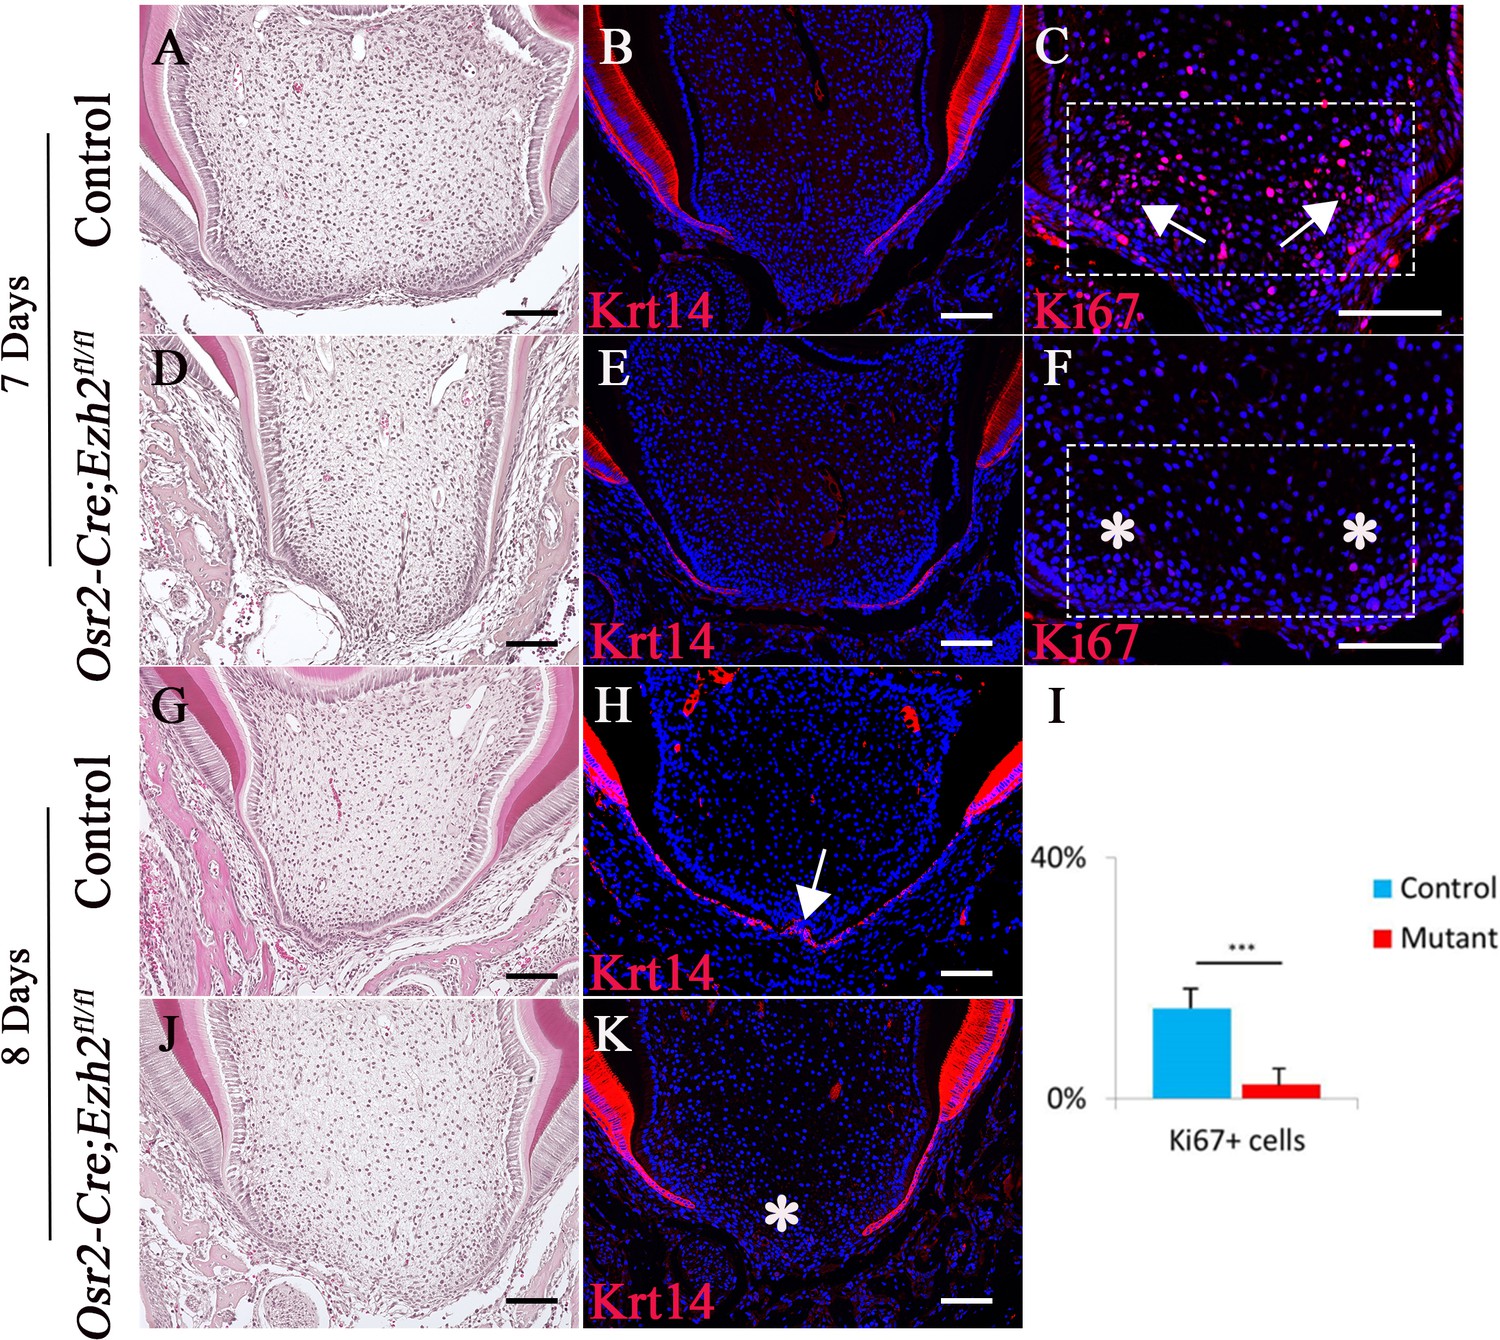
A-K, H&E staining (A, D, G, J), Krt14 immunofluorescence (B, E, H, K) and Ki67 staining (C, F) of coronal sections of control and Osr2-Cre;Ezh2fl/fl (mutant) molars at postnatal 7 days and 8 days. I, Quantitation of Ki67+ cells in boxed areas of C and F presented as mean ± SD with n = 4. Arrows indicate positive signal and asterisks indicate absence of signal. ***, p<0.001. Scale bars, 100 μm. Statistical analyses were performed using two-tailed Student’s t-test.
-
Figure 3—source data 1
Source data for Figure 3I.
- https://doi.org/10.7554/eLife.46426.009
Figure 3—figure supplement 1
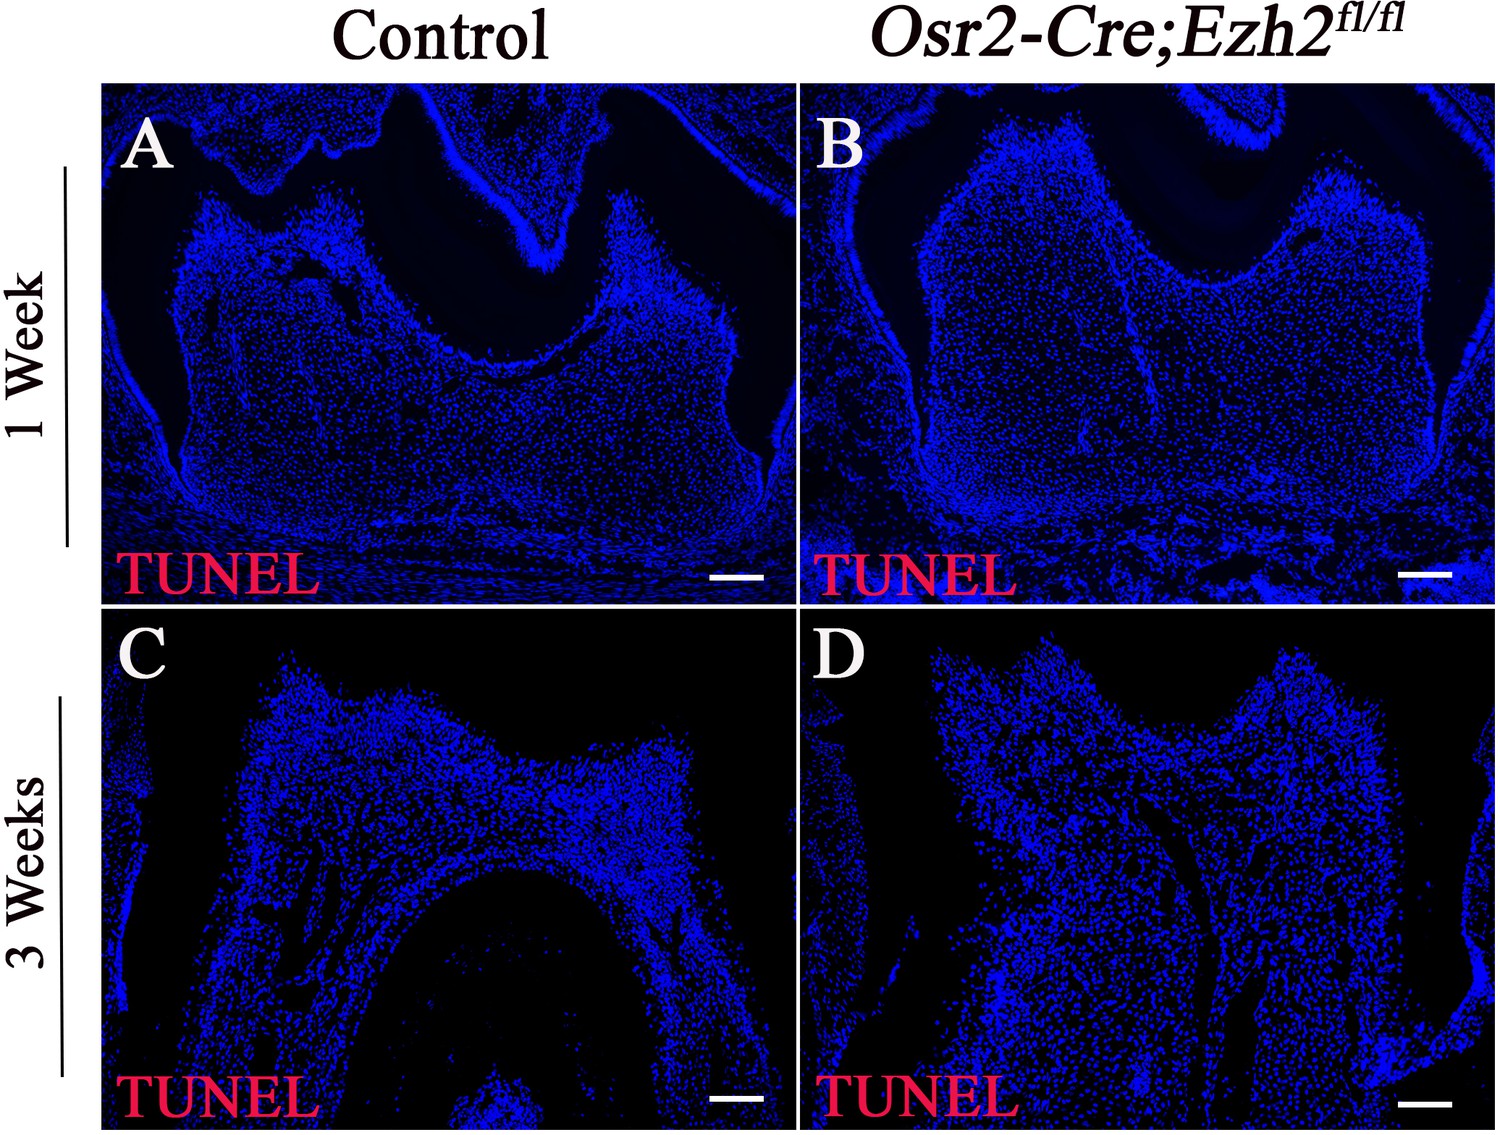
Loss of Ezh2 in the dental mesenchyme has no effect on cell survival.
(A-B) TUNEL assay of molars in control and Osr2-Cre;Ezh2fl/fl mice at PN 1 week; (C-D) TUNEL assay of molars in control and Osr2-Cre;Ezh2fl/fl mice at PN 3 weeks. n ≥ 3 histological sections were examined from multiple littermate mice per group. Scale bars, 100 μm.
Figure 4

The alveolar bone and periodontal ligament are affected in Osr2-Cre;Ezh2fl/fl molars.
(A-F) H&E staining (A, B, D, E) and Periostin immunofluorescence (C, F) of control and Osr2-Cre;Ezh2fl/fl molars at 2 weeks of age. B and E are magnified images of the boxed areas in A and D, respectively. (G-J) H&E staining of control and Osr2-Cre;Ezh2fl/fl molars at 4 weeks of age. (H and J) are magnified images of the boxed areas in G and I, respectively. Arrows indicate normal alveolar bone and asterisks indicate defective alveolar bone. n ≥ 3 histological sections were examined from multiple littermate mice per group. Scale bars, 100 μm.
Figure 5 with 3 supplements

Loss of Ezh2 in the epithelium leads to delayed furcation development.
MicroCT images of control (white) and Krt14-Cre;Ezh2fl/fl (blue) molars at 2 and 3 weeks of age. A, F, K, P, lateral view of mandibular molars; B, G, L, Q, apical view of mandibular first molars; C, H, M, R, sagittal sections of mandibular molars; D, I, N, S, coronal sections of mandibular molars in the furcation region; E, J, O, T, coronal sections of mandibular molars in the root forming region. The schematic drawings indicate where the CT section were taken. Arrows indicate furcation and asterisks indicate absence of furcation. Scale bars, 200 μm.
Figure 5—figure supplement 1
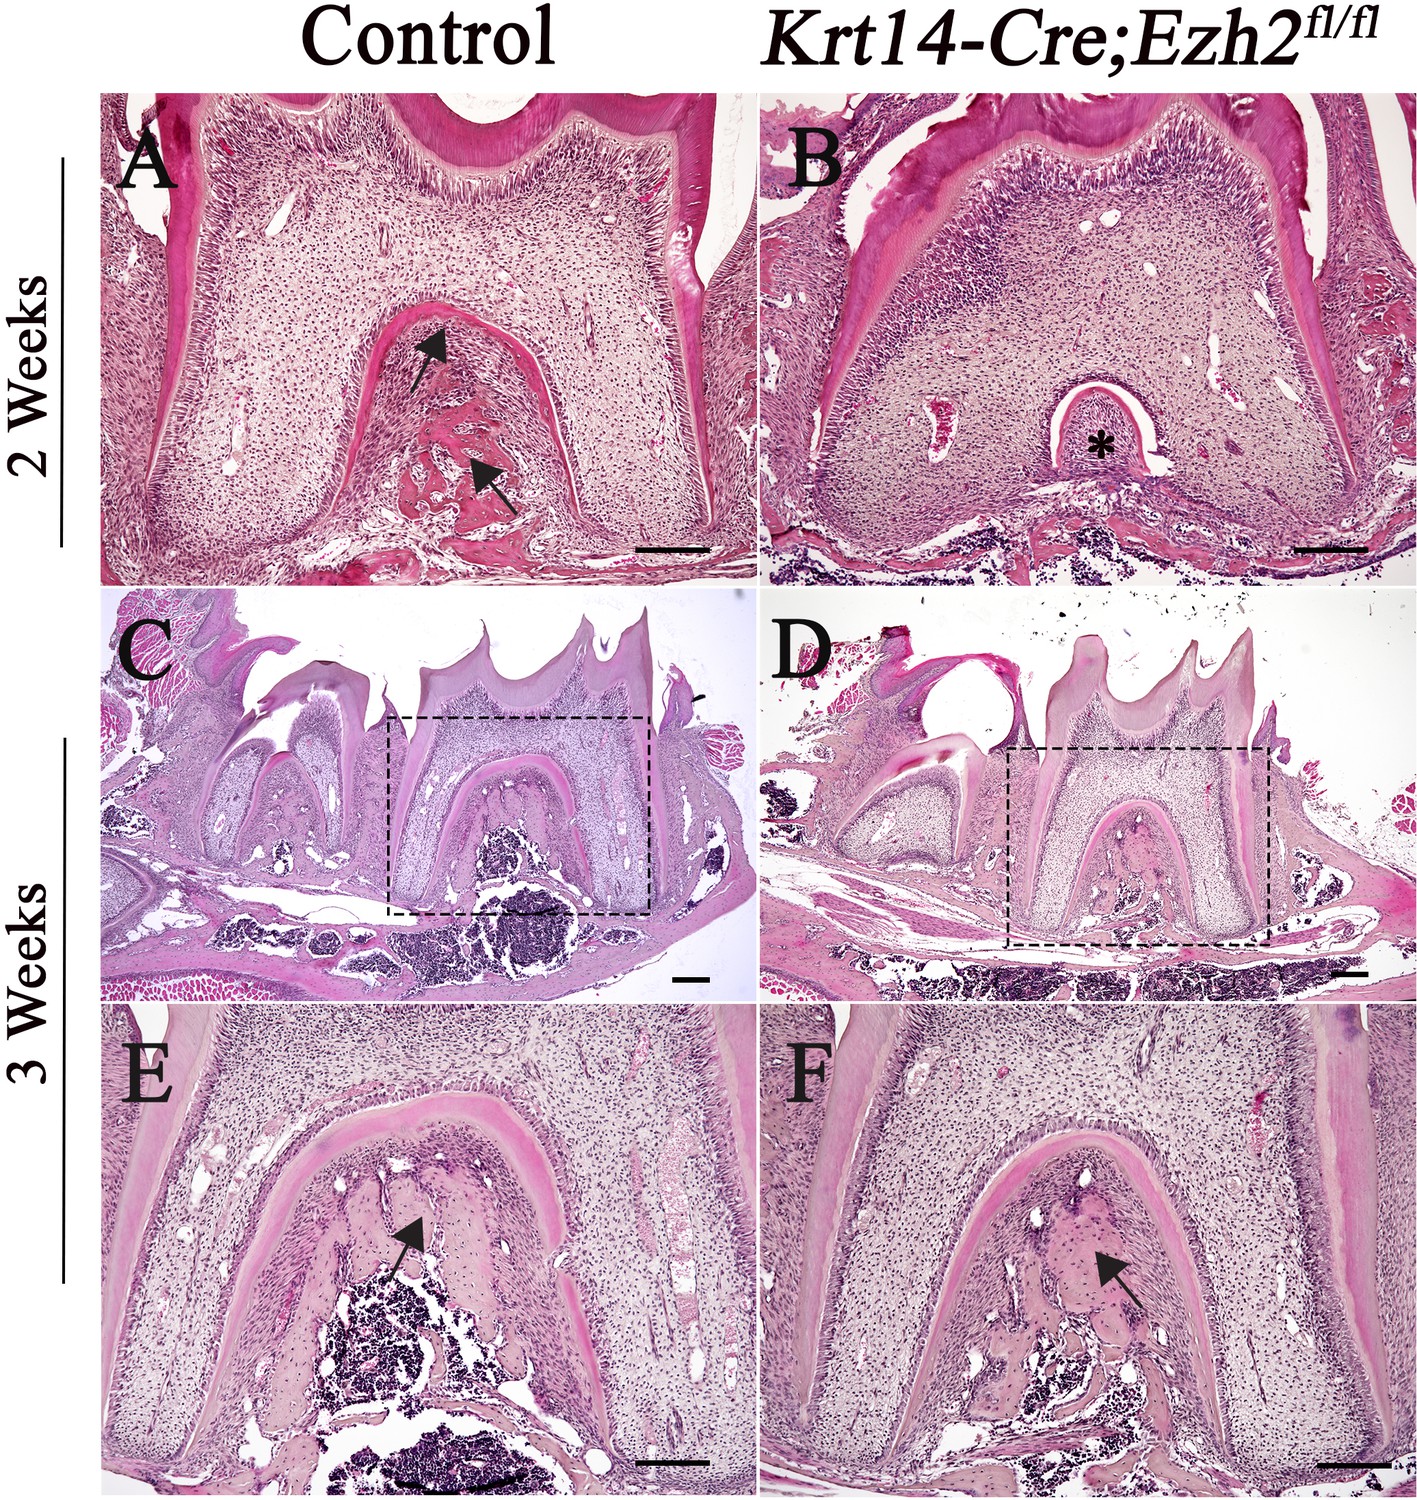
H&E staining of molars in control and Krt14-Cre;Ezh2fl/fl mice.
(A-B) H&E staining of molars from control and Krt14-Cre;Ezh2fl/fl mice at PN 2 weeks; (C-F) H&E staining of molars from control and Krt14-Cre;Ezh2fl/fl mice at PN 3 weeks. E and F are magnified images of the boxed areas in C and D, respectively. Arrows indicate alveolar bone and asterisks indicate defect of alveolar bone. n ≥ 3 histological sections were examined from multiple littermate mice per group. Scale bars, 100 μm.
Figure 5—figure supplement 2
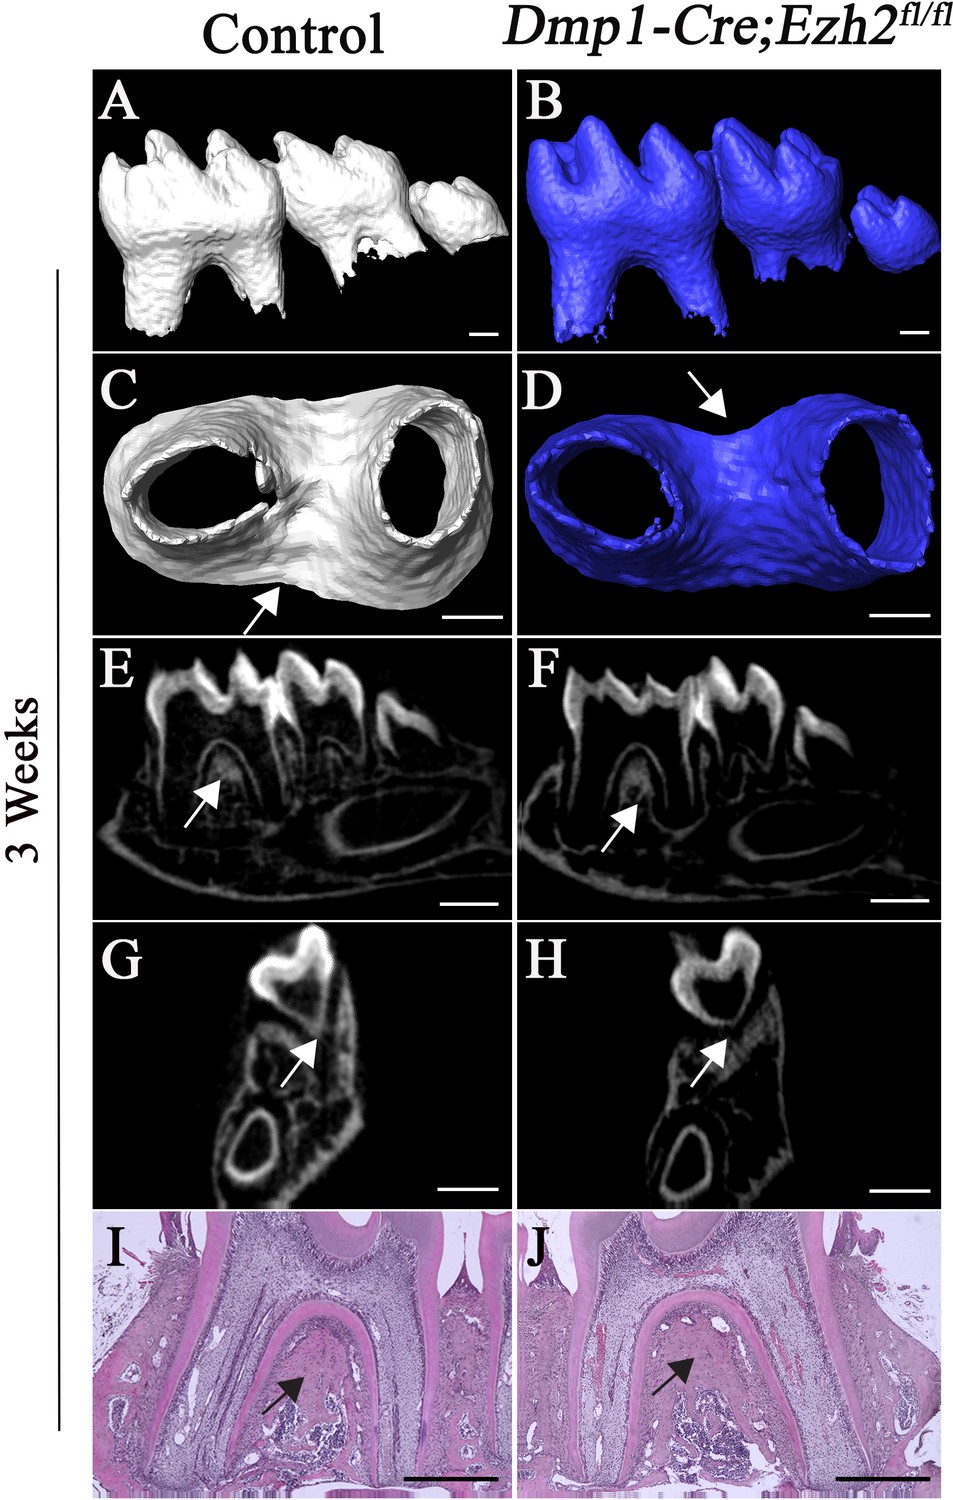
Root furcation development is unaffected after loss of Ezh2 in odontoblasts.
(A-H) MicroCT images of control (white) and Dmp1-Cre;Ezh2fl/fl (blue) molars at 3 weeks of age. A, B, lateral view of mandibular molars; C, D, apical view of mandibular first molars; E, F, sagittal sections of mandibular molars; G, H, coronal sections of mandibular molars. (I-J) H&E staining of control and Dmp1-Cre;Ezh2fl/fl molars at 3 weeks of age. n ≥ 3 histological sections were examined from multiple littermate mice per group. Arrows indicate furcation. Scale bars, 200 μm.
Figure 5—figure supplement 3
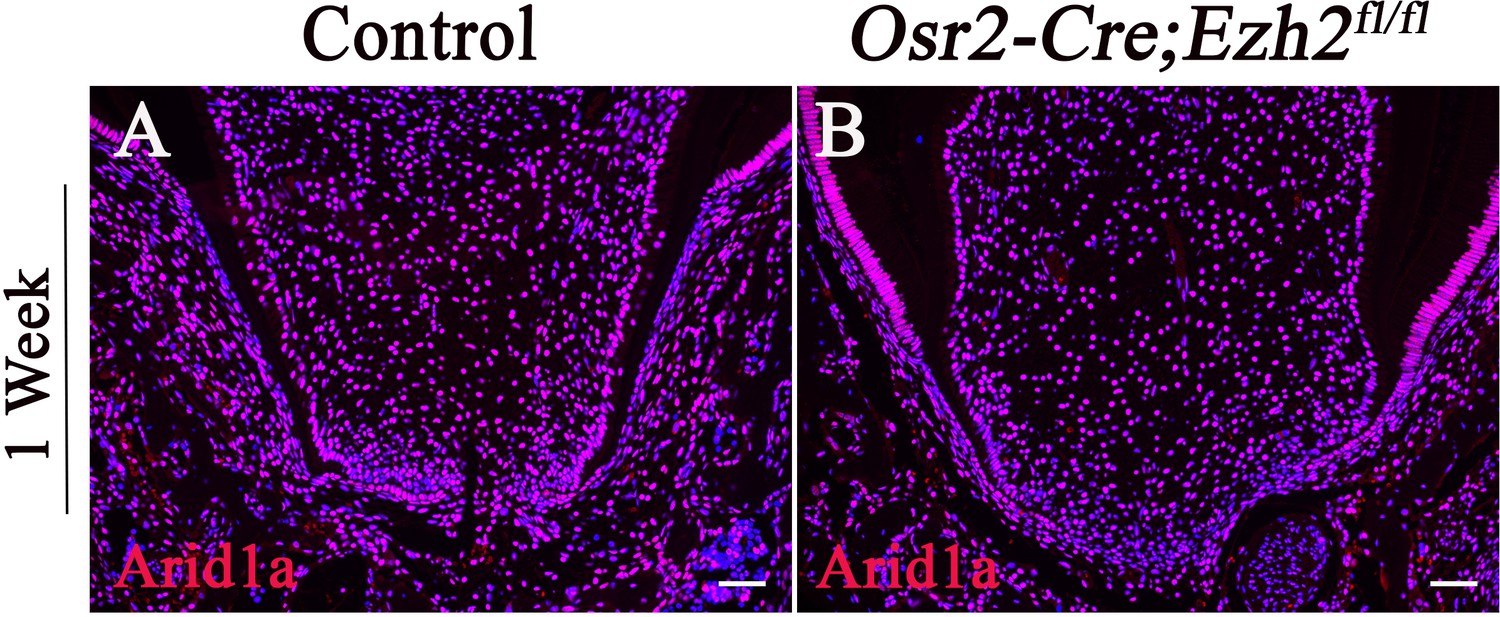
Arid1a expression is not affected in Osr2-Cre;Ezh2fl/fl molars.
(A-B) expression of Arid1a in coronal sections of molars from control and Osr2-Cre;Ezh2fl/fl mice. n ≥ 3 histological sections were examined from multiple littermate mice per group. Scale bars, 100 μm.
Figure 6 with 1 supplement

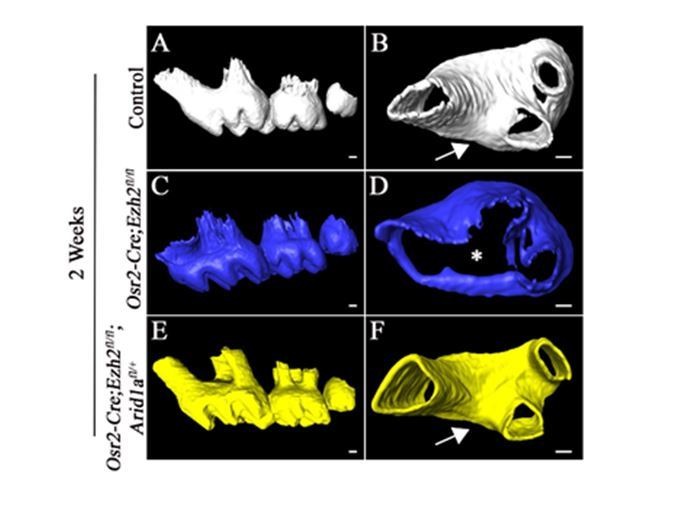
Furcation development is rescued in Osr2-Cre;Ezh2fl/fl;Arid1afl/+ mice.
MicroCT images of control, Osr2-Cre;Ezh2fl/fl and Osr2-Cre;Ezh2fl/fl;Arid1afl/+ molars at 3 weeks of age. A, E, I, lateral view of mandibular molars; B, F, J, apical view of mandibular first molars; C, G, K, coronal sections of molars in the furcation region; D, H, L, coronal sections of mandibular molars in the root forming region. The schematic drawings indicate where the CT section were taken. Arrows indicate furcation and asterisks indicate absence of furcation. Scale bars, 200 μm.
Figure 6—figure supplement 1
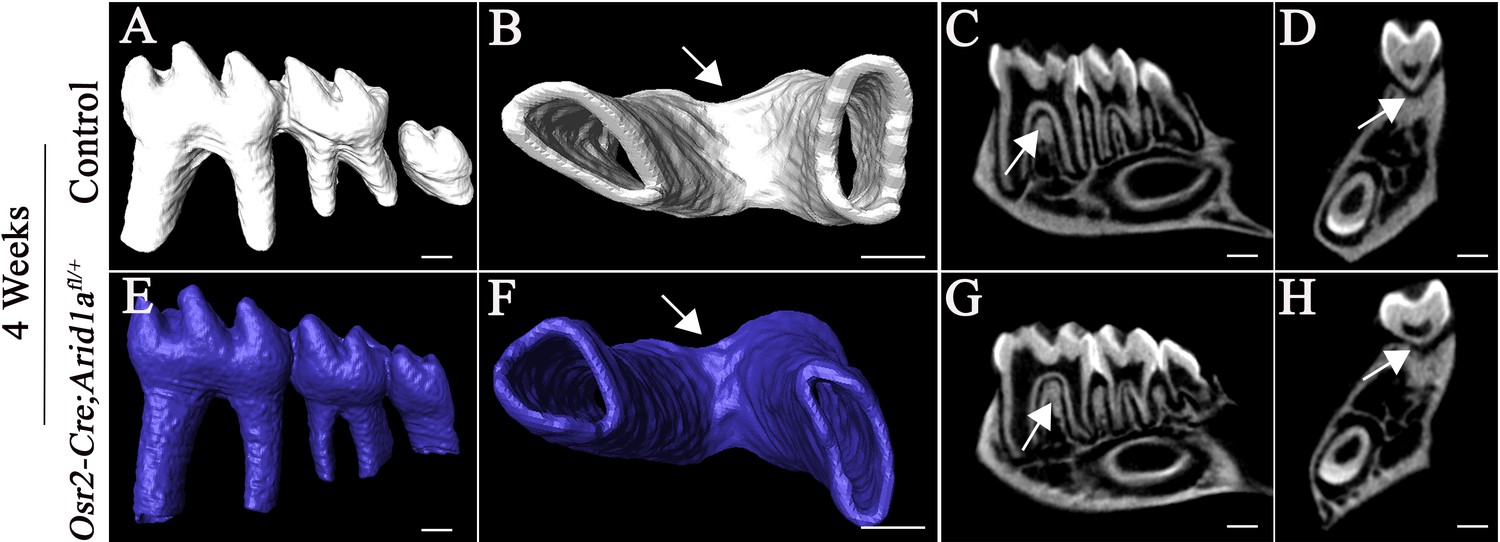
Monoallelic deletion of Arid1a has no effect on furcation formation.
(A-H) MicroCT images of control (white) and Osr2-Cre;Arid1afl/+ (blue) molars at 4 weeks of age. A, E, lateral view of mandibular molars; B, F, apical view of mandibular first molars; C, G, sagittal sections of mandibular molars; D, H, coronal sections of mandibular molars. Arrows indicate furcation. Scale bars, 200 μm.
Figure 7 with 1 supplement
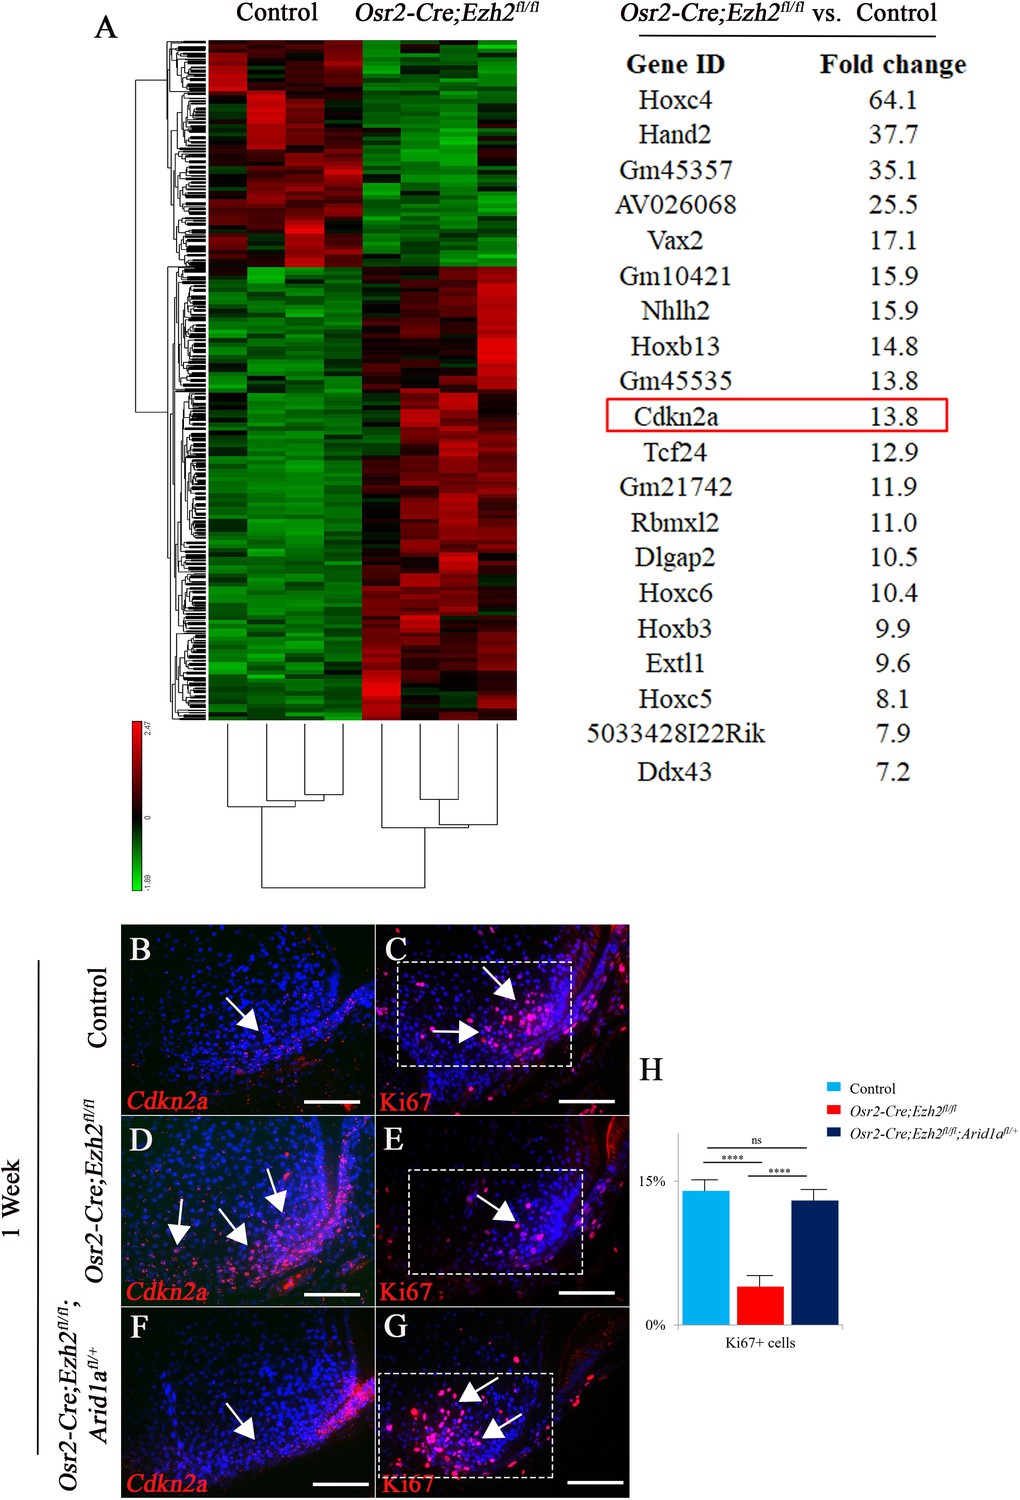
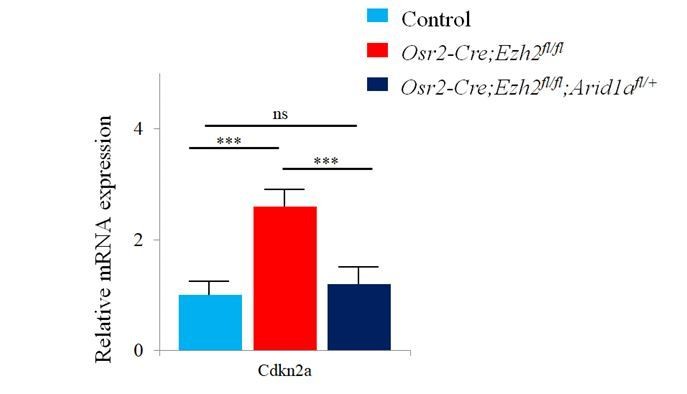
RNA-sequencing analysis from control and Osr2-Cre;Ezh2fl/fl molars.
(A) Heatmap and list of top twenty upregulated genes (red highlights Cdkn2a) generated from RNA-sequencing. (B-G) Cdkn2a and Ki67 staining of control, Osr2-Cre;Ezh2fl/fl and Osr2-Cre;Ezh2fl/fl;Arid1afl/+ molars at 1 week of age. (H) quantitation of Ki67+ cells in boxed areas of C, E and G presented as mean ± SD with n = 4. Arrows indicate positive signal. ns, not significant. ***, p<0.001. Scale bars, 100 μm. Statistical analyses were performed using one-way ANOVA.
-
Figure 7—source data 1
Source data for Figure 7H.
- https://doi.org/10.7554/eLife.46426.019
Figure 7—figure supplement 1
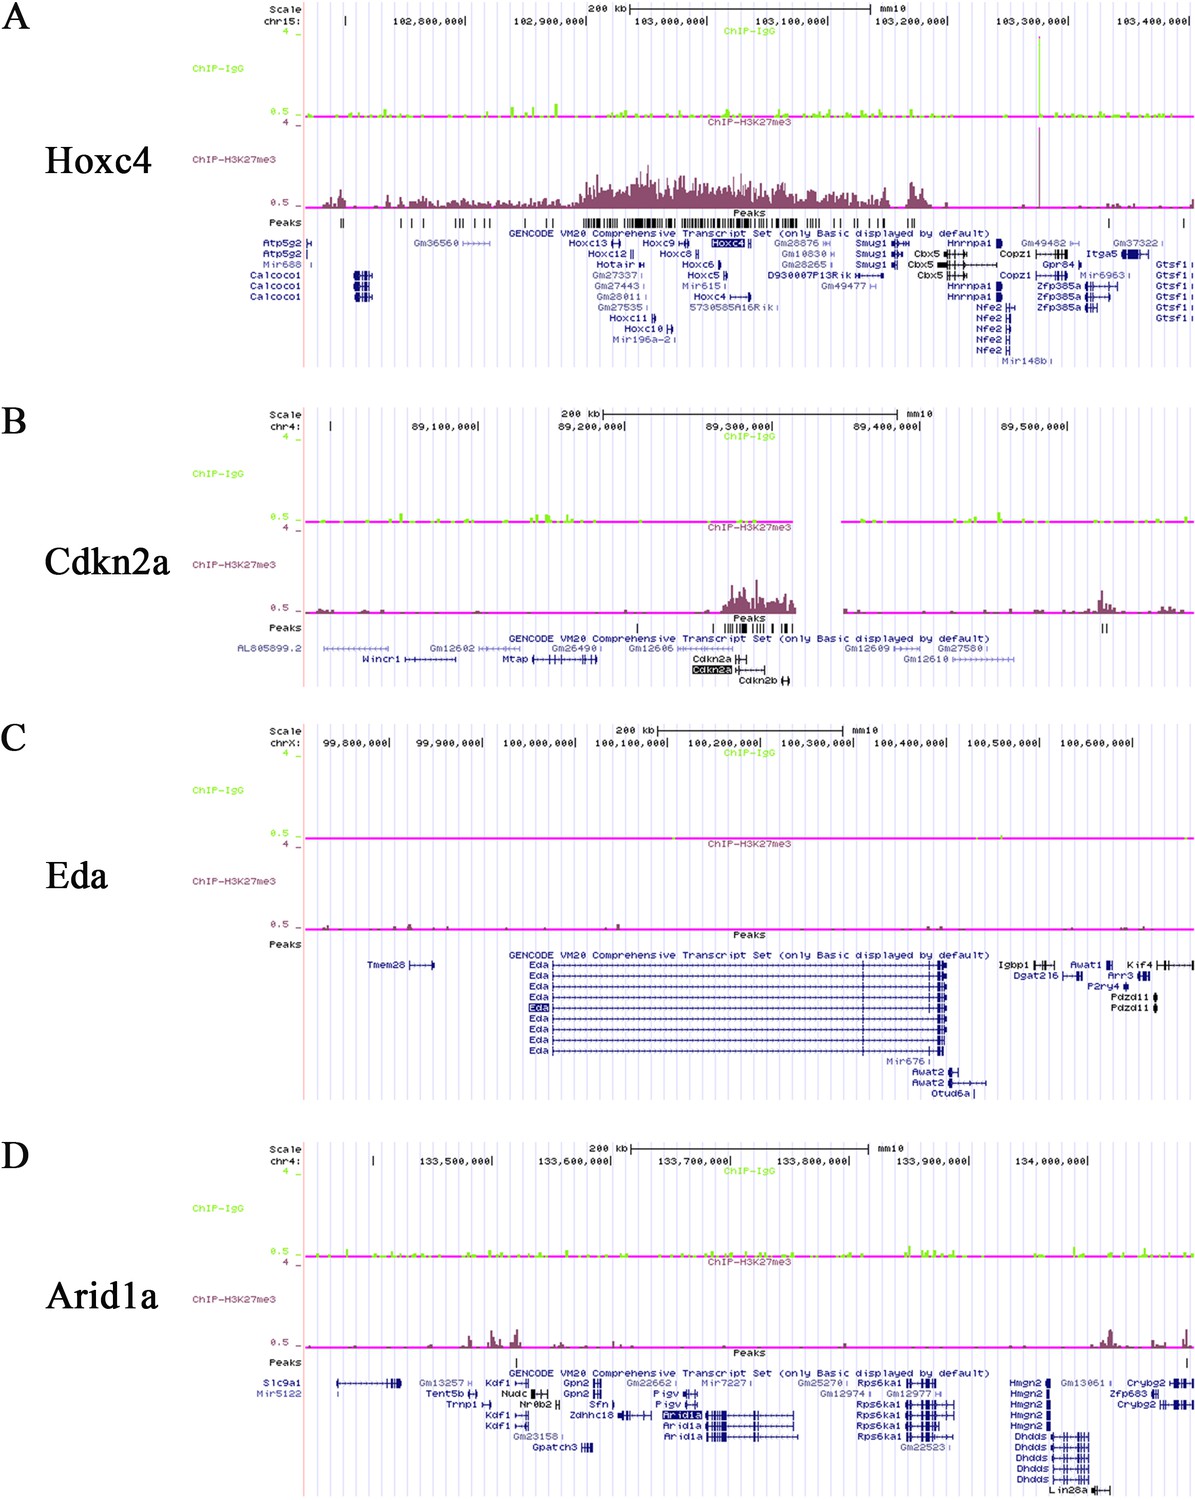
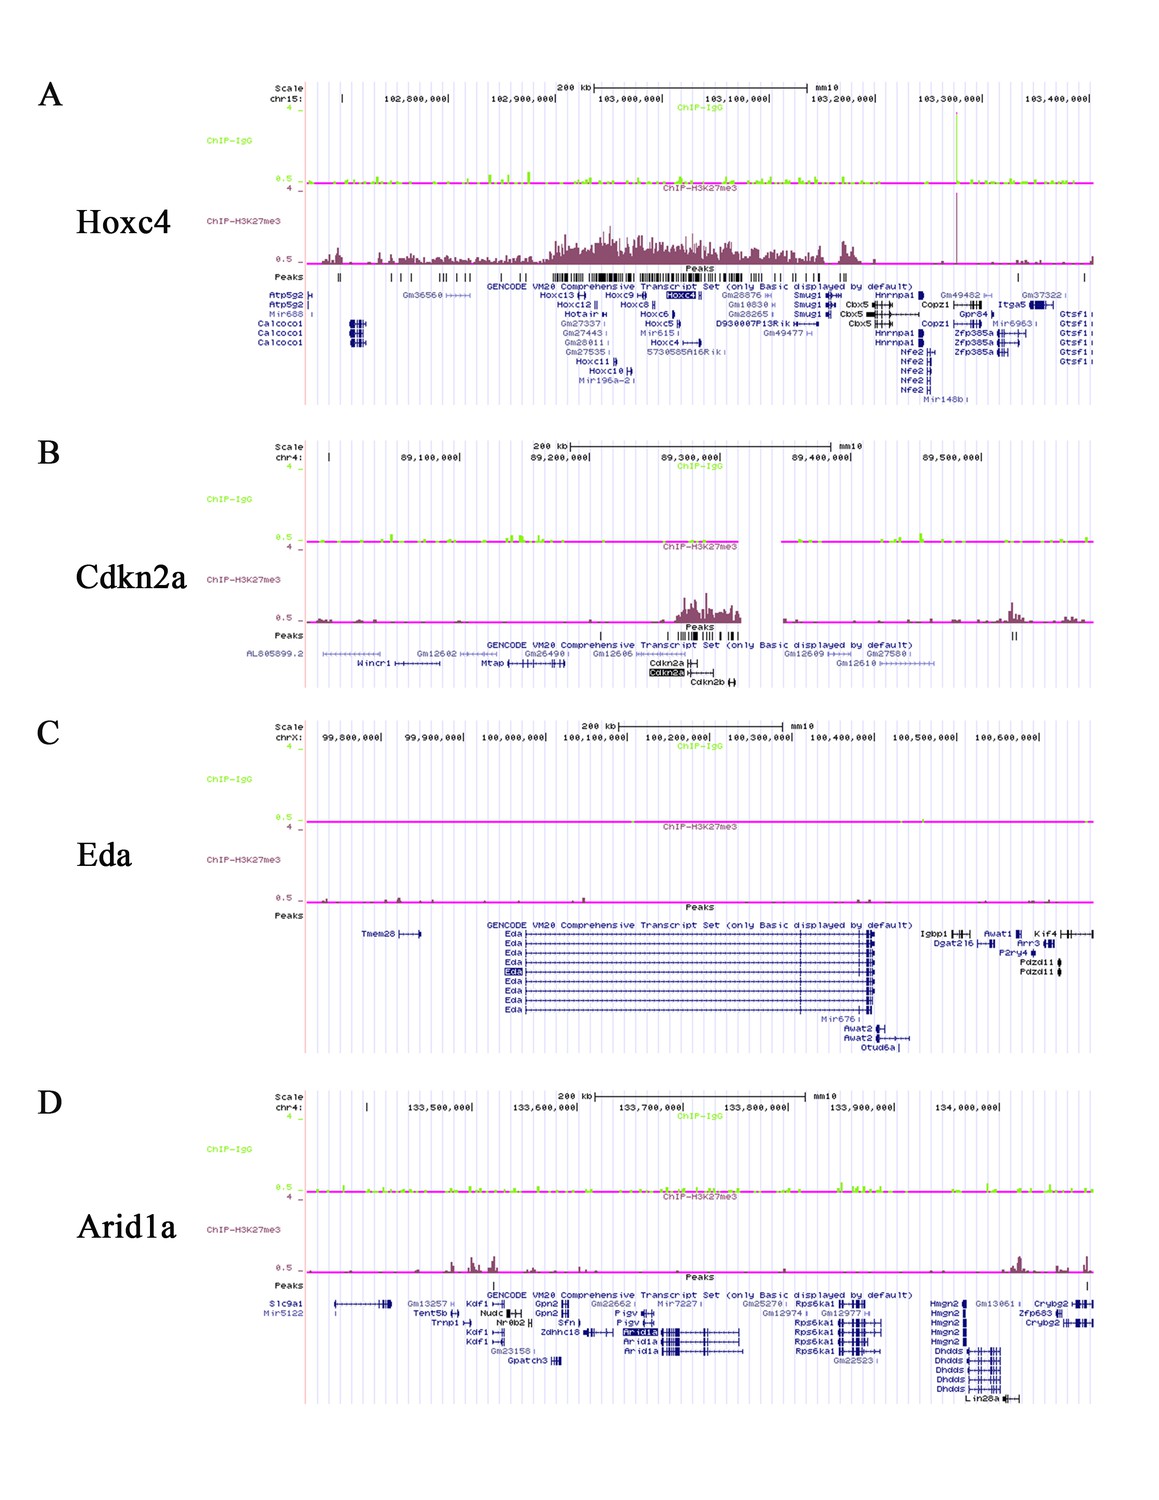
ChIP-seq signals of H3K27Me3 ChIP-sequencing from wild type mouse molars.
(A-D) ChIP-seq signals of Hoxc4, Cdkn2a, Eda and Arid1a from H3K27Me3 ChIP-sequencing of mouse molars from three-day-old wild type mice.
Author response image 1
Author response image 2
Author response image 3
Author response image 4
Tables
Key resources table
| Reagent type (species) or resource | Designation | Source or reference | Identifiers | Additional information |
|---|---|---|---|---|
| Strain, strain background (M. musculus) | Arid1aflox/flox | Jackson Laboratory | Stock No. 027717; RRID:IMSR_JAX:027717 | |
| Strain, strain background (M. musculus) | Dmp1-Cre | Jackson Laboratory | Stock No. 023047; RRID:IMSR_JAX:023047 | |
| Strain, strain background (M. musculus) | Ezh2flox/flox | Jackson Laboratory | Stock No. 022616; RRID:IMSR_JAX:022616 | |
| Strain, strain background (M. musculus) | Krt14-Cre | Jackson Laboratory | Stock No. 018964; RRID:IMSR_JAX:018964 | |
| Strain, strain background (M. musculus) | Osr2-Cre | Rulang Jiang, Cincinnati Children’s Hospital | ||
| Genetic reagent (M. musculus) | anti-Cdkn2a probe | Advanced Cell Diagnostics | Cat# 411011 | |
| Antibody | Rabbit monoclonal anti-Arid1a | Abcam | Cat# ab182561 | (1:100) |
| Antibody | Rabbit monoclonal anti-Ki67 | Abcam | Cat# ab16667; RRID:AB_302459 | (1:200) |
| Antibody | Rabbit monoclonal anti-Ezh2 | Cell Signaling Technology | Cat# 5246S; RRID:AB_10694683 | (1:200) |
| Antibody | Rabbit monoclonal anti-H3K27Me3 | Cell Signaling Technology | Cat# 9733S; RRID:AB_2616029 | (1:100) |
| Antibody | Rabbit polyclonal anti-Periostin | Abcam | Cat# ab14041; RRID:AB_2299859 | (1:100) |
| Antibody | anti-Rabbit Alexa Fluor 568 | Life Technologies | Cat# A-11011; RRID:AB_143157 | (1:200) |
| Antibody | anti-Mouse Alexa Fluor 568 | Life Technologies | Cat# A-11004; RRID:AB_2534072 | (1:200) |
| Commercial assay or kit | In Situ Cell Death Detection Kit | Roche Life Science | Cat# 11684795910 | |
| Commercial assay or kit | RNeasy Micro Kit | QIAGEN | Cat# 74004 | |
| Commercial assay or kit | Chromatrap Enzymatic Shearing Kit | Chromatrap | Cat# 500165 | |
| Software, algorithm | ImageJ | NIH | RRID:SCR_003070 | |
| Software, algorithm | GraphPad Prism | GraphPad Software | RRID:SCR_002798 |
Additional files
-
Transparent reporting form
- https://doi.org/10.7554/eLife.46426.020
Download links
A two-part list of links to download the article, or parts of the article, in various formats.
Downloads (link to download the article as PDF)
Open citations (links to open the citations from this article in various online reference manager services)
Cite this article (links to download the citations from this article in formats compatible with various reference manager tools)
Antagonistic interaction between Ezh2 and Arid1a coordinates root patterning and development via Cdkn2a in mouse molars
eLife 8:e46426.
https://doi.org/10.7554/eLife.46426


