Host-pathogen coevolution increases genetic variation in susceptibility to infection
- University of Cambridge, United Kingdom
- University of East Anglia, United Kingdom
- University of Kansas, United States
- University of Exeter (Penryn Campus), United Kingdom
Figures
Figure 1
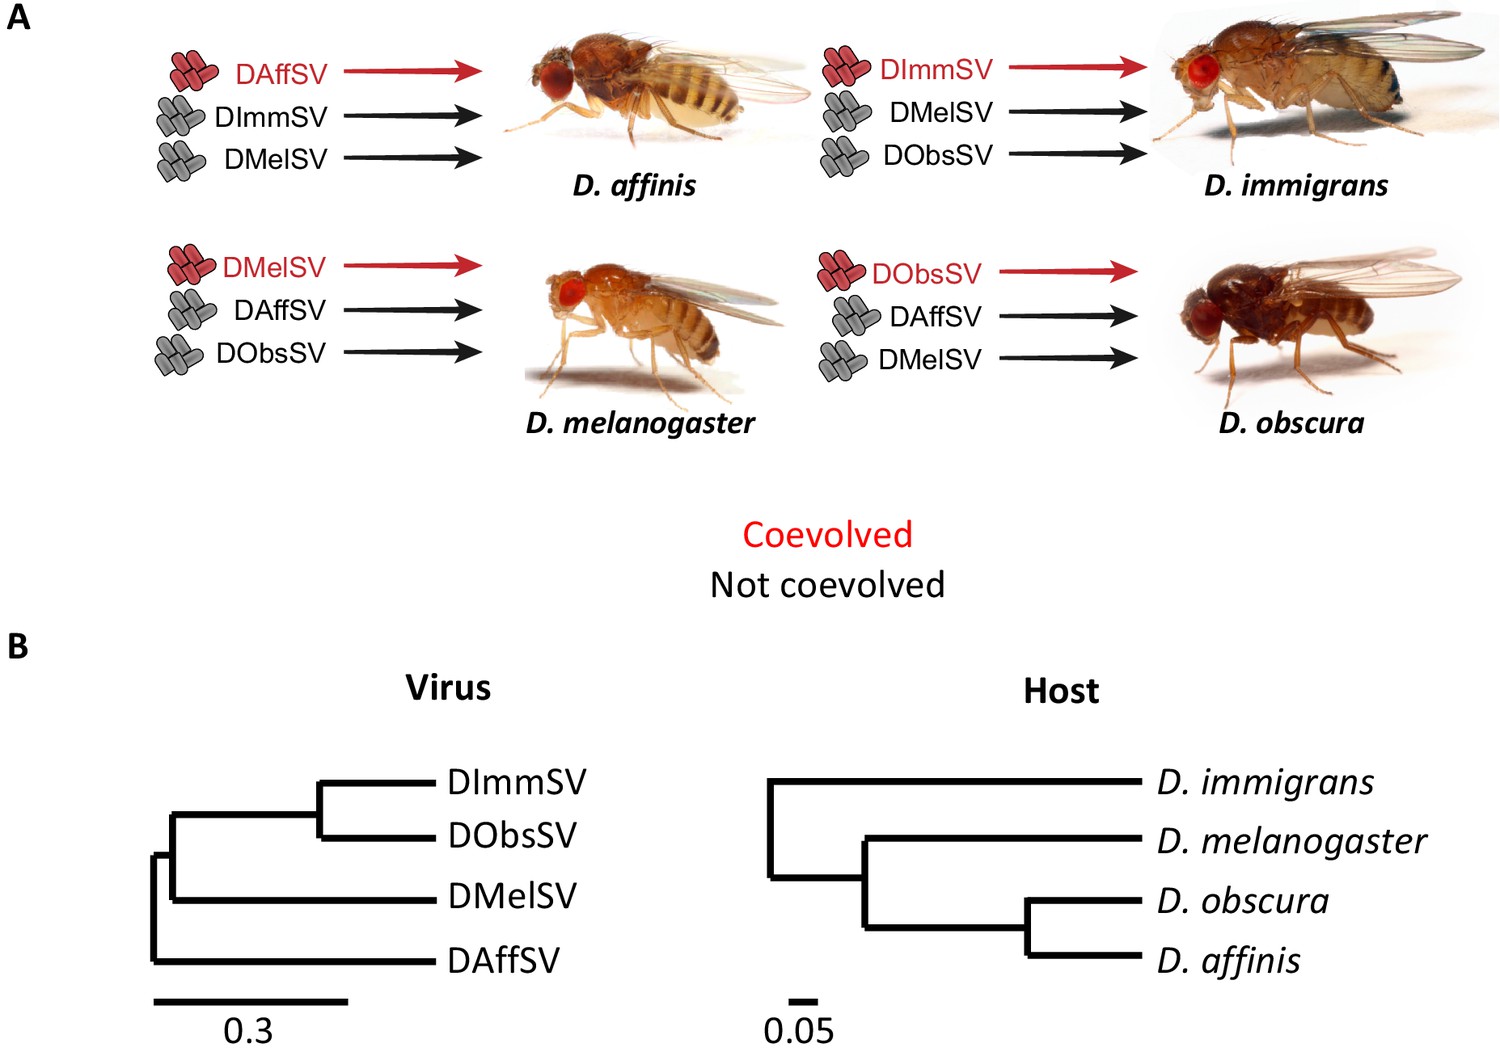
Experimental design and phylogenies.
(A) Four species of Drosophila were independently infected both with a sigma virus with which they are naturally infected with in nature (red) and two viruses that naturally infect another species (black). (B) Phylogenies of the sigma viruses (inferred using the L gene) and their Drosophila hosts (inferred using COI, COII, 28S rDNA, Adh, SOD, Amyrel and RpL32 genes), redrawn from Longdon et al. (2015a) and Longdon et al. (2015b). Scale bars represent substitutions per site under a relaxed clock model. Posterior supports for nodes are all >0.99.
Figure 2 with 1 supplement
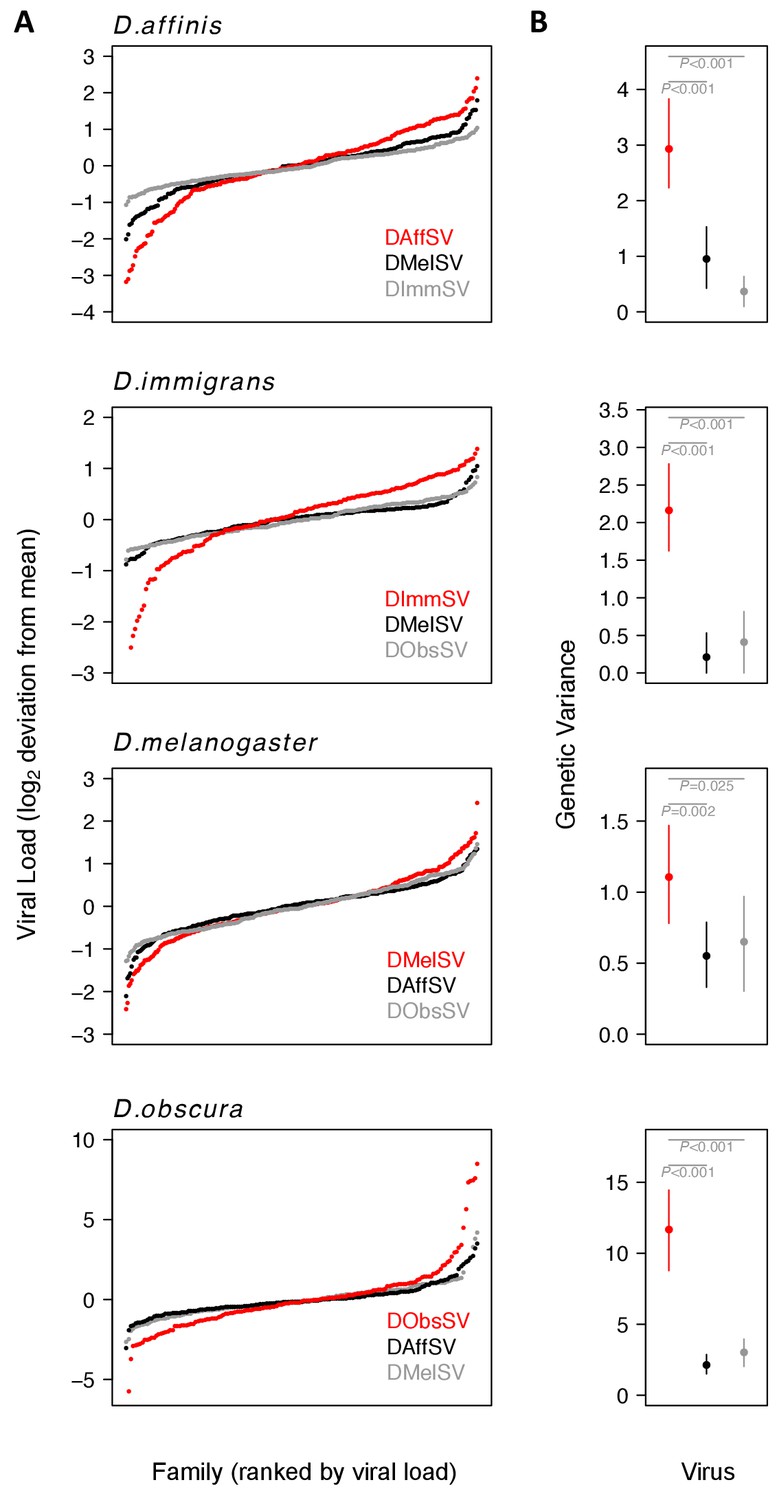
Genetic variation in susceptibility to coevolved and non-coevolved viruses.
The viral load was measured 15 days post infection by quantitative RT-PCR relative to a Drosophila reference gene (RpL32). (A) The points show model prediction family means from our GLM and are centred on zero. The number of families in each panel was down-sampled so the same number of families is shown for each virus. Coevolved host-virus associations are in red. (B) The genetic variance in log2 viral load was estimated from the between family variance assuming that all genetic variance is additive. The bars are 95% credible intervals. Posterior probabilities for significantly different genetic variances are shown in grey (see Supplementary file 1 and 2).
Figure 2—figure supplement 1
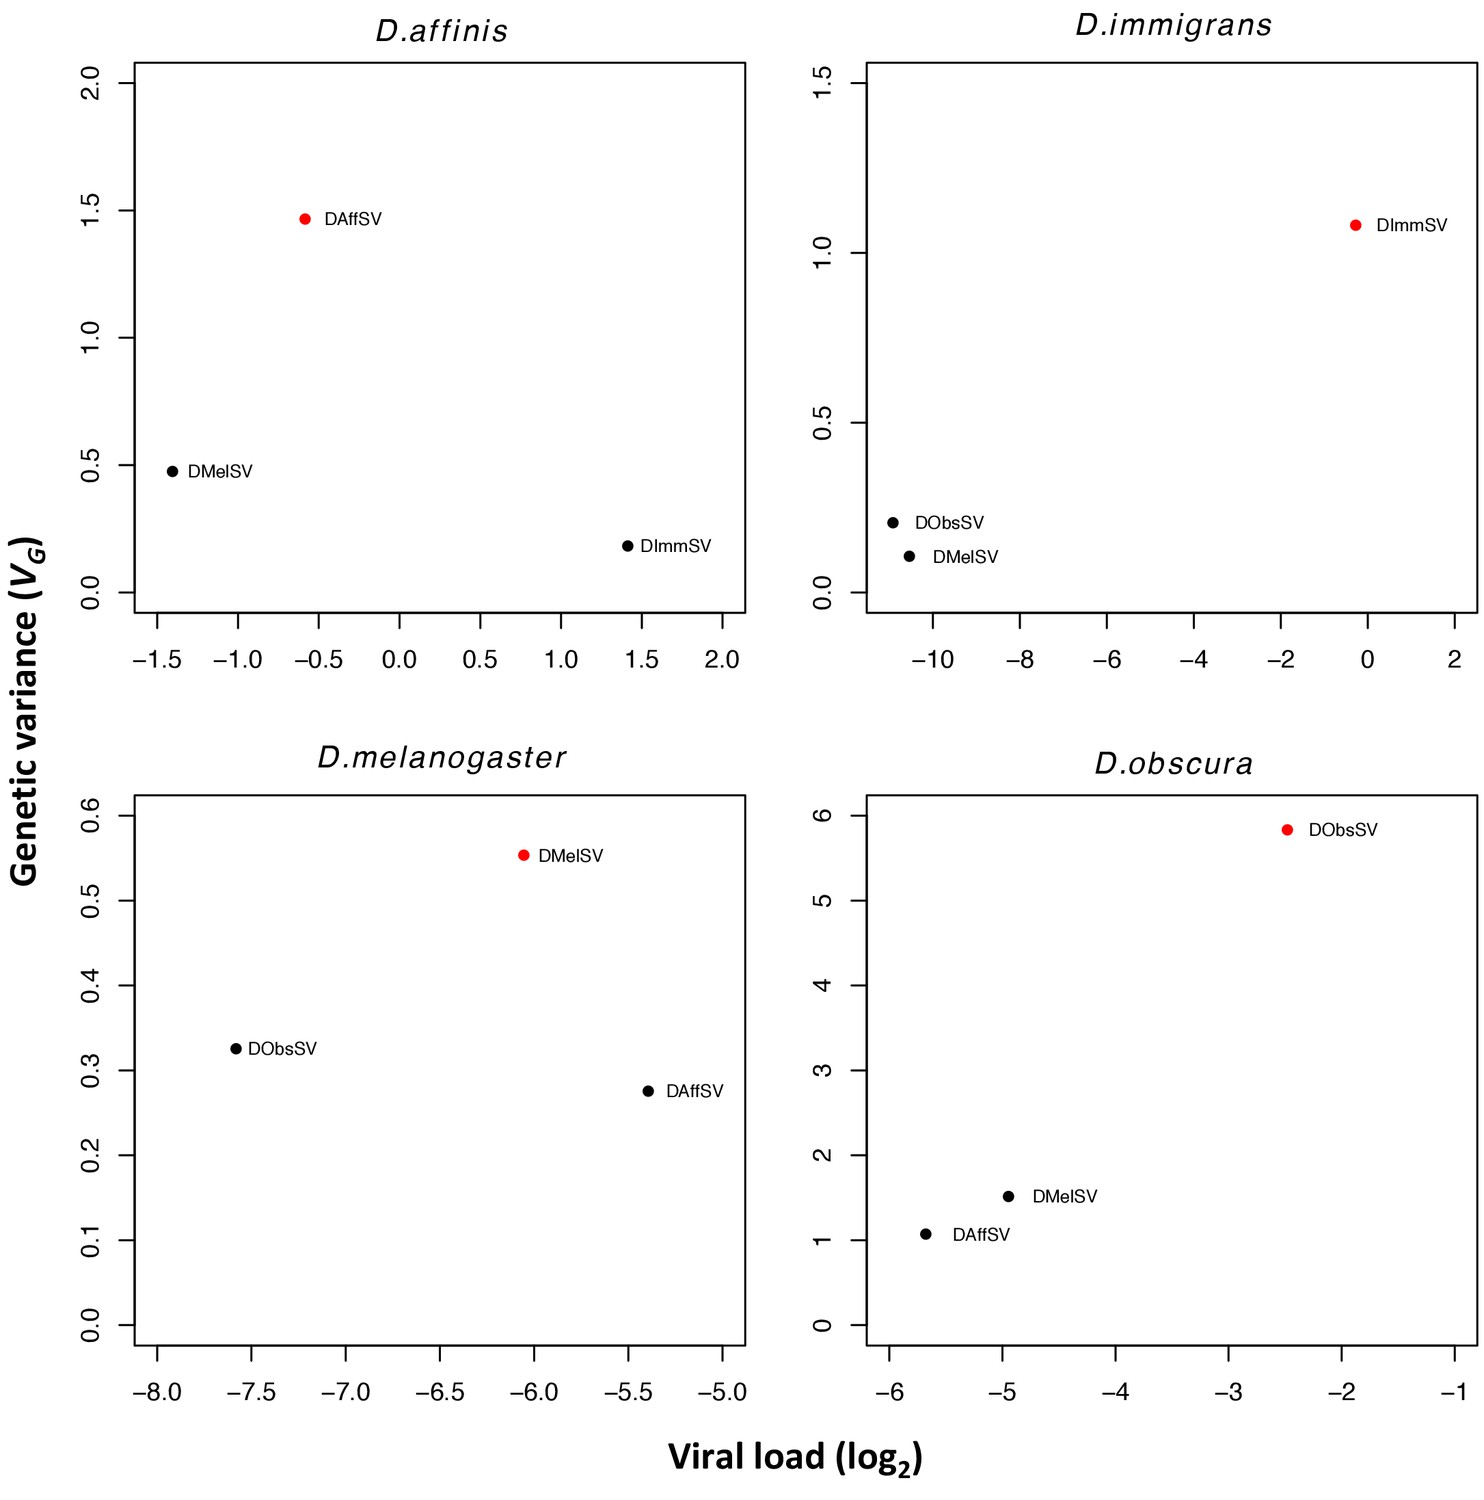
Estimates of genetic variance plotted against mean viral load for each species-virus combination.
Viral load is measured by qRT-PCR relative to a housekeeping gene (RpL32). All viral loads were significantly different from one another (P<0.001 in all cases).
Figure 3

Viral load in D. melanogaster lines carrying different alleles of CHKov1 and p62.
Each point is the viral load of a separate inbred fly line carrying the resistant (Res) or susceptible (Sus) allele of P62 or CHKov1. Horizontal bars are medians. Viral load was measured 15 days post infection by quantitative RT-PCR relative to a Drosophila reference gene (RpL32).
Figure 4
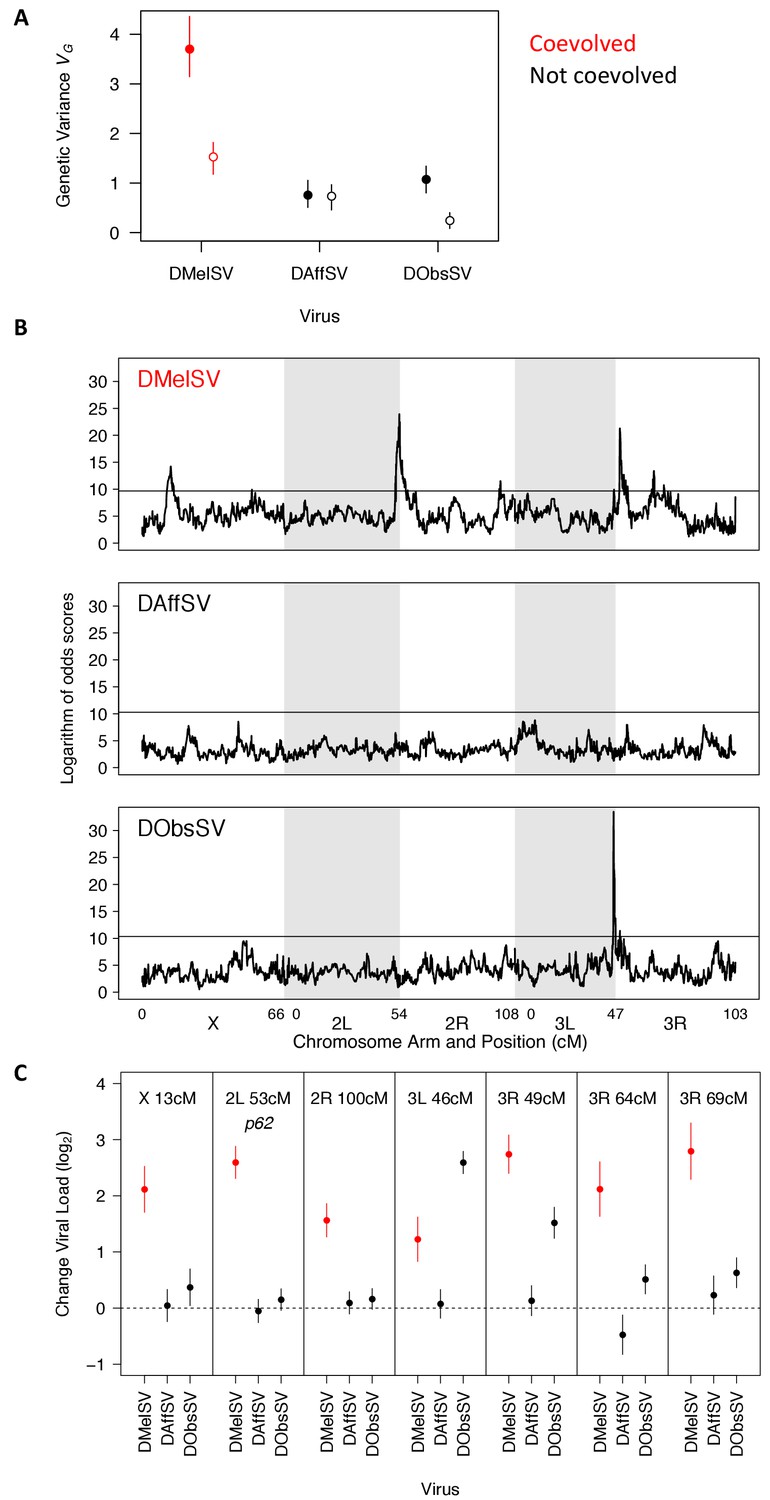
The genetic architecture of resistance to coevolved and non-coevolved viruses in D. melanogaster.
(A) The genetic variance in viral load within the mapping population (filled circles). The open circles are estimates of the genetic variance after accounting for the effects of the QTL in panel C. Error bars are 95% credible intervals. (B) QTL affecting viral load. The horizontal line shows a genome-wide significance threshold of p<0.05 that was obtained by permutation of Logarithm of odds (LOD) scores. (C) The effect of the seven QTL detected on the load of the three viruses. Only QTL that remained were significant following multiple regression with all the loci are shown. The coevolved virus is shown in red.
Additional files
-
Supplementary file 1
Credible intervals of the differences between estimates of genetic variance in susceptibility across host species and viruses.
The natural virus for each host is in red and bold. Genetic variances are estimated from the among-family variances in viral load. 95% CIs show differences in estimates of genetic variation for different host-virus combinations, intervals that do not cross zero represent statistically significant differences.
- https://doi.org/10.7554/eLife.46440.007
-
Supplementary file 2
Estimates of genetic variation for each host virus combination.
The natural virus for each host is in red and bold. Genetic variances are estimated from the among-family variances in viral load.
- https://doi.org/10.7554/eLife.46440.008
-
Supplementary file 3
Table S3 Genetic correlations (rg) in viral loads across host species after infection by coevolved and non-coevolved viruses.
The coevolved (natural) virus for each host is in red and bold. Models ran using REML gave similar estimates.
- https://doi.org/10.7554/eLife.46440.009
-
Supplementary file 4
Table S4 Primers for genotypingD. melanogasterresistance genesGe-1, p62 (Ref(2)P) and CHKov-1.
PCRs were carried out using a touchdown PCR cycle (95°C 30sec, 62°C (-1°C per cycle) 30sec, 72°C 1min; for 10x cycles followed by; 95°C 30sec, 52°C 30sec, 72°C 1min; for a further 25x cycles).
- https://doi.org/10.7554/eLife.46440.010
-
Supplementary file 5
Table S5 QTL and their locations.
- https://doi.org/10.7554/eLife.46440.011
-
Supplementary file 6
Table S6 Primers for qRT-PCR (5’-3’).
RpL32 primers overlap an intron-exon boundary. Sigma virus primers cross gene boundaries except for DImmSV that amplifies the L gene
- https://doi.org/10.7554/eLife.46440.012
-
Transparent reporting form
- https://doi.org/10.7554/eLife.46440.013
Download links
A two-part list of links to download the article, or parts of the article, in various formats.
Downloads (link to download the article as PDF)
Open citations (links to open the citations from this article in various online reference manager services)
Cite this article (links to download the citations from this article in formats compatible with various reference manager tools)
Host-pathogen coevolution increases genetic variation in susceptibility to infection
eLife 8:e46440.
https://doi.org/10.7554/eLife.46440


