Functional metagenomics-guided discovery of potent Cas9 inhibitors in the human microbiome
- Fred Hutchinson Cancer Research Center, United States
- University of Texas at Austin, United States
- Seattle University, United States
- Howard Hughes Medical Institute, Fred Hutchinson Cancer Research Center, United States
Figures
Figure 1 with 3 supplements
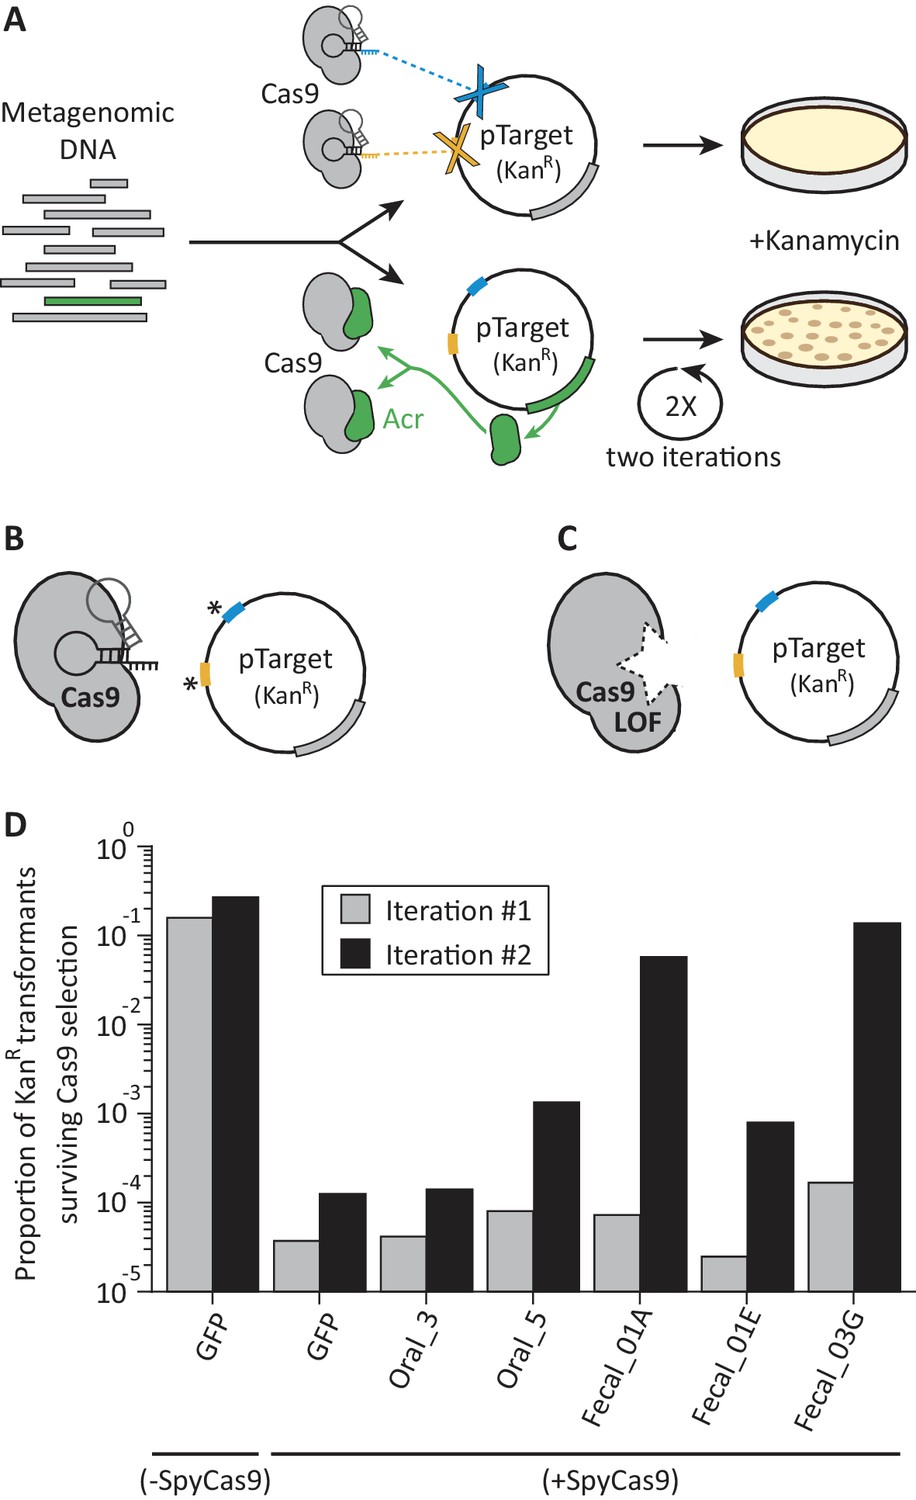
A functional metagenomic selection for type II-A anti-CRISPRs.
(A) In a metagenomic library, plasmids without acrs are targeted by SpyCas9 and eliminated. Those plasmids that carry acrs (green) withstand SpyCas9 and can be recovered via kanamycin selection. However, individual target site mutations, indicated by an asterisk (B) or SpyCas9 loss of function (LOF) mutations (C) allow plasmids to evade SpyCas9 independent of their metagenomic DNA insert. To reduce these major sources of false positives, we employ two plasmid target sites (blue, yellow) and two rounds of selection. (D) Relative to a GFP control, some metagenomic libraries protect plasmids after two iterations rounds of SpyCas9 selection. Each bar represents a single experiment.
Figure 1—figure supplement 1
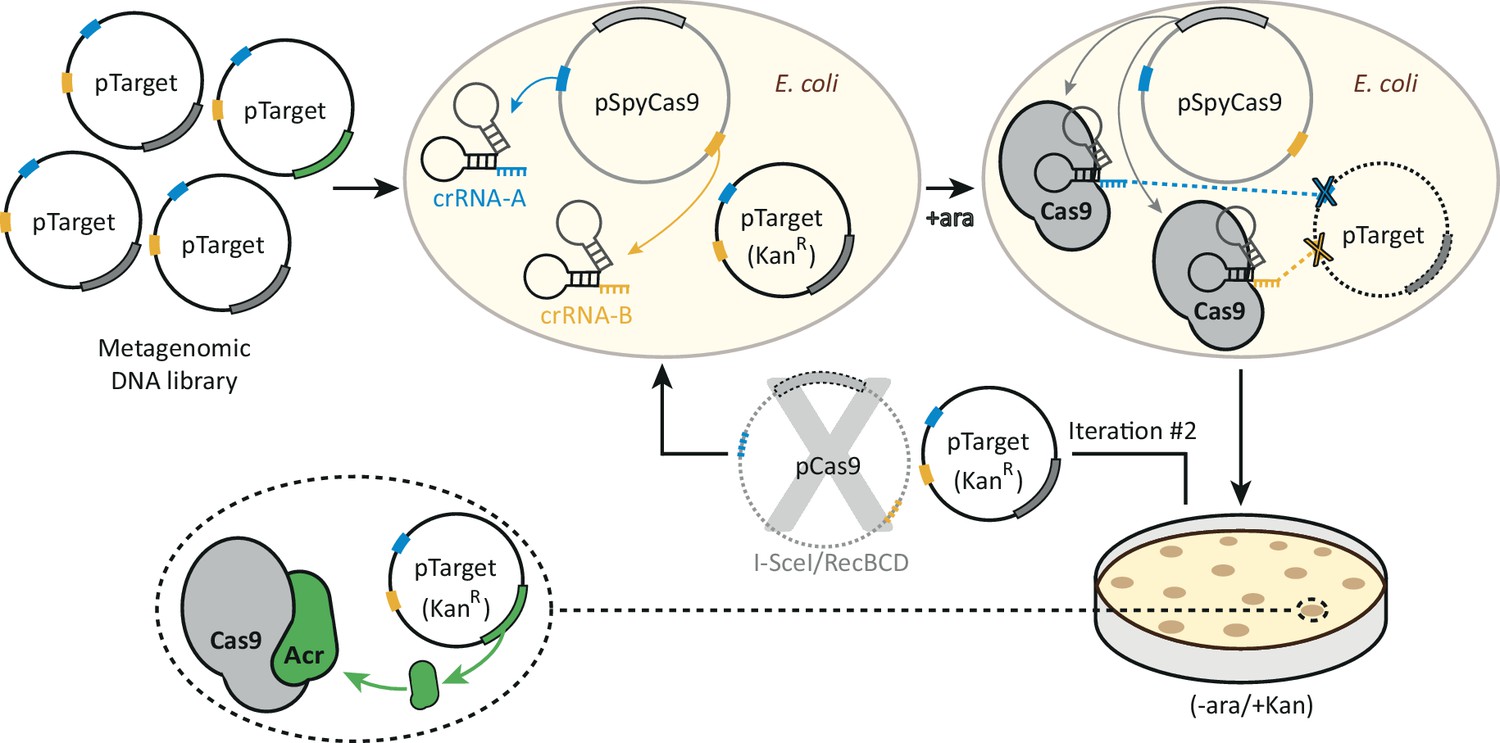
A functional selection for type II-A anti-CRISPRs.
A library of plasmids each bearing a different metagenomic DNA fragment is transformed into an E. coli strain expressing SpyCas9 and two crRNAs, which target the library for destruction. Two crRNAs targeting two sites in the plasmid backbone reduce the number of target-site escape mutations, mitigating this source of false-positives. After transformed cells are allowed to recover, SpyCas9 is induced with arabinose and the library is subjected to SpyCas9 selection for twenty hours. Plasmids that survive this first round of selection are purified from KanR clones and the pSpyCas9 plasmid is removed via digestion with I-SceI and RecBCD treatment. The metagenomic library is then subjected to SpyCas9 exposure a second time, which enriches for plasmid-intrinsic SpyCas9 resistance (i.e. what may be encoded by the metagenomic DNA inserts). The second iteration allows acr-encoding clones to be enriched above background, which is set by the frequency of SpyCas9 loss-of-function mutations. KanR clones following two rounds of selection were then harvested and their metagenomic DNA inserts sequenced to identify putative acr-encoding metagenomic DNA fragments.
Figure 1—figure supplement 2
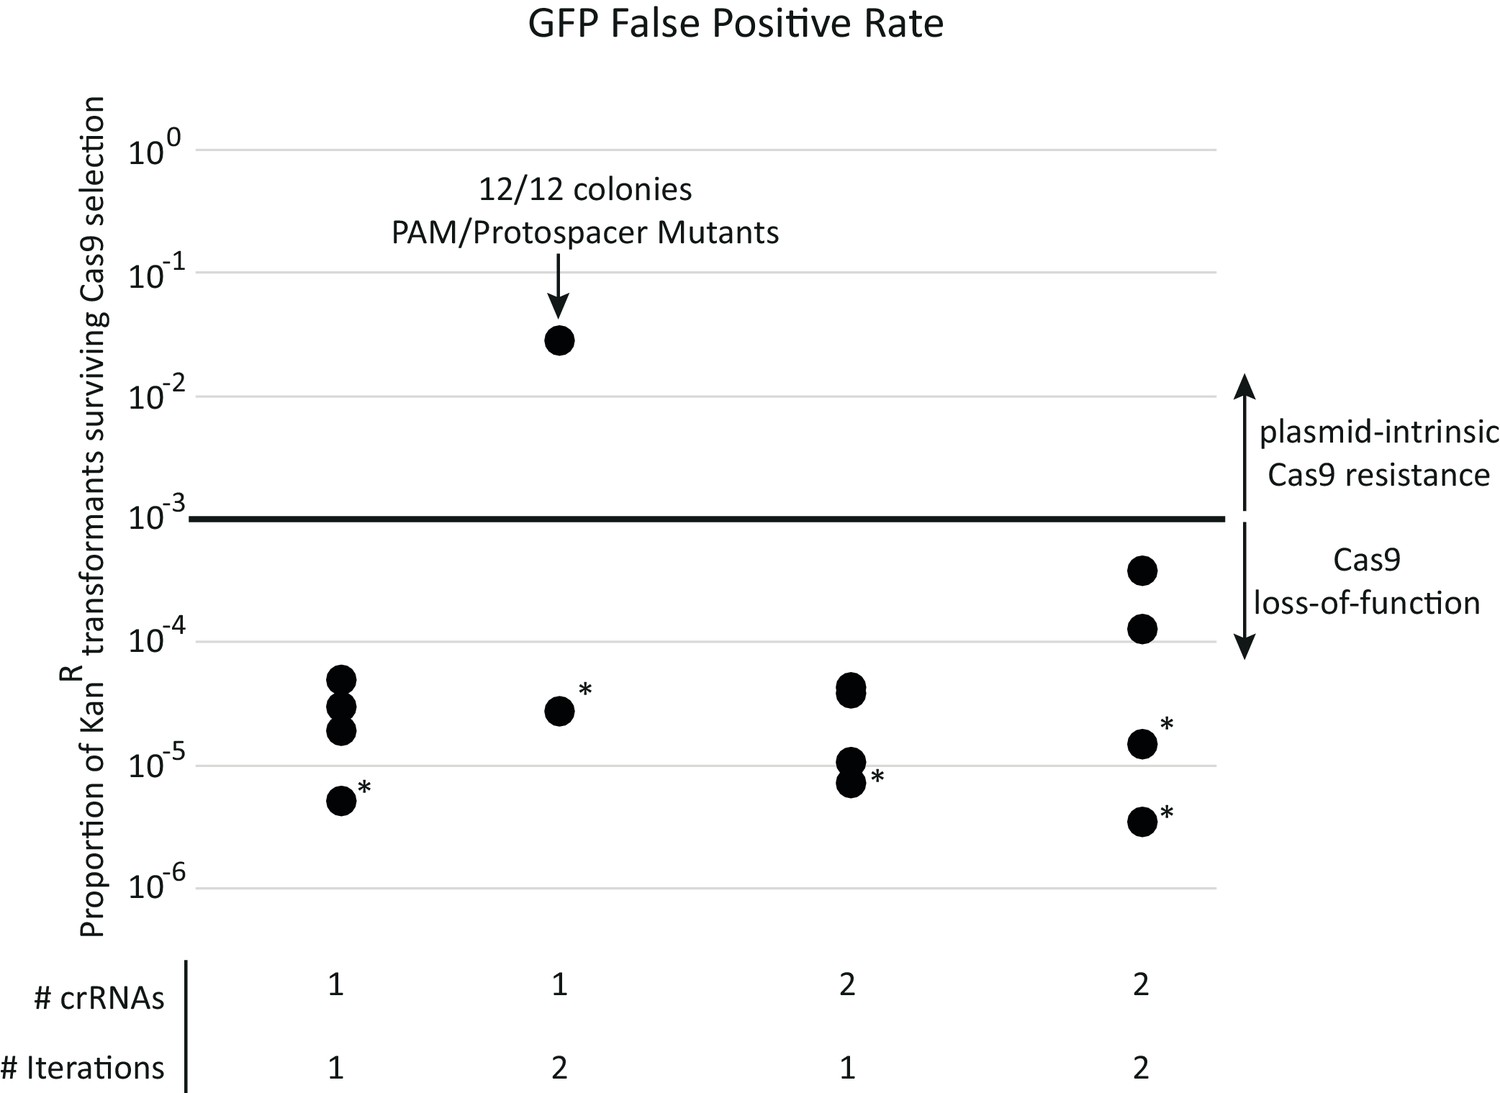
SpyCas9 loss-of-function mutations are the major source of false-positives during acr selection.
Each data point represents a separate experiment toward developing the final selection for SpyCas9 antagonists. All transformations use the pZE21-GFP control target plasmid and approximate a metagenomic library expressing only neutral functions. Surviving colonies therefore represent sources of false positives. A single iteration of SpyCas9 exposure reduces KanR transformants by a factor of 104 to 105. This false-positive rate remained constant across all experiments except for one experiment that used a single target site on pZE21. In this experiment, mutations to the protospacer or PAM region of the SpyCas9 target site in pZE21 dominated, prompting two target loci to be used thereafter. All other colonies genotyped (those in asterisked experiments) escaped selection due to inactivating mutations in pSpyCas9 (see Supplementary file 1 table S1). This loss-of-function rate, importantly, remained constant across rounds of selection, allowing for plasmid-intrinsic SpyCas9 resistance to be identified via two iterations through SpyCas9 selection. When libraries were subject to two rounds of selection, this plasmid-intrinsic resistance was predominantly due to genes encoded by its metagenomic DNA fragment (Figure 1D).
Figure 1—figure supplement 3
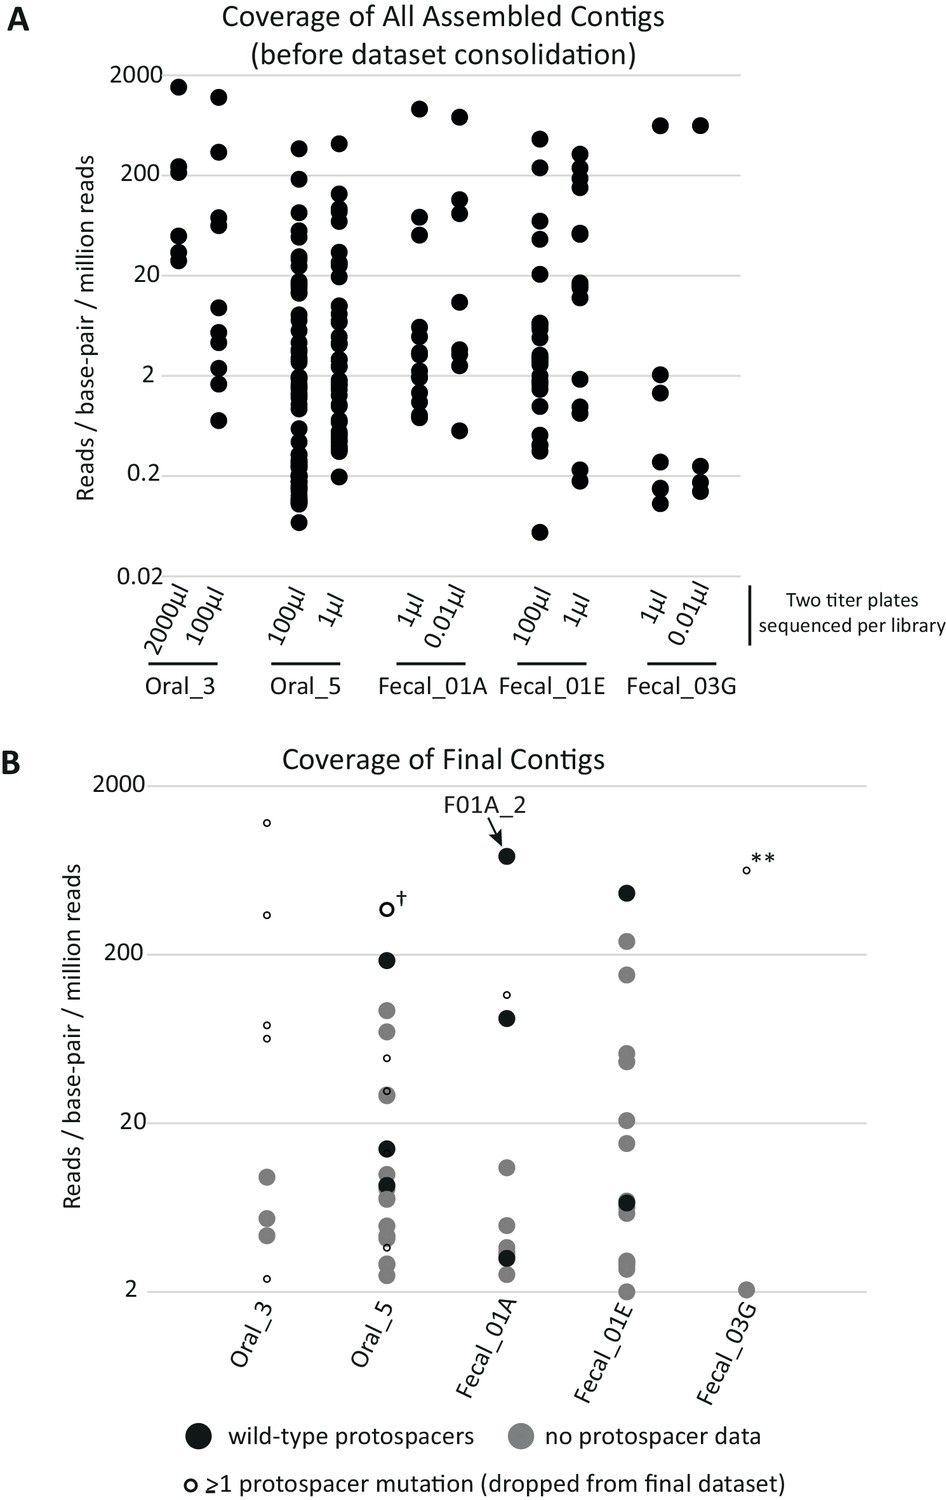
Coverage of assembled contigs by library.
(A) Coverage of each assembled contig before dataset processing. For each library, titer plates that gave rise to ~102 and~104 KanR colonies were used to independently sequence and assemble DNA fragments from surviving metagenomic clones (two titer plates per library were processed in parallel). Because the proportion of KanR cells in each library varied, the effective volume of cells plated to achieve these colony counts varied across libraries and is shown on the X-axis. Titer plates from the same metagenomic library yielded many redundant contigs, which were removed during data processing to give the final contigs depicted in (B). Relative coverage can be used as a proxy for contig abundance within a library but cannot be used for meaningful comparisons across libraries. (B) Coverage of contigs in the final dataset. Filled circles depict contigs reported in the final dataset (n = 51); gray indicates contigs without genotypic data for SpyCas9 target sites and black indicates contigs from plasmids with confirmed wild-type target sites. Small, empty circles depict assembled contigs linked to at least one target site mutation and were not included in the final dataset, with the cross (†) indicating the lone exception. This contig was found in a plasmid containing a single target site mutation but nonetheless was confirmed for anti-SpyCas9 activity when cloned into a fresh plasmid background, so was included in the final dataset. The double asterisks (**) highlight a clone with escape mutations in both target sites that dominated the selection using library Fecal_03G.
Figure 2 with 2 supplements
Metagenomic DNA inserts antagonize SpyCas9.
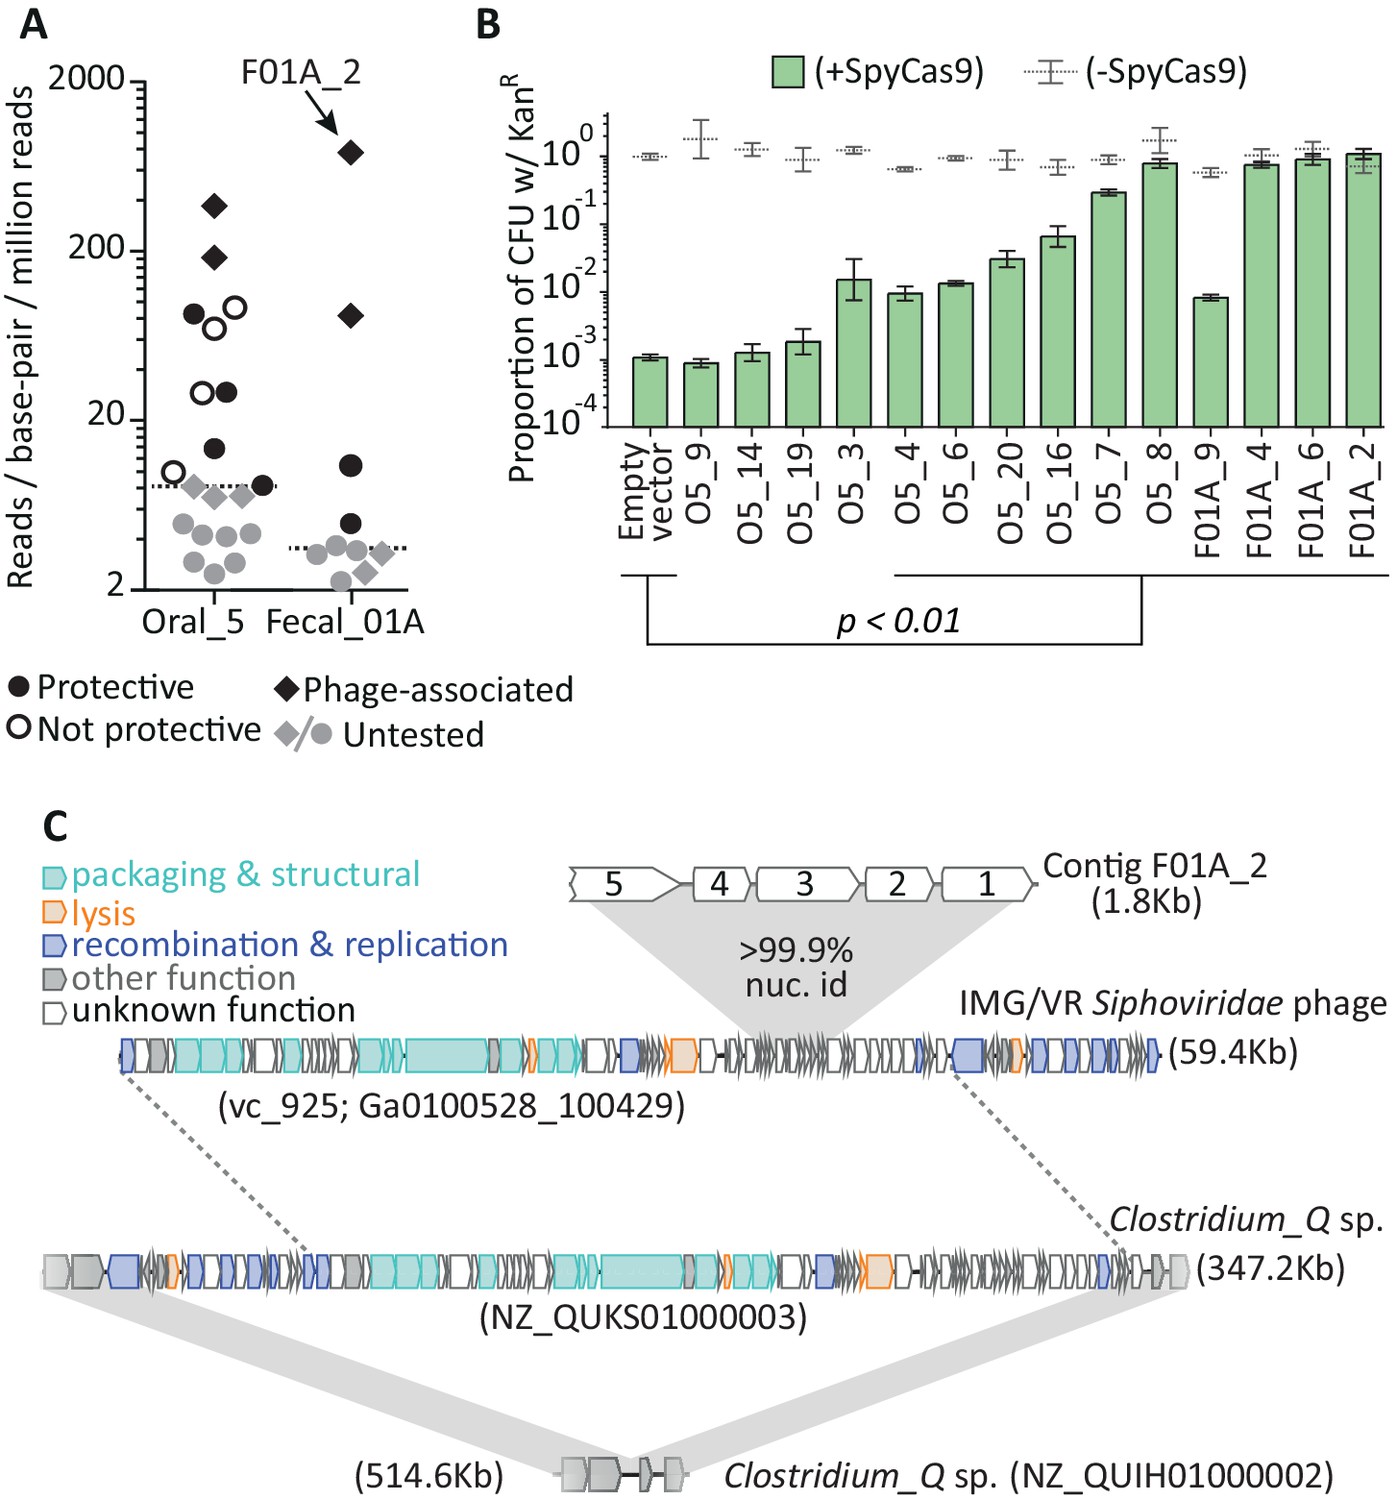
(A) The read-coverage of all contigs from libraries Oral_5 and Fecal_01A is shown. Dashed lines depict median coverage for each library. Relative coverage can be used as a proxy for contig abundance within a library but cannot be used for meaningful comparisons across libraries. (B) Upon individual re-testing, six oral and four fecal inserts protect a plasmid from SpyCas9; p-values indicate comparisons to an empty vector in SpyCas9 inducing conditions and are adjusted for multiple hypotheses (Student’s t-test, n = 3); + /- refers to SpyCas9 induction. Error bars depict standard error of the mean. (C) Contig F01A_2 is from a Siphoviridae phage which lysogenizes Clostridium_Q sp. Gray, shaded regions depict key regions of near perfect (>99%) nucleotide identity. Homology between the Clostridium_Q prophage and the IMG/VR phage is not depicted as these phages are nearly identical (except for one translocation or assembly-artefact involving much of the recombination and replication machinery). All accession numbers denote NCBI Genbank IDs except for the Siphoviridae phage, for which we use IMG/VR convention and indicate viral_cluster with the scaffold_id in parentheses. Contig lengths are depicted next to each sequence.
Figure 2—figure supplement 1
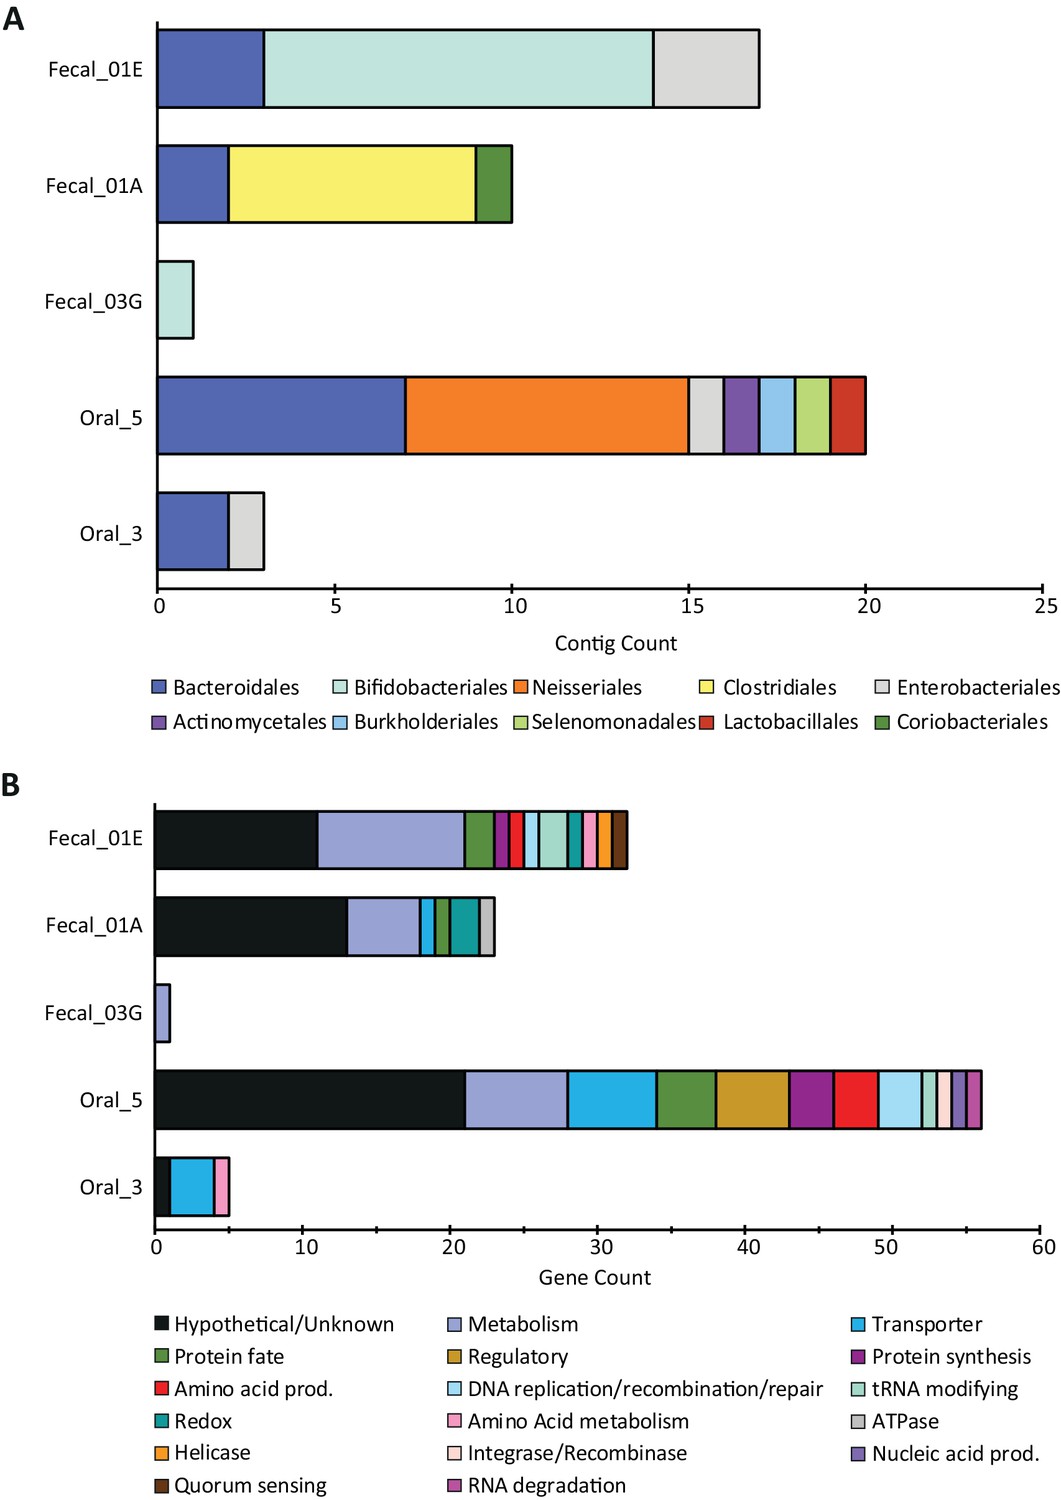
NCBI taxonomies and gene functions recovered from all SpyCas9-antagonizing contigs.
(A) Taxonomic orders for the contigs surviving SpyCas9 targeting, grouped by library. (B) The encoded gene functions on these contigs, hand-curated into broad categories.
Figure 2—figure supplement 2
The genes on contig F01A_2 encode small accessory proteins of Lachnospiraceae phages.
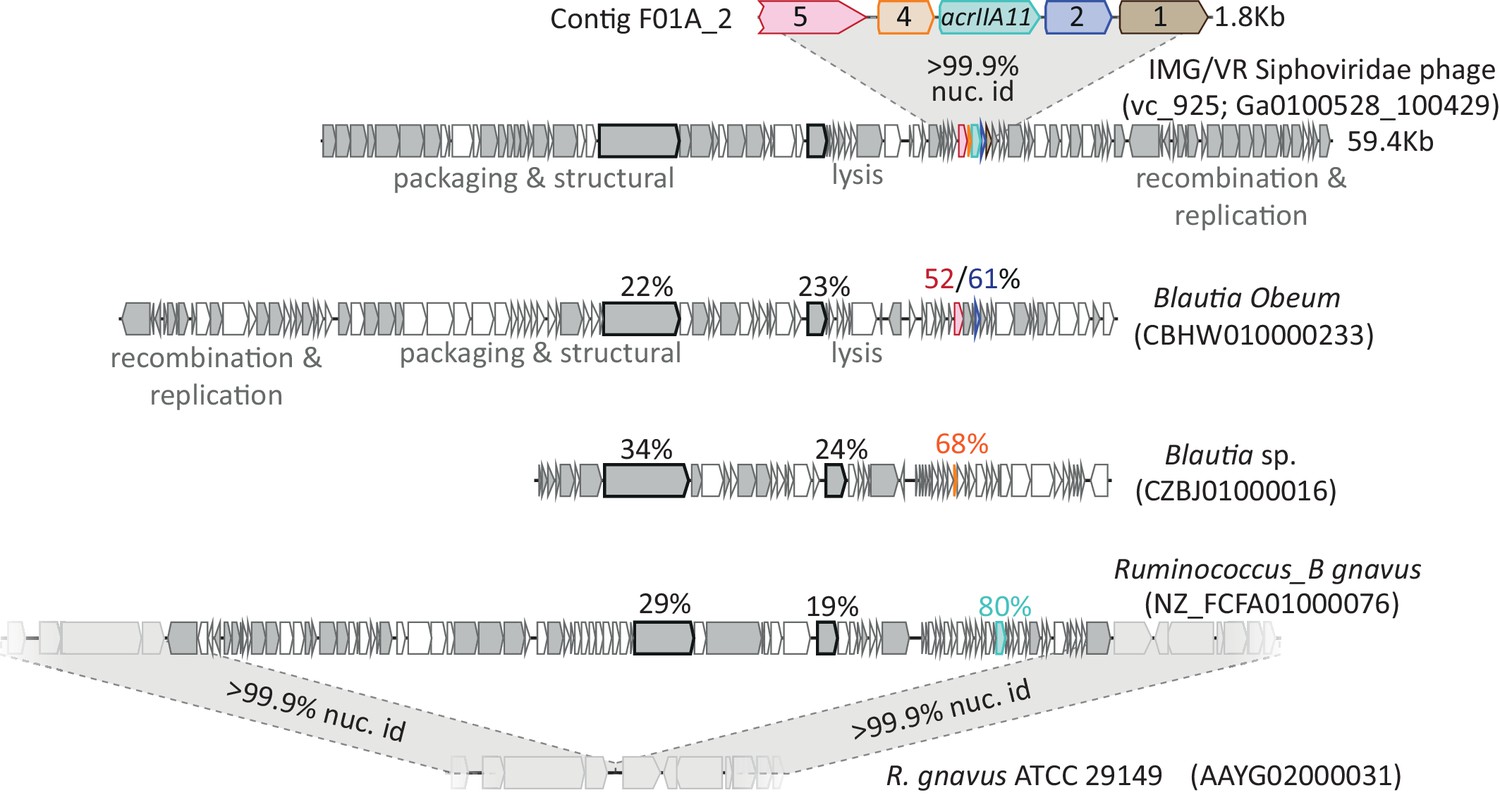
Gray genes denote homologs shared between the AcrIIA11-encoding Siphoviridae phage and three other related phages. Homologs of the genes on contig F01A_2 are indicated by a shared color. Two points of evidence suggest that these genes move via horizontal gene transfer. Firstly, F01A_2 homologs are more closely related than are other homologs in these genomes, which suggests that the F01A_2 homologs (in bright colors) may have a more recent common ancestor than the other gene pairs (in gray). To illustrate this point, two genes found in all genomes (a tape measure protein and reverse transcriptase) are also indicated, using a black outline. Amino acid identities relative to the reference Siphoviridae phage are shown above each indicated gene. Secondly, the genes on contig F01A_2 are not linked to one another across genomes and are routinely gained and lost, indicating that they recombine frequently, which is generally true for phage genes. Thus, it is likely that these genes move by horizontal gene transfer, explaining their presence in accessory regions of these phage genomes, where few conserved genes are found. The depicted homolog of acrIIA11 (in teal, also named acrIIA11a.2) is found in an actively circulating temperate phage of Ruminococcus_B gnavus, as very closely related strains of this bacterium lack a prophage at its integration site. All accession numbers denote NCBI Genbank IDs except for the Siphoviridae phage (for this phage, we use IMG/VR convention and indicate viral_cluster; scaffold_id in parentheses). Contig lengths are depicted to indicate scale.
Figure 3 with 1 supplement
AcrIIA11 protects plasmid and phage from SpyCas9.
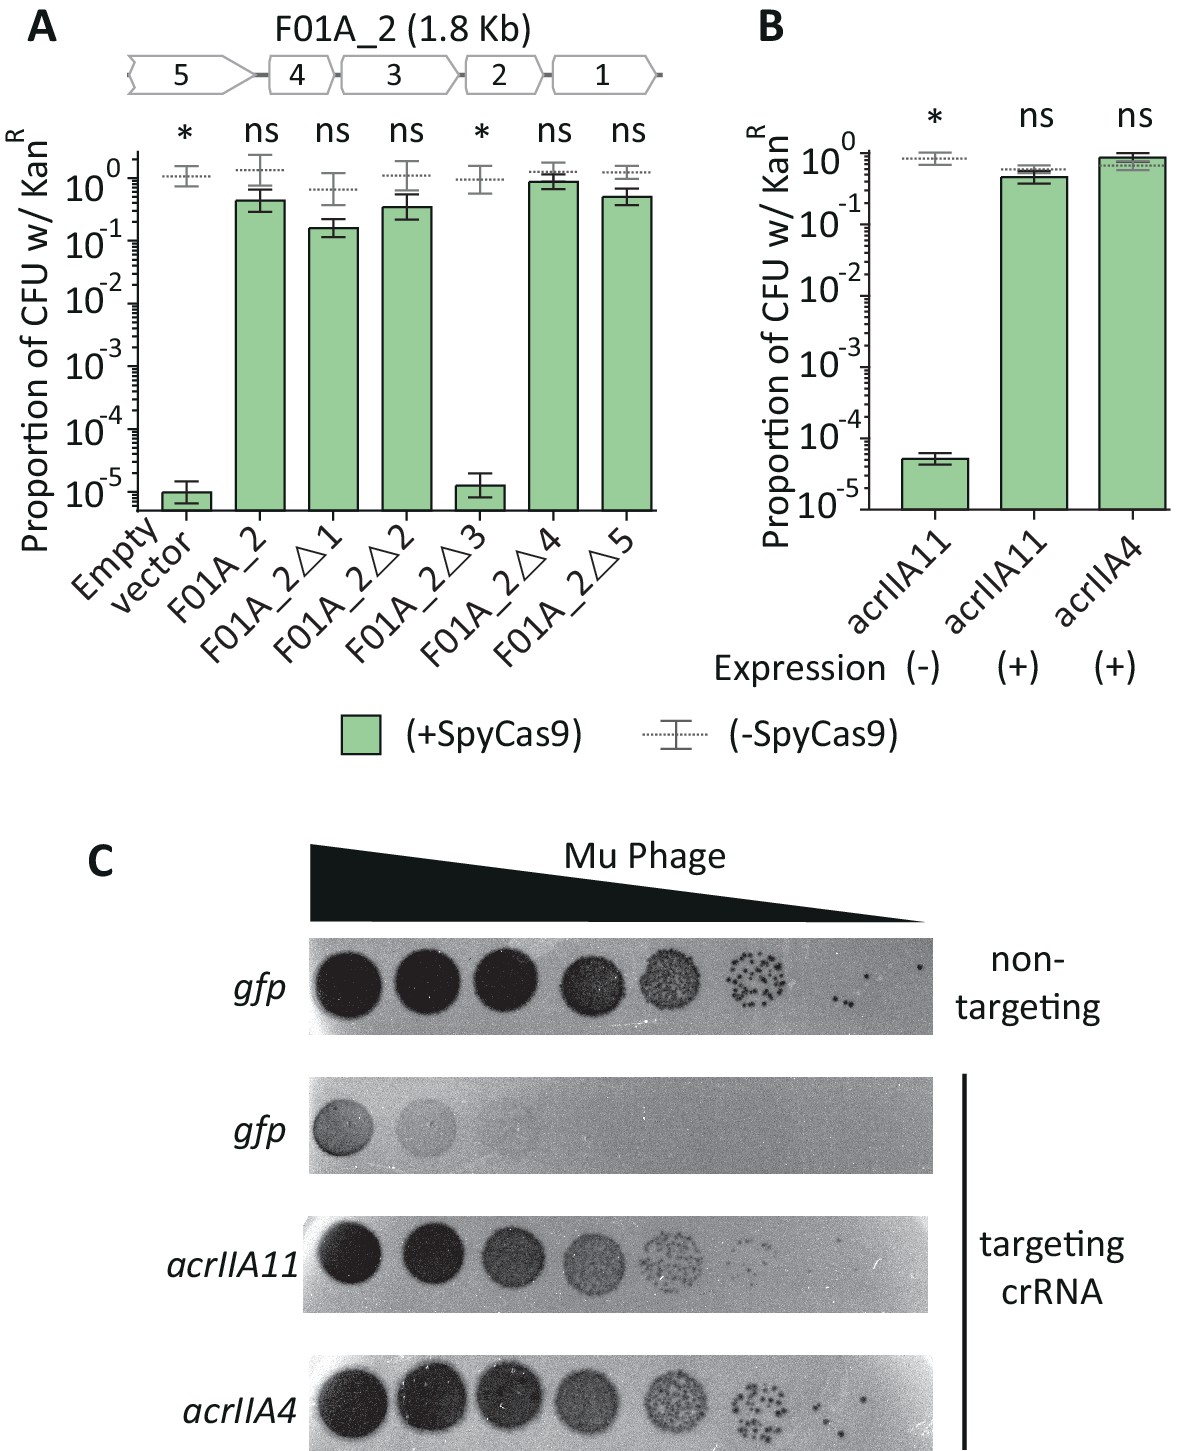
(A) The F01A_2 contig is depicted above the bar chart. Delta symbols (Δ) indicate early stop codons in each gene of the contig. Only the third gene on contig F01A_2 is necessary for SpyCas9 antagonism. (B) Induction of the third gene, named acrIIA11, is sufficient for SpyCas9 antagonism, protecting a plasmid as well as acrIIA4. Asterisks in (A) and (B) depict statistically significant differences in plasmid retention between SpyCas9-inducing and non-inducing conditions (Student’s t-test, p<0.01, n = 3); p-values were corrected for multiple hypotheses and ‘ns’ indicates non-significance (p>0.05). Error bars depict standard error of the mean. (C) Mu phage fitness, measured by plaquing on E. coli expressing Mu-targeting SpyCas9, is measured in the presence of gfp, acrIIA11, or acrIIA4 via serial ten-fold dilutions (also see replicated in Figure 3—figure supplement 1). Based on a non-targeting (n.t.) crRNA control, we conclude that SpyCas9 confers ~105 fold protection against phage Mu in these conditions. Both acrIIA11 and acrIIA4 significantly enhance Mu fitness by inhibiting SpyCas9.
Figure 3—figure supplement 1
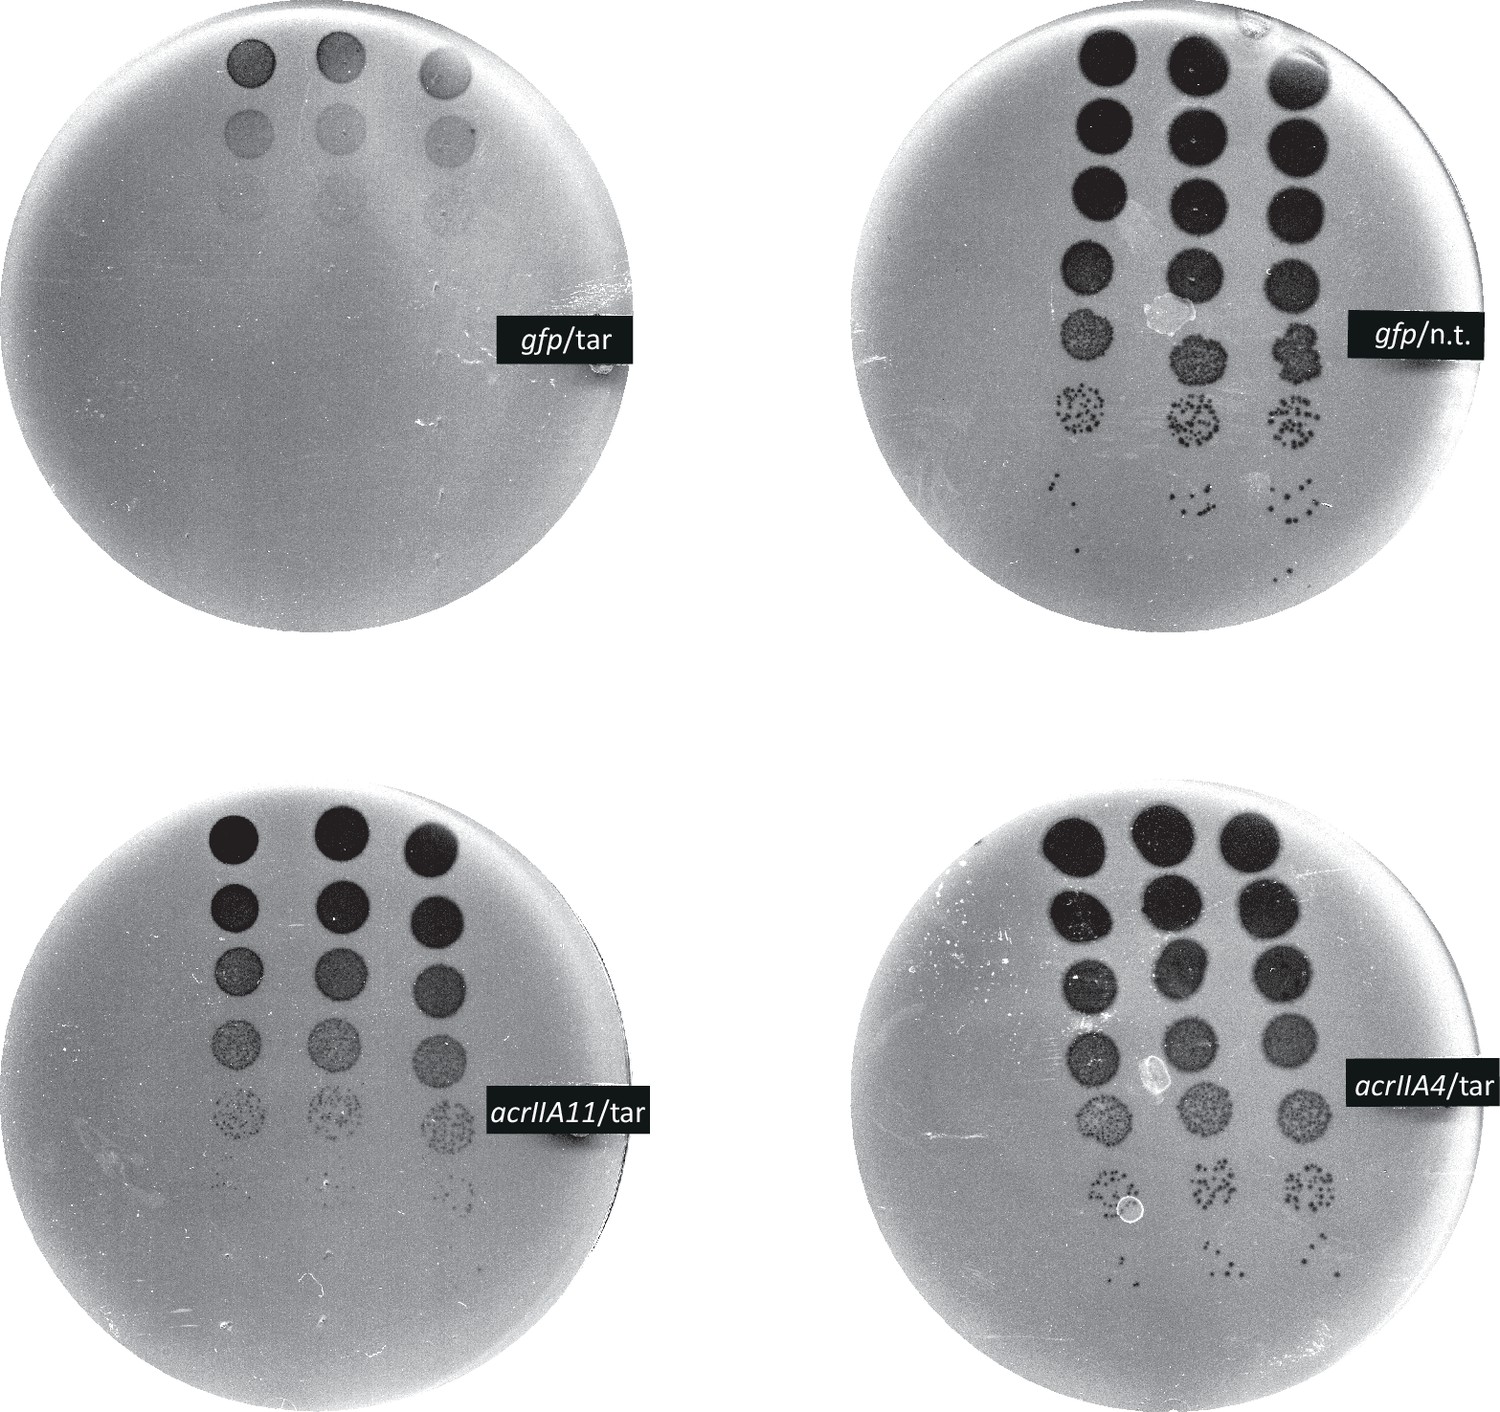
AcrIIA11 protects phage from SpyCas9.
Mu phage fitness, measured by plaquing on E. coli expressing Mu-targeting SpyCas9, is measured in the presence of gfp, acrIIA11, or acrIIA4 via serial ten-fold dilutions. Bacterial clearing (black) occurs when phage Mu overcomes SpyCas9 immunity and lyses E. coli. Based on a non-targeting (n.t.) crRNA control, we conclude that SpyCas9 with a targeting (tar) crRNA confers ~105 fold protection against phage Mu in these conditions. Both acrIIA11 and acrIIA4 significantly enhance Mu fitness by inhibiting SpyCas9. The indicated anti-CRISPR gene or gfp control is expressed from a second plasmid, in trans.
Figure 4 with 4 supplements
Diverse AcrIIA11 homologs inhibit SpyCas9.
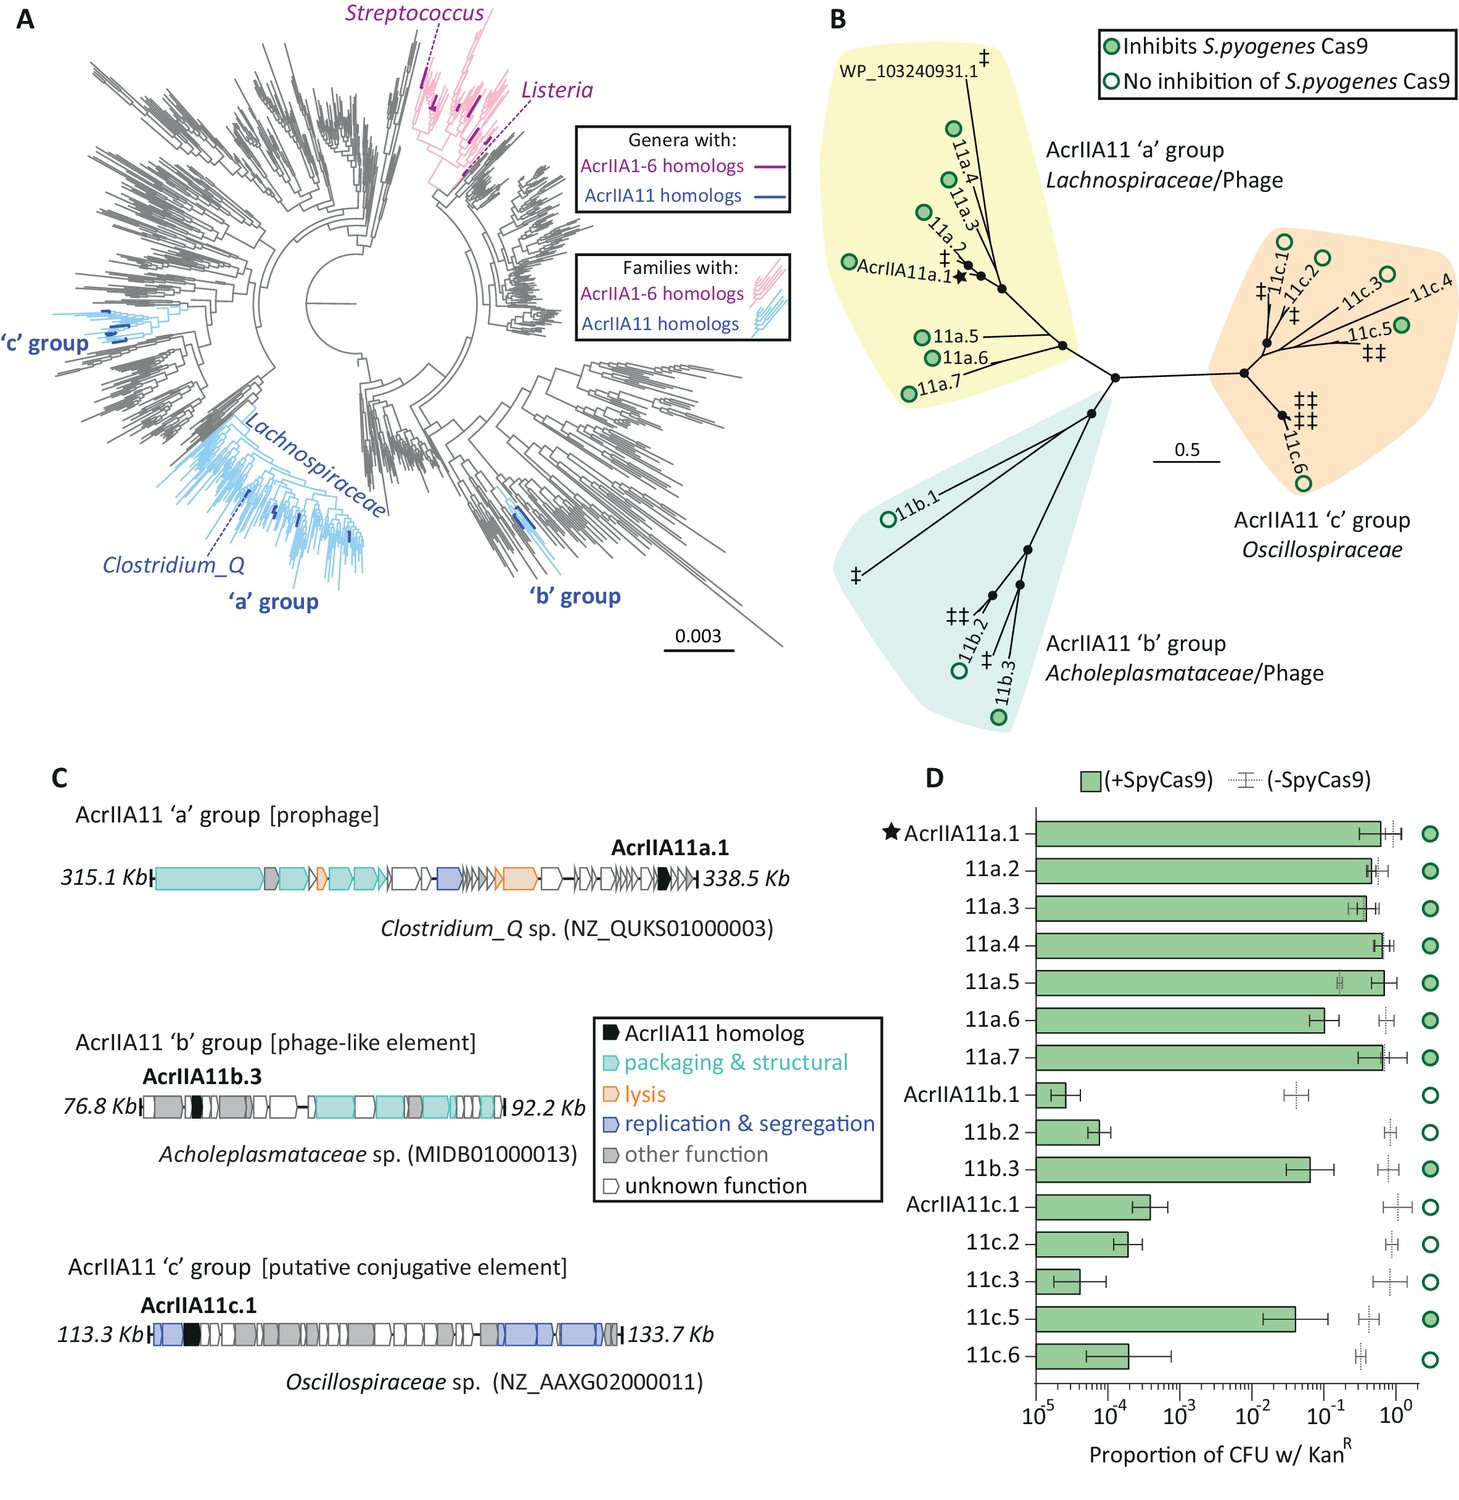
(A) A phylogenetic tree of Firmicutes and related phyla that shows the widespread dissemination of acrIIA11 relative to other type II-A acrs. Each tip represents a bacterial genus; families colored light blue contain acrIIA11 homologs while families colored pink contain homologs of acrIIA1 - acrIIA6. Genera are colored dark blue or magenta if acr homologs could confidently be assigned to this phylogenetic resolution. This tree also depicts the phylogenetic placement of the following genera: Clostridium_Q, Streptococcus, and Listeria (the genus in which the most type II-A acrs have been discovered). See Figure 4—figure supplement 2 for an annotated version of this phylogeny that also includes the acrs recently discovered by Uribe et al (acrIIA7 – acrIIA10). (B) An unrooted phylogenetic tree of predicted AcrIIA11 homologs clusters into three major groups that correspond to the bacterial families depicted in (A) and Figure 4—figure supplement 2. Circles at nodes indicate bootstrap support >0.75. The star indicates the original AcrIIA11 sequence isolated via functional selection. Open and filled circles indicate whether a given homolog inhibits SpyCas9 in a plasmid protection assay. Untested homologs are indicated with a double-dagger (‡); WP_ 103240931.1 is shown to give context to Figure 4—figure supplement 3A. (C) Examples of MGEs that encode AcrIIA11 homologs from each group in (B); AcrIIA11 homologs from each group are found in a variety of MGEs (Figure 4—figure supplement 3A). AcrAllA11 homologs are shown in black, other genes are colored by functional category. Accession numbers denote NCBI Genbank IDs and the genome coordinates bounding each locus are adjacent to each sequence. (D) AcrIIA11 homologs antagonize SpyCas9. Open circles depict statistically significant differences in plasmid retention between SpyCas9-inducing and non-inducing conditions (Student’s t-test, p<0.01, n = 3). Closed circles depict samples for which SpyCas9 induction caused no significant difference in plasmid retention (Student’s t-test p>0.05, n = 3). These symbols correspond to the node labels in (B). All p-values were corrected for multiple hypotheses using Bonferroni’s method. Toxicity upon AcrIIA11c.4 expression prevented it from yielding meaningful data. Error bars depict standard error of the mean.
Figure 4—figure supplement 1
Summary statistics for AcrIIA11 homologs.
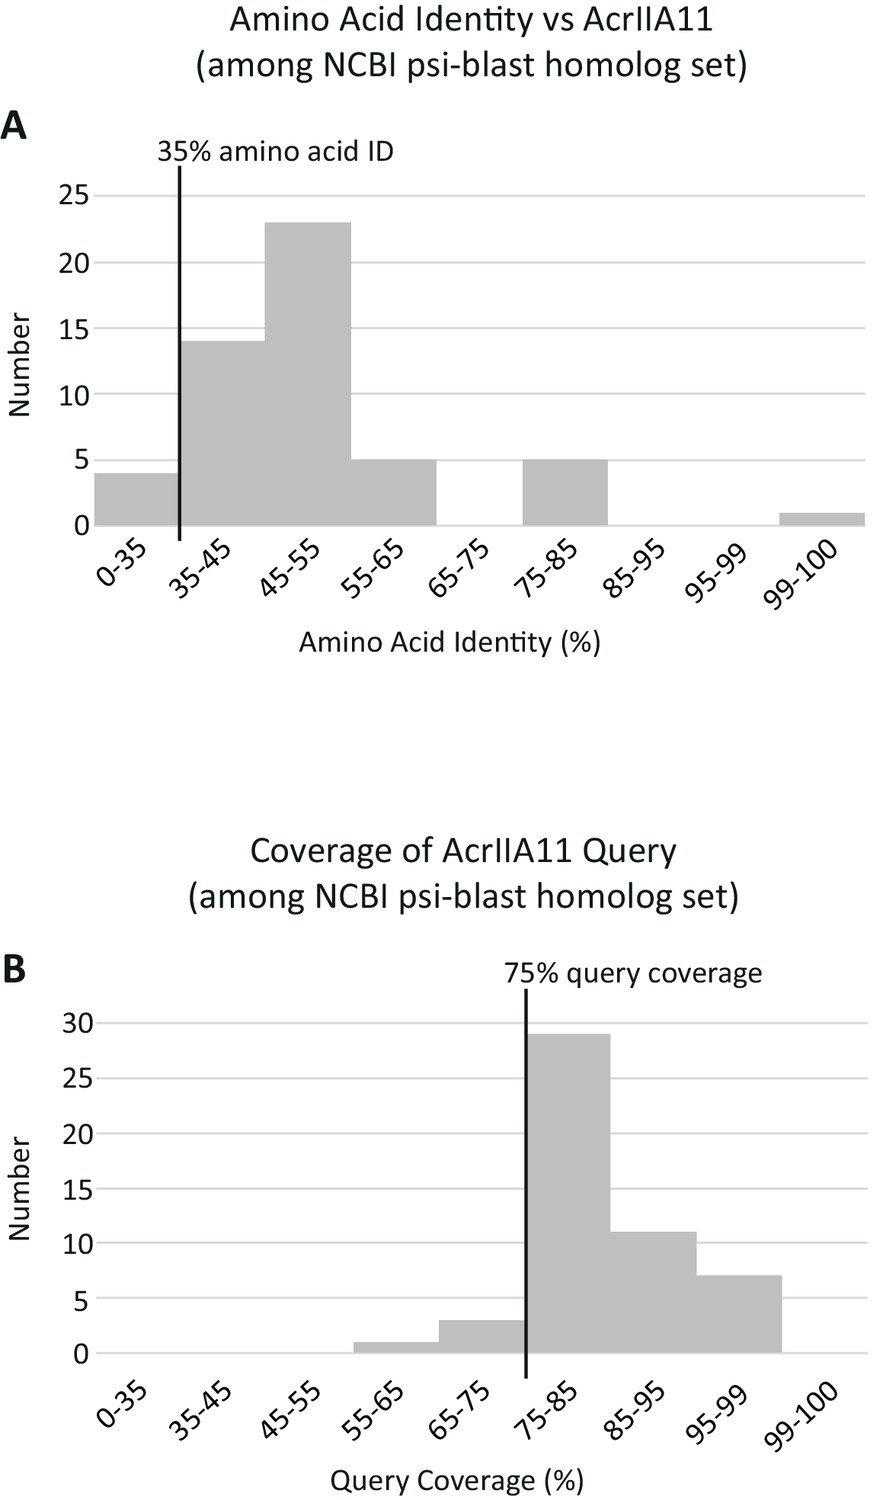
Querying AcrIIA11 against the NCBI nr database via three iterations of psi-BLAST (using default parameters and an e-value threshold of e−50) returned a set of sequences almost identical to that obtained using the following, query-agnostic thresholds: 35% amino acid identity and 75% query coverage. (A) A histogram of the psi-BLAST homologs depicting their percentage identity to AcrIIA11, calculated via BLASTp. (B) A histogram of the psi-BLAST homologs depicting their coverage of the AcrIIA11 query, calculated via BLASTp. The 35% and 75% thresholds used for Acr homolog retrieval are indicated by black vertical lines. These thresholds encompass most of the sequences obtained via psi-BLAST and no sequence meeting these thresholds had an e-value worse than e−50 by psi-blast.
Figure 4—figure supplement 2
AcrIIA11 is widely distributed across Firmicutes and related phyla.
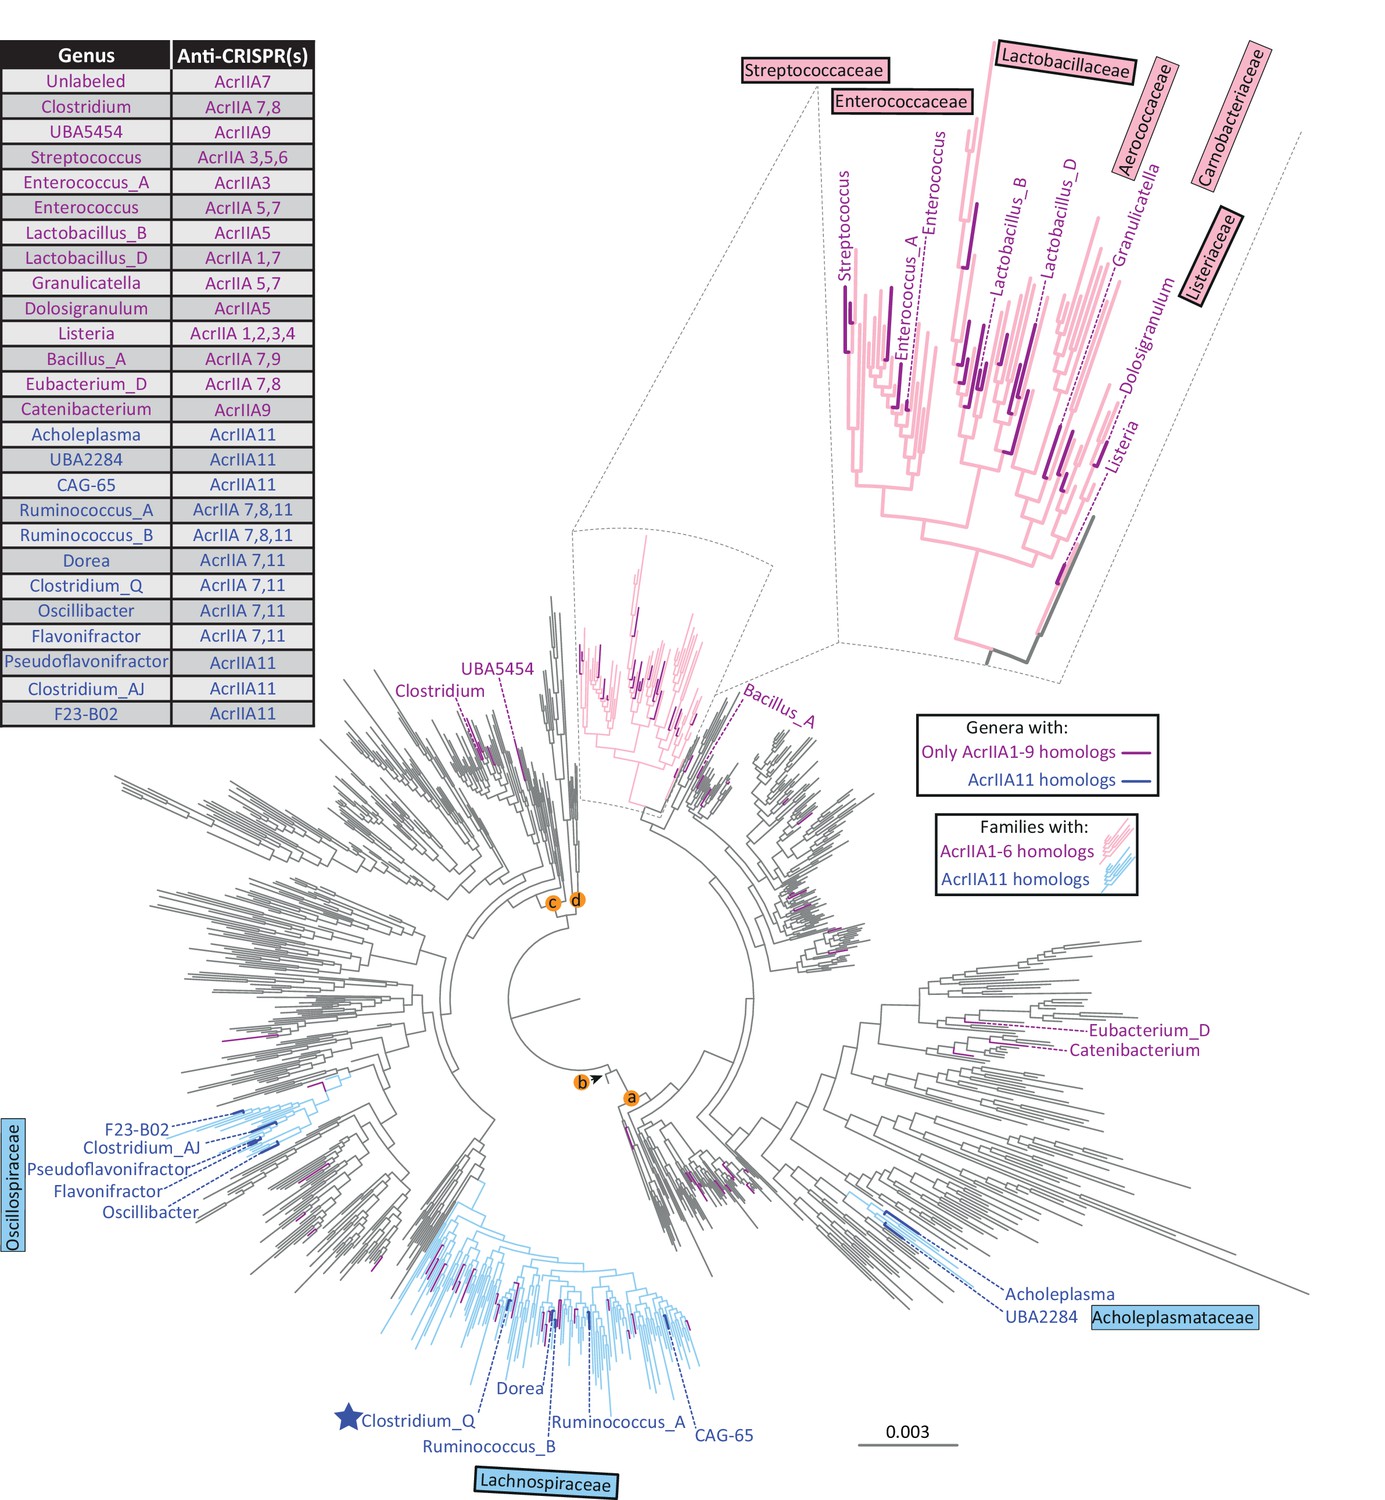
As in Figure 4A, each tip represents a genus, families in light blue contain acrIIA11 homologs, and families in pink contain homologs of acrIIA1 – acrIIA6. A thick border around a family name indicates that is enriched for type II-A CRISPR-Cas systems relative to all bacterial families (chi-squared test, p<1×10⁻⁴, family classification used the GTDB scheme with functional attributions provided by AnnoTree). Recently, Uribe et al identified four additional acrs via functional metagenomics, three of which have homologs within the depicted phylogenetic tree (acrIIA7 – acrIIA9). Genera with only homologs of acrIIA1 – acrIIA9 are shown in magenta whereas genera that contain homologs of acrIIA11 are colored dark blue. The table indicates which acrs are found in each labeled genus. Unlabeled genera in magenta contain only homologs of acrIIA7 and are listed in Supplementary file 1 table S5. The star indicates the Clostridium_Q genus depicted in Figure 2C. We used the GTDB taxonomy because it helps to resolve a well-recognized polyphyly among Clostridia and ensures that taxonomic labels are linked to monophyletic groups while applying taxonomic ranks (phylum, class, order, etc.) at even phylogenetic depths. Lettered nodes indicate GTDB phyla (a: Firmicutes, b: Firmicutes_D, c: Firmicutes_A, d: Firmicutes_F), two of which contain genomes encoding acrIIA11 homologs.
Figure 4—figure supplement 3
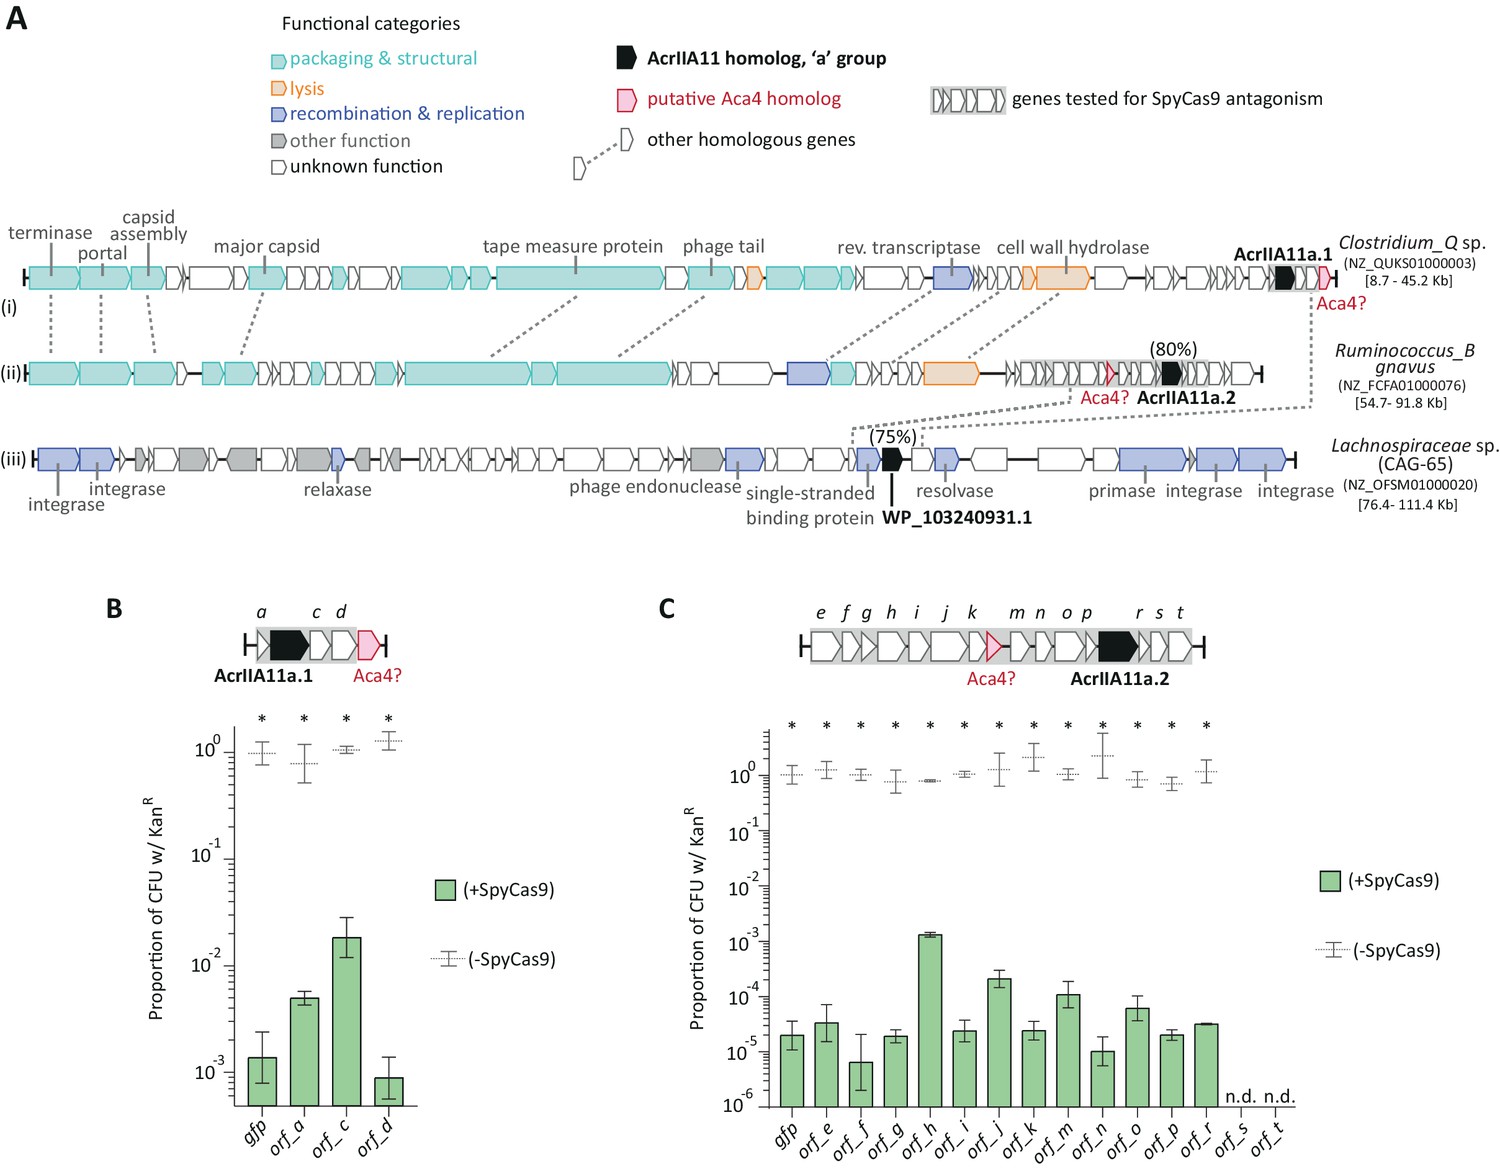
AcrIIA11 moves by horizontal gene transfer and is found nearby putative anti-CRISPR associated genes.
(A) Genes that encode AcrIIA11 homologs from the ‘a’ group (in black) are found in diverged phage (i, ii) and other unrelated MGEs (e.g., iii), demonstrating their movement by horizontal gene transfer. Percentages above acrIIA11 genes indicate amino acid identities of their protein products relative to AcrIIA11a.1. Homologous genes are connected by dashed lines. Genes without dashed lines could not be assigned a confident homolog, except in the cases of acrIIA11 (in black) and aca4 (in red). The genes labeled ‘Aca4?’ from Clostridium_Q and Ruminococcus_B may be homologous to a helix-turn-helix factor of the same name associated with type I-F Acrs (ABR13385.1), as they share 20% and 27% amino acid identity, respectively. The acronym ‘Aca’ means anti-CRISPR associated. Genes boxed in gray were tested for SpyCas9 inhibition in plasmid protection assays depicted in (B) and (C). Taxonomic and NCBI accession identifiers are listed to the right of each sequence, with sequence coordinates in brackets. CAG-65 refers to a GTDB genus within the family Lachnospiraceae labeled on the phylogeny in Figure 4—figure supplement 2. (B) ORFs flanking acrIIA11a.1 poorly protect, or do not protect, a target plasmid from SpyCas9-mediated elimination, compared to GFP. (C) ORFs flanking acrIIA11a.2 poorly protect, or do not protect, a target plasmid from SpyCas9-mediated elimination, compared to GFP. Asterisks in (B) and (C) depict statistically significant differences in plasmid retention between SpyCas9-inducing and non-inducing conditions (Student’s t-test, p<0.01, n = 3); p-values were corrected for multiple hypotheses testing using Bonferroni’s method. As in Figure 4D, samples were considered inhibitory if there was no significant difference in plasmid retention upon Cas9 induction (p>0.05). By this metric, no ORF flanking acrIIA11a.1 or acrIIA11a.2 inhibited SpyCas9. See Figure 4D for identical assays using each AcrIIA11 homolog. Error bars depict standard error of the mean; ‘n.d.’ stands for not determinable, due to severe toxicity upon ORF induction.
Figure 4—figure supplement 4
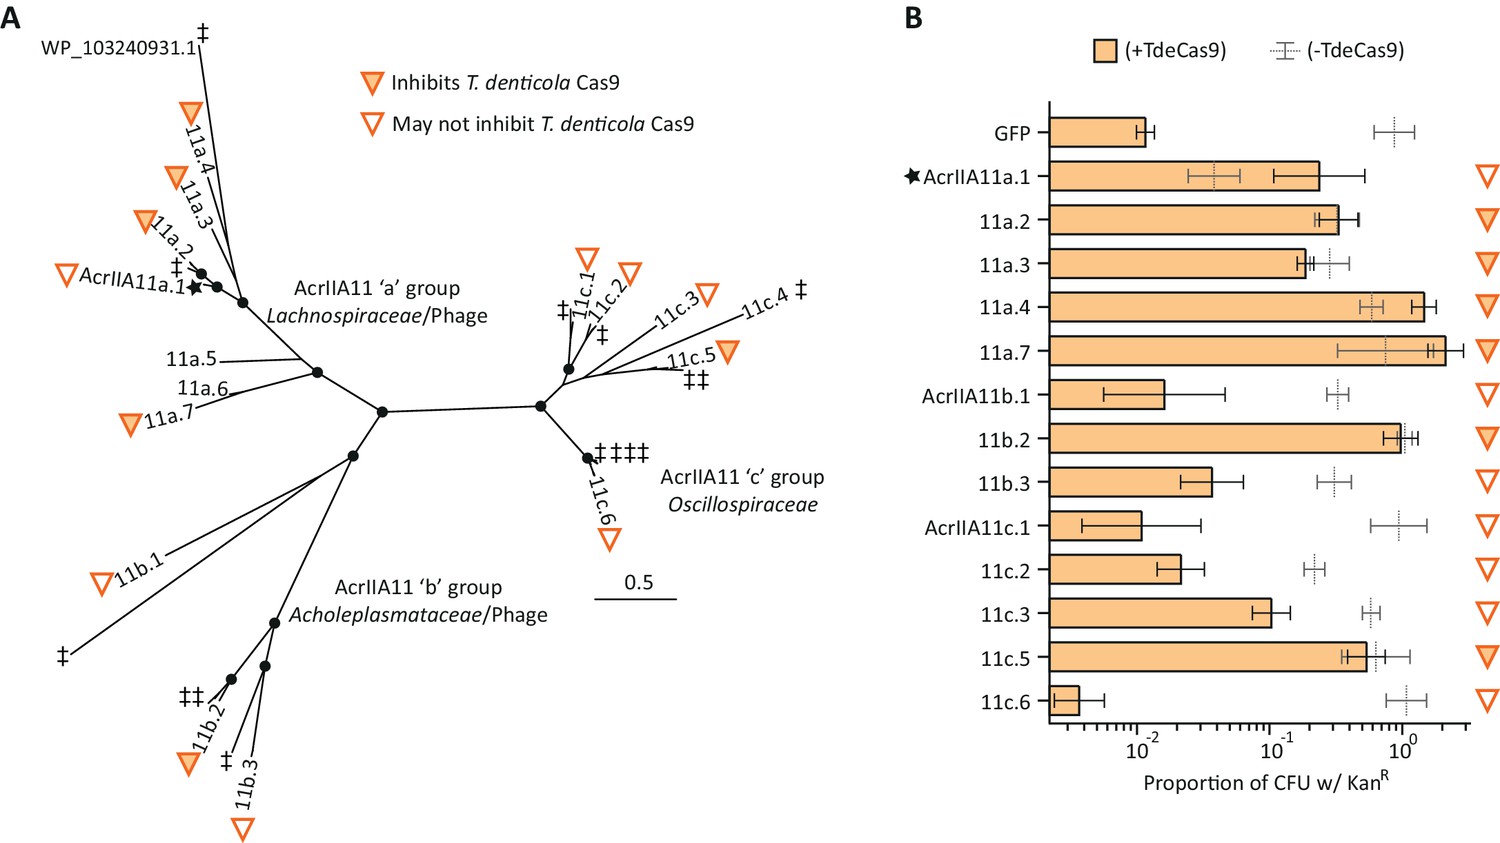
Diverse AcrIIA11 homologs inhibit TdeCas9.
(A) The unrooted AcrIIA11 phylogenetic tree from Figure 4B is shown, which shows AcrIIA11 homologs cluster into three major clades that correspond to the bacterial families depicted in Figure 4A and Figure 4—figure supplement 2. Circles at nodes indicate bootstrap support >0.75. The star indicates the original AcrIIA11 sequence isolated via functional selection. Open and filled triangles indicate whether a given homolog inhibits TdeCas9 in the plasmid protection assay in (B). Untested homologs are indicated with a double-dagger (‡); WP_ 103240931.1 is shown to give context to Figure 4—figure supplement 3. AcrIIA11a.5 and AcrIIA11a.6 homologs showed delayed growth phenotypes when expressed with TdeCas9 which prevented these sequences from yielding meaningful data. (B) AcrIIA11 homologs antagonize TdeCas9 in a plasmid protection assay. As in (A), filled triangles indicate homologs that inhibit TdeCas9. For these homologs, TdeCas9 induction caused no significant difference in plasmid retention (Student’s t-test p>0.05, n = 3), as measured by the proportion of KanR colonies. Using the same metric, these samples also outperformed a GFP negative control under TdeCas9-inducing conditions (Student’s t-test, p<0.005, n = 3); p-values were corrected for multiple hypotheses via the Bonferroni method. Genotypes that do not meet both of these significance thresholds are marked with open triangles, as in (A). Compared to SpyCas9, plasmid clearance was less efficient with TdeCas9, reducing the dynamic range of this assay and the power to unambiguously determine inhibitory status for some AcrIIA11 orthologs (e.g. AcrIIA11a.1, AcrIIa11b.3, AcrIIA11c.3). Error bars depict standard error of the mean.
Figure 5 with 2 supplements
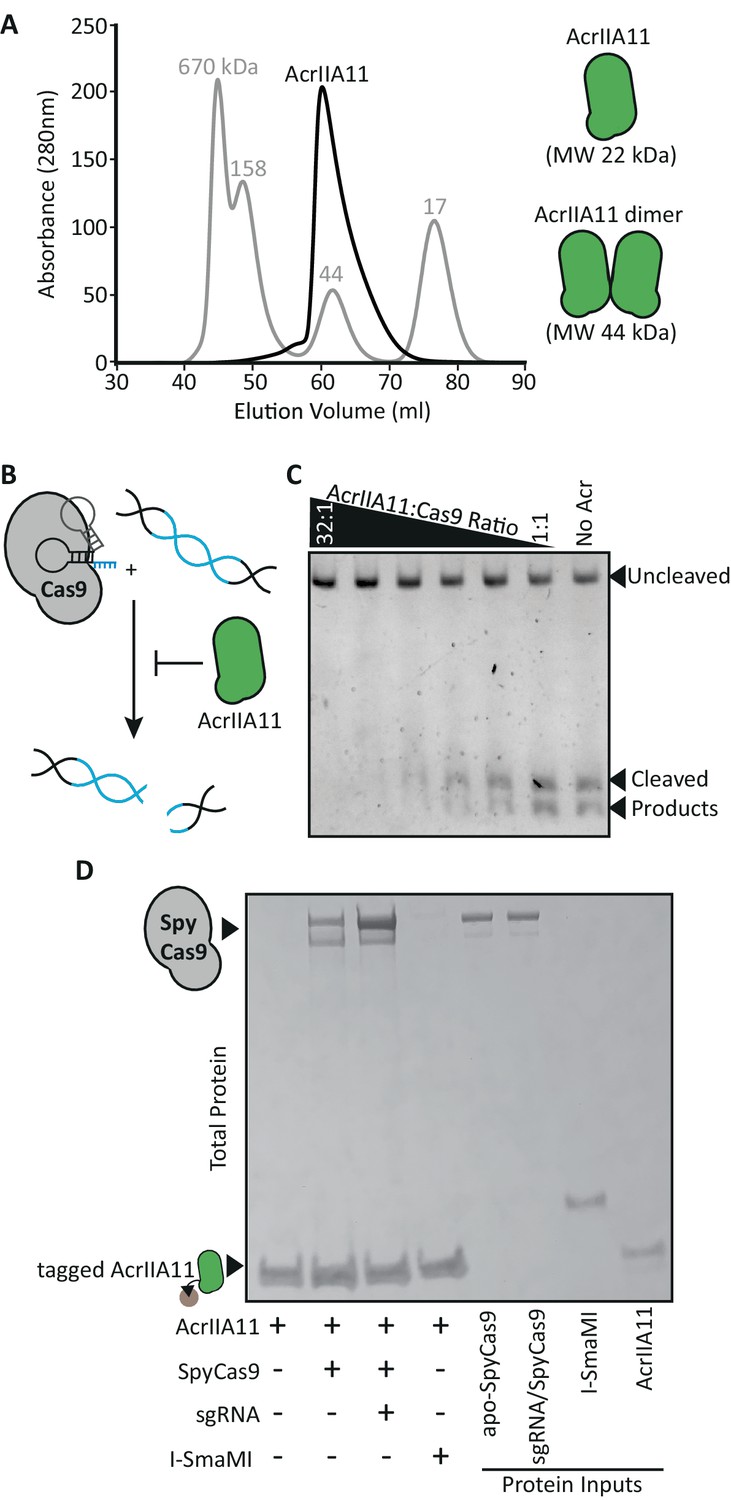
AcrIIA11 binds SpyCas9 to inhibit dsDNA cleavage.
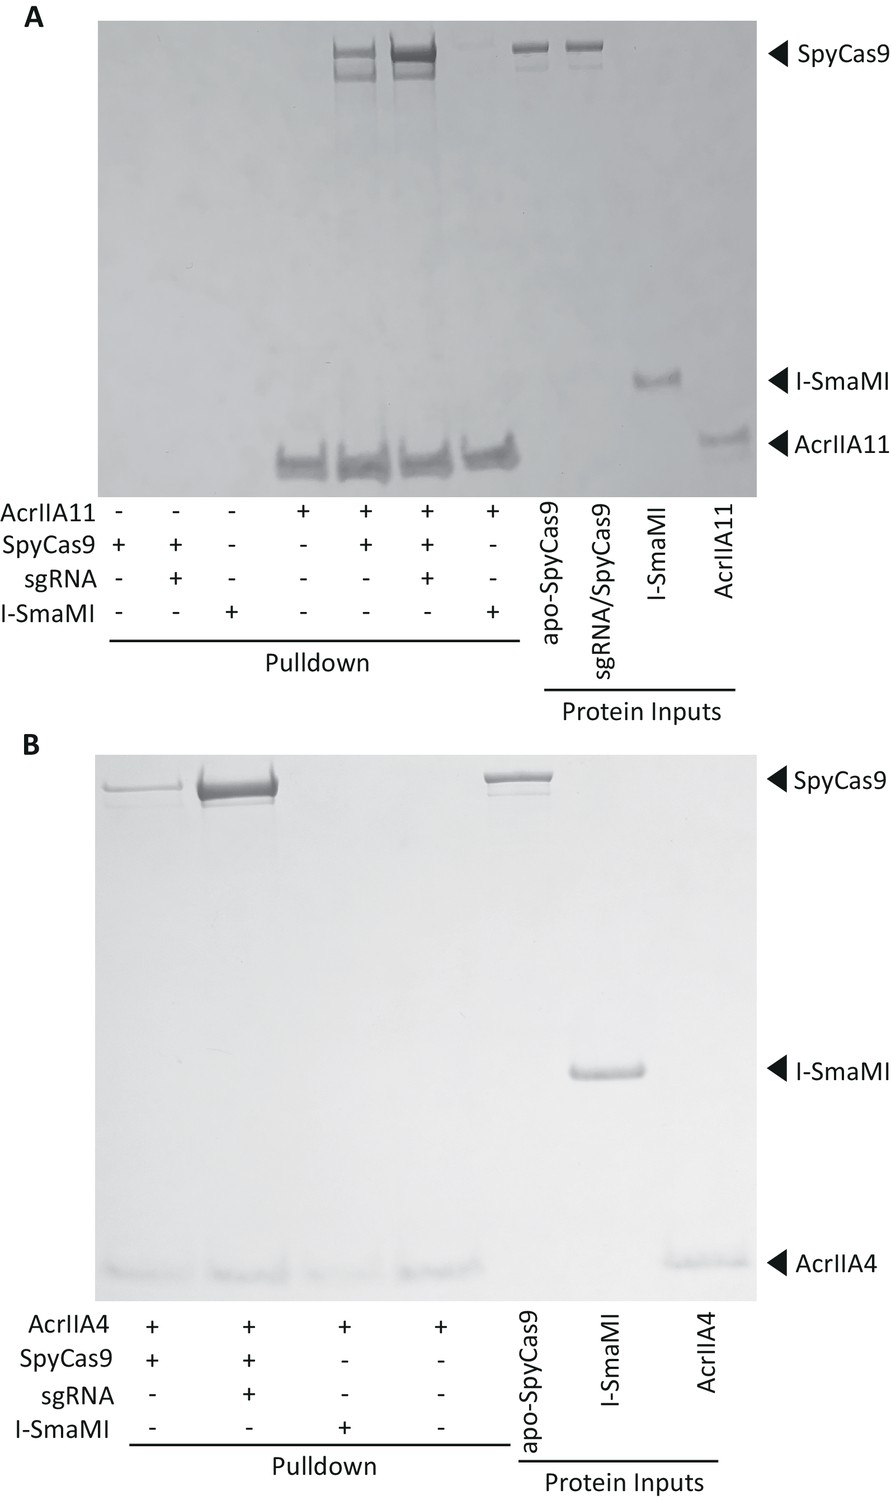
(A) AcrIIA11 elutes as a dimer on size exclusion chromatography. The gray trace depicts protein standards of the indicated molecular weight. The black trace shows AcrIIA11 elution. The predicted molecular weights of its monomeric and dimeric forms are depicted to the right. (B) Schematic of dsDNA cleavage assay in (C). (C) AcrIIA11 inhibits the ability of SpyCas9 (0.4 µM) to cleave a linear 2.6 Kb dsDNA substrate in a concentration-dependent manner. (D) AcrIIA11 binds SpyCas9, with a moderate preference for the sgRNA-loaded form. A Coomassie stain of total protein following pulldown of a 2x-strep-tagged AcrIIA11 incubated with either purified SpyCas9 (+ /- sgRNA) or the meganuclease I-SmaMI (as a negative control). SpyCas9 often runs as a doublet, likely due to partial protein degradation, and sgRNA does not influence SpyCas9 stability in these conditions (see protein inputs).
Figure 5—figure supplement 1
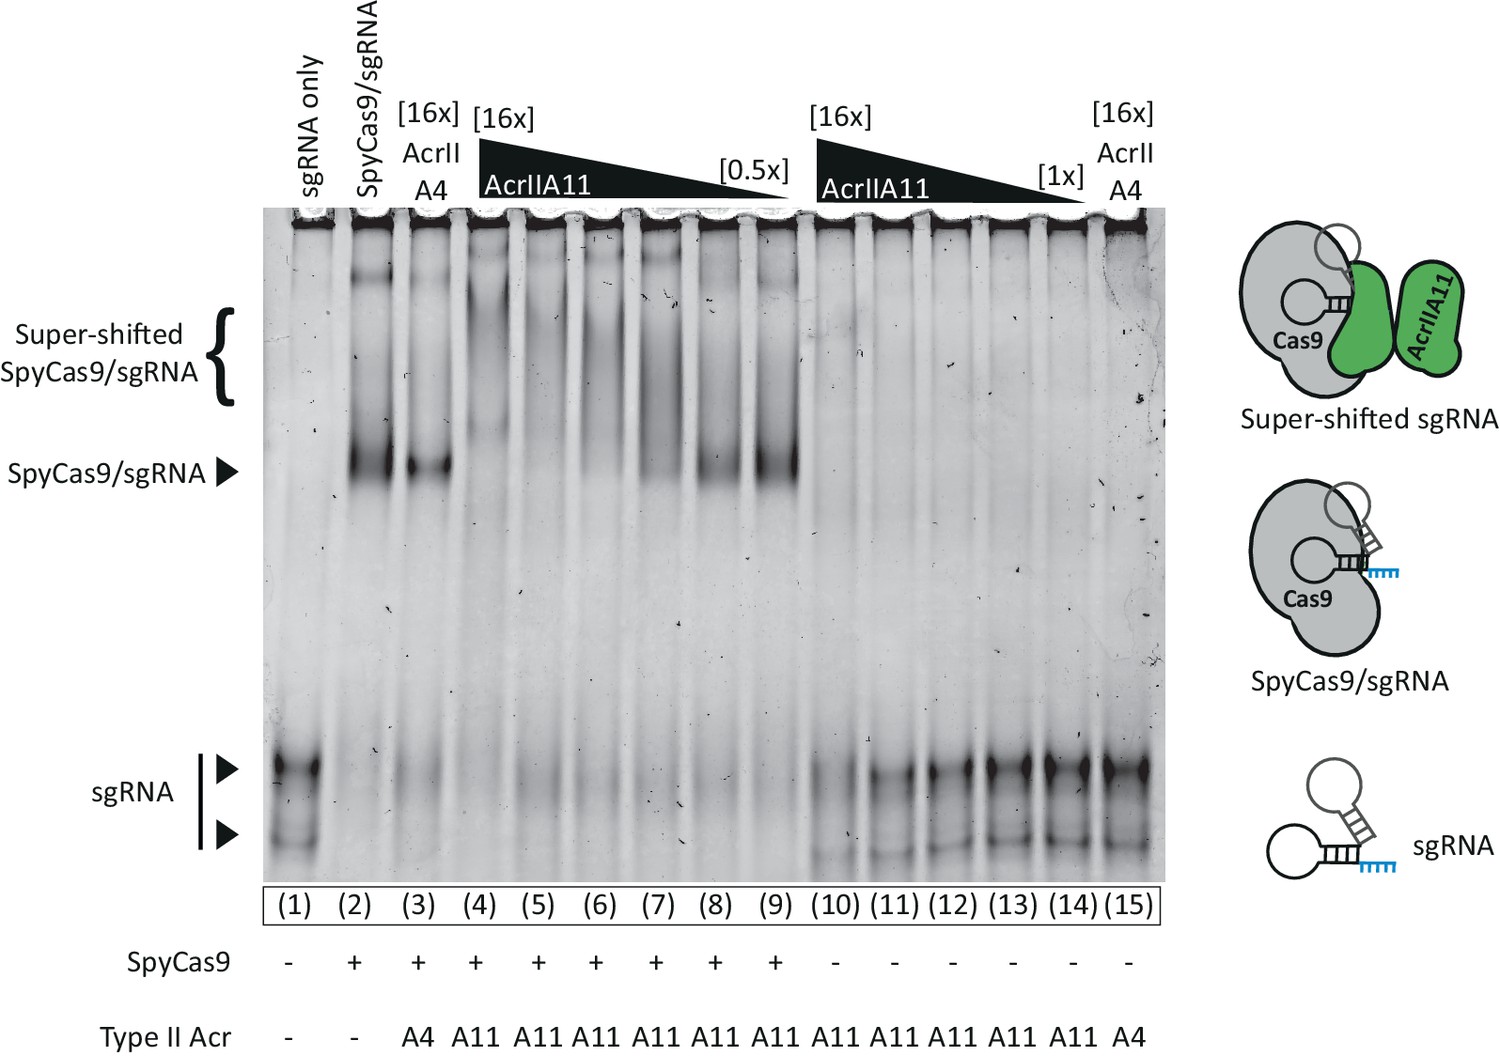
AcrIIA11 does not prevent a sgRNA gel-shift, indicating that the RNA is protein-bound.
An EMSA examining the relative mobility of S. pyogenes sgRNA (0.2 µM) through an 8% acrylamide native gel in the presence of SpyCas9 (2 µM) and/or various Acrs (1–32 µM). Neither AcrIIA4 nor AcrIIA11 prevent a gel-shift shift upon SpyCas9 addition, though the nature of the shift is different between Acrs. AcrIIA11 appears to super-shift the SpyCas9/sgRNA complex, which may represent AcrIIA11 bound to this complex. Lanes 10–14 indicate that AcrIIA11 does not readily bind sgRNA. Prominent bands are indicated to the left of the gel and proposed models are cartooned at right. SYBR-Gold was used to visualize sgRNA.
Figure 5—figure supplement 2
AcrIIA11 binds SpyCas9 with a moderate preference for the sgRNA-loaded form.
(A) AcrIIA11 binds SpyCas9. (B) AcrIIA4 binds SpyCas9. SpyCas9 and sgRNA were pre-incubated before mixing with a 2x-strep-tagged AcrIIA11 (A) or AcrIIA4 (B). SpyCas9 without sgRNA and the meganuclease I-SmaMI were also used. (A) Pulldowns on AcrIIA11 brought with them SpyCas9 but not I-SmaMI, and the presence of sgRNA improved the strength of this interaction, but not to the degree seen with AcrIIA4 in (B). These images depict total protein content visualized by Coomassie stain. The gel in (A) is identical to that depicted in Figure 5D except that the three leftmost control lanes have not been cropped from this image.
Figure 6 with 1 supplement
AcrIIA11 inhibits SpyCas9 via a novel mechanism.
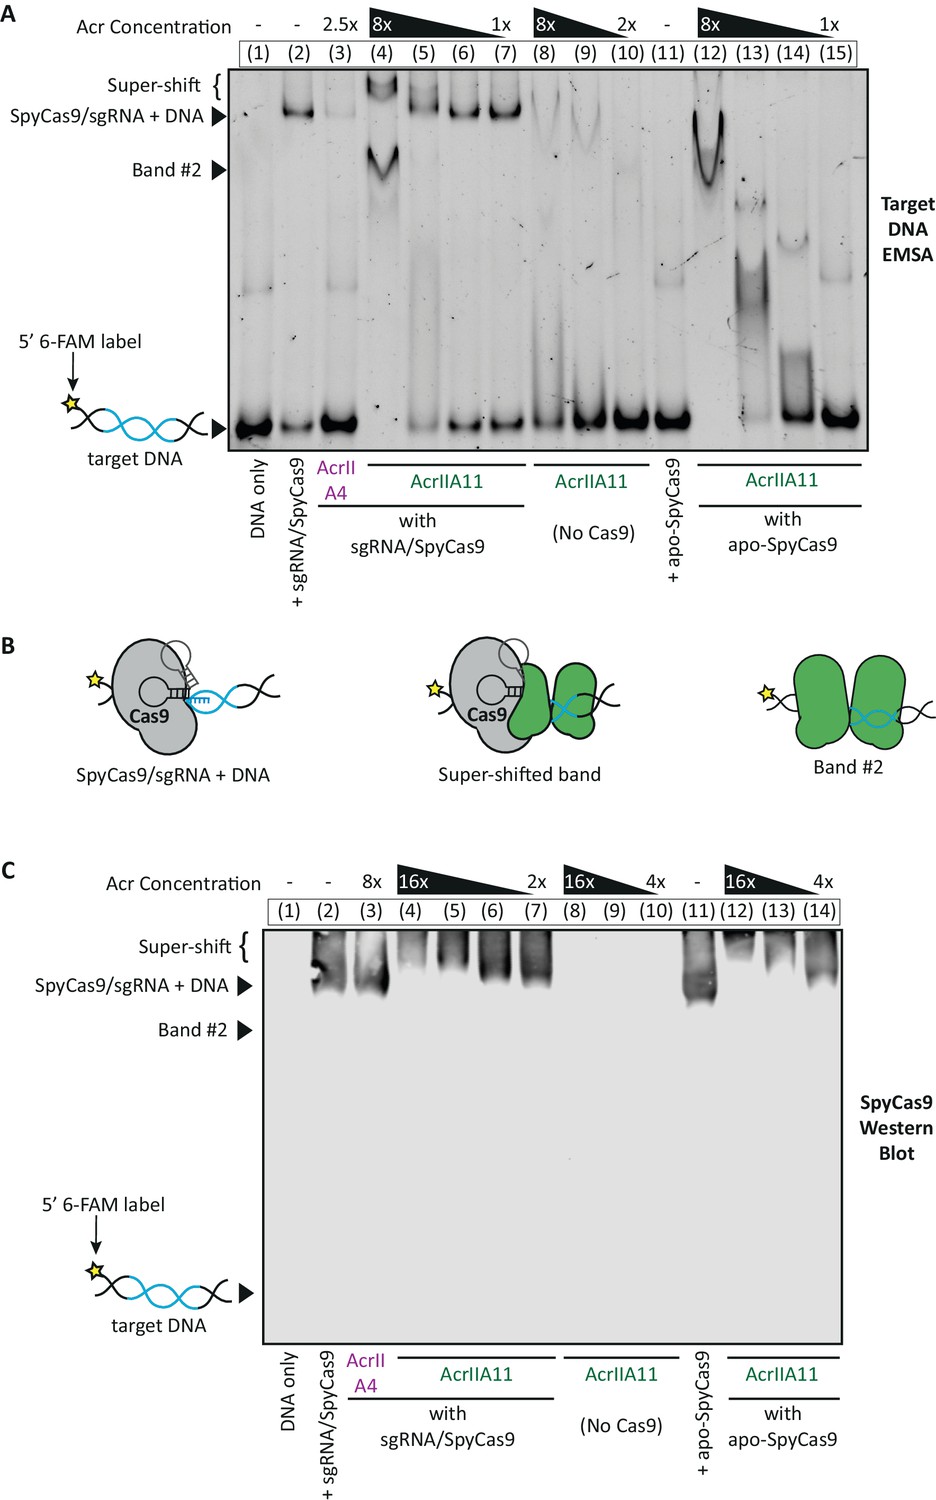
(A) Using an EMSA, we examined the gel shift experienced by a 60 bp target DNA, fluorescently labeled with a 6-FAM marker and incubated with purified SpyCas9, sgRNA, and/or purified Acrs. Divalent cations were omitted from reactions such that SpyCas9 could bind, but not cleave, target DNA, as in Lee et al. (2018). Lane numbers and Acr concentrations (relative to SpyCas9) are depicted above the native gel. Lane contents are depicted below the gel; 2 µM SpyCas9 was used. Key bands are annotated to the left of the gel. (B) Proposed explanations for the key bands in (A) are schematized. (C) A Western blot for SpyCas9 was performed on an EMSA like the one shown in (A). SpyCas9 does not co-migrate with band#2, indicating that AcrIIA11 binds dsDNA to form this band. The positions of unbound target DNA, band #2, SpyCas9-bound DNA, and the super-shift are indicated to the left of the blot. The positions of these key bands were determined using a matched DNA EMSA on a 36 bp target sequence, which is depicted alongside this blot in Figure 6—figure supplement 1. Taken together, (A) and (C) indicate that AcrIIA11 binds the SpyCa9/sgRNA/dsDNA ternary complex and is stimulated to bind dsDNA in the presence of SpyCas9.
Figure 6—figure supplement 1
AcrIIA11 inhibits SpyCas9 via a novel mechanism.
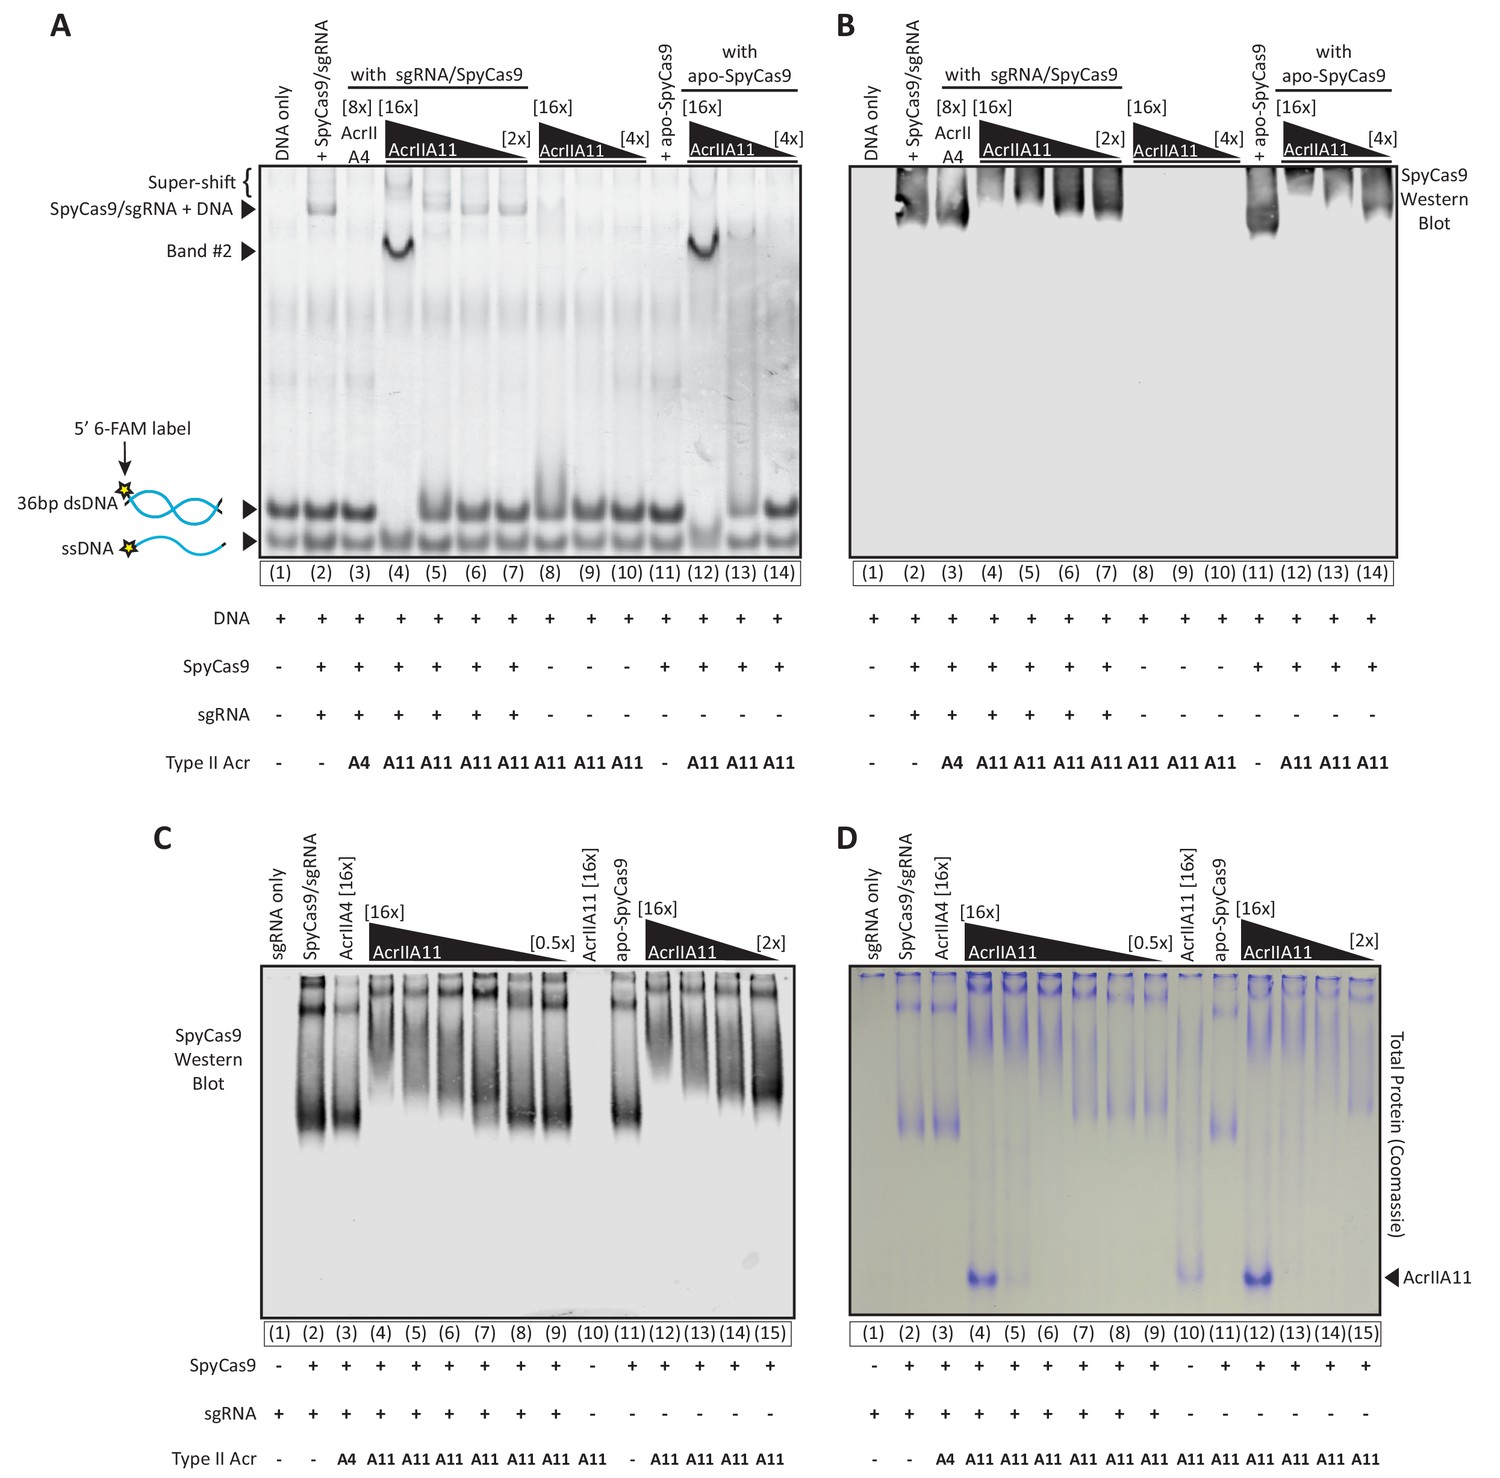
(A) Using an EMSA, we examined the gel shift experienced by a 36 bp target dsDNA, fluorescently labeled with a 6-FAM marker and incubated with either purified SpyCas9, sgRNA, and/or purified Acrs. Divalent cations were omitted from reactions such that SpyCas9 could bind, but not cleave, target DNA, as previously shown (Lee et al., 2018). SpyCas9 did not bind the shorter dsDNA target used in these experiments as proficiently as it did the 60 bp oligo used in Figure 6A, explaining the fainter SpyCas9-bound bands. Lane numbers and reaction components are depicted below the native gel. Acr concentrations are depicted above the gel in brackets, relative to SpyCas9 (which was used at 2.25 µM). Key bands are annotated to the left of the gel. (B) A Western blot of the same gel depicted in (A), probing for SpyCas9. Gel and blot images were manually aligned using well and lane delineators, cropped identically, and depicted next to one another. Thus, the SpyCas9 migration in (B) is directly comparable to the dsDNA migration depicted in (A). No SpyCas9 co-migrates with band #2, seen in (A). Taken together, (A) and (B) indicate that AcrIIA11 binds the SpyCa9/sgRNA/dsDNA ternary complex, binds dsDNA but not ssDNA, and is stimulated to bind dsDNA in the presence of SpyCas9. (C) SpyCas9 was incubated with Acrs at varying concentrations with and without sgRNA, run through a native gel, and a Western Blot against SpyCas9 was performed. Independent of sgRNA, AcrIIA11 restricts the migration of SpyCas9 through the native gel in a concentration dependent manner, suggestive of binding. Lane numbers and reaction components are depicted below the native gel. Acr concentrations are depicted above the gel in brackets, relative to SpyCas9 (which was used at 2 µM). The gel used in (C) was run for a longer time than the gel used in (B), explaining the extended SpyCas9 migration in (C). (D) A native gel was run exactly as in (C) but stained for total protein content with Coomassie dye rather than used for a Western blot. Much of the Coomassie-stained protein in (D) matches the SpyCas9 signal in (C), with additional bands that correspond to AcrIIA11 (indicated at right). In the presence of SpyCas9, the AcrIIA11 band appears brighter, perhaps indicating stabilization of a conformation or oligomer state of the protein. Protein is visible in an AcrIIA11-only control (lane 10) in (D) at the same position at which SpyCas9’s migration is restricted in (C) (lanes 4 and 12).
Figure 7 with 1 supplement

AcrIIA11 inhibits SpyCas9 activity in human cells.
(A) AcrIIA4 and AcrIIA11a.1 inhibit SpyCas9 cleavage at the CACNA1D locus, as determined via a surveyor nuclease assay with T7 endonuclease I (T7E1). T7E1 cleaves dsDNA that has small insertions and deletions (indels) which result from SpyCas9-induced dsDNA breaks repaired via non-homologous end joining. This allowed for the quantification of SpyCas9 editing efficiency following transient transfection of HEK293T cells. For each experiment, the dagger (†) indicates one of three biological replicates transfected and treated with T7E1 to generate the data in (B). (B) Quantification of indel frequencies at the CACNA1D locus. Asterisks depict statistically significant differences in indel frequency (Student’s t-Test, n = 3 biological replicates). (C) A representative gel image from a single T7E1 assay depicting SpyCas9 cleavage at the EMX1 locus; the dagger (†) indicates samples used to generate the data depicted in (D). (D) Indel frequencies at the EMX1 locus, as in (B). Double asterisks (**), p<0.001; Single asterisk (*), p<0.01; ns, not significant. All p-values were corrected for multiple hypotheses using Bonferroni’s method.
Figure 7—figure supplement 1
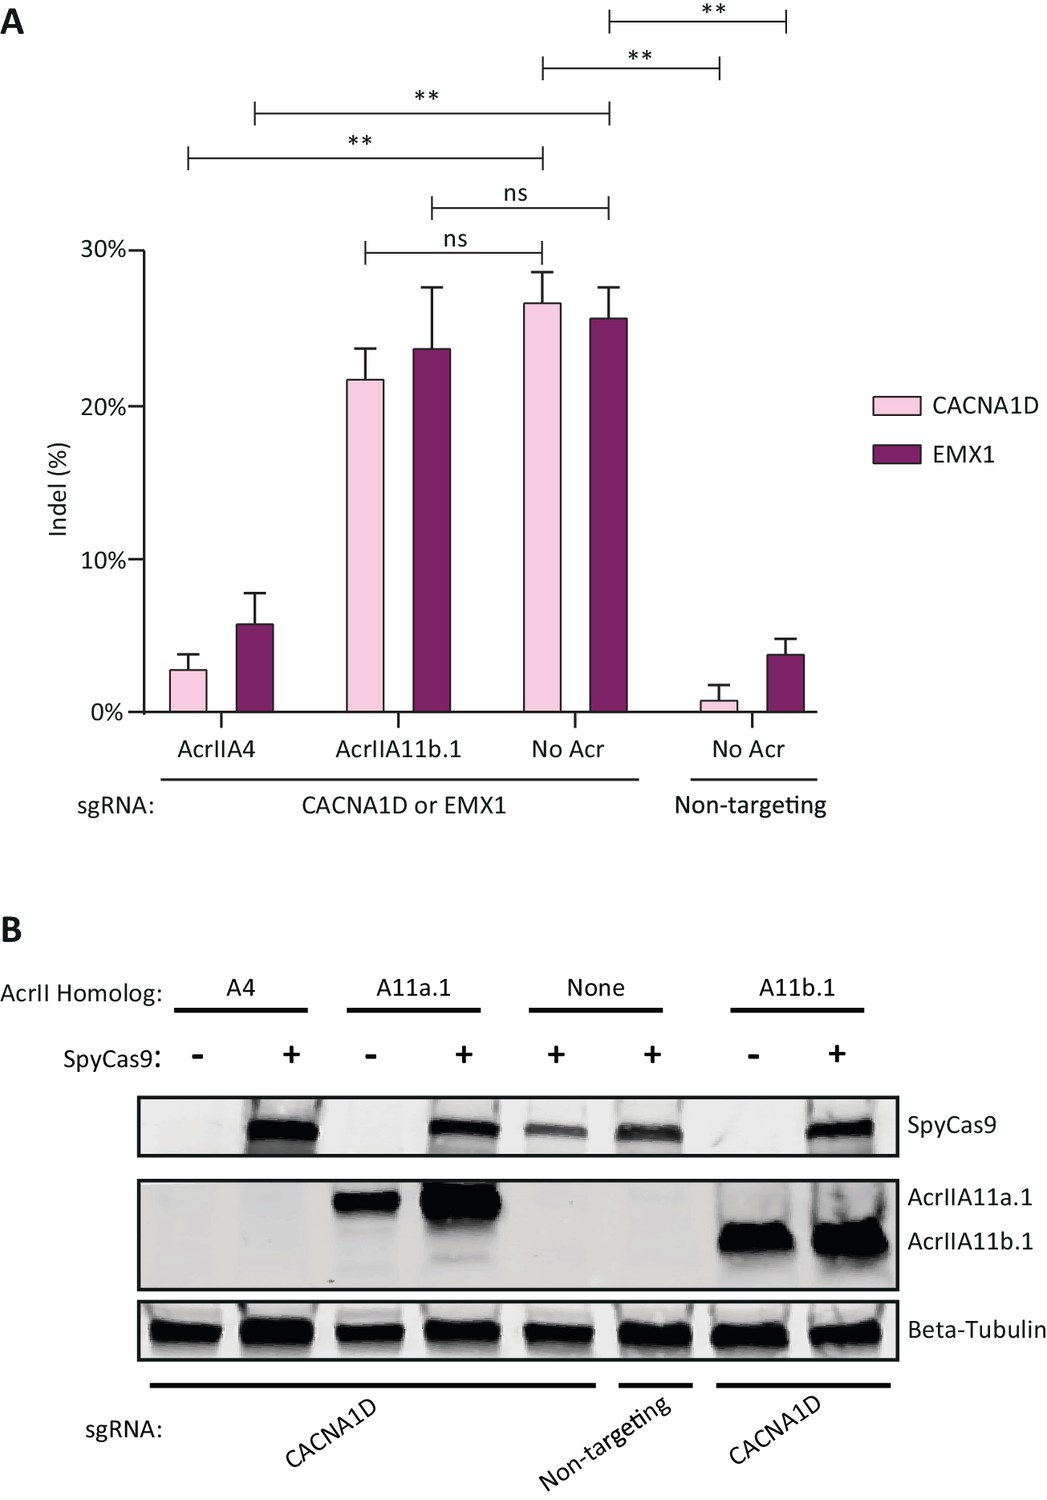
AcrIIA11b.1 does not inhibit SpyCas9 in human cells.
(A) Quantification of indel frequencies at the CACNA1D and EMX1 loci after transient plasmid transfection of human HEK293T cells. Asterisks depict statistically significant differences in indel frequency (Student’s t-Test, n = 3 biological replicates). Double asterisks (**), p<0.001; ns, not significant. All p-values were corrected for multiple hypotheses using Bonferroni’s method. (B) Western blot on transfected HEK293T cells shows that AcrIIA11a.1 and AcrIIA11b.1 express comparably well, independent of SpyCas9 co-transfection. Additionally, SpyCas9 is expressed to similar levels with all Acrs tested. AcrIIA4 was not HA-tagged, so no signal is seen for this Acr.
Additional files
-
Supplementary file 1
Supplementary tables S1 to S8.
- https://doi.org/10.7554/eLife.46540.024
-
Transparent reporting form
- https://doi.org/10.7554/eLife.46540.025
Download links
A two-part list of links to download the article, or parts of the article, in various formats.
Downloads (link to download the article as PDF)
Open citations (links to open the citations from this article in various online reference manager services)
Cite this article (links to download the citations from this article in formats compatible with various reference manager tools)
Functional metagenomics-guided discovery of potent Cas9 inhibitors in the human microbiome
eLife 8:e46540.
https://doi.org/10.7554/eLife.46540


