Human motor fatigability as evoked by repetitive movements results from a gradual breakdown of surround inhibition
- Neural Control of Movement Lab, Switzerland
- University of Zurich, Federal Institute of Technology Zurich, University and Balgrist Hospital Zurich, Switzerland
- Royal Holloway University of London, United Kingdom
Figures
Figure 1 with 1 supplement
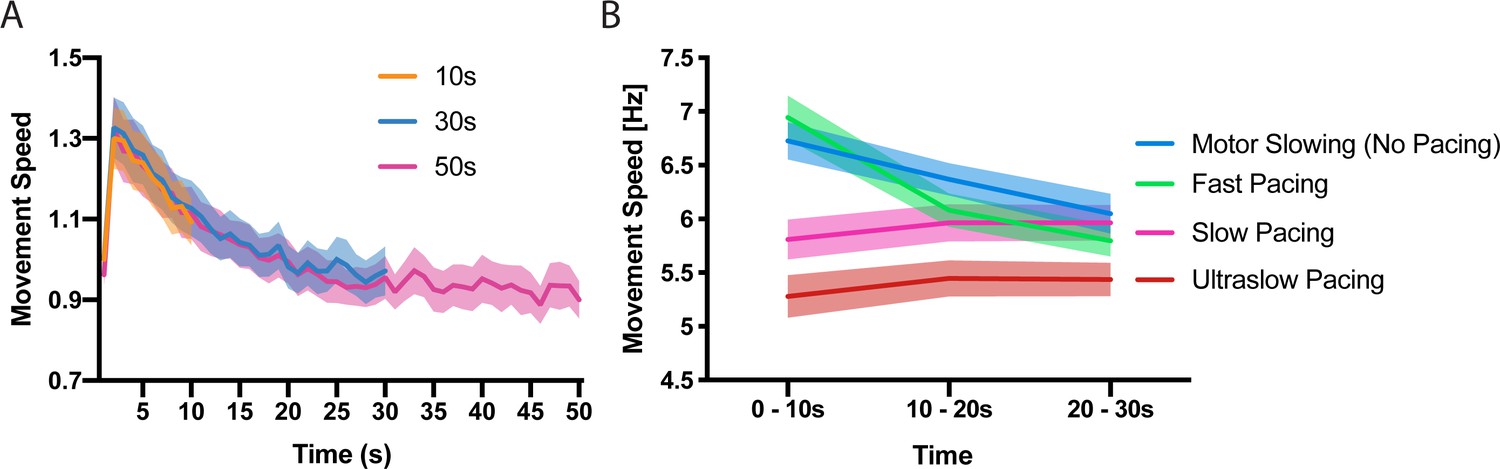
Time and speed dependency of motor slowing.
(A) Time course of motor slowing. Participants tapped at maximum speed for 10 s (orange), 30 s (blue) or 50 s (pink) at their maximum speed. Slowing starts immediately with movement onset and reaches a ‘plateau’ after about 30 s. All data normalised to first second of 10 s condition. (B) Motor slowing depends on initial movement speed. After performing motor slowing trials starting at maximum speed with no online feedback (Motor Slowing, that is no pacing, blue), participants were paced at their initial speed (Fast pacing, green), their end speed (slow pacing, pink) or 90% of their end speed (Ultraslow pacing, red). Note that participants adjust to the pacing speed during the first time bin (0–10 s) and typically underpace for the slow and ultraslow pacing conditions while they tend to overpace for the fast pacing condition (see also Figure 1—figure supplement 1 for an additional analysis on participants compliance with the pacing frequency and supplementary file 1 for individual participant data). All values mean ± sem.
Figure 1—figure supplement 1

Deviation from the target speed in the pacing experiment shown in Figure 1B.
During the first 10 s, participants slightly underpaced during the slow and ultraslow conditions whereas they overpaced during the fast condition. This error diminished for the two slower conditions reflecting that participants complied well with the target speed. However, for the fast pacing condition, deviation from the target speed increased over time reflecting gradual motor slowing. All values mean ± sem.
Figure 2
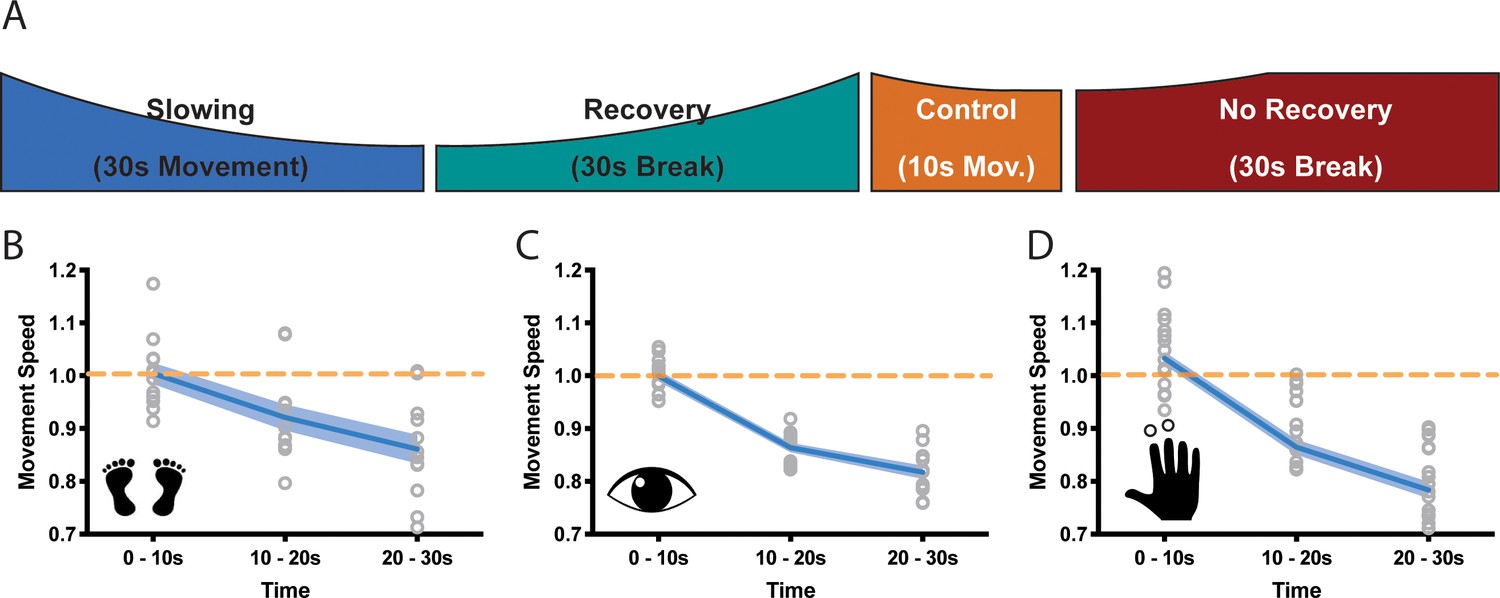
Motor slowing of different movement effectors.
(A) General behavioural paradigm. Participants were asked to either perform long (≥30 s) or short (10 s) blocks of repetitive movements, followed by breaks of at least 30 s. Movement speed was analysed in movement cycles per 10 s. (B–C) Motor Slowing (blue line) normalised to control condition (orange line) occurred independent of the involved effector and was present during foot tapping (B, N = 12), repetitive eye movements (C, N = 12) and repetitive finger movements (D, N = 17). Note that the data in (D) corresponds to the experiment depicted in Figure 3, where subjects had a break of at least 30 s. All data mean ± sem.
-
Figure 2—source data 1
Individual behavioural data (movement cycles per time bin) of the foot tapping experiment depicted in panel 2B.
All values normalised to control condition.
- https://doi.org/10.7554/eLife.46750.005
-
Figure 2—source data 2
Individual behavioural data (movement cycles per time bin) of the eye movement experiment depicted in panel 2C.
All values normalised to control condition.
- https://doi.org/10.7554/eLife.46750.006
-
Figure 2—source data 3
Individual behavioural data (movement cycles per time bin) of the finger tapping experiment depicted in panel 2D.
All values normalised to control condition.
- https://doi.org/10.7554/eLife.46750.007
Figure 3
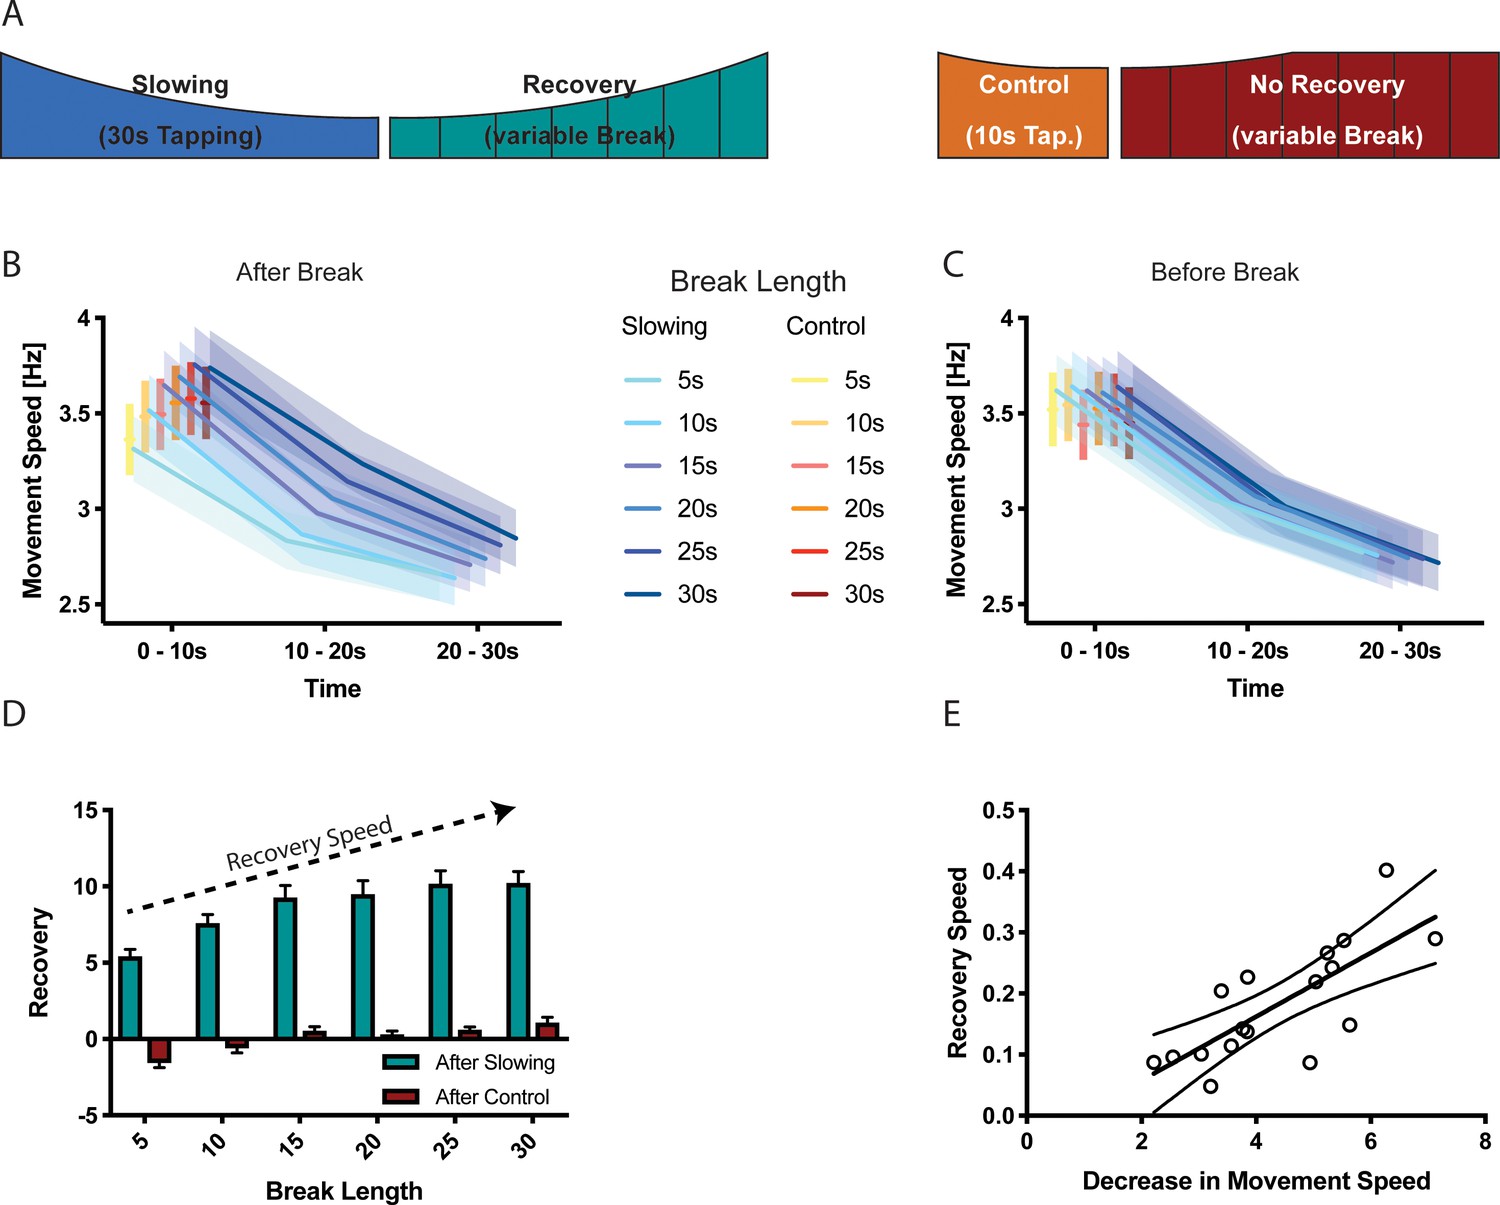
Results of the recovery experiment (N = 17).
(A) Experimental paradigm to characterise the recovery process after motor slowing. Participants were instructed to tap with two fingers for 30 s (slowing condition) or 10 s (control condition) followed by breaks of different duration (5–30 s). (B) Initial movement speed was lower when subjects had less time to recover. (C) No such pattern was observed before the break. (D) Calculating the recovery (i.e. comparing movement speed immediately before and after the break) shows that movement speed recovers within the first 20 s of the break. (E) The recovery speed was directly correlated with the decrease in movement speed across participants. All values mean ± sem.
-
Figure 3—source data 1
Individual behavioural data (movement cycles per time bin) after different break lengths depicted in panel 3B.
All values given in Hertz.
- https://doi.org/10.7554/eLife.46750.009
-
Figure 3—source data 2
Individual behavioural data (movement cycles per time bin) before different break lengths depicted in panel 3C.
All values given in Hertz.
- https://doi.org/10.7554/eLife.46750.010
-
Figure 3—source data 3
Individual data of recovery depicted in panel 3D.
- https://doi.org/10.7554/eLife.46750.011
Figure 4
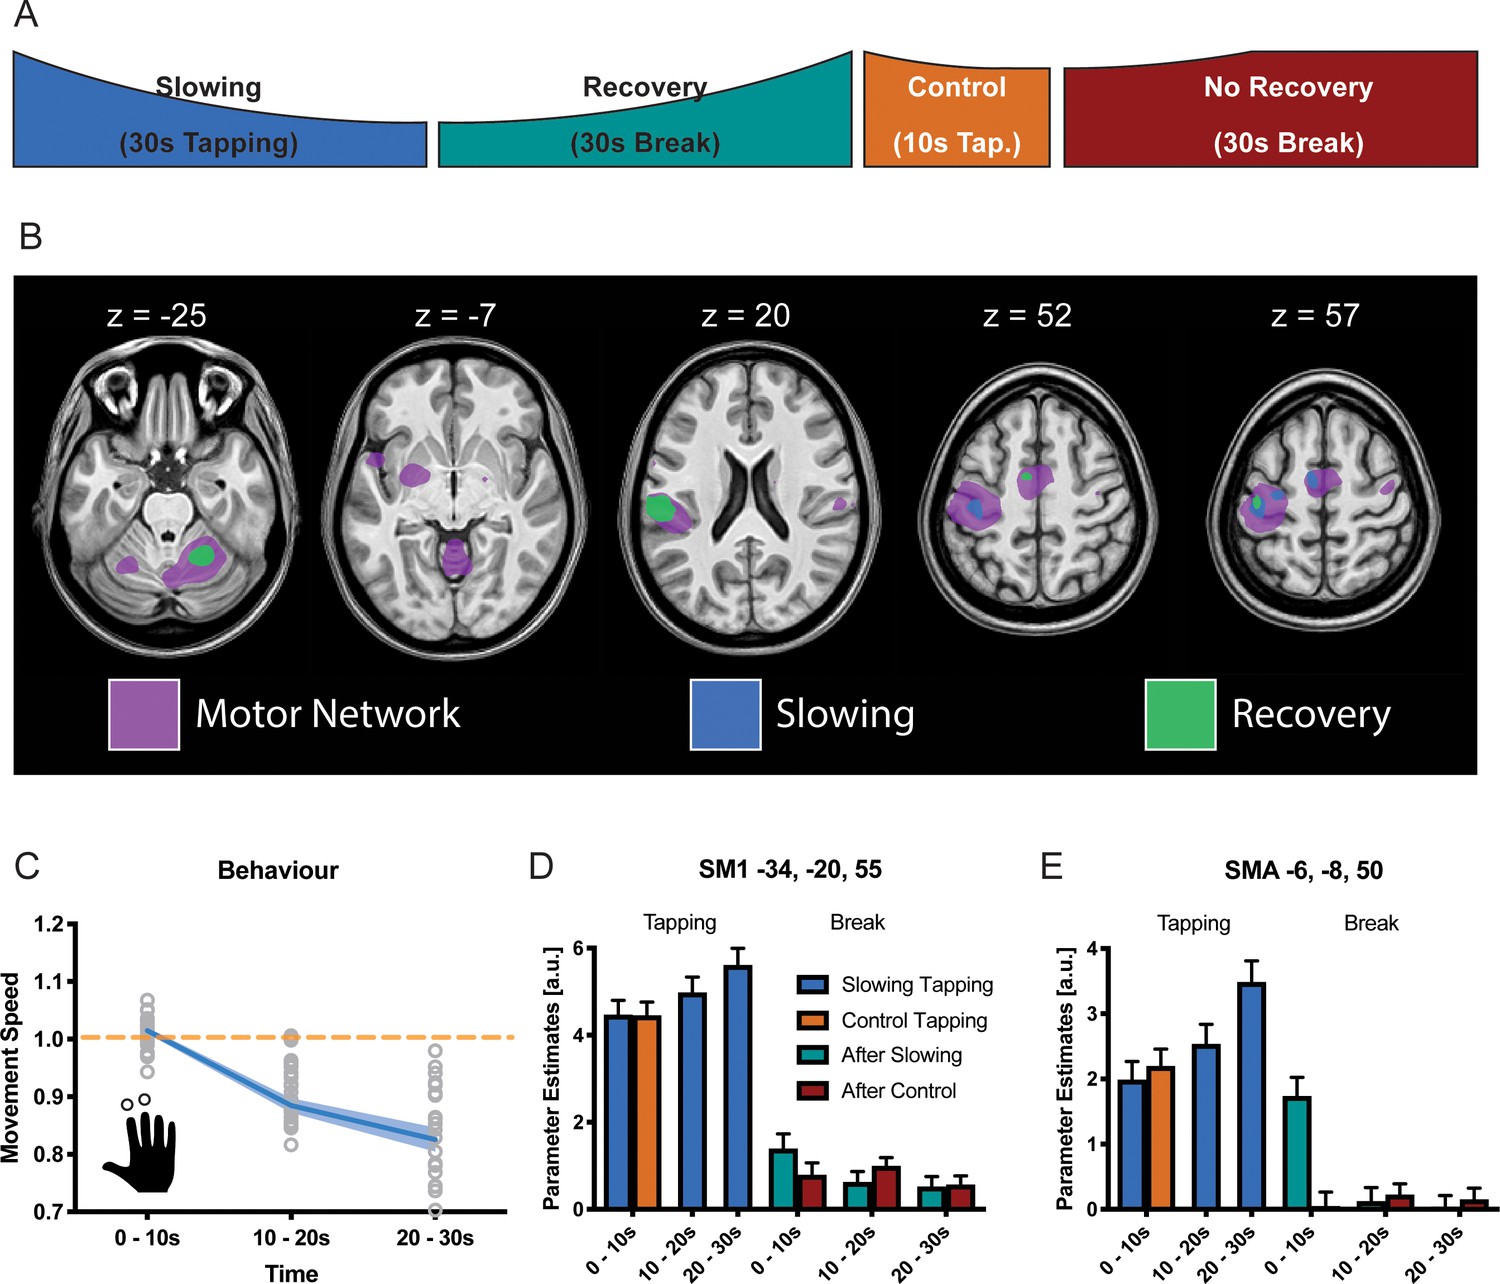
Results of the functional magnetic resonance (fMRI) experiment (N = 25).
(A) Participants performed slowing (30 s) or control (10 s) two-finger tapping followed by a break of 30 s in the fMRI scanner. (B) A typical motor network was activated during tapping (pink, pFWE <0.05), however, only areas in primary sensorimotor cortex, premotor cortex and supplementary motor area (SMA) showed increased activity with decreased tapping speed (blue, pFWE <0.05). Additionally, cerebellum and secondary somatosensory cortex show decreasing activation during recovery (green, pFWE <0.05) (C) Motor Slowing during the behavioural task (blue line) normalised to control condition (orange line). (D,E) Parameter estimates from primary sensorimotor cortex and SMA show increased activity within those areas with decreasing movement speed and subsequent recovery of this effect during the break. All values mean ± sem.
-
Figure 4—source data 1
Individual behavioural data (movement cycles per time bin) of the fMRI experiment depicted in panel 4C.
All values normalised to control condition.
- https://doi.org/10.7554/eLife.46750.014
-
Figure 4—source data 2
T-map of fMRI activation (motor network) depicted in panel 4B.
- https://doi.org/10.7554/eLife.46750.015
-
Figure 4—source data 3
T-map of fMRI activation (slowing) depicted in panel 4B.
- https://doi.org/10.7554/eLife.46750.016
-
Figure 4—source data 4
T-map of fMRI activation (recovery) depicted in panel 4B.
- https://doi.org/10.7554/eLife.46750.017
Figure 5
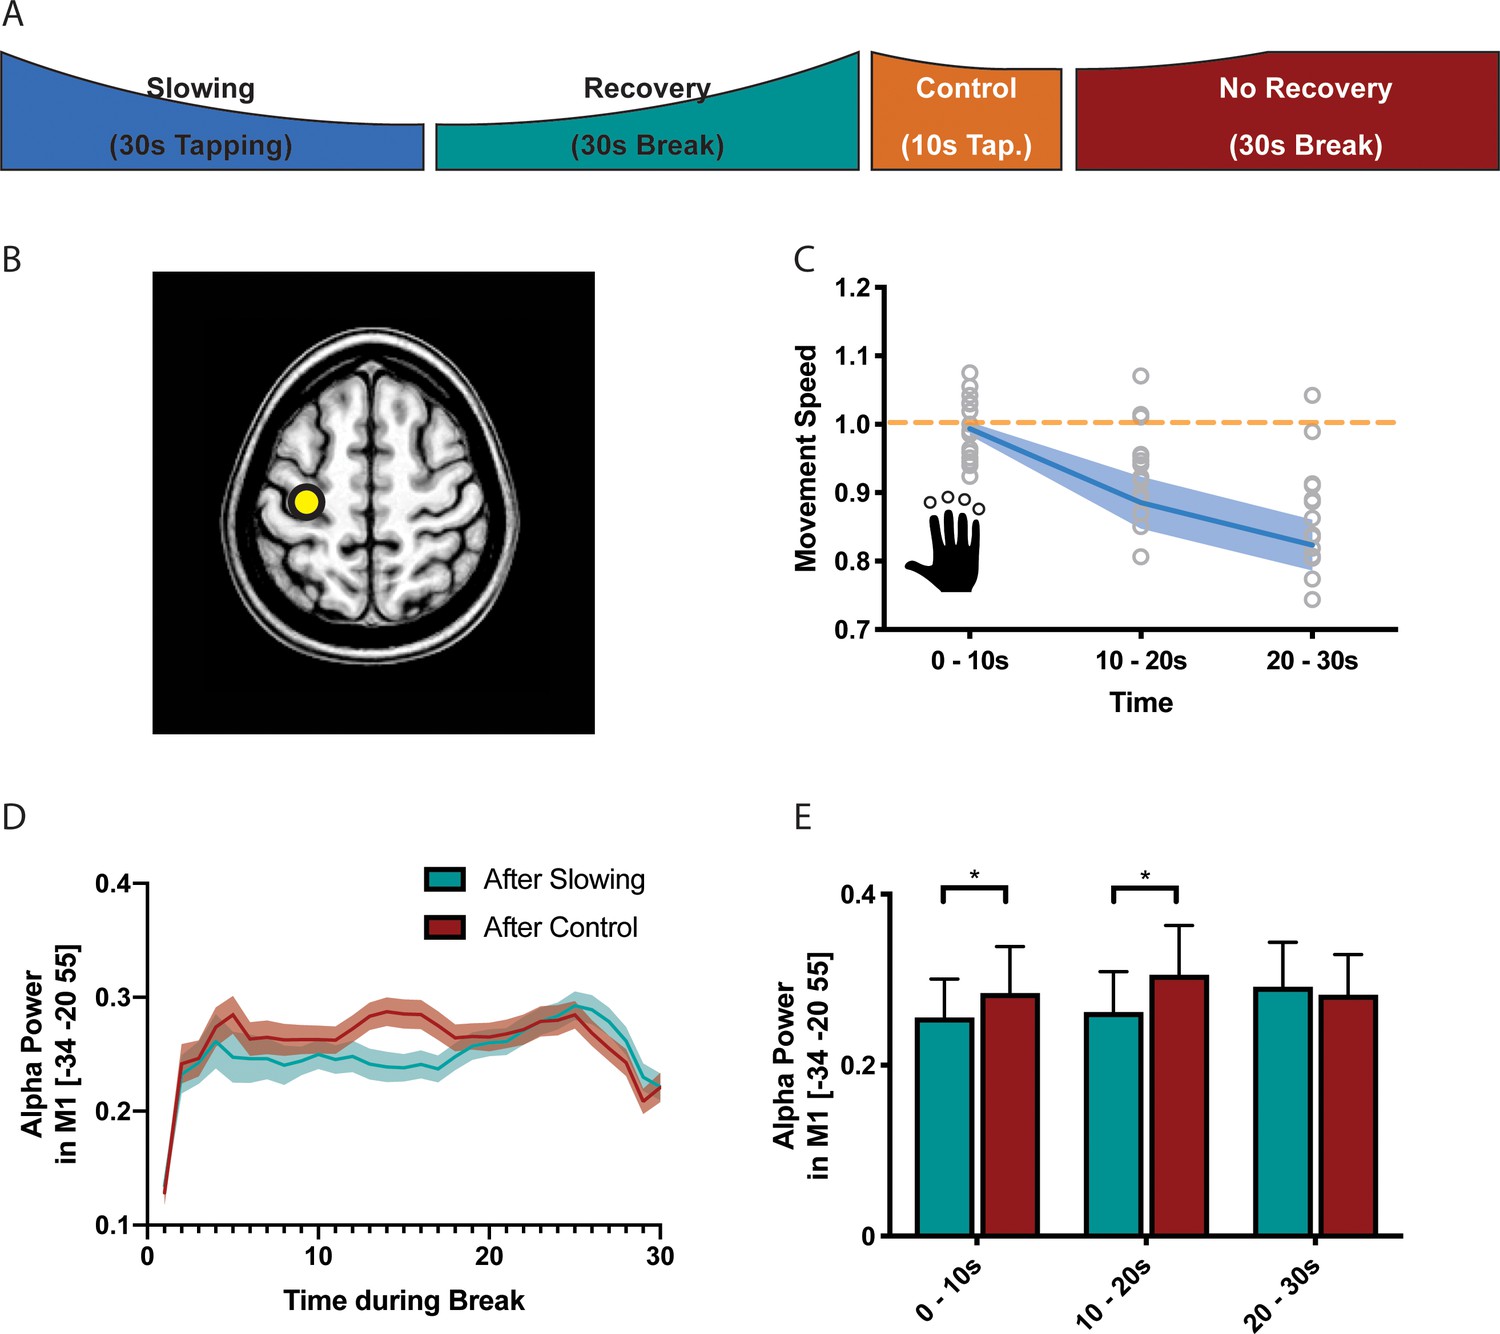
Results of the electroencephalography (EEG) experiment (N = 17).
(A) Participants performed slowing (30 s) or control (10 s) sequence tapping followed by a break of 30 s while EEG was measured. (B) Source localisation was performed using eLoreta and fluctuations of alpha power extracted from primary sensorimotor cortex (SM1). (C) Motor slowing during the behavioural task (blue line) normalised to control condition (orange line). (D) Power over time during breaks after tapping (green = break after slowing tapping, red = break after control tapping, dotted lines = sem.). (E) Same as (D), binned in 10 s blocks for statistical analysis. All values mean ± sem. *p<0.05.
-
Figure 5—source data 1
Individual behavioural data (movement cycles per time bin) of the EEG experiment depicted in panel 5C.
All values normalised to control condition.
- https://doi.org/10.7554/eLife.46750.019
-
Figure 5—source data 2
Individual alpha power data depicted in panel 5E.
- https://doi.org/10.7554/eLife.46750.020
Figure 6
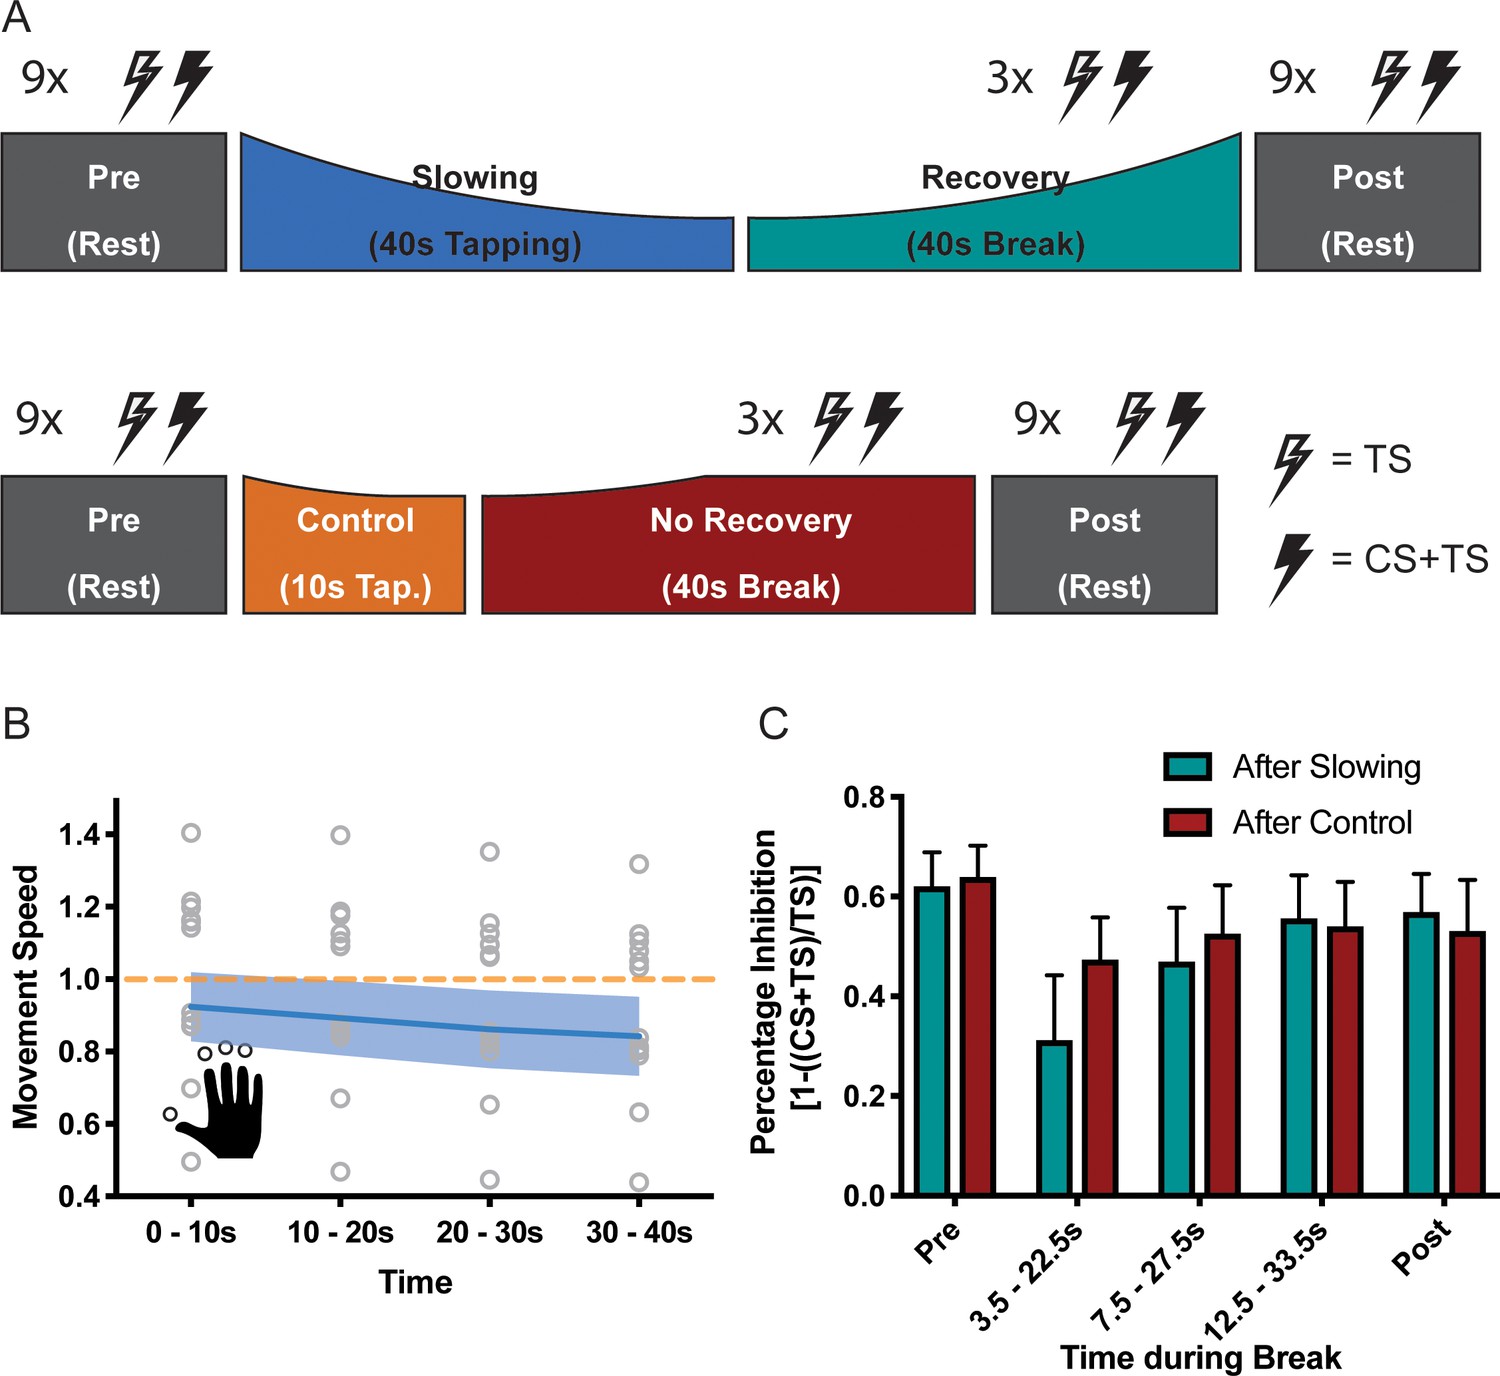
Results of the short latency intracortical inhibition (SICI) experiment (N = 13).
(A) SICI was measured before (Pre) and after (Post), as well as during the break after either slowing (40 s) or control (10 s) tapping. (B) Motor slowing during the behavioural task (blue line) normalised to control condition (orange line). Note that in this experiment the two conditions were tested on two different days, therefore, there was a difference in initial speed across sessions. (C) Percentage Inhibition of primary motor cortex before (Pre), for the first (0–10 s), second (10–20 s) and third (20–30 s) conditioning stimulus during the break, and at the end of the session (Post) where participants executed either the slowing (green) or control (red) tapping condition. It can be seen that slowing leads to disinhibition of primary motor cortex immediately after tapping. All values mean ± sem.
-
Figure 6—source data 1
Individual behavioural data (movement cycles per time bin) of the SICI experiment depicted in panel 6B.
All values normalised to control condition.
- https://doi.org/10.7554/eLife.46750.022
-
Figure 6—source data 2
Individual SICI data depicted in panel 6C.
- https://doi.org/10.7554/eLife.46750.023
Figure 7 with 1 supplement
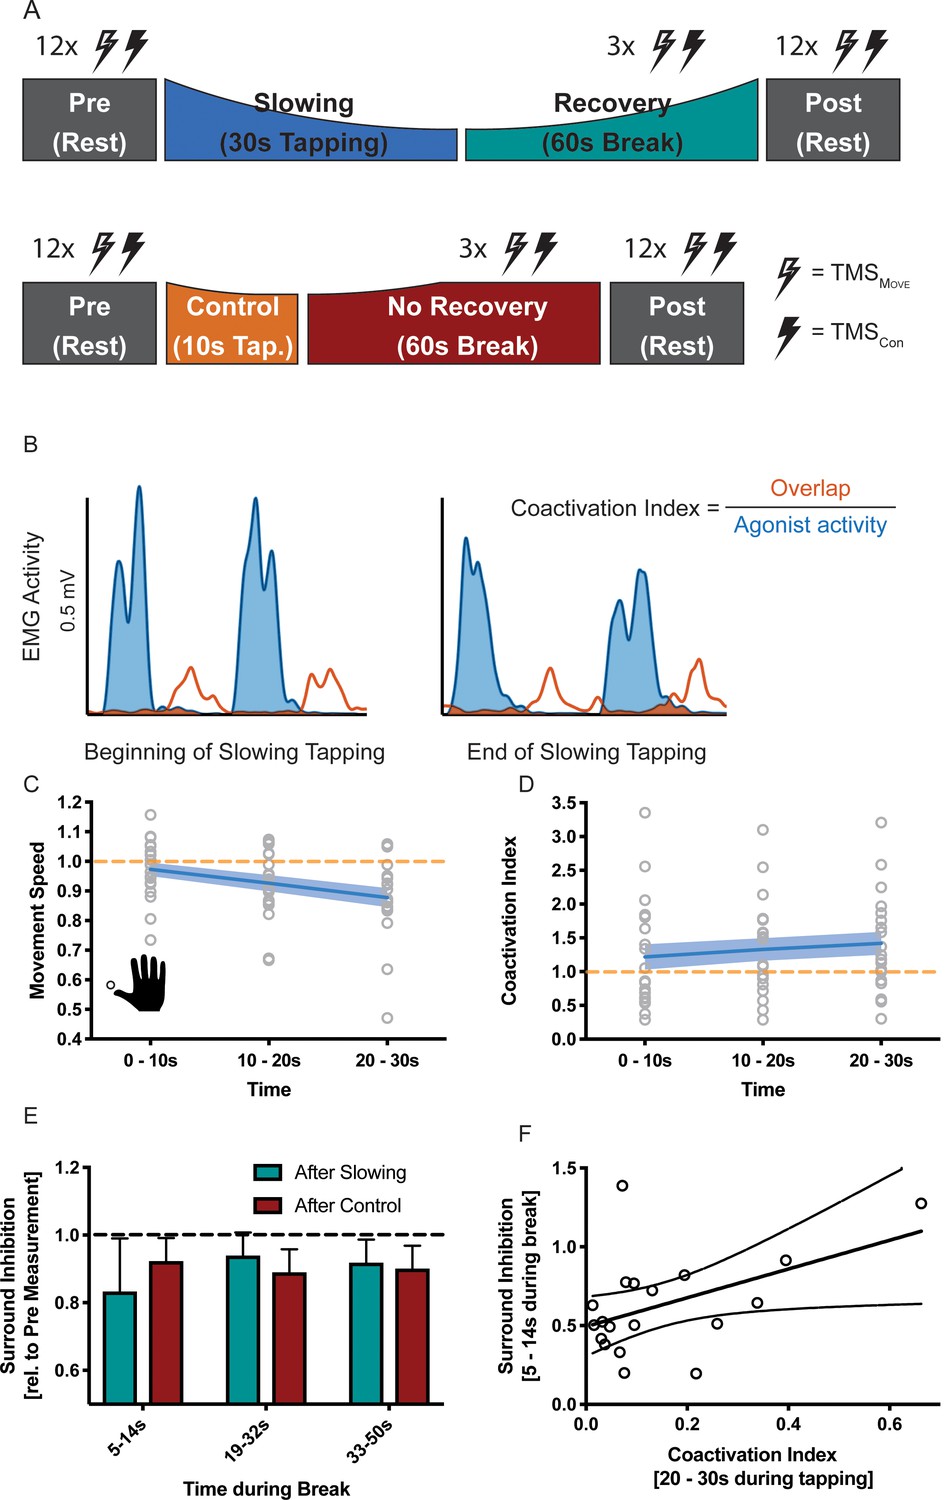
Results of the surround inhibition experiment (N = 19).
(A) Surround inhibition was measured before (Pre) and after (Post), as well as during the break after either slowing (30 s) or control (10 s) tapping. The length of the break was increased to 60 s to have enough time for the measurements. (B) The amount of coactivation between agonistic and antagonistic muscles was calculated by dividing the overlap between the smoothed and rectified EMG of the two muscles normalised to the area under the curve of the agonist. (C) Movement speed decrease in the surround inhibition experiment. Note that in this experiment the two conditions were tested on two different days, therefore, there was a difference in initial speed across sessions. (D) Increase in coactivation index between APB and EPL over the course of motor slowing. (E) Difference in surround inhibition normalised to Pre-measurements. Surround inhibition is decreased immediately after motor slowing and returns to baseline over the course of the break. (F) The amount of coactivation immediately before the break predicted the amount of surround inhibition at the beginning of the break (R2 = 0.23, p=0.039). Note that surround inhibition in panel (F) is the absolute amount of surround inhibition, whereas it is normalised to the Pre measurement in panel (E). All values mean ± sem.
-
Figure 7—source data 1
Individual behavioural data (movement cycles per time bin) of the surround inhibition experiment depicted in panel 7C.
All values normalised to control condition.
- https://doi.org/10.7554/eLife.46750.026
-
Figure 7—source data 2
Individual coactivation data of the surround inhibition experiment depicted in panel 7D.
- https://doi.org/10.7554/eLife.46750.027
-
Figure 7—source data 3
Individual surround inhibition data depicted in panel 7E.
- https://doi.org/10.7554/eLife.46750.028
Figure 7—figure supplement 1
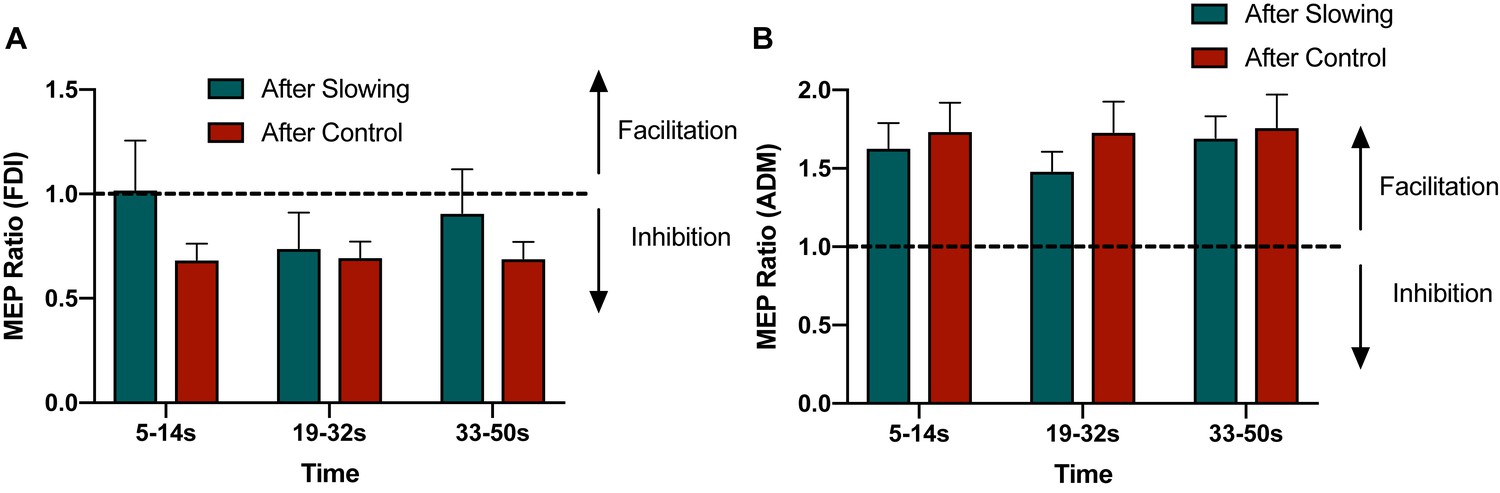
Raw MEP Ratios from the surround inhibition experiment for FDI (A) and ADM (B).
Only the FDI muscle showed a condition specific effect for surround inhibition. ADM showed a general facilitation effect independent of tapping condition.
Figure 8
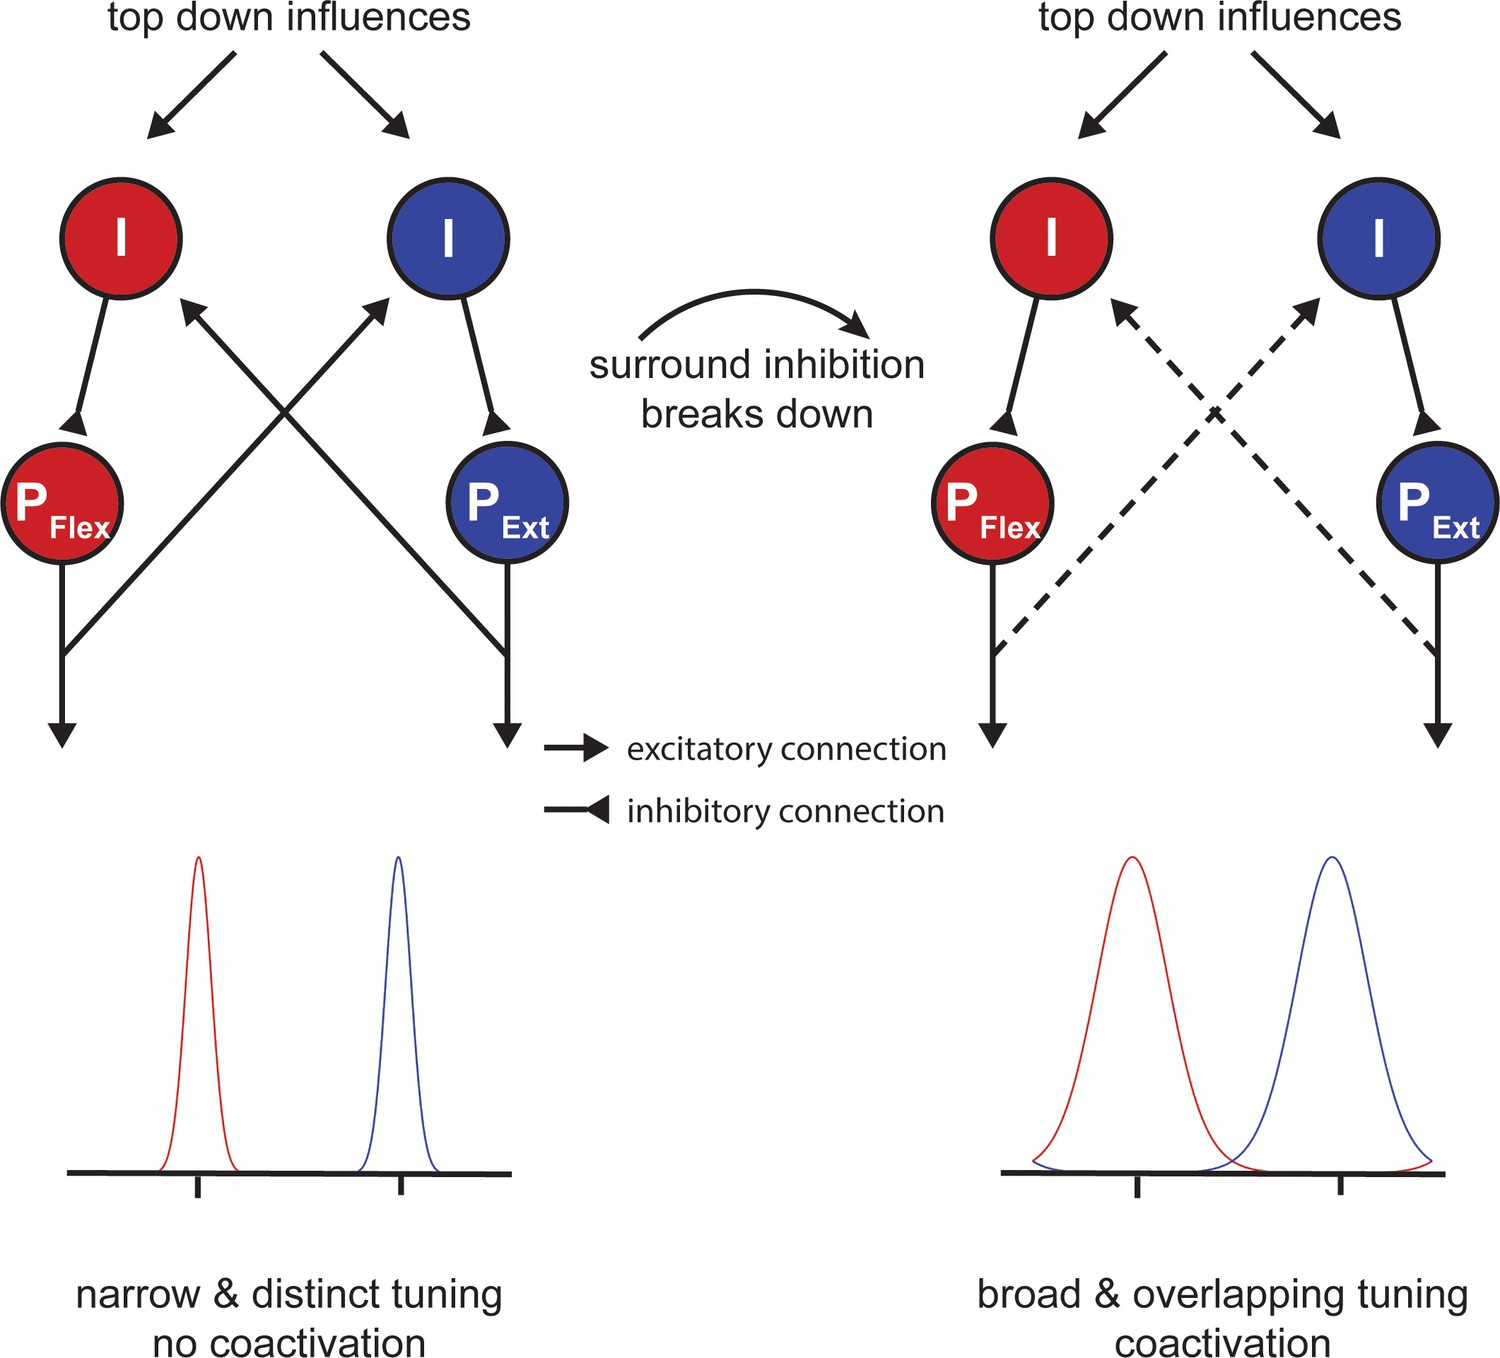
Potential mechanism of motor slowing.
Two populations of pyramidal neurons (P) control agonistic (PFlex) and antagonistic (PExt) movements. The tuning curve of those neurons is under control of inhibitory interneurons (I). At the beginning of tapping inhibition is strong leading to sharp tuning curves and consequently distinct movement activation patterns. Over the course of tapping inhibition breaks down and consequently the tuning curves become broader leading to overlapping activation patterns (i.e. coactivation). Note that the breakdown of inhibition here is shown as a direct input, however, inhibition could also break down due to a reduction of afferent excitatory input to the inhibitory interneurons.
Tables
Table 1
Comparison of movement speed (measured in movement cycles per 10 s) during the first 10 s of the first and last trials for different effectors, as well as movement speed within a 30 s trial (first vs. last 10 s).
The results show that movement speed at the beginning of each trial is stable, whereas movement speed decreased significantly within a trial. All values mean ± sem.
| Speed during first 10s | Speed within 30s | N Subjects | N Trials | |||
|---|---|---|---|---|---|---|
| First Trial | Last Trial | First 10s | Last 10s | |||
| 2-finger tapping | 39.48±1.61 | 37.00±1.24 | 37.89±1.12 | 31.82±1.04 | 25 | 16 |
| Foot tapping | 50.00±4.16 | 53.67±4.20 | 55.167±3.25 | 47.233±2.89 | 12 | 20 |
| Eye Movement | 14.33±0.83 | 16.83±0.95 | 15.817±0.77 | 12.933±0.67 | 12 | 20 |
-
mean ± standard error of the mean, all values Movement Cycles per 10s.
Additional files
-
Supplementary file 1
Table showing individual movement speeds for each condition of experiment 2, including the different target speeds of each participant.
- https://doi.org/10.7554/eLife.46750.030
-
Supplementary file 2
Table showing peak fMRI activations during tapping.
- https://doi.org/10.7554/eLife.46750.031
-
Supplementary file 3
Table showing rest motor threshold, conditioning stimulus and test stimulus intensities of SICI measures as % maximum stimulator output (%MSO), showing that stimulus intensities were comparable across sessions (all values mean ± standard deviation).
- https://doi.org/10.7554/eLife.46750.032
-
Supplementary file 4
Table showing background EMG (mV) of SICI measures during the break.
Note that background EMG was very small and that potential differences were <0.001 mV and well below the observed standard deviation. Statistical tests revealed only non-significant effects of condition (F(1,12)=0.696, p=0.42), or time (F(2,12)=3.137, p=0.08). Most importantly, there was no significant condition x time (F(2,12) = 0.203, p=0.819) interaction for background EMG. All values mean ± std.
- https://doi.org/10.7554/eLife.46750.033
-
Supplementary file 5
Table showing average motor evoked potentials of the control stimulus in mV for Pre and Post measurements, as well as during the break after 30 s and 10 s tapping showing that the control stimulus did not change during the surround inhibition experiment.
Further, the rest motor threshold (RMT, in percentage of maximum stimulator output) was comparable across both sessions.
- https://doi.org/10.7554/eLife.46750.034
-
Supplementary file 6
Table showing background EMG of surround inhibition measures during the break.
Note that background EMG was very small and that potential differences were <0.002 mV and well below the observed standard deviation. Statistical tests revealed only non-significant effects of condition (F(1,18)=1.728, p=0.205) or time (F(2,18)=0.701, p=0.509). Most importantly, there was no significant condition x time (F(2,18) = 0.735, p=0.493) interaction for background EMG. All values mean ± std.
- https://doi.org/10.7554/eLife.46750.035
-
Supplementary file 7
Data from previous studies used for sample size calculations as described in the transparent reporting form.
- https://doi.org/10.7554/eLife.46750.036
-
Supplementary file 8
Summary table of the statistical tests performed in each experiment as described in the transparent reporting form.
- https://doi.org/10.7554/eLife.46750.037
-
Transparent reporting form
- https://doi.org/10.7554/eLife.46750.038
Download links
A two-part list of links to download the article, or parts of the article, in various formats.
Downloads (link to download the article as PDF)
Open citations (links to open the citations from this article in various online reference manager services)
Cite this article (links to download the citations from this article in formats compatible with various reference manager tools)
Human motor fatigability as evoked by repetitive movements results from a gradual breakdown of surround inhibition
eLife 8:e46750.
https://doi.org/10.7554/eLife.46750


